Upper Kalskag, AK Map & Demographics
Upper Kalskag Map

Upper Kalskag Overview
$14,617
PER CAPITA INCOME
$42,188
AVG FAMILY INCOME
$43,750
AVG HOUSEHOLD INCOME
28.9%
WAGE / INCOME GAP [ % ]
71.1¢/ $1
WAGE / INCOME GAP [ $ ]
0.40
INEQUALITY / GINI INDEX
253
TOTAL POPULATION
137
MALE POPULATION
116
FEMALE POPULATION
118.10
MALES / 100 FEMALES
84.67
FEMALES / 100 MALES
18.9
MEDIAN AGE
4.6
AVG FAMILY SIZE
4.1
AVG HOUSEHOLD SIZE
95
LABOR FORCE [ PEOPLE ]
67.4%
PERCENT IN LABOR FORCE
26.3%
UNEMPLOYMENT RATE
Income in Upper Kalskag
Income Overview in Upper Kalskag
Per Capita Income in Upper Kalskag is $14,617, while median incomes of families and households are $42,188 and $43,750 respectively.
| Characteristic | Number | Measure |
| Per Capita Income | 253 | $14,617 |
| Median Family Income | 46 | $42,188 |
| Mean Family Income | 46 | $61,285 |
| Median Household Income | 62 | $43,750 |
| Mean Household Income | 62 | $59,856 |
| Income Deficit | 46 | $0 |
| Wage / Income Gap (%) | 253 | 28.89% |
| Wage / Income Gap ($) | 253 | 71.11¢ per $1 |
| Gini / Inequality Index | 253 | 0.40 |
Earnings by Sex in Upper Kalskag
Average Earnings in Upper Kalskag are $24,792, $23,333 for men and $32,813 for women, a difference of 28.9%.
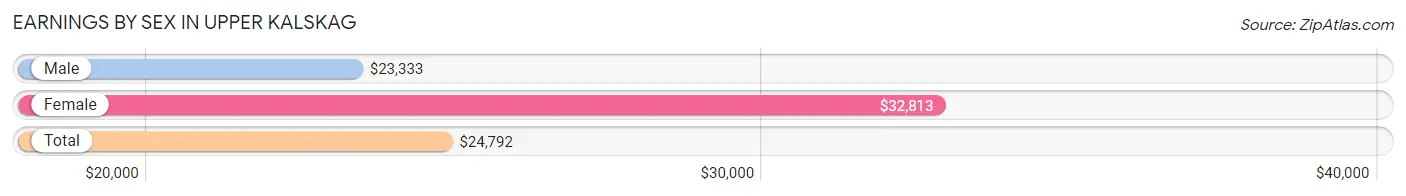
| Sex | Number | Average Earnings |
| Male | 58 (57.4%) | $23,333 |
| Female | 43 (42.6%) | $32,813 |
| Total | 101 (100.0%) | $24,792 |
Earnings by Sex by Income Bracket in Upper Kalskag
The most common earnings brackets in Upper Kalskag are $10,000 to $12,499 for men (6 | 10.3%) and $2,499 or less for women (6 | 14.0%).
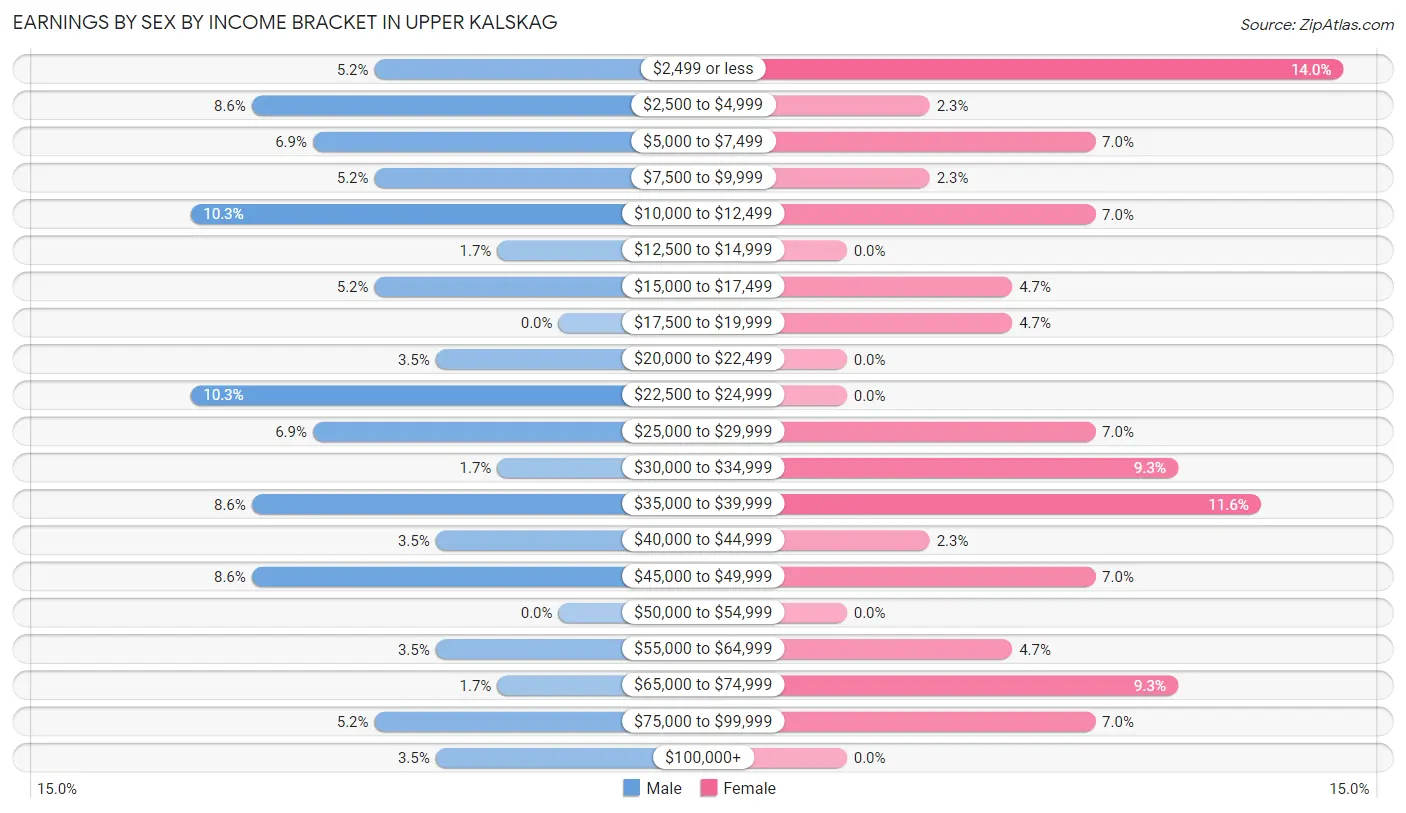
| Income | Male | Female |
| $2,499 or less | 3 (5.2%) | 6 (14.0%) |
| $2,500 to $4,999 | 5 (8.6%) | 1 (2.3%) |
| $5,000 to $7,499 | 4 (6.9%) | 3 (7.0%) |
| $7,500 to $9,999 | 3 (5.2%) | 1 (2.3%) |
| $10,000 to $12,499 | 6 (10.3%) | 3 (7.0%) |
| $12,500 to $14,999 | 1 (1.7%) | 0 (0.0%) |
| $15,000 to $17,499 | 3 (5.2%) | 2 (4.6%) |
| $17,500 to $19,999 | 0 (0.0%) | 2 (4.6%) |
| $20,000 to $22,499 | 2 (3.5%) | 0 (0.0%) |
| $22,500 to $24,999 | 6 (10.3%) | 0 (0.0%) |
| $25,000 to $29,999 | 4 (6.9%) | 3 (7.0%) |
| $30,000 to $34,999 | 1 (1.7%) | 4 (9.3%) |
| $35,000 to $39,999 | 5 (8.6%) | 5 (11.6%) |
| $40,000 to $44,999 | 2 (3.5%) | 1 (2.3%) |
| $45,000 to $49,999 | 5 (8.6%) | 3 (7.0%) |
| $50,000 to $54,999 | 0 (0.0%) | 0 (0.0%) |
| $55,000 to $64,999 | 2 (3.5%) | 2 (4.6%) |
| $65,000 to $74,999 | 1 (1.7%) | 4 (9.3%) |
| $75,000 to $99,999 | 3 (5.2%) | 3 (7.0%) |
| $100,000+ | 2 (3.5%) | 0 (0.0%) |
| Total | 58 (100.0%) | 43 (100.0%) |
Earnings by Sex by Educational Attainment in Upper Kalskag
Average earnings in Upper Kalskag are $27,500 for men and $36,500 for women, a difference of 24.7%. Men with an educational attainment of high school diploma enjoy the highest average annual earnings of $36,750, while those with college or associate's degree education earn the least with $21,875. Women with an educational attainment of college or associate's degree earn the most with the average annual earnings of $48,750, while those with high school diploma education have the smallest earnings of $35,750.
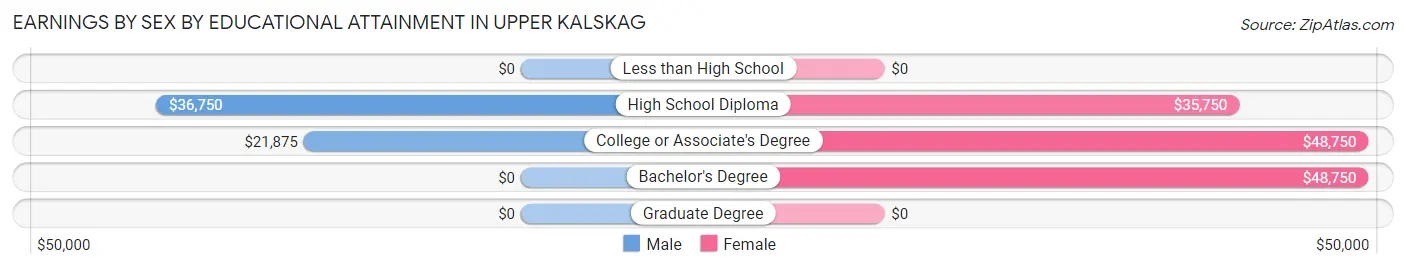
| Educational Attainment | Male Income | Female Income |
| Less than High School | - | - |
| High School Diploma | $36,750 | $35,750 |
| College or Associate's Degree | $21,875 | $48,750 |
| Bachelor's Degree | - | - |
| Graduate Degree | - | - |
| Total | $27,500 | $36,500 |
Family Income in Upper Kalskag
Family Income Brackets in Upper Kalskag
According to the Upper Kalskag family income data, there are 14 families falling into the $35,000 to $49,999 income range, which is the most common income bracket and makes up 30.4% of all families.
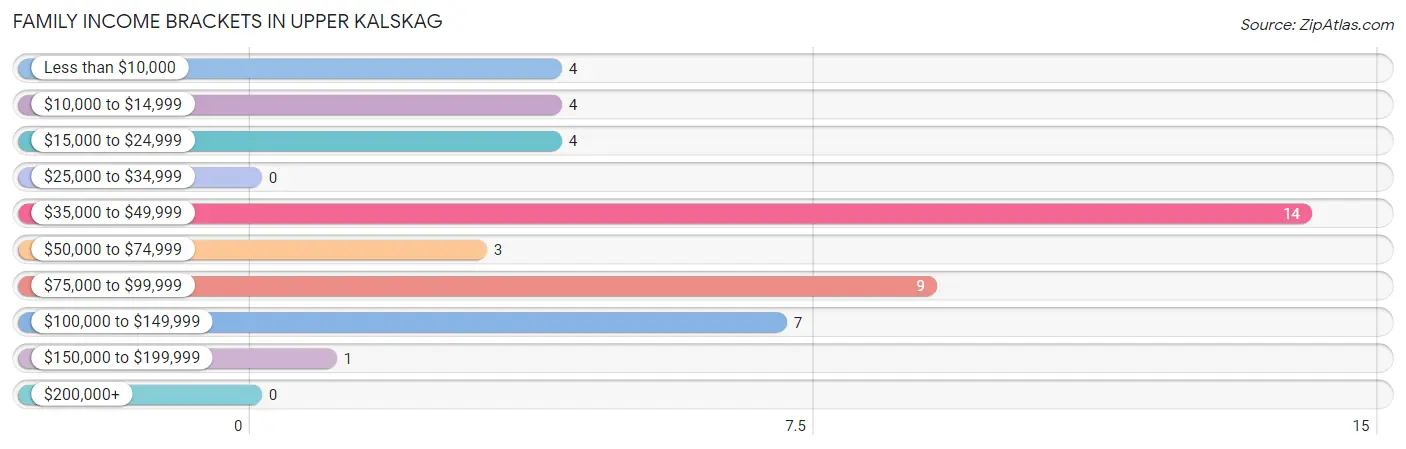
| Income Bracket | # Families | % Families |
| Less than $10,000 | 4 | 8.7% |
| $10,000 to $14,999 | 4 | 8.7% |
| $15,000 to $24,999 | 4 | 8.7% |
| $25,000 to $34,999 | 0 | 0.0% |
| $35,000 to $49,999 | 14 | 30.4% |
| $50,000 to $74,999 | 3 | 6.5% |
| $75,000 to $99,999 | 9 | 19.6% |
| $100,000 to $149,999 | 7 | 15.2% |
| $150,000 to $199,999 | 1 | 2.2% |
| $200,000+ | 0 | 0.0% |
Family Income by Famaliy Size in Upper Kalskag
5-person families (5 | 10.9%) account for the highest median family income in Upper Kalskag with $128,750 per family, while 5-person families (5 | 10.9%) have the highest median income of $25,750 per family member.
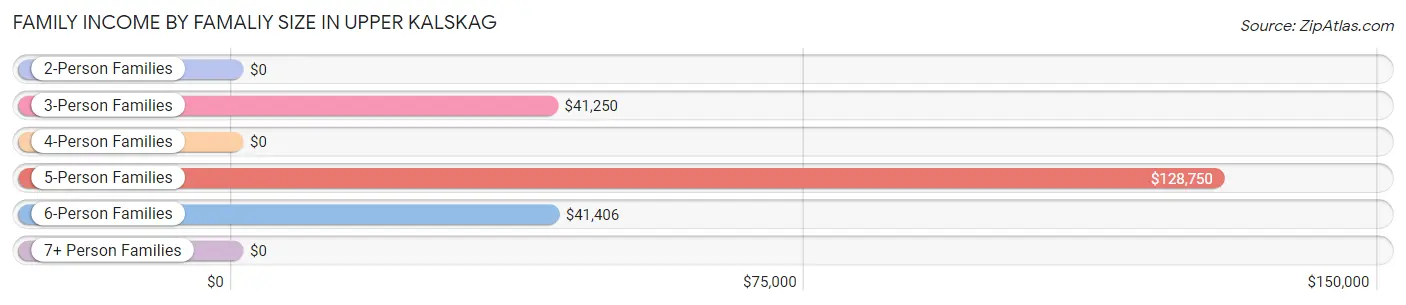
| Income Bracket | # Families | Median Income |
| 2-Person Families | 10 (21.7%) | $0 |
| 3-Person Families | 12 (26.1%) | $41,250 |
| 4-Person Families | 4 (8.7%) | $0 |
| 5-Person Families | 5 (10.9%) | $128,750 |
| 6-Person Families | 11 (23.9%) | $41,406 |
| 7+ Person Families | 4 (8.7%) | $0 |
| Total | 46 (100.0%) | $42,188 |
Family Income by Number of Earners in Upper Kalskag
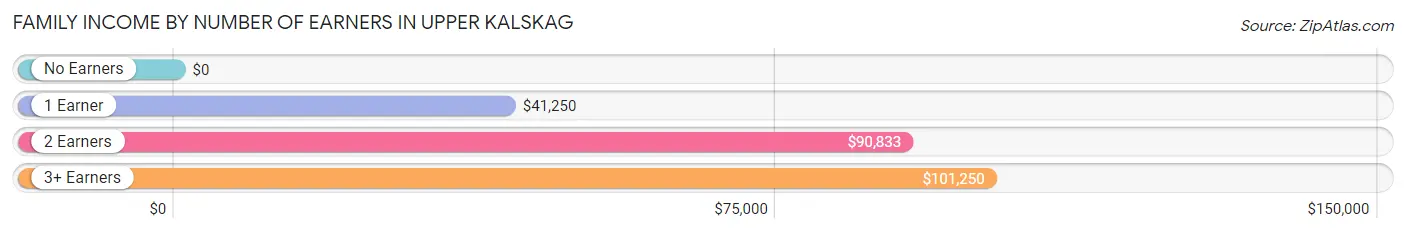
| Number of Earners | # Families | Median Income |
| No Earners | 4 (8.7%) | $0 |
| 1 Earner | 22 (47.8%) | $41,250 |
| 2 Earners | 12 (26.1%) | $90,833 |
| 3+ Earners | 8 (17.4%) | $101,250 |
| Total | 46 (100.0%) | $42,188 |
Household Income in Upper Kalskag
Household Income Brackets in Upper Kalskag
With 19 households falling in the category, the $35,000 to $49,999 income range is the most frequent in Upper Kalskag, accounting for 30.6% of all households.
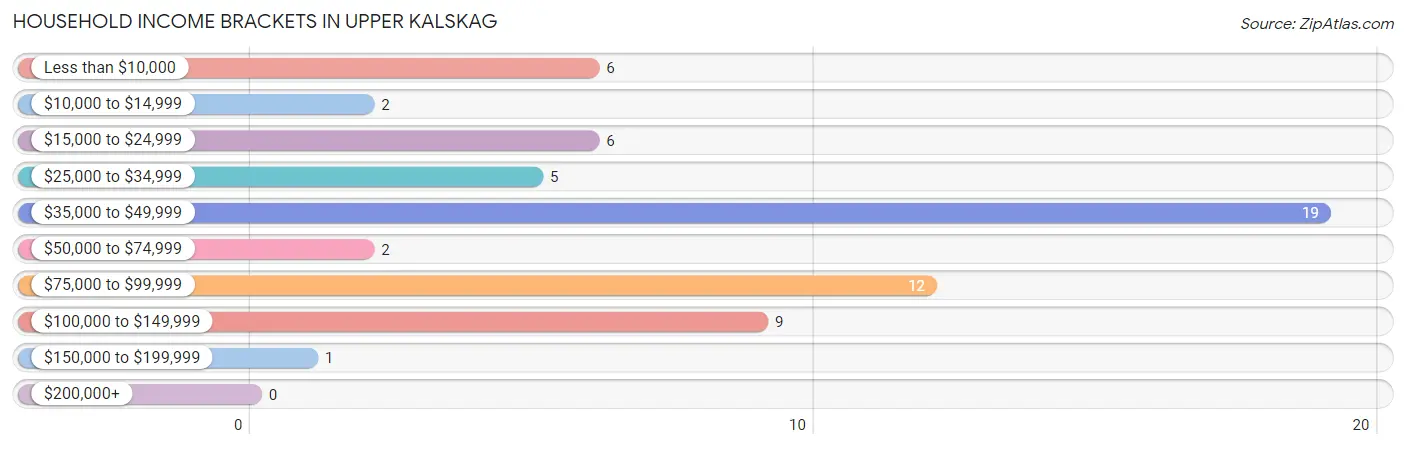
| Income Bracket | # Households | % Households |
| Less than $10,000 | 6 | 9.7% |
| $10,000 to $14,999 | 2 | 3.2% |
| $15,000 to $24,999 | 6 | 9.7% |
| $25,000 to $34,999 | 5 | 8.1% |
| $35,000 to $49,999 | 19 | 30.6% |
| $50,000 to $74,999 | 2 | 3.2% |
| $75,000 to $99,999 | 12 | 19.4% |
| $100,000 to $149,999 | 9 | 14.5% |
| $150,000 to $199,999 | 1 | 1.6% |
| $200,000+ | 0 | 0.0% |
Household Income by Householder Age in Upper Kalskag
The median household income in Upper Kalskag is $43,750, with the highest median household income of $45,250 found in the 45 to 64 years age bracket for the primary householder. A total of 25 households (40.3%) fall into this category. Meanwhile, the 15 to 24 years age bracket for the primary householder has the lowest median household income of $0, with 3 households (4.8%) in this group.
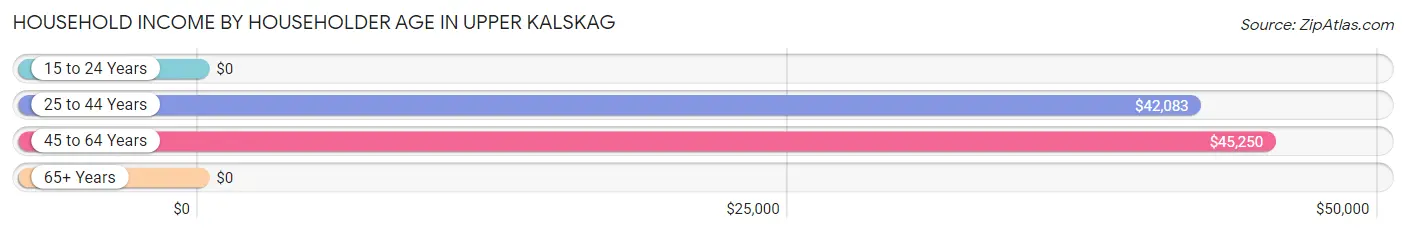
| Income Bracket | # Households | Median Income |
| 15 to 24 Years | 3 (4.8%) | $0 |
| 25 to 44 Years | 30 (48.4%) | $42,083 |
| 45 to 64 Years | 25 (40.3%) | $45,250 |
| 65+ Years | 4 (6.5%) | $0 |
| Total | 62 (100.0%) | $43,750 |
Poverty in Upper Kalskag
Income Below Poverty by Sex and Age in Upper Kalskag
With 23.5% poverty level for males and 24.8% for females among the residents of Upper Kalskag, 12 to 14 year old males and 25 to 34 year old females are the most vulnerable to poverty, with 6 males (42.9%) and 9 females (56.2%) in their respective age groups living below the poverty level.
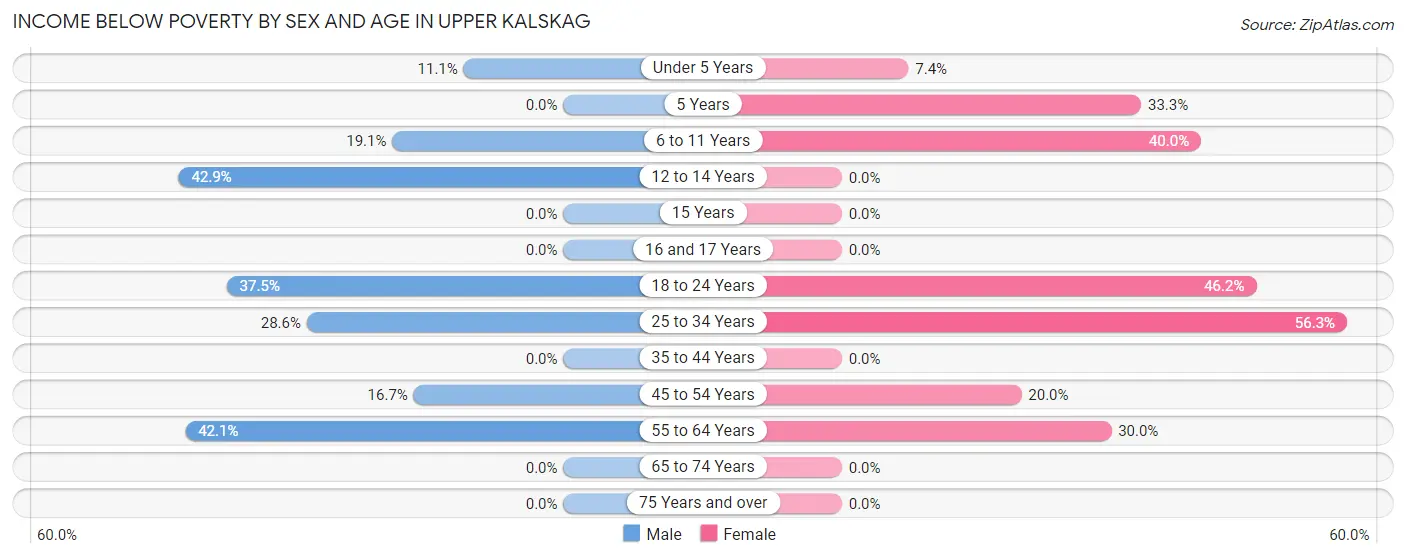
| Age Bracket | Male | Female |
| Under 5 Years | 1 (11.1%) | 2 (7.4%) |
| 5 Years | 0 (0.0%) | 1 (33.3%) |
| 6 to 11 Years | 4 (19.1%) | 6 (40.0%) |
| 12 to 14 Years | 6 (42.9%) | 0 (0.0%) |
| 15 Years | 0 (0.0%) | 0 (0.0%) |
| 16 and 17 Years | 0 (0.0%) | 0 (0.0%) |
| 18 to 24 Years | 6 (37.5%) | 6 (46.2%) |
| 25 to 34 Years | 4 (28.6%) | 9 (56.2%) |
| 35 to 44 Years | 0 (0.0%) | 0 (0.0%) |
| 45 to 54 Years | 2 (16.7%) | 1 (20.0%) |
| 55 to 64 Years | 8 (42.1%) | 3 (30.0%) |
| 65 to 74 Years | 0 (0.0%) | 0 (0.0%) |
| 75 Years and over | 0 (0.0%) | 0 (0.0%) |
| Total | 31 (23.5%) | 28 (24.8%) |
Income Above Poverty by Sex and Age in Upper Kalskag
According to the poverty statistics in Upper Kalskag, males aged 5 years and females aged 12 to 14 years are the age groups that are most secure financially, with 100.0% of males and 100.0% of females in these age groups living above the poverty line.
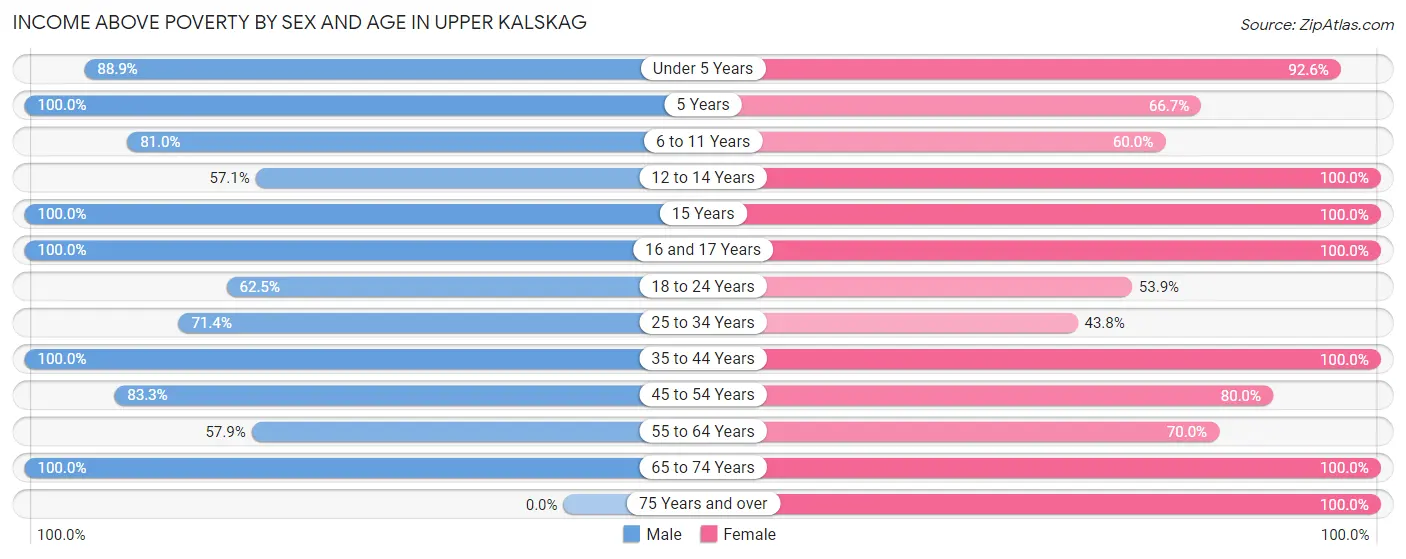
| Age Bracket | Male | Female |
| Under 5 Years | 8 (88.9%) | 25 (92.6%) |
| 5 Years | 5 (100.0%) | 2 (66.7%) |
| 6 to 11 Years | 17 (80.9%) | 9 (60.0%) |
| 12 to 14 Years | 8 (57.1%) | 6 (100.0%) |
| 15 Years | 3 (100.0%) | 1 (100.0%) |
| 16 and 17 Years | 4 (100.0%) | 2 (100.0%) |
| 18 to 24 Years | 10 (62.5%) | 7 (53.8%) |
| 25 to 34 Years | 10 (71.4%) | 7 (43.8%) |
| 35 to 44 Years | 13 (100.0%) | 11 (100.0%) |
| 45 to 54 Years | 10 (83.3%) | 4 (80.0%) |
| 55 to 64 Years | 11 (57.9%) | 7 (70.0%) |
| 65 to 74 Years | 2 (100.0%) | 2 (100.0%) |
| 75 Years and over | 0 (0.0%) | 2 (100.0%) |
| Total | 101 (76.5%) | 85 (75.2%) |
Income Below Poverty Among Married-Couple Families in Upper Kalskag
The poverty statistics for married-couple families in Upper Kalskag show that 3.8% or 1 of the total 26 families live below the poverty line. Families with 3 or 4 children have the highest poverty rate of 8.3%, comprising of 1 families. On the other hand, families with no children have the lowest poverty rate of 0.0%, which includes 0 families.
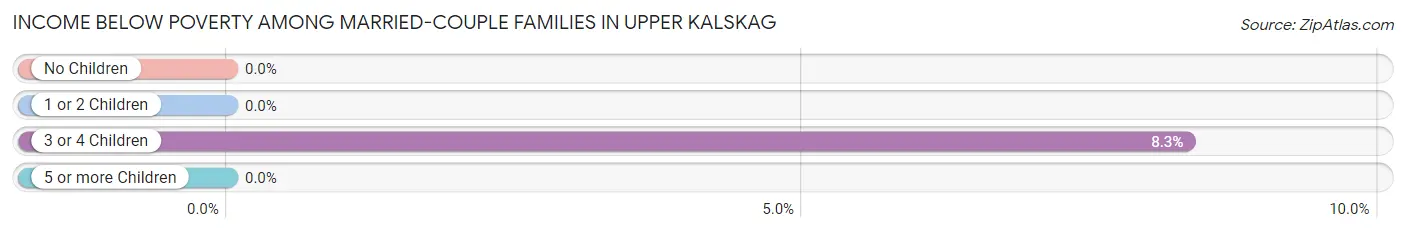
| Children | Above Poverty | Below Poverty |
| No Children | 4 (100.0%) | 0 (0.0%) |
| 1 or 2 Children | 10 (100.0%) | 0 (0.0%) |
| 3 or 4 Children | 11 (91.7%) | 1 (8.3%) |
| 5 or more Children | 0 (0.0%) | 0 (0.0%) |
| Total | 25 (96.2%) | 1 (3.8%) |
Income Below Poverty Among Single-Parent Households in Upper Kalskag
According to the poverty data in Upper Kalskag, 53.3% or 8 single-father households and 100.0% or 5 single-mother households are living below the poverty line. Among single-father households, those with no children have the highest poverty rate, with 4 households (100.0%) experiencing poverty. Likewise, among single-mother households, those with 1 or 2 children have the highest poverty rate, with 2 households (100.0%) falling below the poverty line.
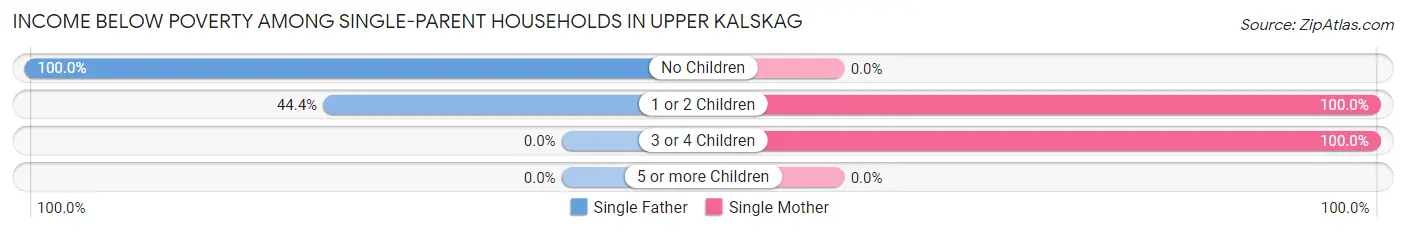
| Children | Single Father | Single Mother |
| No Children | 4 (100.0%) | 0 (0.0%) |
| 1 or 2 Children | 4 (44.4%) | 2 (100.0%) |
| 3 or 4 Children | 0 (0.0%) | 3 (100.0%) |
| 5 or more Children | 0 (0.0%) | 0 (0.0%) |
| Total | 8 (53.3%) | 5 (100.0%) |
Income Below Poverty Among Married-Couple vs Single-Parent Households in Upper Kalskag
The poverty data for Upper Kalskag shows that 1 of the married-couple family households (3.8%) and 13 of the single-parent households (65.0%) are living below the poverty level. Within the married-couple family households, those with 3 or 4 children have the highest poverty rate, with 1 households (8.3%) falling below the poverty line. Among the single-parent households, those with no children have the highest poverty rate, with 4 household (100.0%) living below poverty.
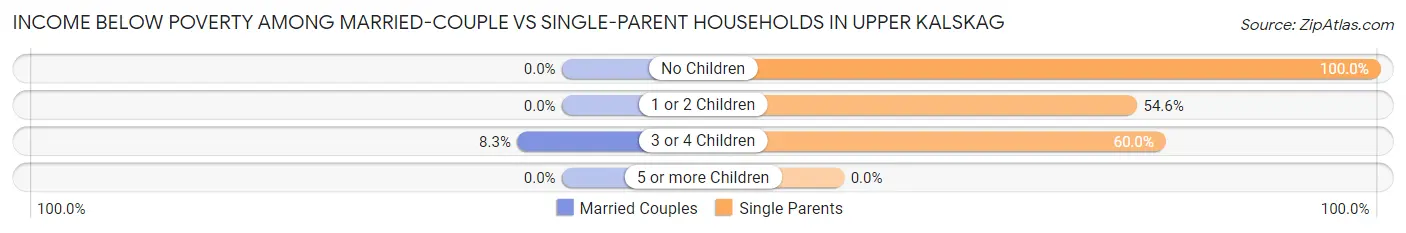
| Children | Married-Couple Families | Single-Parent Households |
| No Children | 0 (0.0%) | 4 (100.0%) |
| 1 or 2 Children | 0 (0.0%) | 6 (54.5%) |
| 3 or 4 Children | 1 (8.3%) | 3 (60.0%) |
| 5 or more Children | 0 (0.0%) | 0 (0.0%) |
| Total | 1 (3.8%) | 13 (65.0%) |
Race in Upper Kalskag
The most populous races in Upper Kalskag are Native / Alaskan (216 | 85.4%), Two or more Races (18 | 7.1%), and White / Caucasian (17 | 6.7%).
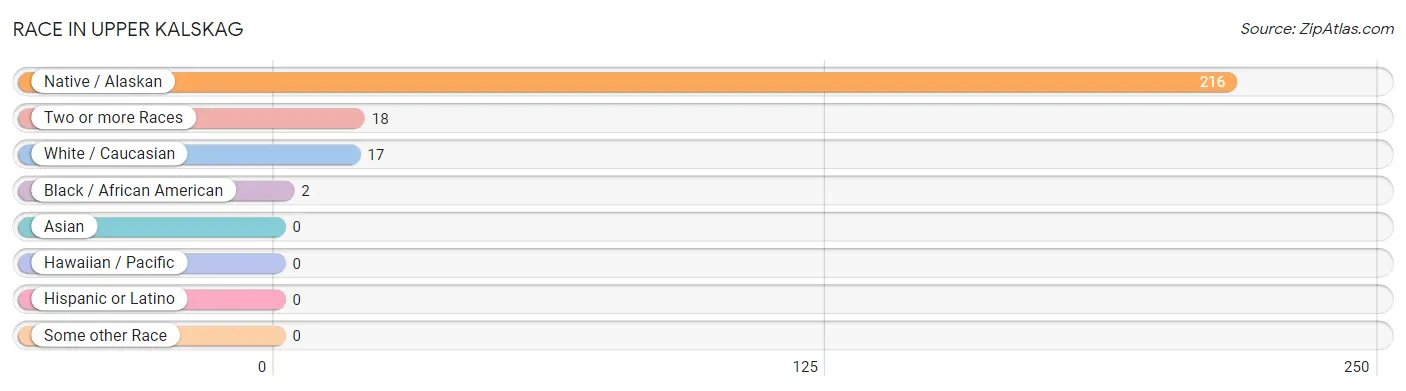
| Race | # Population | % Population |
| Asian | 0 | 0.0% |
| Black / African American | 2 | 0.8% |
| Hawaiian / Pacific | 0 | 0.0% |
| Hispanic or Latino | 0 | 0.0% |
| Native / Alaskan | 216 | 85.4% |
| White / Caucasian | 17 | 6.7% |
| Two or more Races | 18 | 7.1% |
| Some other Race | 0 | 0.0% |
| Total | 253 | 100.0% |
Ancestry in Upper Kalskag
The most populous ancestries reported in Upper Kalskag are Yup'ik (217 | 85.8%), European (22 | 8.7%), Irish (15 | 5.9%), German (13 | 5.1%), and Alaskan Athabascan (11 | 4.3%), together accounting for 109.9% of all Upper Kalskag residents.
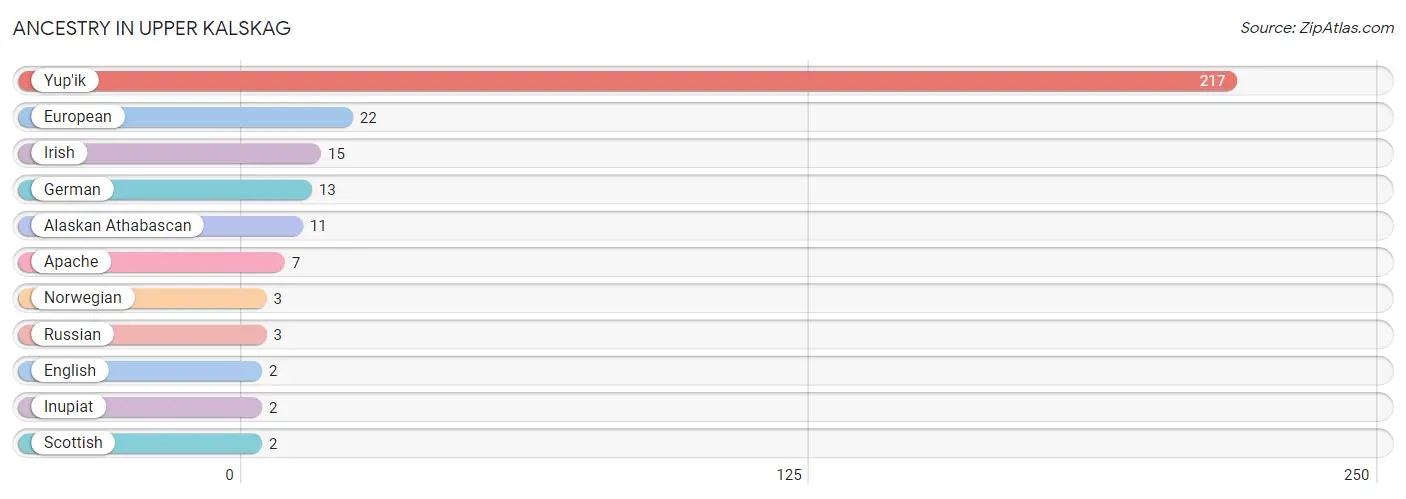
| Ancestry | # Population | % Population |
| Alaskan Athabascan | 11 | 4.3% |
| Apache | 7 | 2.8% |
| English | 2 | 0.8% |
| European | 22 | 8.7% |
| German | 13 | 5.1% |
| Inupiat | 2 | 0.8% |
| Irish | 15 | 5.9% |
| Norwegian | 3 | 1.2% |
| Russian | 3 | 1.2% |
| Scottish | 2 | 0.8% |
| Yup'ik | 217 | 85.8% | View All 11 Rows |
Immigrants in Upper Kalskag

| Immigration Origin | # Population | % Population | View All 0 Rows |
Sex and Age in Upper Kalskag
Sex and Age in Upper Kalskag
The most populous age groups in Upper Kalskag are 5 to 9 Years (28 | 20.4%) for men and Under 5 Years (29 | 25.0%) for women.
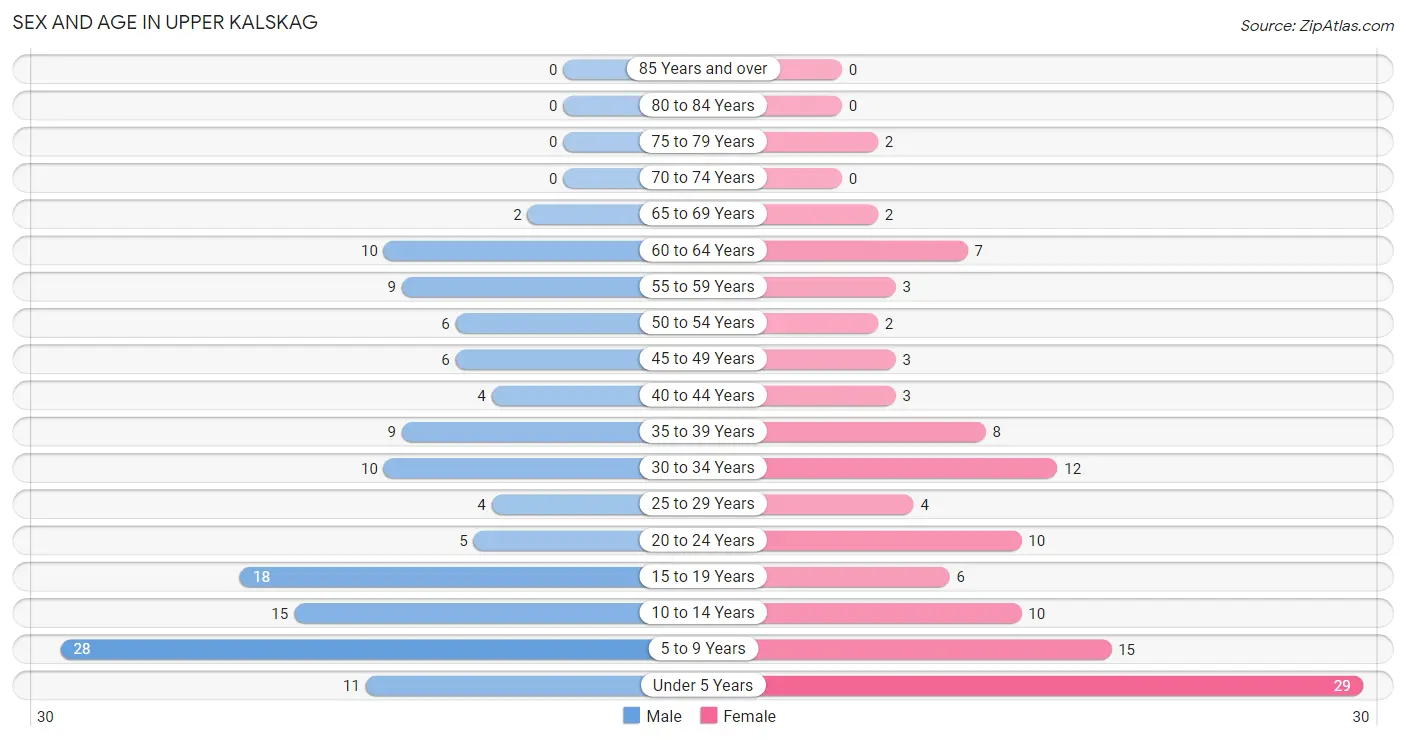
| Age Bracket | Male | Female |
| Under 5 Years | 11 (8.0%) | 29 (25.0%) |
| 5 to 9 Years | 28 (20.4%) | 15 (12.9%) |
| 10 to 14 Years | 15 (11.0%) | 10 (8.6%) |
| 15 to 19 Years | 18 (13.1%) | 6 (5.2%) |
| 20 to 24 Years | 5 (3.6%) | 10 (8.6%) |
| 25 to 29 Years | 4 (2.9%) | 4 (3.5%) |
| 30 to 34 Years | 10 (7.3%) | 12 (10.3%) |
| 35 to 39 Years | 9 (6.6%) | 8 (6.9%) |
| 40 to 44 Years | 4 (2.9%) | 3 (2.6%) |
| 45 to 49 Years | 6 (4.4%) | 3 (2.6%) |
| 50 to 54 Years | 6 (4.4%) | 2 (1.7%) |
| 55 to 59 Years | 9 (6.6%) | 3 (2.6%) |
| 60 to 64 Years | 10 (7.3%) | 7 (6.0%) |
| 65 to 69 Years | 2 (1.5%) | 2 (1.7%) |
| 70 to 74 Years | 0 (0.0%) | 0 (0.0%) |
| 75 to 79 Years | 0 (0.0%) | 2 (1.7%) |
| 80 to 84 Years | 0 (0.0%) | 0 (0.0%) |
| 85 Years and over | 0 (0.0%) | 0 (0.0%) |
| Total | 137 (100.0%) | 116 (100.0%) |
Families and Households in Upper Kalskag
Median Family Size in Upper Kalskag
The median family size in Upper Kalskag is 4.59 persons per family, with married-couple families (26 | 56.5%) accounting for the largest median family size of 5.69 persons per family. On the other hand, single female/mother families (5 | 10.9%) represent the smallest median family size with 2.80 persons per family.
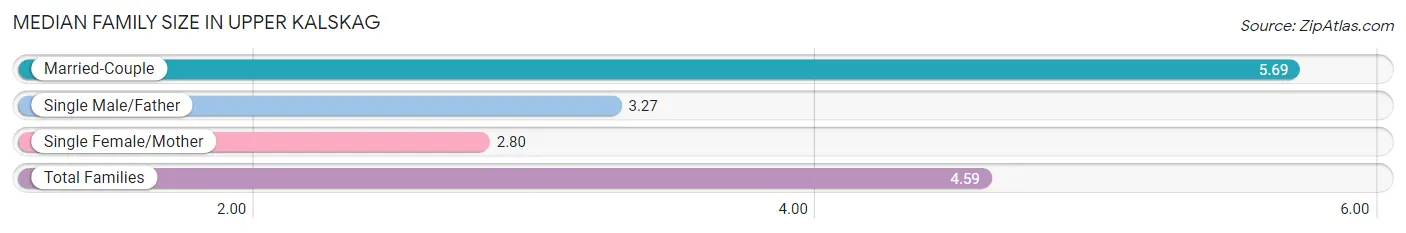
| Family Type | # Families | Family Size |
| Married-Couple | 26 (56.5%) | 5.69 |
| Single Male/Father | 15 (32.6%) | 3.27 |
| Single Female/Mother | 5 (10.9%) | 2.80 |
| Total Families | 46 (100.0%) | 4.59 |
Median Household Size in Upper Kalskag
The median household size in Upper Kalskag is 4.08 persons per household, with married-couple households (26 | 41.9%) accounting for the largest median household size of 6 persons per household. non-family households (16 | 25.8%) represent the smallest median household size with 1.31 persons per household.
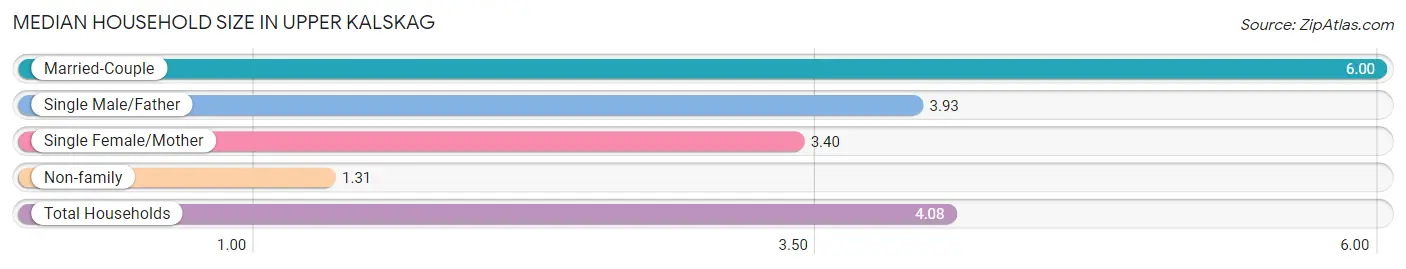
| Household Type | # Households | Household Size |
| Married-Couple | 26 (41.9%) | 6.00 |
| Single Male/Father | 15 (24.2%) | 3.93 |
| Single Female/Mother | 5 (8.1%) | 3.40 |
| Non-family | 16 (25.8%) | 1.31 |
| Total Households | 62 (100.0%) | 4.08 |
Household Size by Marriage Status in Upper Kalskag
Out of a total of 62 households in Upper Kalskag, 46 (74.2%) are family households, while 16 (25.8%) are nonfamily households. The most numerous type of family households are 3-person households, comprising 14, and the most common type of nonfamily households are 1-person households, comprising 9.
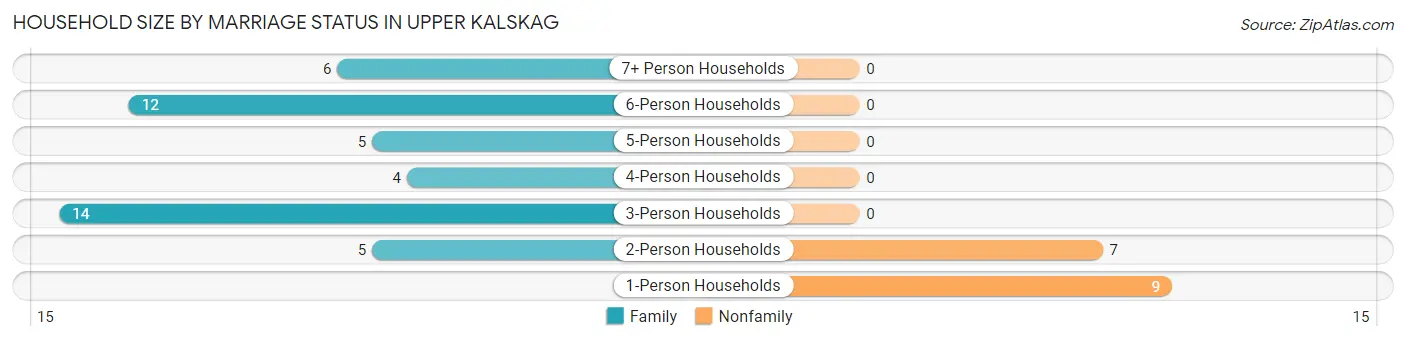
| Household Size | Family Households | Nonfamily Households |
| 1-Person Households | - | 9 (14.5%) |
| 2-Person Households | 5 (8.1%) | 7 (11.3%) |
| 3-Person Households | 14 (22.6%) | 0 (0.0%) |
| 4-Person Households | 4 (6.5%) | 0 (0.0%) |
| 5-Person Households | 5 (8.1%) | 0 (0.0%) |
| 6-Person Households | 12 (19.4%) | 0 (0.0%) |
| 7+ Person Households | 6 (9.7%) | 0 (0.0%) |
| Total | 46 (74.2%) | 16 (25.8%) |
Female Fertility in Upper Kalskag
Fertility by Age in Upper Kalskag
Average fertility rate in Upper Kalskag is 43.0 births per 1,000 women. Women in the age bracket of 35 to 50 years have the highest fertility rate with 143.0 births per 1,000 women. Women in the age bracket of 35 to 50 years acount for 100.0% of all women with births.
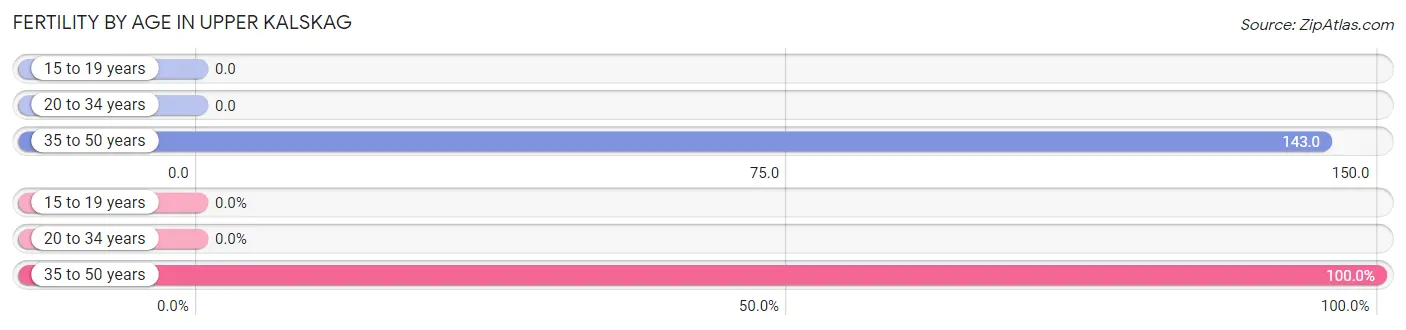
| Age Bracket | Women with Births | Births / 1,000 Women |
| 15 to 19 years | 0 (0.0%) | 0.0 |
| 20 to 34 years | 0 (0.0%) | 0.0 |
| 35 to 50 years | 2 (100.0%) | 143.0 |
| Total | 2 (100.0%) | 43.0 |
Fertility by Age by Marriage Status in Upper Kalskag
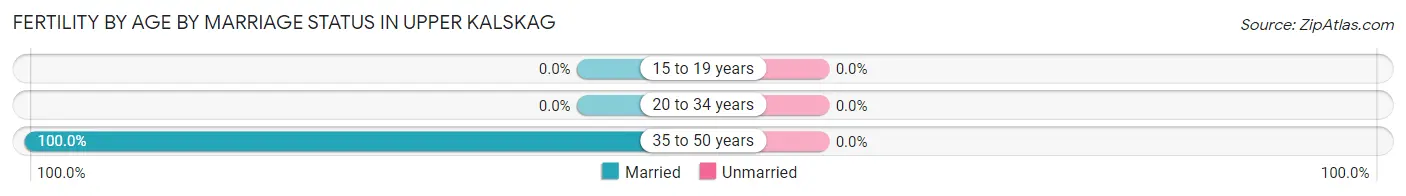
| Age Bracket | Married | Unmarried |
| 15 to 19 years | 0 (0.0%) | 0 (0.0%) |
| 20 to 34 years | 0 (0.0%) | 0 (0.0%) |
| 35 to 50 years | 2 (100.0%) | 0 (0.0%) |
| Total | 2 (100.0%) | 0 (0.0%) |
Fertility by Education in Upper Kalskag
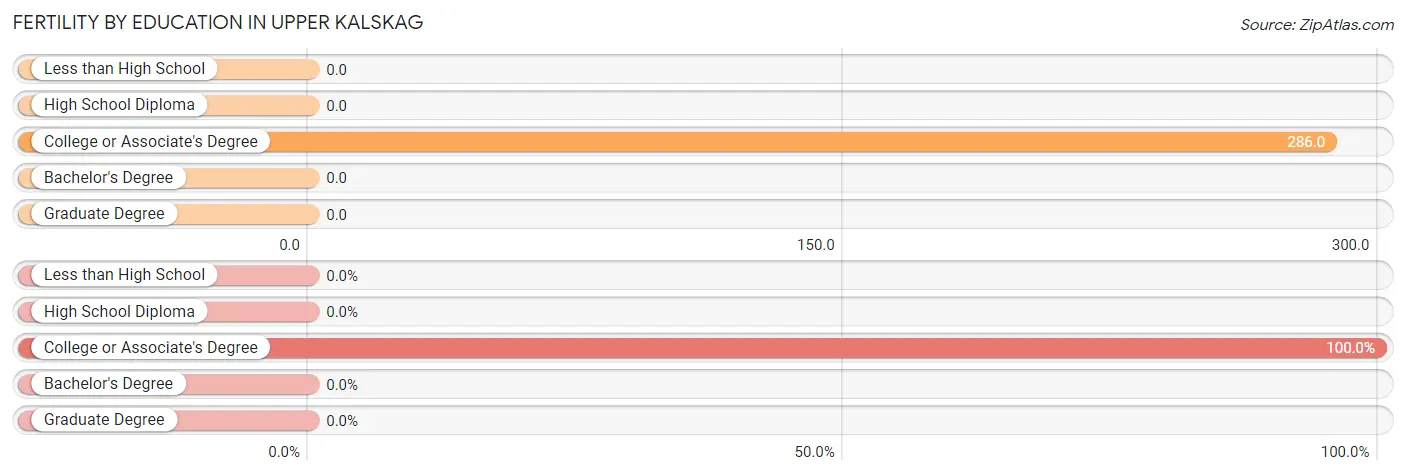
| Educational Attainment | Women with Births | Births / 1,000 Women |
| Less than High School | 0 (0.0%) | 0.0 |
| High School Diploma | 0 (0.0%) | 0.0 |
| College or Associate's Degree | 2 (100.0%) | 286.0 |
| Bachelor's Degree | 0 (0.0%) | 0.0 |
| Graduate Degree | 0 (0.0%) | 0.0 |
| Total | 2 (100.0%) | 43.0 |
Fertility by Education by Marriage Status in Upper Kalskag
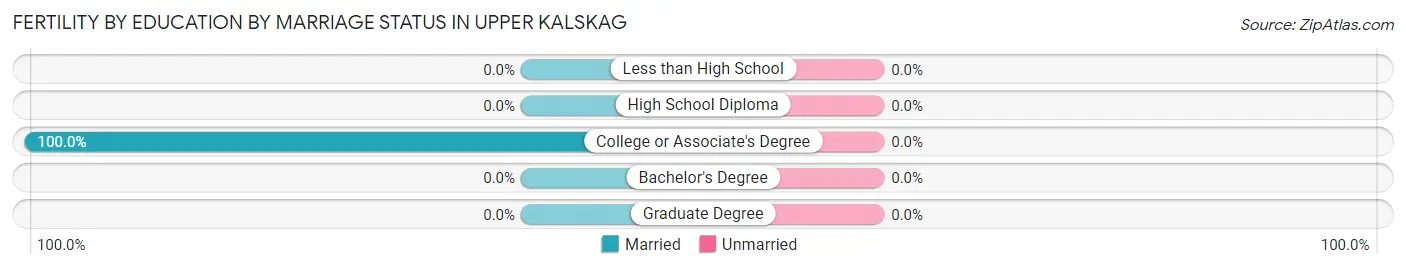
| Educational Attainment | Married | Unmarried |
| Less than High School | 0 (0.0%) | 0 (0.0%) |
| High School Diploma | 0 (0.0%) | 0 (0.0%) |
| College or Associate's Degree | 2 (100.0%) | 0 (0.0%) |
| Bachelor's Degree | 0 (0.0%) | 0 (0.0%) |
| Graduate Degree | 0 (0.0%) | 0 (0.0%) |
| Total | 2 (100.0%) | 0 (0.0%) |
Employment Characteristics in Upper Kalskag
Employment by Class of Employer in Upper Kalskag
Among the 70 employed individuals in Upper Kalskag, local government employees (29 | 41.4%), state government employees (23 | 32.9%), and not-for-profit organizations (7 | 10.0%) make up the most common classes of employment.
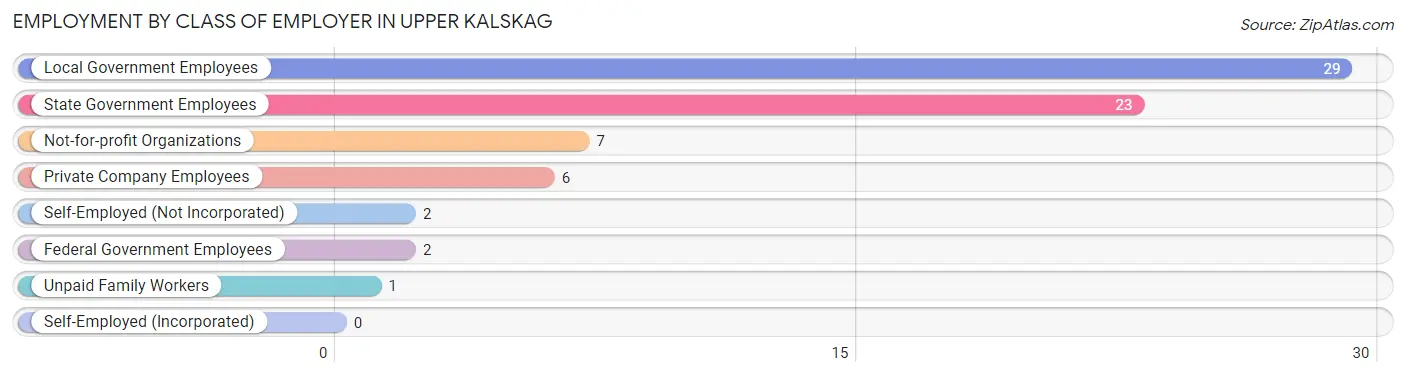
| Employer Class | # Employees | % Employees |
| Private Company Employees | 6 | 8.6% |
| Self-Employed (Incorporated) | 0 | 0.0% |
| Self-Employed (Not Incorporated) | 2 | 2.9% |
| Not-for-profit Organizations | 7 | 10.0% |
| Local Government Employees | 29 | 41.4% |
| State Government Employees | 23 | 32.9% |
| Federal Government Employees | 2 | 2.9% |
| Unpaid Family Workers | 1 | 1.4% |
| Total | 70 | 100.0% |
Employment Status by Age in Upper Kalskag
According to the labor force statistics for Upper Kalskag, out of the total population over 16 years of age (141), 67.4% or 95 individuals are in the labor force, with 26.3% or 25 of them unemployed. The age group with the highest labor force participation rate is 55 to 59 years, with 100.0% or 12 individuals in the labor force. Within the labor force, the 30 to 34 years age range has the highest percentage of unemployed individuals, with 47.4% or 9 of them being unemployed.
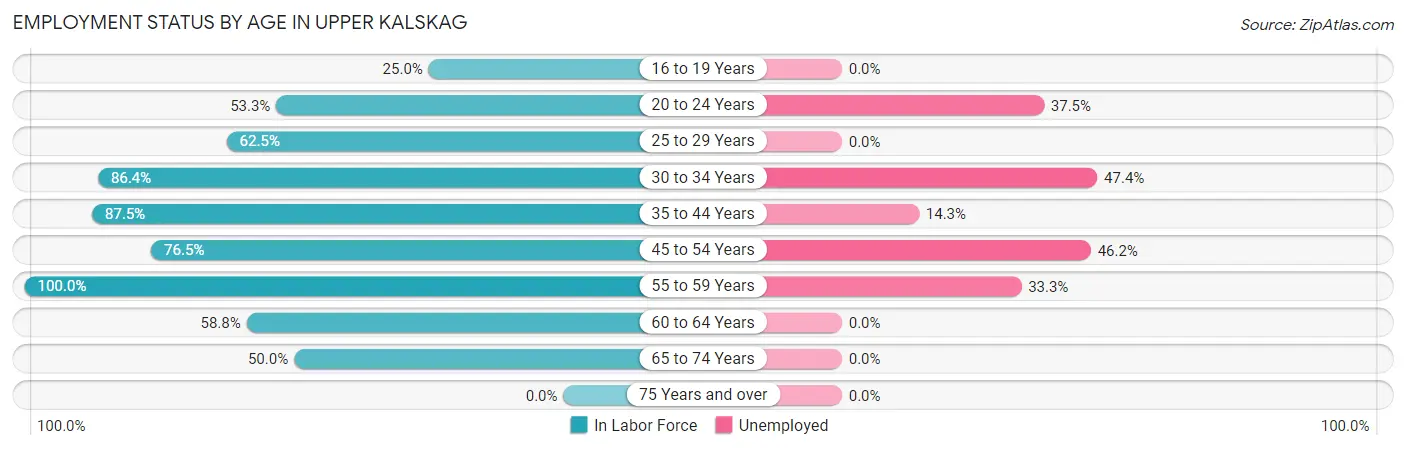
| Age Bracket | In Labor Force | Unemployed |
| 16 to 19 Years | 5 (25.0%) | 0 (0.0%) |
| 20 to 24 Years | 8 (53.3%) | 3 (37.5%) |
| 25 to 29 Years | 5 (62.5%) | 0 (0.0%) |
| 30 to 34 Years | 19 (86.4%) | 9 (47.4%) |
| 35 to 44 Years | 21 (87.5%) | 3 (14.3%) |
| 45 to 54 Years | 13 (76.5%) | 6 (46.2%) |
| 55 to 59 Years | 12 (100.0%) | 4 (33.3%) |
| 60 to 64 Years | 10 (58.8%) | 0 (0.0%) |
| 65 to 74 Years | 2 (50.0%) | 0 (0.0%) |
| 75 Years and over | 0 (0.0%) | 0 (0.0%) |
| Total | 95 (67.4%) | 25 (26.3%) |
Employment Status by Educational Attainment in Upper Kalskag
According to labor force statistics for Upper Kalskag, 80.0% of individuals (80) out of the total population between 25 and 64 years of age (100) are in the labor force, with 27.5% or 22 of them being unemployed. The group with the highest labor force participation rate are those with the educational attainment of college / associate degree, with 100.0% or 29 individuals in the labor force. Within the labor force, individuals with less than high school education have the highest percentage of unemployment, with 33.3% or 2 of them being unemployed.
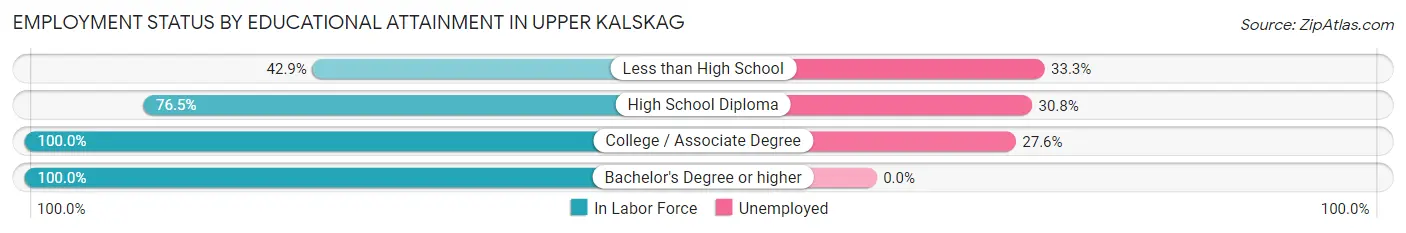
| Educational Attainment | In Labor Force | Unemployed |
| Less than High School | 6 (42.9%) | 5 (33.3%) |
| High School Diploma | 39 (76.5%) | 16 (30.8%) |
| College / Associate Degree | 29 (100.0%) | 8 (27.6%) |
| Bachelor's Degree or higher | 6 (100.0%) | 0 (0.0%) |
| Total | 80 (80.0%) | 28 (27.5%) |
Employment Occupations by Sex in Upper Kalskag
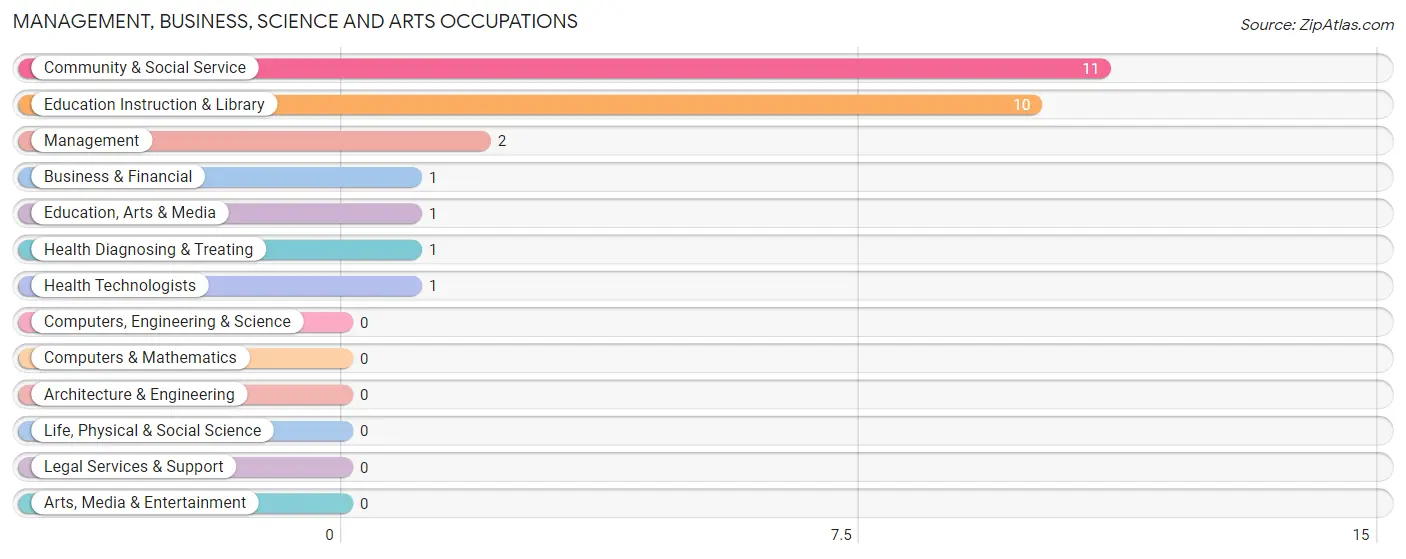
Management, Business, Science and Arts Occupations
The most common Management, Business, Science and Arts occupations in Upper Kalskag are Community & Social Service (11 | 15.7%), Education Instruction & Library (10 | 14.3%), Management (2 | 2.9%), Business & Financial (1 | 1.4%), and Education, Arts & Media (1 | 1.4%).
Management, Business, Science and Arts Occupations by Sex
Within the Management, Business, Science and Arts occupations in Upper Kalskag, the most male-oriented occupations are Business & Financial (100.0%), Management (50.0%), and Education Instruction & Library (10.0%), while the most female-oriented occupations are Education, Arts & Media (100.0%), Health Diagnosing & Treating (100.0%), and Health Technologists (100.0%).
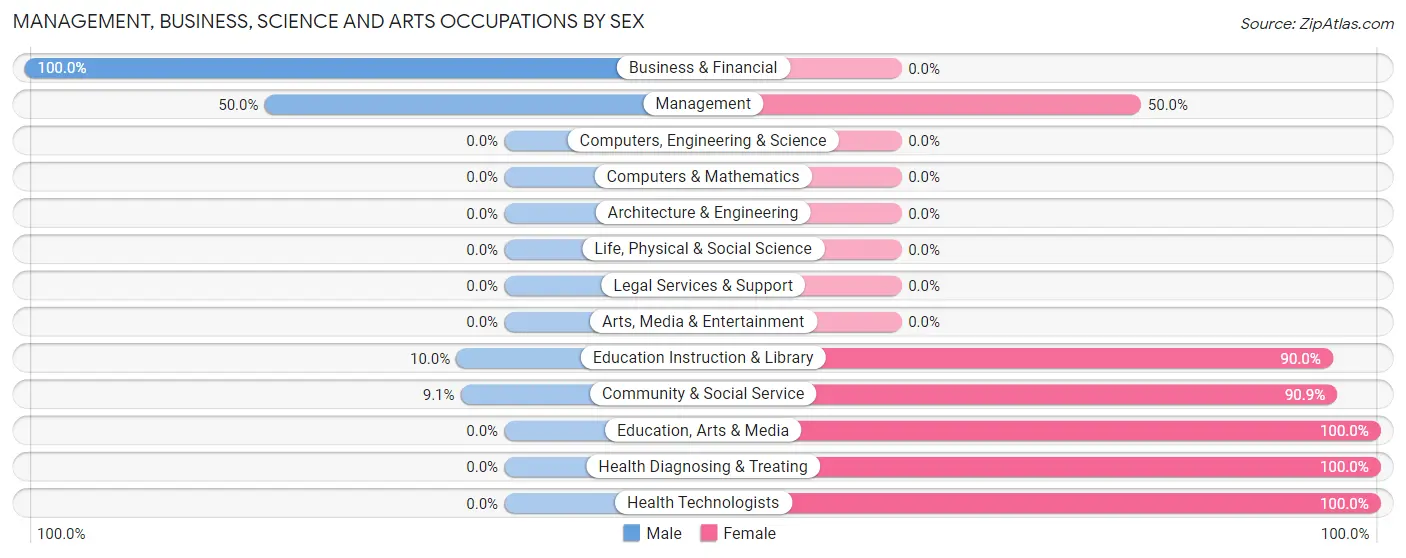
| Occupation | Male | Female |
| Management | 1 (50.0%) | 1 (50.0%) |
| Business & Financial | 1 (100.0%) | 0 (0.0%) |
| Computers, Engineering & Science | 0 (0.0%) | 0 (0.0%) |
| Computers & Mathematics | 0 (0.0%) | 0 (0.0%) |
| Architecture & Engineering | 0 (0.0%) | 0 (0.0%) |
| Life, Physical & Social Science | 0 (0.0%) | 0 (0.0%) |
| Community & Social Service | 1 (9.1%) | 10 (90.9%) |
| Education, Arts & Media | 0 (0.0%) | 1 (100.0%) |
| Legal Services & Support | 0 (0.0%) | 0 (0.0%) |
| Education Instruction & Library | 1 (10.0%) | 9 (90.0%) |
| Arts, Media & Entertainment | 0 (0.0%) | 0 (0.0%) |
| Health Diagnosing & Treating | 0 (0.0%) | 1 (100.0%) |
| Health Technologists | 0 (0.0%) | 1 (100.0%) |
| Total (Category) | 3 (20.0%) | 12 (80.0%) |
| Total (Overall) | 37 (52.9%) | 33 (47.1%) |
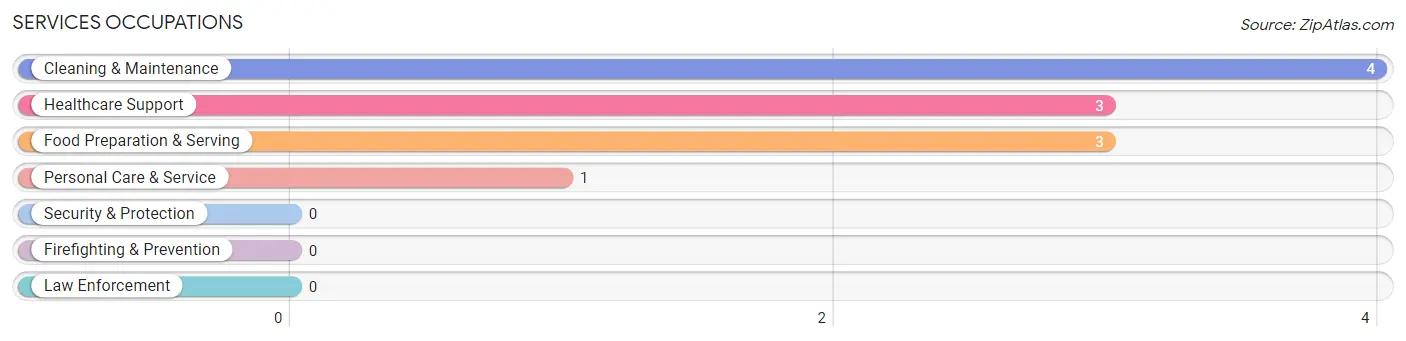
Services Occupations
The most common Services occupations in Upper Kalskag are Cleaning & Maintenance (4 | 5.7%), Healthcare Support (3 | 4.3%), Food Preparation & Serving (3 | 4.3%), and Personal Care & Service (1 | 1.4%).
Services Occupations by Sex
Within the Services occupations in Upper Kalskag, the most male-oriented occupations are Cleaning & Maintenance (50.0%), and Food Preparation & Serving (33.3%), while the most female-oriented occupations are Healthcare Support (100.0%), Personal Care & Service (100.0%), and Food Preparation & Serving (66.7%).
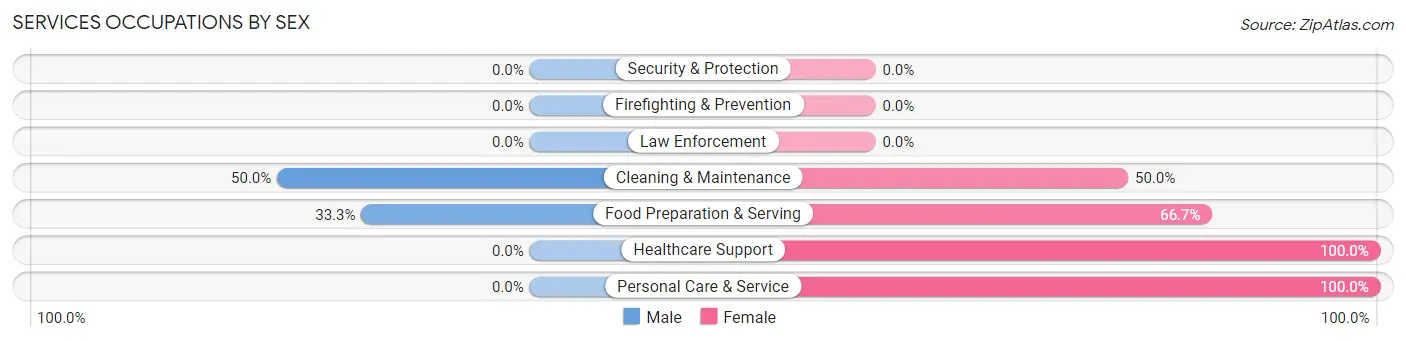
| Occupation | Male | Female |
| Healthcare Support | 0 (0.0%) | 3 (100.0%) |
| Security & Protection | 0 (0.0%) | 0 (0.0%) |
| Firefighting & Prevention | 0 (0.0%) | 0 (0.0%) |
| Law Enforcement | 0 (0.0%) | 0 (0.0%) |
| Food Preparation & Serving | 1 (33.3%) | 2 (66.7%) |
| Cleaning & Maintenance | 2 (50.0%) | 2 (50.0%) |
| Personal Care & Service | 0 (0.0%) | 1 (100.0%) |
| Total (Category) | 3 (27.3%) | 8 (72.7%) |
| Total (Overall) | 37 (52.9%) | 33 (47.1%) |
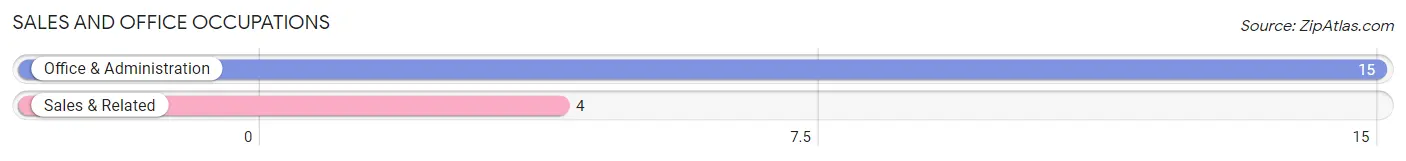
Sales and Office Occupations
The most common Sales and Office occupations in Upper Kalskag are Office & Administration (15 | 21.4%), and Sales & Related (4 | 5.7%).
Sales and Office Occupations by Sex

| Occupation | Male | Female |
| Sales & Related | 4 (100.0%) | 0 (0.0%) |
| Office & Administration | 2 (13.3%) | 13 (86.7%) |
| Total (Category) | 6 (31.6%) | 13 (68.4%) |
| Total (Overall) | 37 (52.9%) | 33 (47.1%) |
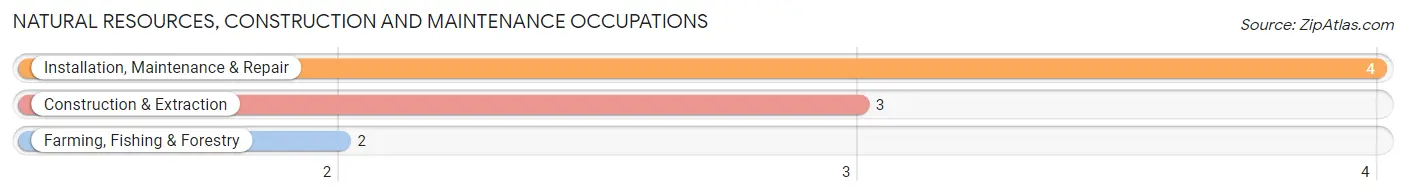
Natural Resources, Construction and Maintenance Occupations
The most common Natural Resources, Construction and Maintenance occupations in Upper Kalskag are Installation, Maintenance & Repair (4 | 5.7%), Construction & Extraction (3 | 4.3%), and Farming, Fishing & Forestry (2 | 2.9%).
Natural Resources, Construction and Maintenance Occupations by Sex
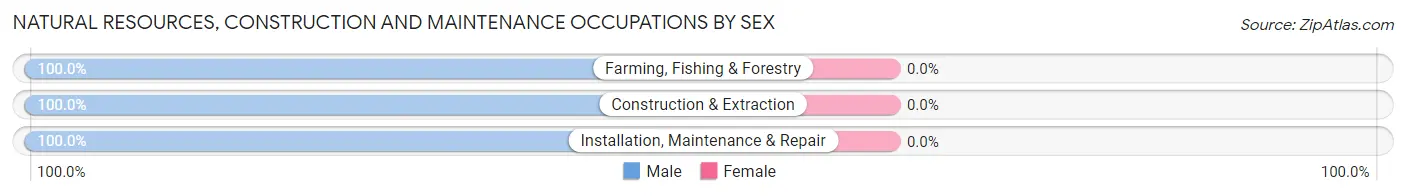
| Occupation | Male | Female |
| Farming, Fishing & Forestry | 2 (100.0%) | 0 (0.0%) |
| Construction & Extraction | 3 (100.0%) | 0 (0.0%) |
| Installation, Maintenance & Repair | 4 (100.0%) | 0 (0.0%) |
| Total (Category) | 9 (100.0%) | 0 (0.0%) |
| Total (Overall) | 37 (52.9%) | 33 (47.1%) |
Production, Transportation and Moving Occupations
The most common Production, Transportation and Moving occupations in Upper Kalskag are Transportation (6 | 8.6%), Production (5 | 7.1%), and Material Moving (5 | 7.1%).
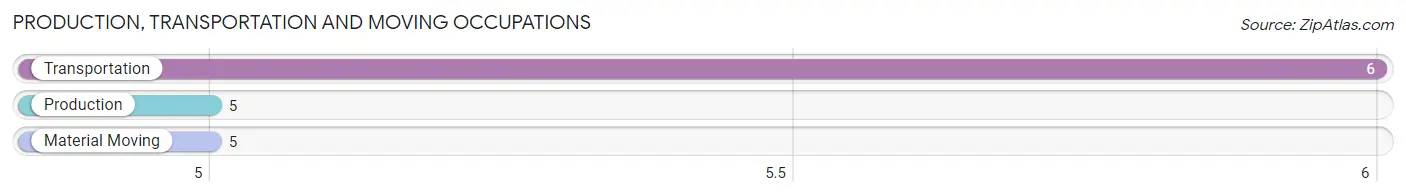
Production, Transportation and Moving Occupations by Sex
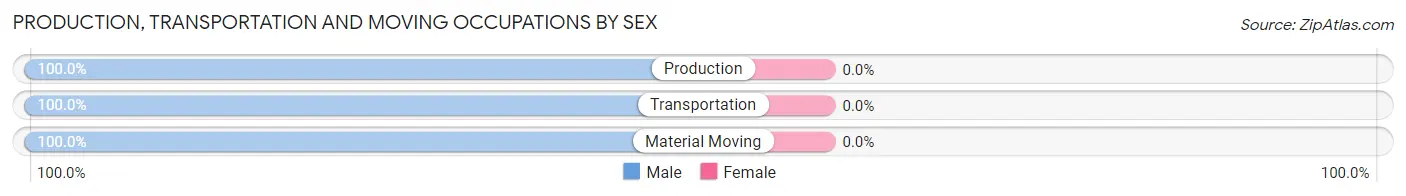
| Occupation | Male | Female |
| Production | 5 (100.0%) | 0 (0.0%) |
| Transportation | 6 (100.0%) | 0 (0.0%) |
| Material Moving | 5 (100.0%) | 0 (0.0%) |
| Total (Category) | 16 (100.0%) | 0 (0.0%) |
| Total (Overall) | 37 (52.9%) | 33 (47.1%) |
Employment Industries by Sex in Upper Kalskag
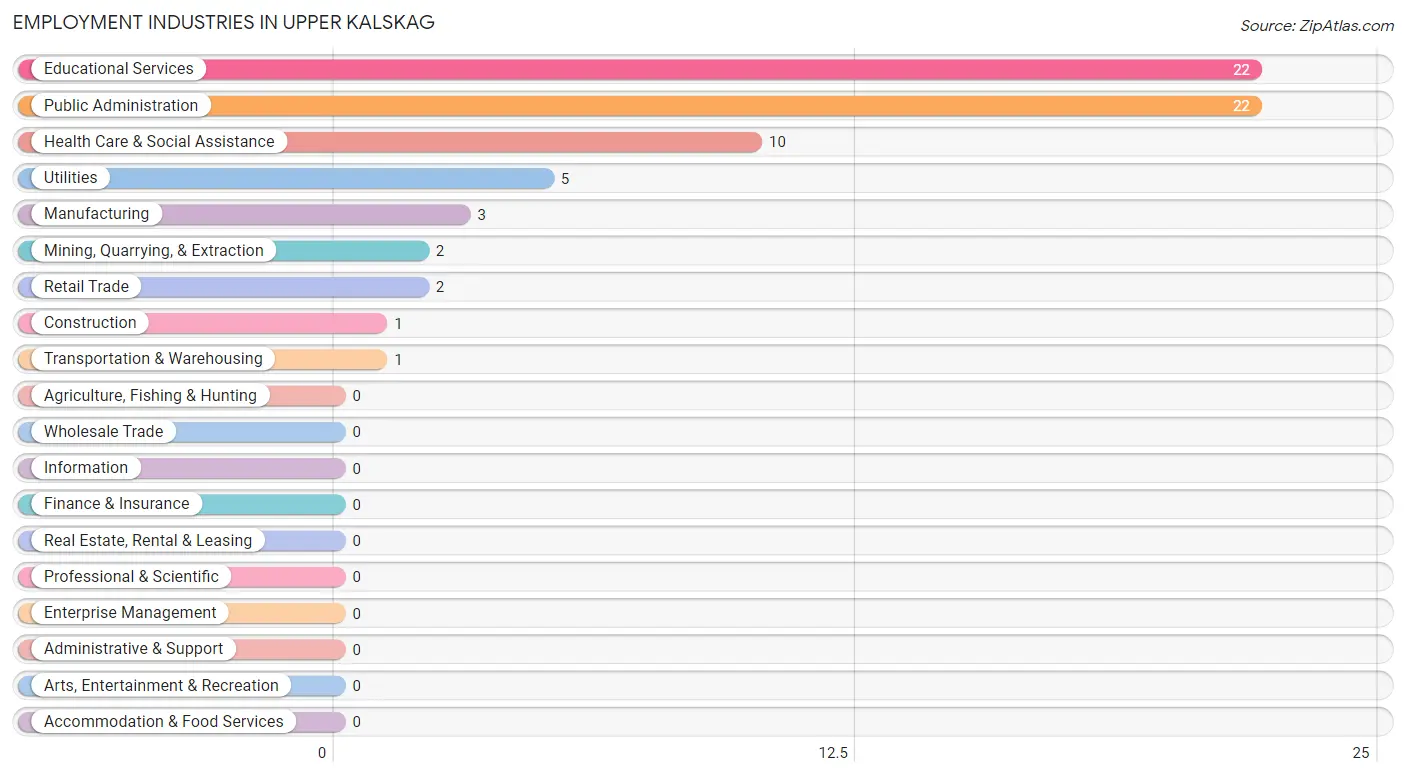
Employment Industries in Upper Kalskag
The major employment industries in Upper Kalskag include Educational Services (22 | 31.4%), Public Administration (22 | 31.4%), Health Care & Social Assistance (10 | 14.3%), Utilities (5 | 7.1%), and Manufacturing (3 | 4.3%).
Employment Industries by Sex in Upper Kalskag
The Upper Kalskag industries that see more men than women are Mining, Quarrying, & Extraction (100.0%), Construction (100.0%), and Manufacturing (100.0%), whereas the industries that tend to have a higher number of women are Health Care & Social Assistance (90.0%), Educational Services (72.7%), and Retail Trade (50.0%).
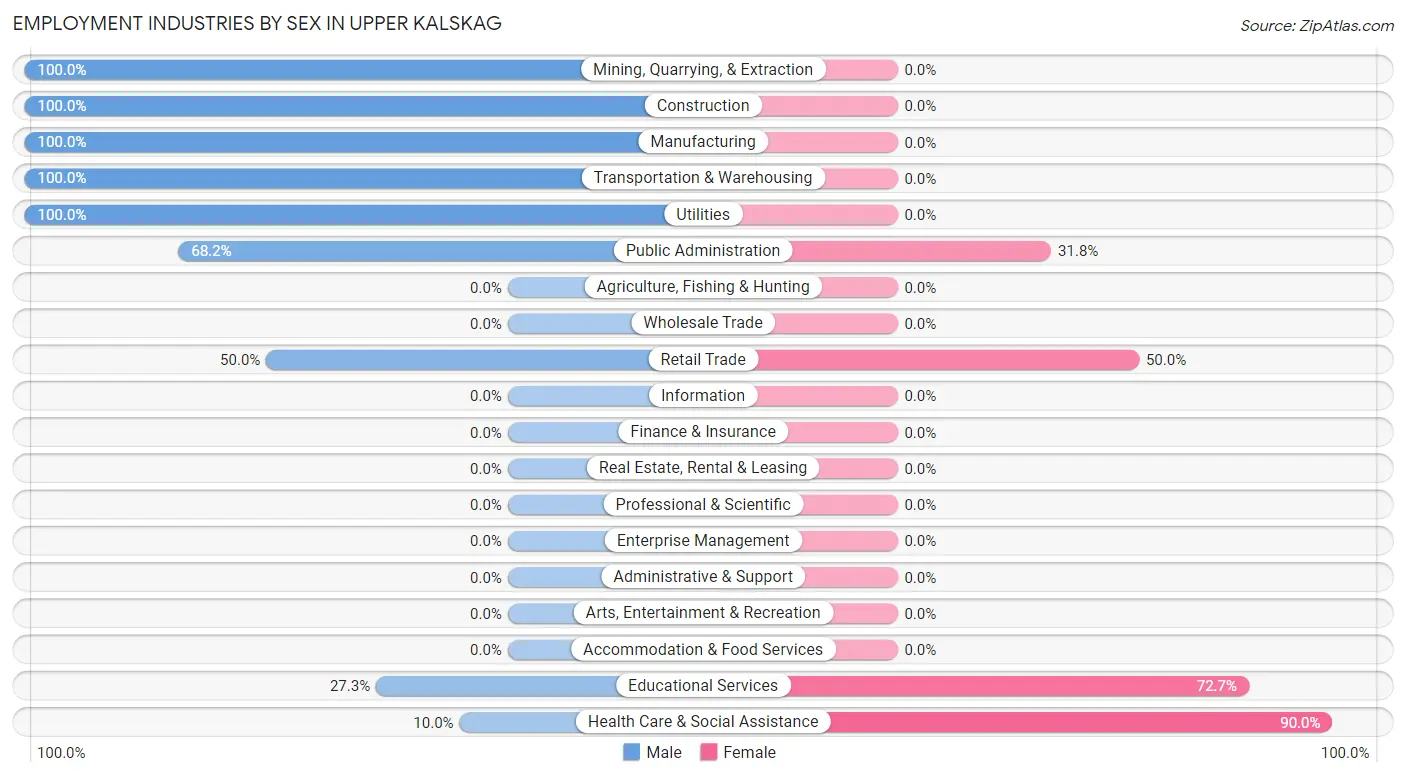
| Industry | Male | Female |
| Agriculture, Fishing & Hunting | 0 (0.0%) | 0 (0.0%) |
| Mining, Quarrying, & Extraction | 2 (100.0%) | 0 (0.0%) |
| Construction | 1 (100.0%) | 0 (0.0%) |
| Manufacturing | 3 (100.0%) | 0 (0.0%) |
| Wholesale Trade | 0 (0.0%) | 0 (0.0%) |
| Retail Trade | 1 (50.0%) | 1 (50.0%) |
| Transportation & Warehousing | 1 (100.0%) | 0 (0.0%) |
| Utilities | 5 (100.0%) | 0 (0.0%) |
| Information | 0 (0.0%) | 0 (0.0%) |
| Finance & Insurance | 0 (0.0%) | 0 (0.0%) |
| Real Estate, Rental & Leasing | 0 (0.0%) | 0 (0.0%) |
| Professional & Scientific | 0 (0.0%) | 0 (0.0%) |
| Enterprise Management | 0 (0.0%) | 0 (0.0%) |
| Administrative & Support | 0 (0.0%) | 0 (0.0%) |
| Educational Services | 6 (27.3%) | 16 (72.7%) |
| Health Care & Social Assistance | 1 (10.0%) | 9 (90.0%) |
| Arts, Entertainment & Recreation | 0 (0.0%) | 0 (0.0%) |
| Accommodation & Food Services | 0 (0.0%) | 0 (0.0%) |
| Public Administration | 15 (68.2%) | 7 (31.8%) |
| Total | 37 (52.9%) | 33 (47.1%) |
Education in Upper Kalskag
School Enrollment in Upper Kalskag
The most common levels of schooling among the 103 students in Upper Kalskag are elementary school (34 | 33.0%), middle school (24 | 23.3%), and high school (18 | 17.5%).
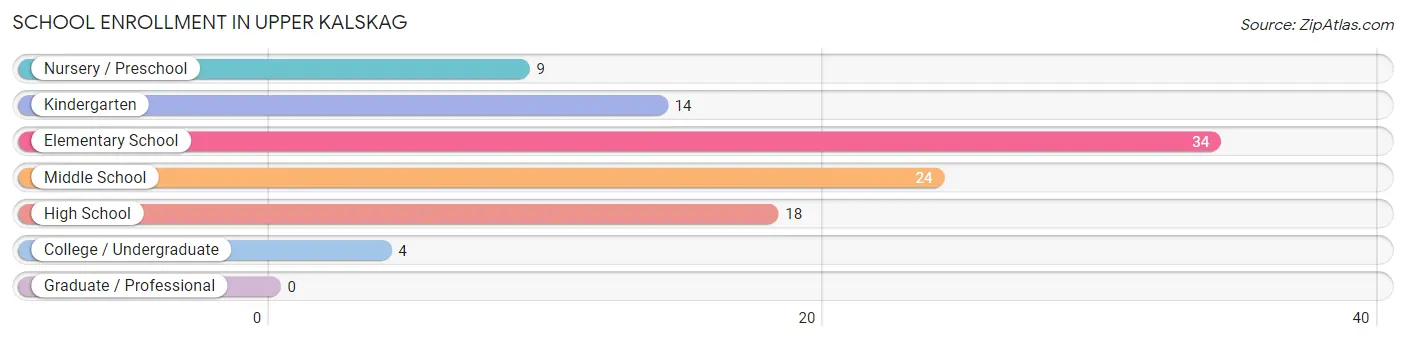
| School Level | # Students | % Students |
| Nursery / Preschool | 9 | 8.7% |
| Kindergarten | 14 | 13.6% |
| Elementary School | 34 | 33.0% |
| Middle School | 24 | 23.3% |
| High School | 18 | 17.5% |
| College / Undergraduate | 4 | 3.9% |
| Graduate / Professional | 0 | 0.0% |
| Total | 103 | 100.0% |
School Enrollment by Age by Funding Source in Upper Kalskag
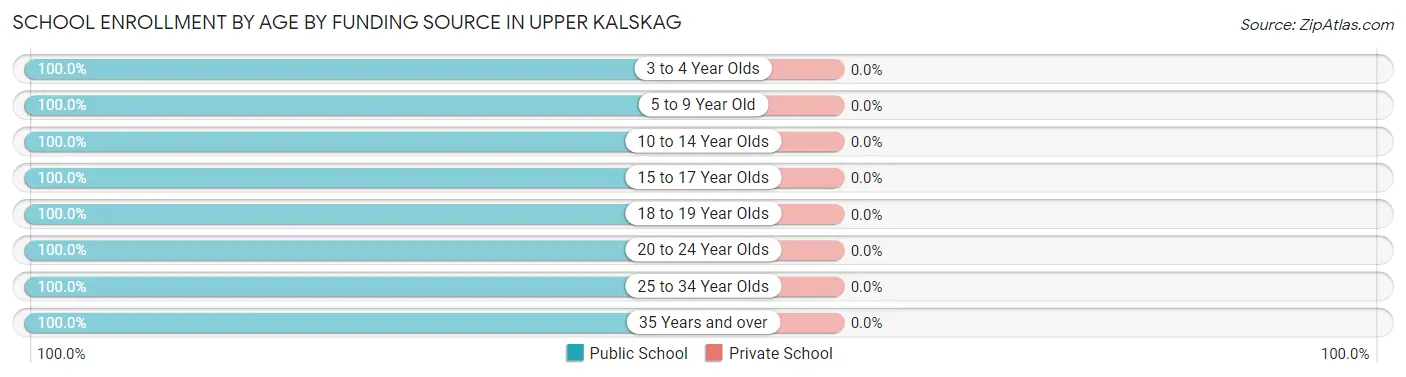
| Age Bracket | Public School | Private School |
| 3 to 4 Year Olds | 14 (100.0%) | 0 (0.0%) |
| 5 to 9 Year Old | 43 (100.0%) | 0 (0.0%) |
| 10 to 14 Year Olds | 25 (100.0%) | 0 (0.0%) |
| 15 to 17 Year Olds | 10 (100.0%) | 0 (0.0%) |
| 18 to 19 Year Olds | 5 (100.0%) | 0 (0.0%) |
| 20 to 24 Year Olds | 2 (100.0%) | 0 (0.0%) |
| 25 to 34 Year Olds | 2 (100.0%) | 0 (0.0%) |
| 35 Years and over | 2 (100.0%) | 0 (0.0%) |
| Total | 103 (100.0%) | 0 (0.0%) |
Educational Attainment by Field of Study in Upper Kalskag
Education (5 | 62.5%), liberal arts & history (2 | 25.0%), and arts & humanities (1 | 12.5%) are the most common fields of study among 8 individuals in Upper Kalskag who have obtained a bachelor's degree or higher.
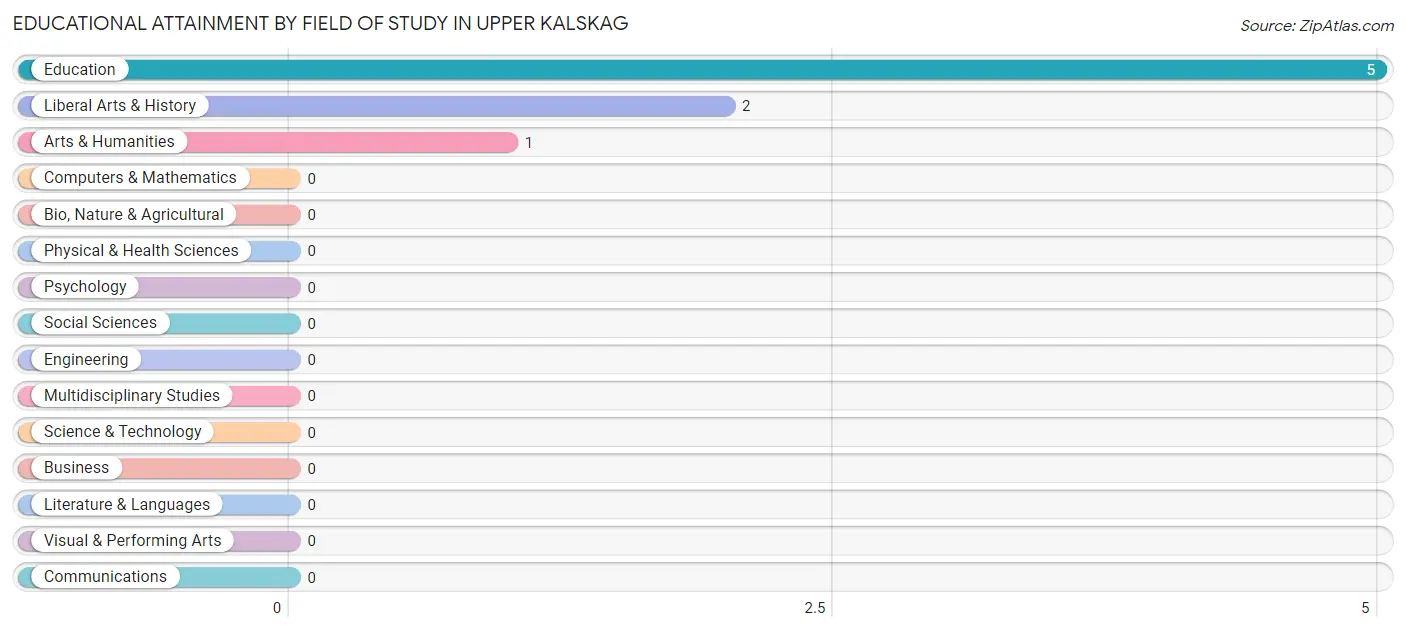
| Field of Study | # Graduates | % Graduates |
| Computers & Mathematics | 0 | 0.0% |
| Bio, Nature & Agricultural | 0 | 0.0% |
| Physical & Health Sciences | 0 | 0.0% |
| Psychology | 0 | 0.0% |
| Social Sciences | 0 | 0.0% |
| Engineering | 0 | 0.0% |
| Multidisciplinary Studies | 0 | 0.0% |
| Science & Technology | 0 | 0.0% |
| Business | 0 | 0.0% |
| Education | 5 | 62.5% |
| Literature & Languages | 0 | 0.0% |
| Liberal Arts & History | 2 | 25.0% |
| Visual & Performing Arts | 0 | 0.0% |
| Communications | 0 | 0.0% |
| Arts & Humanities | 1 | 12.5% |
| Total | 8 | 100.0% |
Transportation & Commute in Upper Kalskag
Vehicle Availability by Sex in Upper Kalskag
The most prevalent vehicle ownership categories in Upper Kalskag are males with 1 vehicle (24, accounting for 64.9%) and females with 1 vehicle (16, making up 72.7%).
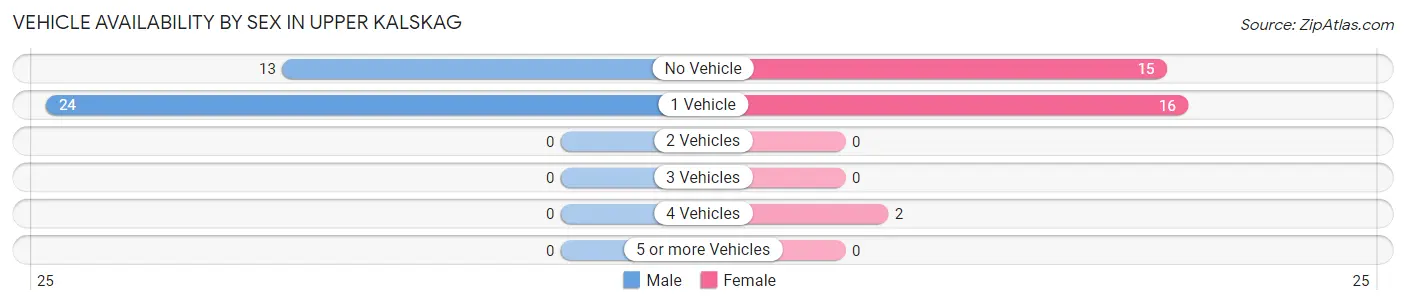
| Vehicles Available | Male | Female |
| No Vehicle | 13 (35.1%) | 15 (45.5%) |
| 1 Vehicle | 24 (64.9%) | 16 (48.5%) |
| 2 Vehicles | 0 (0.0%) | 0 (0.0%) |
| 3 Vehicles | 0 (0.0%) | 0 (0.0%) |
| 4 Vehicles | 0 (0.0%) | 2 (6.1%) |
| 5 or more Vehicles | 0 (0.0%) | 0 (0.0%) |
| Total | 37 (100.0%) | 33 (100.0%) |
Commute Time in Upper Kalskag
The most frequently occuring commute durations in Upper Kalskag are 5 to 9 minutes (34 commuters, 54.0%), 10 to 14 minutes (7 commuters, 11.1%), and 15 to 19 minutes (7 commuters, 11.1%).
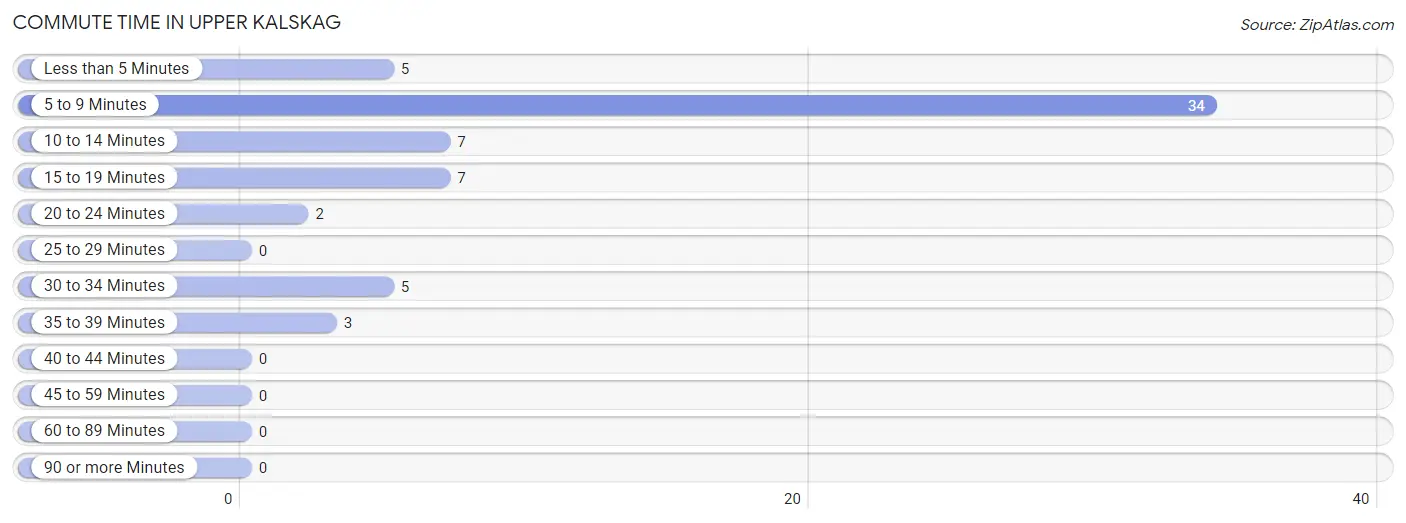
| Commute Time | # Commuters | % Commuters |
| Less than 5 Minutes | 5 | 7.9% |
| 5 to 9 Minutes | 34 | 54.0% |
| 10 to 14 Minutes | 7 | 11.1% |
| 15 to 19 Minutes | 7 | 11.1% |
| 20 to 24 Minutes | 2 | 3.2% |
| 25 to 29 Minutes | 0 | 0.0% |
| 30 to 34 Minutes | 5 | 7.9% |
| 35 to 39 Minutes | 3 | 4.8% |
| 40 to 44 Minutes | 0 | 0.0% |
| 45 to 59 Minutes | 0 | 0.0% |
| 60 to 89 Minutes | 0 | 0.0% |
| 90 or more Minutes | 0 | 0.0% |
Commute Time by Sex in Upper Kalskag
The most common commute times in Upper Kalskag are 5 to 9 minutes (17 commuters, 50.0%) for males and 5 to 9 minutes (17 commuters, 58.6%) for females.
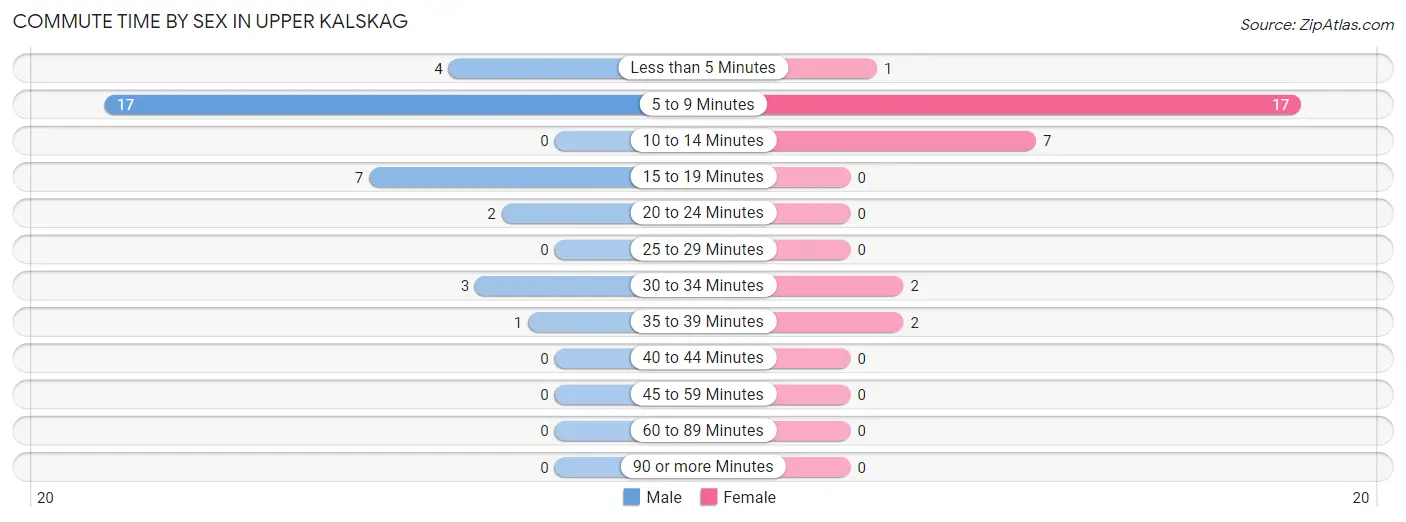
| Commute Time | Male | Female |
| Less than 5 Minutes | 4 (11.8%) | 1 (3.5%) |
| 5 to 9 Minutes | 17 (50.0%) | 17 (58.6%) |
| 10 to 14 Minutes | 0 (0.0%) | 7 (24.1%) |
| 15 to 19 Minutes | 7 (20.6%) | 0 (0.0%) |
| 20 to 24 Minutes | 2 (5.9%) | 0 (0.0%) |
| 25 to 29 Minutes | 0 (0.0%) | 0 (0.0%) |
| 30 to 34 Minutes | 3 (8.8%) | 2 (6.9%) |
| 35 to 39 Minutes | 1 (2.9%) | 2 (6.9%) |
| 40 to 44 Minutes | 0 (0.0%) | 0 (0.0%) |
| 45 to 59 Minutes | 0 (0.0%) | 0 (0.0%) |
| 60 to 89 Minutes | 0 (0.0%) | 0 (0.0%) |
| 90 or more Minutes | 0 (0.0%) | 0 (0.0%) |
Time of Departure to Work by Sex in Upper Kalskag
The most frequent times of departure to work in Upper Kalskag are 8:30 AM to 8:59 AM (12, 35.3%) for males and 7:30 AM to 7:59 AM (10, 34.5%) for females.
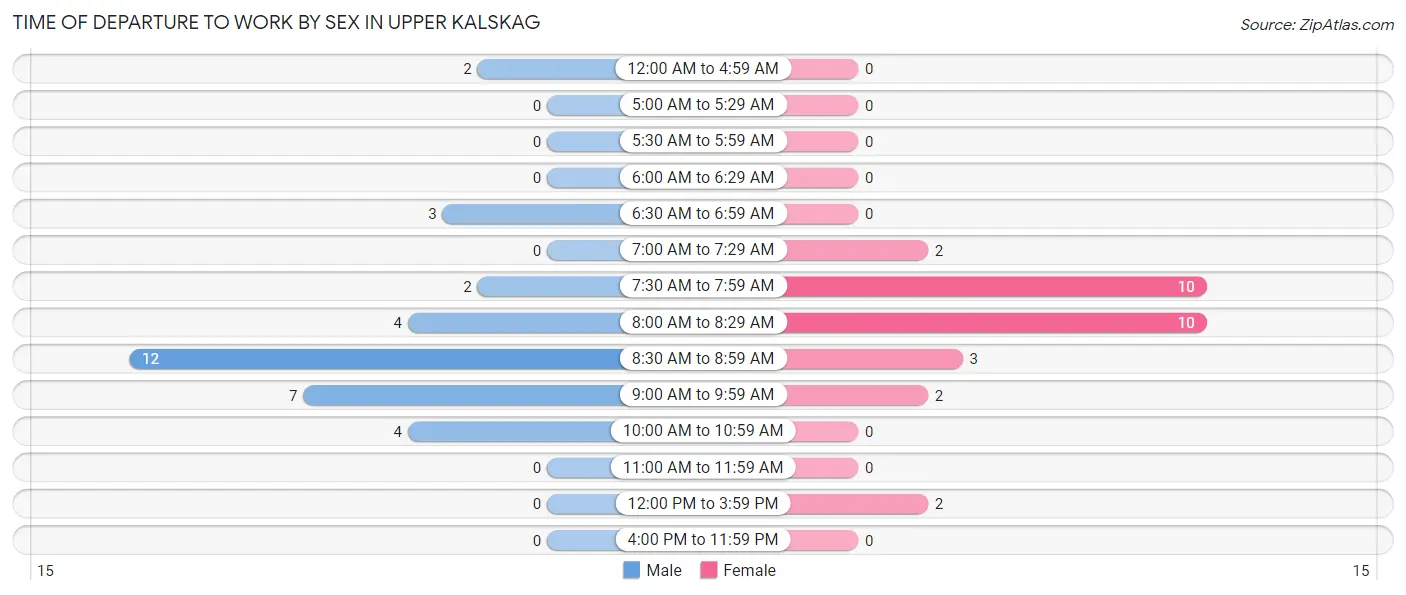
| Time of Departure | Male | Female |
| 12:00 AM to 4:59 AM | 2 (5.9%) | 0 (0.0%) |
| 5:00 AM to 5:29 AM | 0 (0.0%) | 0 (0.0%) |
| 5:30 AM to 5:59 AM | 0 (0.0%) | 0 (0.0%) |
| 6:00 AM to 6:29 AM | 0 (0.0%) | 0 (0.0%) |
| 6:30 AM to 6:59 AM | 3 (8.8%) | 0 (0.0%) |
| 7:00 AM to 7:29 AM | 0 (0.0%) | 2 (6.9%) |
| 7:30 AM to 7:59 AM | 2 (5.9%) | 10 (34.5%) |
| 8:00 AM to 8:29 AM | 4 (11.8%) | 10 (34.5%) |
| 8:30 AM to 8:59 AM | 12 (35.3%) | 3 (10.3%) |
| 9:00 AM to 9:59 AM | 7 (20.6%) | 2 (6.9%) |
| 10:00 AM to 10:59 AM | 4 (11.8%) | 0 (0.0%) |
| 11:00 AM to 11:59 AM | 0 (0.0%) | 0 (0.0%) |
| 12:00 PM to 3:59 PM | 0 (0.0%) | 2 (6.9%) |
| 4:00 PM to 11:59 PM | 0 (0.0%) | 0 (0.0%) |
| Total | 34 (100.0%) | 29 (100.0%) |
Housing Occupancy in Upper Kalskag
Occupancy by Ownership in Upper Kalskag
Of the total 62 dwellings in Upper Kalskag, owner-occupied units account for 44 (71.0%), while renter-occupied units make up 18 (29.0%).
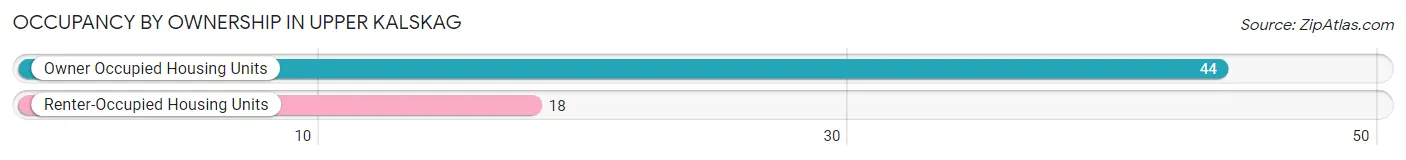
| Occupancy | # Housing Units | % Housing Units |
| Owner Occupied Housing Units | 44 | 71.0% |
| Renter-Occupied Housing Units | 18 | 29.0% |
| Total Occupied Housing Units | 62 | 100.0% |
Occupancy by Household Size in Upper Kalskag
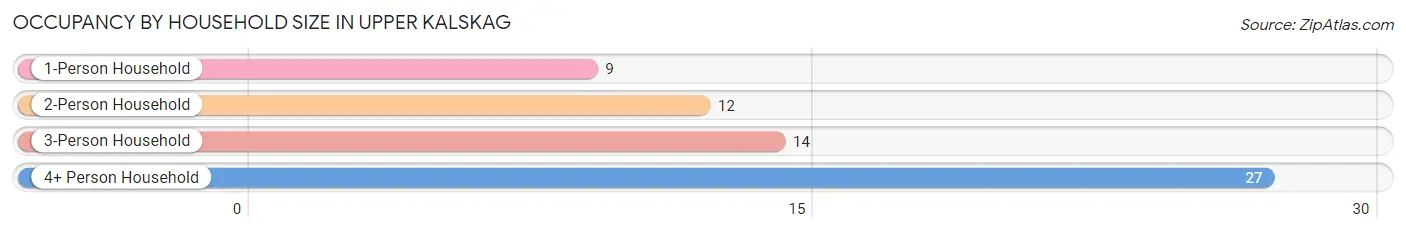
| Household Size | # Housing Units | % Housing Units |
| 1-Person Household | 9 | 14.5% |
| 2-Person Household | 12 | 19.4% |
| 3-Person Household | 14 | 22.6% |
| 4+ Person Household | 27 | 43.5% |
| Total Housing Units | 62 | 100.0% |
Occupancy by Ownership by Household Size in Upper Kalskag
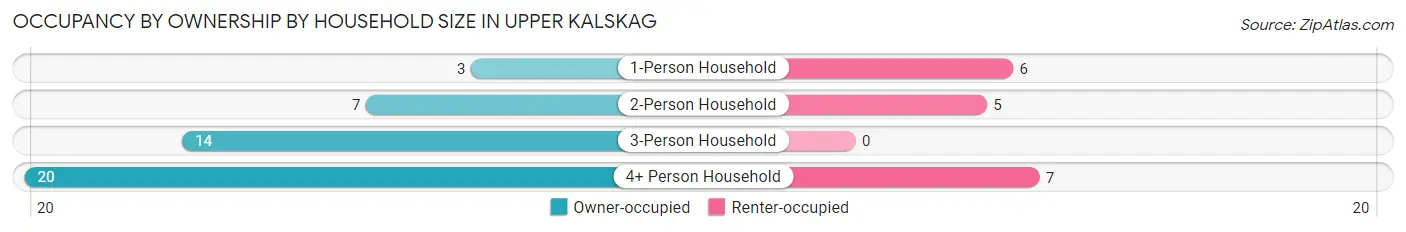
| Household Size | Owner-occupied | Renter-occupied |
| 1-Person Household | 3 (33.3%) | 6 (66.7%) |
| 2-Person Household | 7 (58.3%) | 5 (41.7%) |
| 3-Person Household | 14 (100.0%) | 0 (0.0%) |
| 4+ Person Household | 20 (74.1%) | 7 (25.9%) |
| Total Housing Units | 44 (71.0%) | 18 (29.0%) |
Occupancy by Educational Attainment in Upper Kalskag
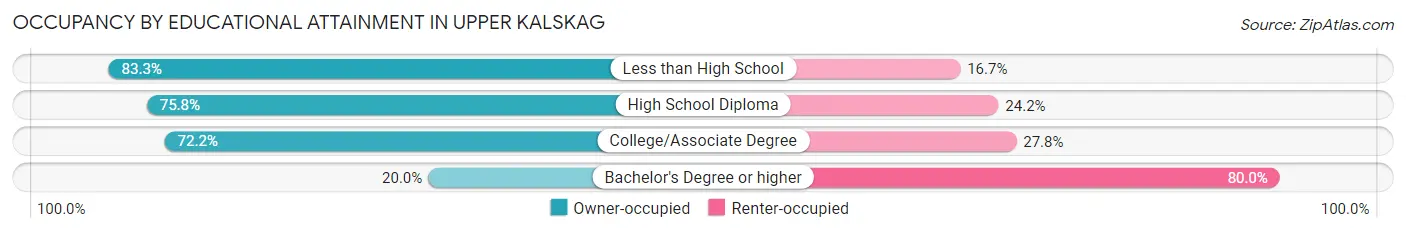
| Household Size | Owner-occupied | Renter-occupied |
| Less than High School | 5 (83.3%) | 1 (16.7%) |
| High School Diploma | 25 (75.8%) | 8 (24.2%) |
| College/Associate Degree | 13 (72.2%) | 5 (27.8%) |
| Bachelor's Degree or higher | 1 (20.0%) | 4 (80.0%) |
Occupancy by Age of Householder in Upper Kalskag
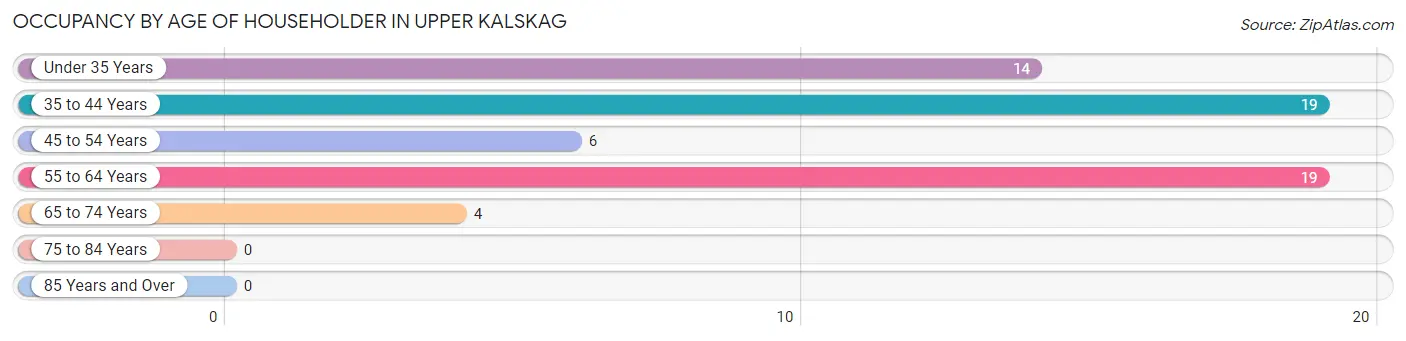
| Age Bracket | # Households | % Households |
| Under 35 Years | 14 | 22.6% |
| 35 to 44 Years | 19 | 30.6% |
| 45 to 54 Years | 6 | 9.7% |
| 55 to 64 Years | 19 | 30.6% |
| 65 to 74 Years | 4 | 6.5% |
| 75 to 84 Years | 0 | 0.0% |
| 85 Years and Over | 0 | 0.0% |
| Total | 62 | 100.0% |
Housing Finances in Upper Kalskag
Median Income by Occupancy in Upper Kalskag
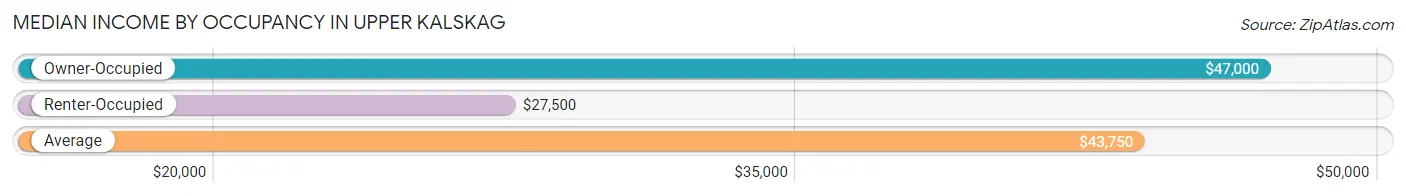
| Occupancy Type | # Households | Median Income |
| Owner-Occupied | 44 (71.0%) | $47,000 |
| Renter-Occupied | 18 (29.0%) | $27,500 |
| Average | 62 (100.0%) | $43,750 |
Occupancy by Householder Income Bracket in Upper Kalskag
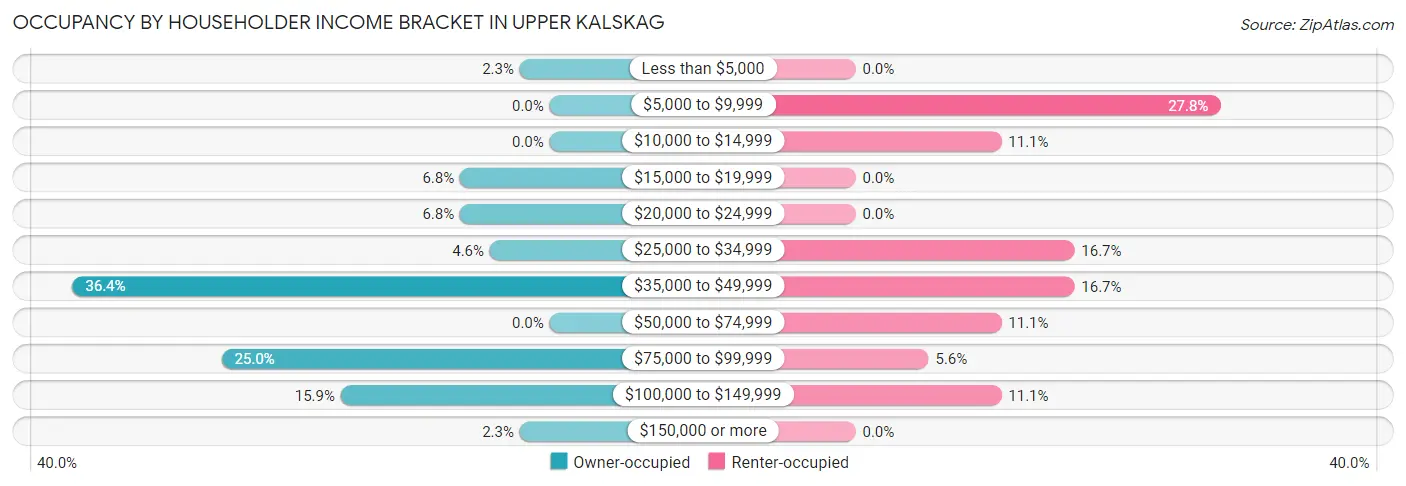
| Income Bracket | Owner-occupied | Renter-occupied |
| Less than $5,000 | 1 (2.3%) | 0 (0.0%) |
| $5,000 to $9,999 | 0 (0.0%) | 5 (27.8%) |
| $10,000 to $14,999 | 0 (0.0%) | 2 (11.1%) |
| $15,000 to $19,999 | 3 (6.8%) | 0 (0.0%) |
| $20,000 to $24,999 | 3 (6.8%) | 0 (0.0%) |
| $25,000 to $34,999 | 2 (4.5%) | 3 (16.7%) |
| $35,000 to $49,999 | 16 (36.4%) | 3 (16.7%) |
| $50,000 to $74,999 | 0 (0.0%) | 2 (11.1%) |
| $75,000 to $99,999 | 11 (25.0%) | 1 (5.6%) |
| $100,000 to $149,999 | 7 (15.9%) | 2 (11.1%) |
| $150,000 or more | 1 (2.3%) | 0 (0.0%) |
| Total | 44 (100.0%) | 18 (100.0%) |
Monthly Housing Cost Tiers in Upper Kalskag
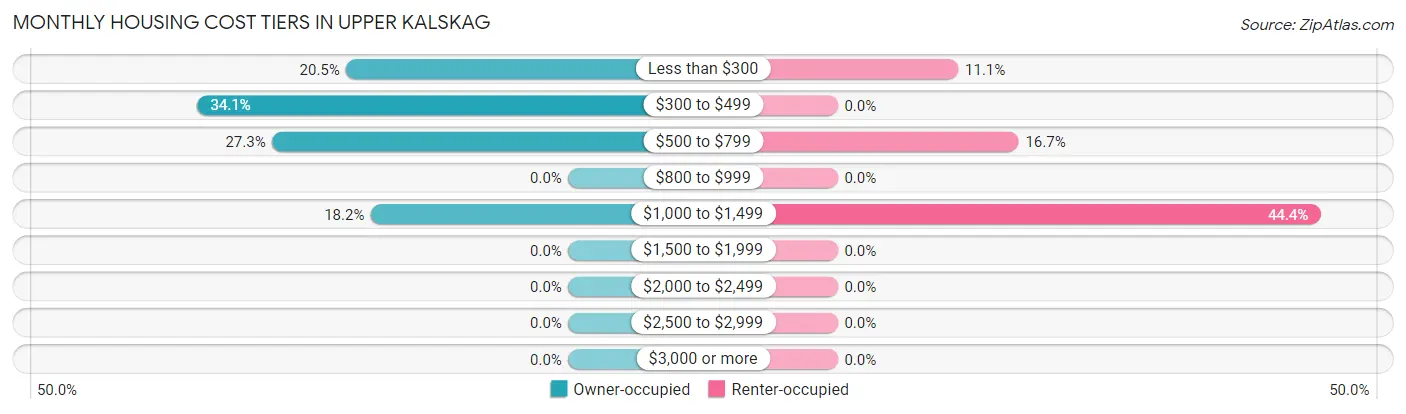
| Monthly Cost | Owner-occupied | Renter-occupied |
| Less than $300 | 9 (20.4%) | 2 (11.1%) |
| $300 to $499 | 15 (34.1%) | 0 (0.0%) |
| $500 to $799 | 12 (27.3%) | 3 (16.7%) |
| $800 to $999 | 0 (0.0%) | 0 (0.0%) |
| $1,000 to $1,499 | 8 (18.2%) | 8 (44.4%) |
| $1,500 to $1,999 | 0 (0.0%) | 0 (0.0%) |
| $2,000 to $2,499 | 0 (0.0%) | 0 (0.0%) |
| $2,500 to $2,999 | 0 (0.0%) | 0 (0.0%) |
| $3,000 or more | 0 (0.0%) | 0 (0.0%) |
| Total | 44 (100.0%) | 18 (100.0%) |
Physical Housing Characteristics in Upper Kalskag
Housing Structures in Upper Kalskag
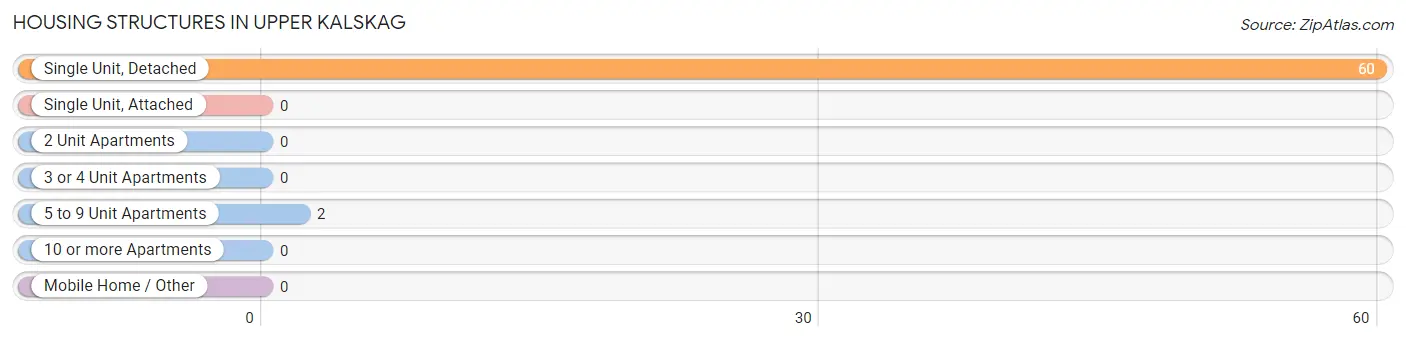
| Structure Type | # Housing Units | % Housing Units |
| Single Unit, Detached | 60 | 96.8% |
| Single Unit, Attached | 0 | 0.0% |
| 2 Unit Apartments | 0 | 0.0% |
| 3 or 4 Unit Apartments | 0 | 0.0% |
| 5 to 9 Unit Apartments | 2 | 3.2% |
| 10 or more Apartments | 0 | 0.0% |
| Mobile Home / Other | 0 | 0.0% |
| Total | 62 | 100.0% |
Housing Structures by Occupancy in Upper Kalskag
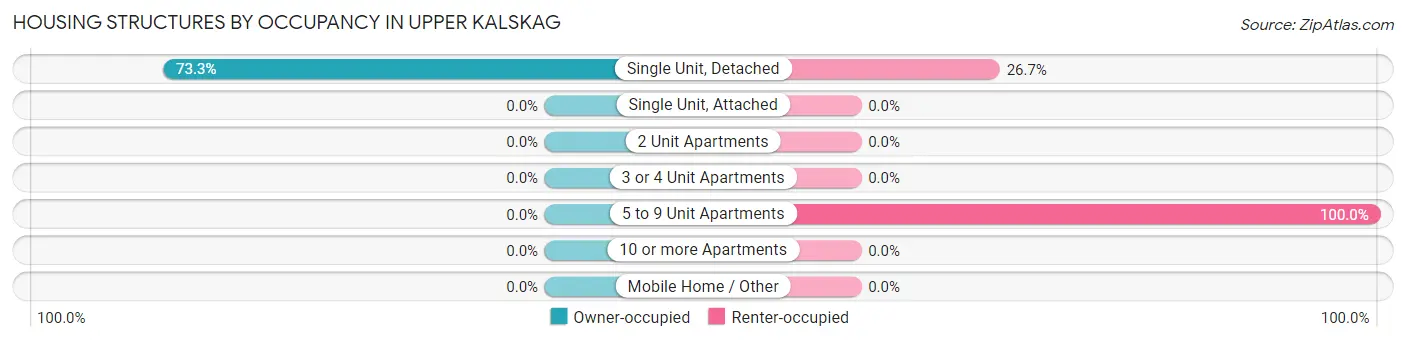
| Structure Type | Owner-occupied | Renter-occupied |
| Single Unit, Detached | 44 (73.3%) | 16 (26.7%) |
| Single Unit, Attached | 0 (0.0%) | 0 (0.0%) |
| 2 Unit Apartments | 0 (0.0%) | 0 (0.0%) |
| 3 or 4 Unit Apartments | 0 (0.0%) | 0 (0.0%) |
| 5 to 9 Unit Apartments | 0 (0.0%) | 2 (100.0%) |
| 10 or more Apartments | 0 (0.0%) | 0 (0.0%) |
| Mobile Home / Other | 0 (0.0%) | 0 (0.0%) |
| Total | 44 (71.0%) | 18 (29.0%) |
Housing Structures by Number of Rooms in Upper Kalskag
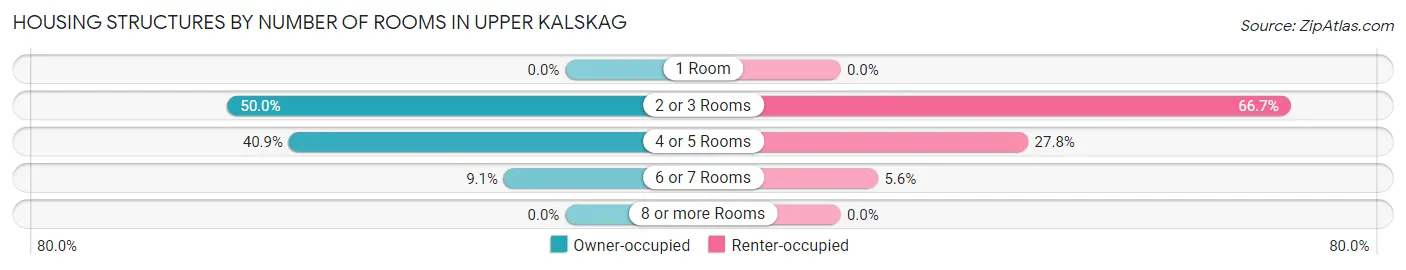
| Number of Rooms | Owner-occupied | Renter-occupied |
| 1 Room | 0 (0.0%) | 0 (0.0%) |
| 2 or 3 Rooms | 22 (50.0%) | 12 (66.7%) |
| 4 or 5 Rooms | 18 (40.9%) | 5 (27.8%) |
| 6 or 7 Rooms | 4 (9.1%) | 1 (5.6%) |
| 8 or more Rooms | 0 (0.0%) | 0 (0.0%) |
| Total | 44 (100.0%) | 18 (100.0%) |
Housing Structure by Heating Type in Upper Kalskag
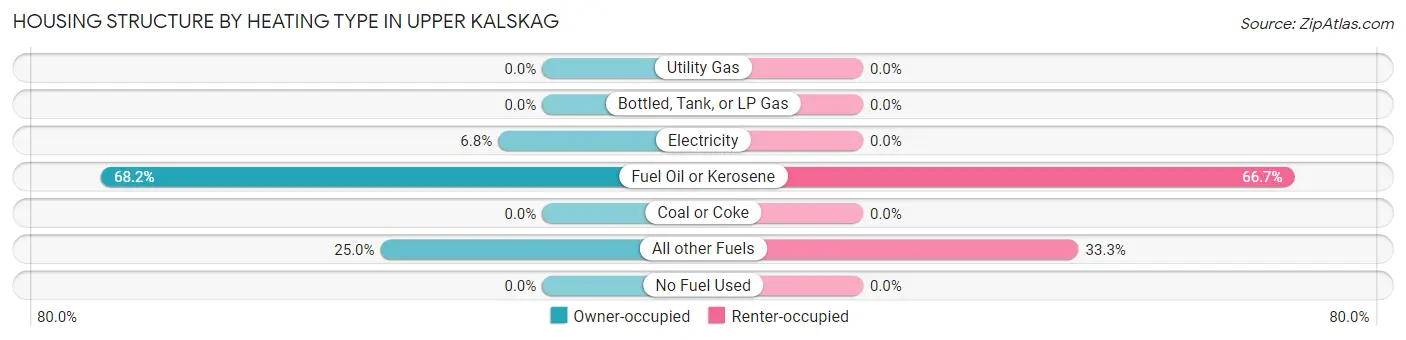
| Heating Type | Owner-occupied | Renter-occupied |
| Utility Gas | 0 (0.0%) | 0 (0.0%) |
| Bottled, Tank, or LP Gas | 0 (0.0%) | 0 (0.0%) |
| Electricity | 3 (6.8%) | 0 (0.0%) |
| Fuel Oil or Kerosene | 30 (68.2%) | 12 (66.7%) |
| Coal or Coke | 0 (0.0%) | 0 (0.0%) |
| All other Fuels | 11 (25.0%) | 6 (33.3%) |
| No Fuel Used | 0 (0.0%) | 0 (0.0%) |
| Total | 44 (100.0%) | 18 (100.0%) |
Household Vehicle Usage in Upper Kalskag
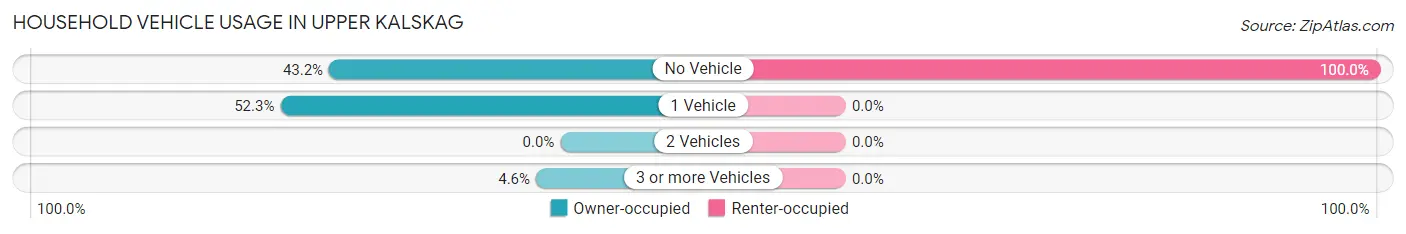
| Vehicles per Household | Owner-occupied | Renter-occupied |
| No Vehicle | 19 (43.2%) | 18 (100.0%) |
| 1 Vehicle | 23 (52.3%) | 0 (0.0%) |
| 2 Vehicles | 0 (0.0%) | 0 (0.0%) |
| 3 or more Vehicles | 2 (4.5%) | 0 (0.0%) |
| Total | 44 (100.0%) | 18 (100.0%) |
Real Estate & Mortgages in Upper Kalskag
Real Estate and Mortgage Overview in Upper Kalskag
| Characteristic | Without Mortgage | With Mortgage |
| Housing Units | 19 | 25 |
| Median Property Value | $146,900 | $217,900 |
| Median Household Income | $40,417 | $0 |
| Monthly Housing Costs | $304 | $0 |
| Real Estate Taxes | - | - |
Property Value by Mortgage Status in Upper Kalskag
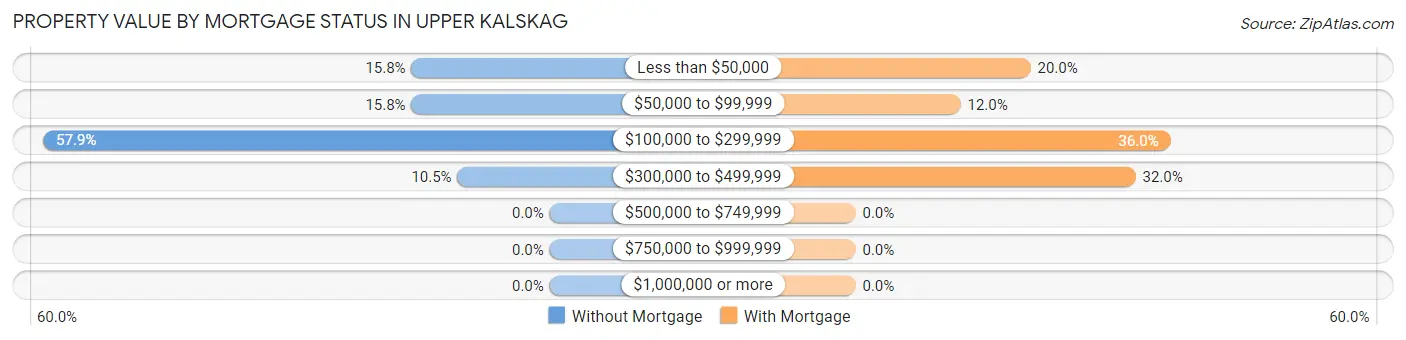
| Property Value | Without Mortgage | With Mortgage |
| Less than $50,000 | 3 (15.8%) | 5 (20.0%) |
| $50,000 to $99,999 | 3 (15.8%) | 3 (12.0%) |
| $100,000 to $299,999 | 11 (57.9%) | 9 (36.0%) |
| $300,000 to $499,999 | 2 (10.5%) | 8 (32.0%) |
| $500,000 to $749,999 | 0 (0.0%) | 0 (0.0%) |
| $750,000 to $999,999 | 0 (0.0%) | 0 (0.0%) |
| $1,000,000 or more | 0 (0.0%) | 0 (0.0%) |
| Total | 19 (100.0%) | 25 (100.0%) |
Household Income by Mortgage Status in Upper Kalskag
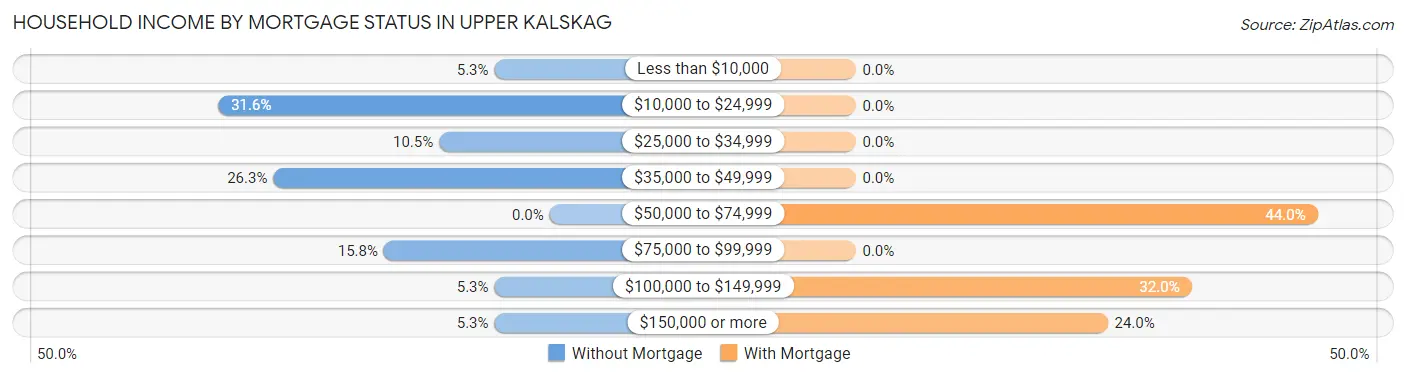
| Household Income | Without Mortgage | With Mortgage |
| Less than $10,000 | 1 (5.3%) | 0 (0.0%) |
| $10,000 to $24,999 | 6 (31.6%) | 0 (0.0%) |
| $25,000 to $34,999 | 2 (10.5%) | 0 (0.0%) |
| $35,000 to $49,999 | 5 (26.3%) | 0 (0.0%) |
| $50,000 to $74,999 | 0 (0.0%) | 11 (44.0%) |
| $75,000 to $99,999 | 3 (15.8%) | 0 (0.0%) |
| $100,000 to $149,999 | 1 (5.3%) | 8 (32.0%) |
| $150,000 or more | 1 (5.3%) | 6 (24.0%) |
| Total | 19 (100.0%) | 25 (100.0%) |
Property Value to Household Income Ratio in Upper Kalskag
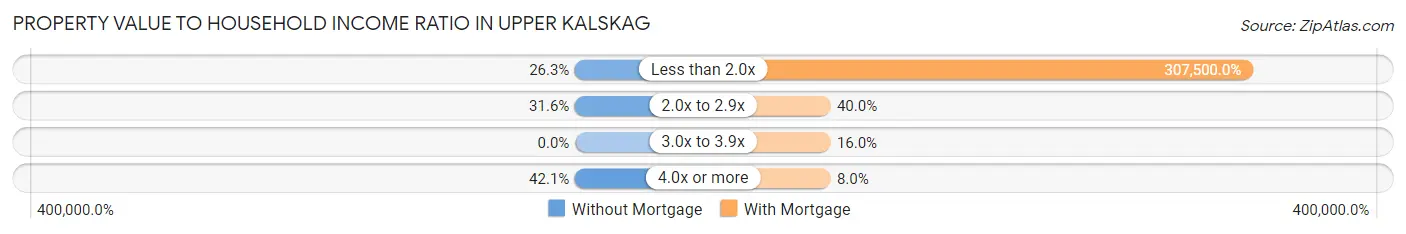
| Value-to-Income Ratio | Without Mortgage | With Mortgage |
| Less than 2.0x | 5 (26.3%) | 76,875 (307,500.0%) |
| 2.0x to 2.9x | 6 (31.6%) | 10 (40.0%) |
| 3.0x to 3.9x | 0 (0.0%) | 4 (16.0%) |
| 4.0x or more | 8 (42.1%) | 2 (8.0%) |
| Total | 19 (100.0%) | 25 (100.0%) |
Real Estate Taxes by Mortgage Status in Upper Kalskag
| Property Taxes | Without Mortgage | With Mortgage |
| Less than $800 | 0 (0.0%) | 0 (0.0%) |
| $800 to $1,499 | 0 (0.0%) | 0 (0.0%) |
| $800 to $1,499 | 0 (0.0%) | 0 (0.0%) |
| Total | 19 (100.0%) | 25 (100.0%) |
Health & Disability in Upper Kalskag
Health Insurance Coverage by Age in Upper Kalskag
| Age Bracket | With Coverage | Without Coverage |
| Under 6 Years | 46 (95.8%) | 2 (4.2%) |
| 6 to 18 Years | 76 (96.2%) | 3 (3.8%) |
| 19 to 25 Years | 15 (75.0%) | 5 (25.0%) |
| 26 to 34 Years | 23 (76.7%) | 7 (23.3%) |
| 35 to 44 Years | 21 (87.5%) | 3 (12.5%) |
| 45 to 54 Years | 10 (58.8%) | 7 (41.2%) |
| 55 to 64 Years | 24 (82.8%) | 5 (17.2%) |
| 65 to 74 Years | 4 (100.0%) | 0 (0.0%) |
| 75 Years and older | 2 (100.0%) | 0 (0.0%) |
| Total | 221 (87.4%) | 32 (12.7%) |
Health Insurance Coverage by Citizenship Status in Upper Kalskag
| Citizenship Status | With Coverage | Without Coverage |
| Native Born | 46 (95.8%) | 2 (4.2%) |
| Foreign Born, Citizen | 76 (96.2%) | 3 (3.8%) |
| Foreign Born, not a Citizen | 15 (75.0%) | 5 (25.0%) |
Health Insurance Coverage by Household Income in Upper Kalskag
| Household Income | With Coverage | Without Coverage |
| Under $25,000 | 17 (73.9%) | 6 (26.1%) |
| $25,000 to $49,999 | 79 (85.9%) | 13 (14.1%) |
| $50,000 to $74,999 | 2 (100.0%) | 0 (0.0%) |
| $75,000 to $99,999 | 40 (100.0%) | 0 (0.0%) |
| $100,000 and over | 83 (86.5%) | 13 (13.5%) |
Public vs Private Health Insurance Coverage by Age in Upper Kalskag
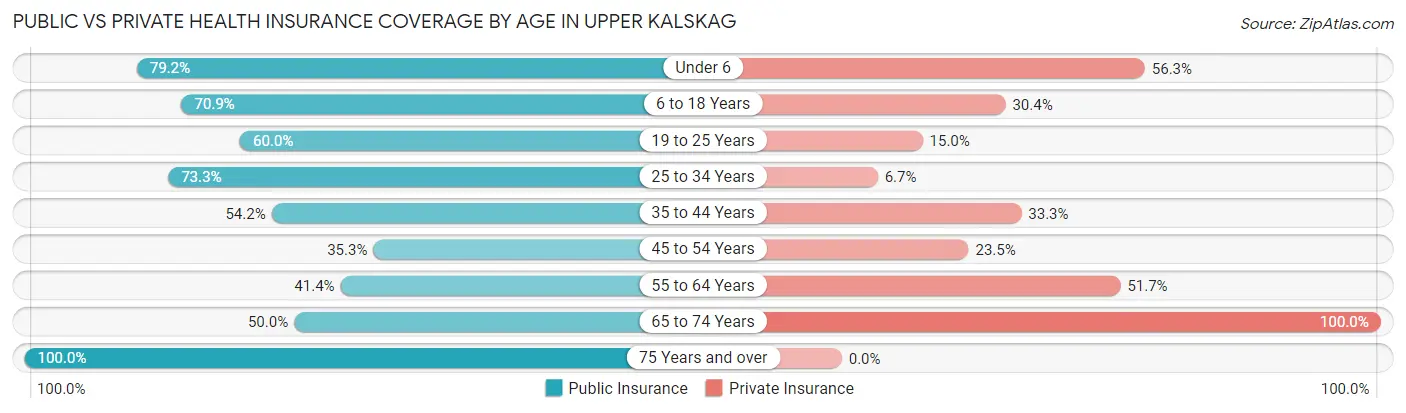
| Age Bracket | Public Insurance | Private Insurance |
| Under 6 | 38 (79.2%) | 27 (56.2%) |
| 6 to 18 Years | 56 (70.9%) | 24 (30.4%) |
| 19 to 25 Years | 12 (60.0%) | 3 (15.0%) |
| 25 to 34 Years | 22 (73.3%) | 2 (6.7%) |
| 35 to 44 Years | 13 (54.2%) | 8 (33.3%) |
| 45 to 54 Years | 6 (35.3%) | 4 (23.5%) |
| 55 to 64 Years | 12 (41.4%) | 15 (51.7%) |
| 65 to 74 Years | 2 (50.0%) | 4 (100.0%) |
| 75 Years and over | 2 (100.0%) | 0 (0.0%) |
| Total | 163 (64.4%) | 87 (34.4%) |
Disability Status by Sex by Age in Upper Kalskag
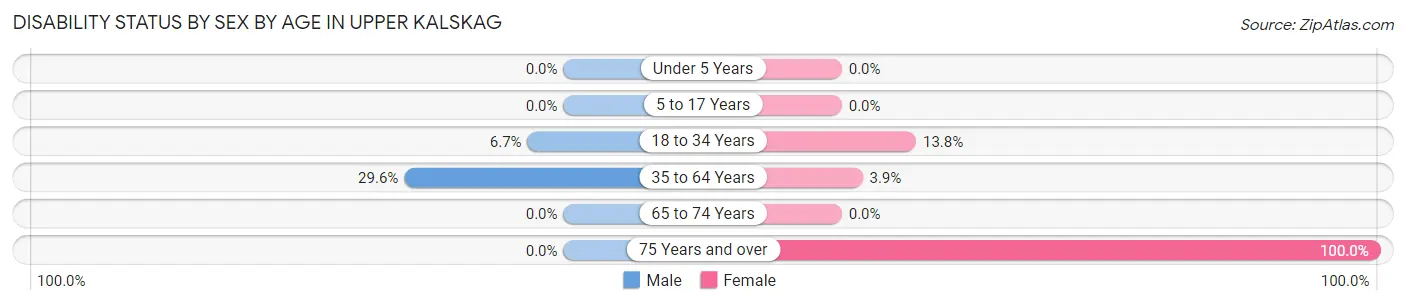
| Age Bracket | Male | Female |
| Under 5 Years | 0 (0.0%) | 0 (0.0%) |
| 5 to 17 Years | 0 (0.0%) | 0 (0.0%) |
| 18 to 34 Years | 2 (6.7%) | 4 (13.8%) |
| 35 to 64 Years | 13 (29.5%) | 1 (3.8%) |
| 65 to 74 Years | 0 (0.0%) | 0 (0.0%) |
| 75 Years and over | 0 (0.0%) | 2 (100.0%) |
Disability Class by Sex by Age in Upper Kalskag
Disability Class: Hearing Difficulty
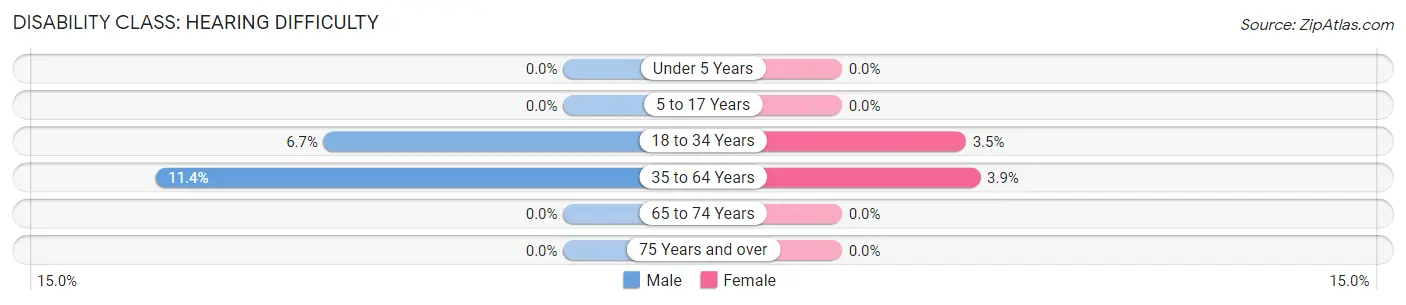
| Age Bracket | Male | Female |
| Under 5 Years | 0 (0.0%) | 0 (0.0%) |
| 5 to 17 Years | 0 (0.0%) | 0 (0.0%) |
| 18 to 34 Years | 2 (6.7%) | 1 (3.5%) |
| 35 to 64 Years | 5 (11.4%) | 1 (3.8%) |
| 65 to 74 Years | 0 (0.0%) | 0 (0.0%) |
| 75 Years and over | 0 (0.0%) | 0 (0.0%) |
Disability Class: Vision Difficulty
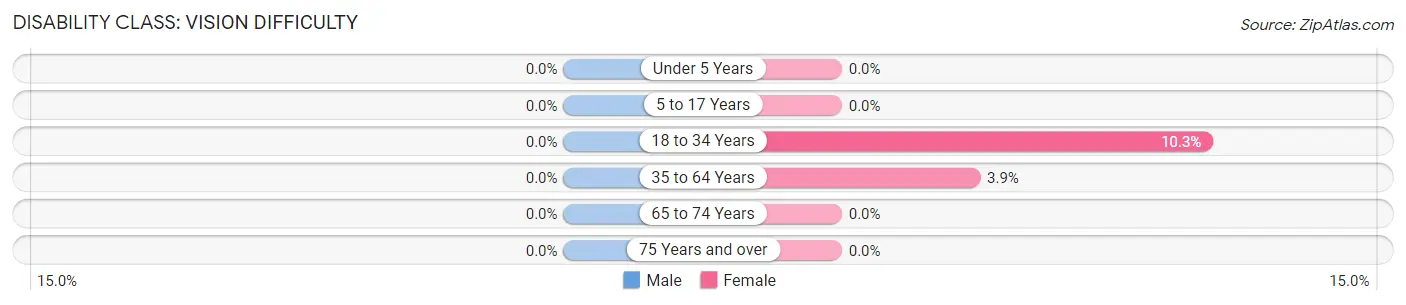
| Age Bracket | Male | Female |
| Under 5 Years | 0 (0.0%) | 0 (0.0%) |
| 5 to 17 Years | 0 (0.0%) | 0 (0.0%) |
| 18 to 34 Years | 0 (0.0%) | 3 (10.3%) |
| 35 to 64 Years | 0 (0.0%) | 1 (3.8%) |
| 65 to 74 Years | 0 (0.0%) | 0 (0.0%) |
| 75 Years and over | 0 (0.0%) | 0 (0.0%) |
Disability Class: Cognitive Difficulty
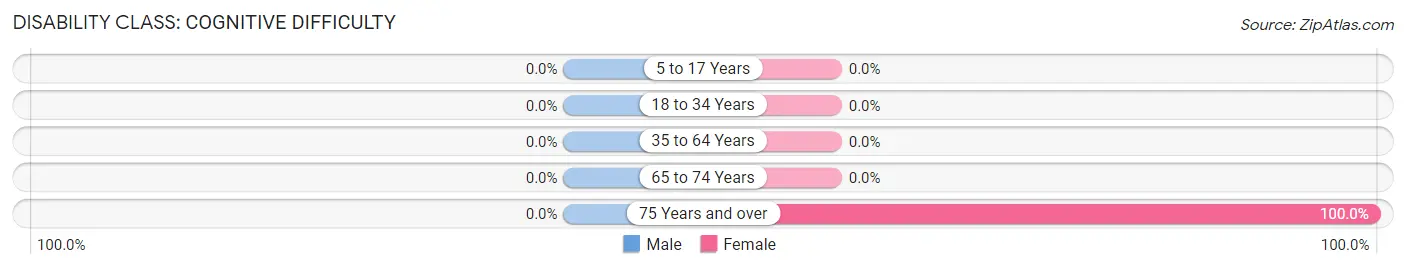
| Age Bracket | Male | Female |
| 5 to 17 Years | 0 (0.0%) | 0 (0.0%) |
| 18 to 34 Years | 0 (0.0%) | 0 (0.0%) |
| 35 to 64 Years | 0 (0.0%) | 0 (0.0%) |
| 65 to 74 Years | 0 (0.0%) | 0 (0.0%) |
| 75 Years and over | 0 (0.0%) | 2 (100.0%) |
Disability Class: Ambulatory Difficulty
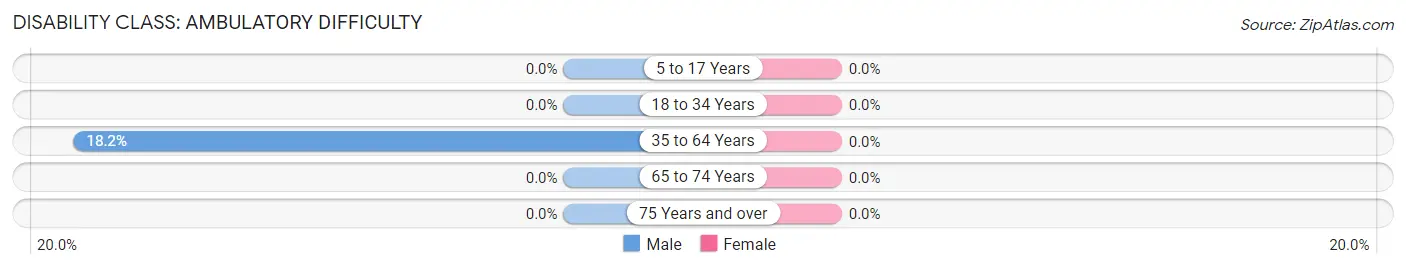
| Age Bracket | Male | Female |
| 5 to 17 Years | 0 (0.0%) | 0 (0.0%) |
| 18 to 34 Years | 0 (0.0%) | 0 (0.0%) |
| 35 to 64 Years | 8 (18.2%) | 0 (0.0%) |
| 65 to 74 Years | 0 (0.0%) | 0 (0.0%) |
| 75 Years and over | 0 (0.0%) | 0 (0.0%) |
Disability Class: Self-Care Difficulty
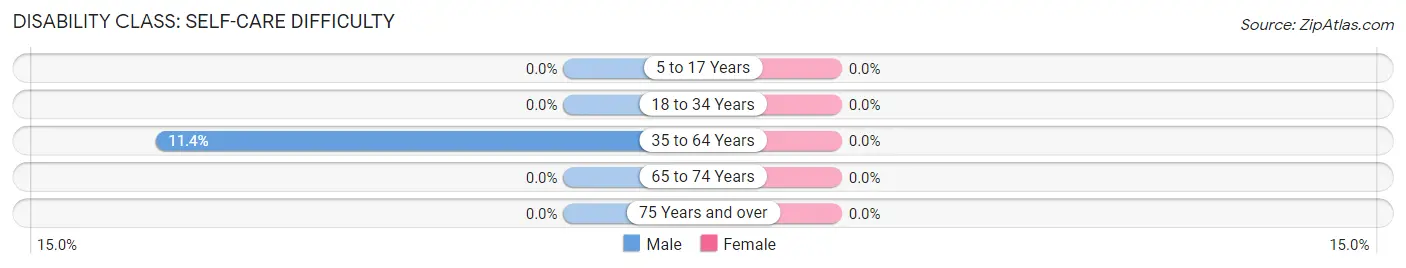
| Age Bracket | Male | Female |
| 5 to 17 Years | 0 (0.0%) | 0 (0.0%) |
| 18 to 34 Years | 0 (0.0%) | 0 (0.0%) |
| 35 to 64 Years | 5 (11.4%) | 0 (0.0%) |
| 65 to 74 Years | 0 (0.0%) | 0 (0.0%) |
| 75 Years and over | 0 (0.0%) | 0 (0.0%) |
Technology Access in Upper Kalskag
Computing Device Access in Upper Kalskag
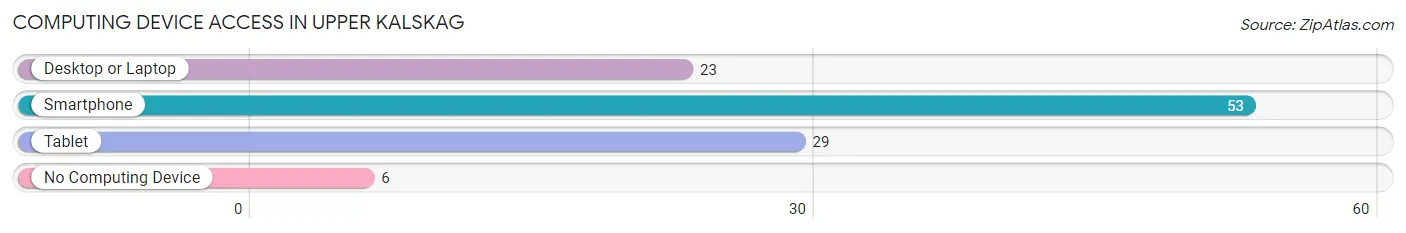
| Device Type | # Households | % Households |
| Desktop or Laptop | 23 | 37.1% |
| Smartphone | 53 | 85.5% |
| Tablet | 29 | 46.8% |
| No Computing Device | 6 | 9.7% |
| Total | 62 | 100.0% |
Internet Access in Upper Kalskag
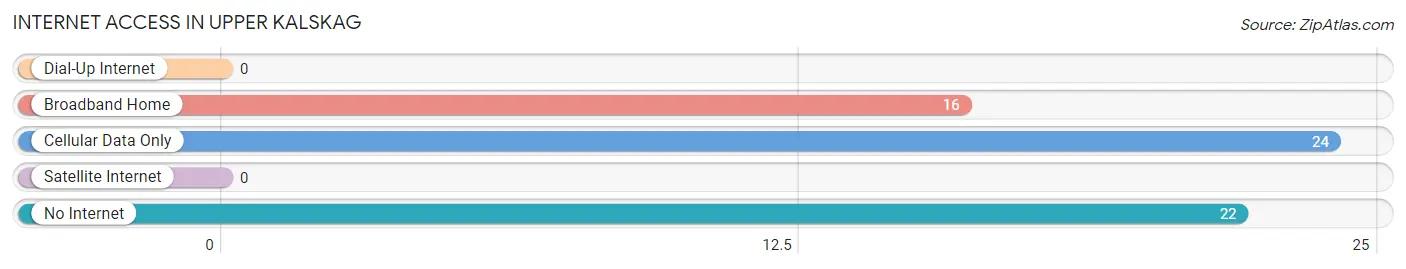
| Internet Type | # Households | % Households |
| Dial-Up Internet | 0 | 0.0% |
| Broadband Home | 16 | 25.8% |
| Cellular Data Only | 24 | 38.7% |
| Satellite Internet | 0 | 0.0% |
| No Internet | 22 | 35.5% |
| Total | 62 | 100.0% |
Upper Kalskag Summary
Upper Kalskag is a small city located in the Bethel Census Area of Alaska. It is situated on the north bank of the Kuskokwim River, about 40 miles upstream from the city of Bethel. The population of Upper Kalskag was 545 at the 2010 census, making it the smallest incorporated city in Alaska.
History
Upper Kalskag was first settled by Yup'ik Eskimos in the late 1800s. The name "Kalskag" is derived from the Yup'ik word for "big river". The village was originally located on the south bank of the Kuskokwim River, but was moved to the north bank in the early 1900s due to flooding.
In the early 1900s, Upper Kalskag was a trading post for fur traders and trappers. In the 1920s, the Alaska Native Brotherhood established a chapter in the village. In the 1930s, the Alaska Territorial Guard was formed in Upper Kalskag.
In the 1950s, Upper Kalskag was incorporated as a city. In the 1960s, the city was connected to the outside world by the Alaska Railroad. In the 1970s, the city was connected to the outside world by the Alaska Highway.
Geography
Upper Kalskag is located at the confluence of the Kuskokwim and Kalskag Rivers. The city is situated on the north bank of the Kuskokwim River, about 40 miles upstream from the city of Bethel. The terrain around Upper Kalskag is mostly flat, with some hills and mountains in the distance.
The climate in Upper Kalskag is subarctic, with long, cold winters and short, cool summers. The average temperature in January is -14°F, and the average temperature in July is 57°F.
Economy
The economy of Upper Kalskag is largely based on subsistence fishing and hunting. The city is also home to a small commercial fishing fleet.
The city is served by the Upper Kalskag Airport, which offers scheduled flights to Bethel and Anchorage. The city is also served by the Alaska Railroad, which offers passenger and freight service to Anchorage and Fairbanks.
Demographics
As of the 2010 census, the population of Upper Kalskag was 545. The racial makeup of the city was 95.3% Native American, 2.2% White, 0.2% Asian, 0.2% Pacific Islander, and 1.9% from two or more races.
The median household income in Upper Kalskag was $25,000, and the median family income was $30,000. The per capita income in the city was $13,000. About 24.3% of the population was below the poverty line.
Common Questions
What is Per Capita Income in Upper Kalskag?
Per Capita income in Upper Kalskag is $14,617.
What is the Median Family Income in Upper Kalskag?
Median Family Income in Upper Kalskag is $42,188.
What is the Median Household income in Upper Kalskag?
Median Household Income in Upper Kalskag is $43,750.
What is Income or Wage Gap in Upper Kalskag?
Income or Wage Gap in Upper Kalskag is 28.9%.
Women in Upper Kalskag earn 71.1 cents for every dollar earned by a man.
What is Inequality or Gini Index in Upper Kalskag?
Inequality or Gini Index in Upper Kalskag is 0.40.
What is the Total Population of Upper Kalskag?
Total Population of Upper Kalskag is 253.
What is the Total Male Population of Upper Kalskag?
Total Male Population of Upper Kalskag is 137.
What is the Total Female Population of Upper Kalskag?
Total Female Population of Upper Kalskag is 116.
What is the Ratio of Males per 100 Females in Upper Kalskag?
There are 118.10 Males per 100 Females in Upper Kalskag.
What is the Ratio of Females per 100 Males in Upper Kalskag?
There are 84.67 Females per 100 Males in Upper Kalskag.
What is the Median Population Age in Upper Kalskag?
Median Population Age in Upper Kalskag is 18.9 Years.
What is the Average Family Size in Upper Kalskag
Average Family Size in Upper Kalskag is 4.6 People.
What is the Average Household Size in Upper Kalskag
Average Household Size in Upper Kalskag is 4.1 People.
How Large is the Labor Force in Upper Kalskag?
There are 95 People in the Labor Forcein in Upper Kalskag.
What is the Percentage of People in the Labor Force in Upper Kalskag?
67.4% of People are in the Labor Force in Upper Kalskag.
What is the Unemployment Rate in Upper Kalskag?
Unemployment Rate in Upper Kalskag is 26.3%.