Scammon Bay, AK Map & Demographics
Scammon Bay Map
Scammon Bay Overview
$10,118
PER CAPITA INCOME
$40,250
AVG FAMILY INCOME
$36,250
AVG HOUSEHOLD INCOME
51.7%
WAGE / INCOME GAP [ % ]
48.3¢/ $1
WAGE / INCOME GAP [ $ ]
0.39
INEQUALITY / GINI INDEX
506
TOTAL POPULATION
281
MALE POPULATION
225
FEMALE POPULATION
124.89
MALES / 100 FEMALES
80.07
FEMALES / 100 MALES
21.2
MEDIAN AGE
4.5
AVG FAMILY SIZE
4.0
AVG HOUSEHOLD SIZE
165
LABOR FORCE [ PEOPLE ]
57.7%
PERCENT IN LABOR FORCE
26.7%
UNEMPLOYMENT RATE
Scammon Bay Zip Codes
Scammon Bay Area Codes
Income in Scammon Bay
Income Overview in Scammon Bay
Per Capita Income in Scammon Bay is $10,118, while median incomes of families and households are $40,250 and $36,250 respectively.
| Characteristic | Number | Measure |
| Per Capita Income | 506 | $10,118 |
| Median Family Income | 102 | $40,250 |
| Mean Family Income | 102 | $44,298 |
| Median Household Income | 126 | $36,250 |
| Mean Household Income | 126 | $40,523 |
| Income Deficit | 102 | $0 |
| Wage / Income Gap (%) | 506 | 51.70% |
| Wage / Income Gap ($) | 506 | 48.30¢ per $1 |
| Gini / Inequality Index | 506 | 0.39 |
Earnings by Sex in Scammon Bay
Average Earnings in Scammon Bay are $19,688, $12,333 for men and $25,536 for women, a difference of 51.7%.
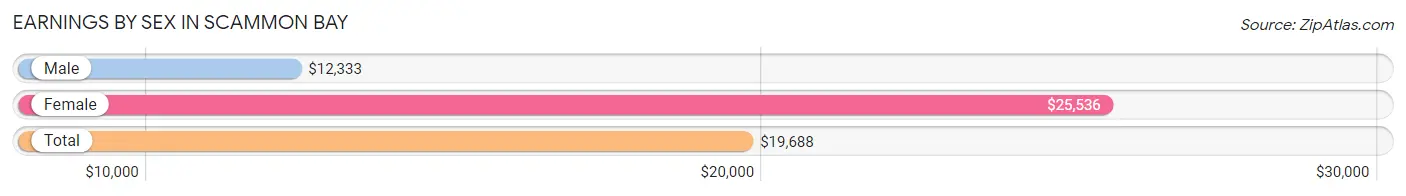
| Sex | Number | Average Earnings |
| Male | 88 (50.9%) | $12,333 |
| Female | 85 (49.1%) | $25,536 |
| Total | 173 (100.0%) | $19,688 |
Earnings by Sex by Income Bracket in Scammon Bay
The most common earnings brackets in Scammon Bay are $25,000 to $29,999 for men (19 | 21.6%) and $2,499 or less for women (18 | 21.2%).
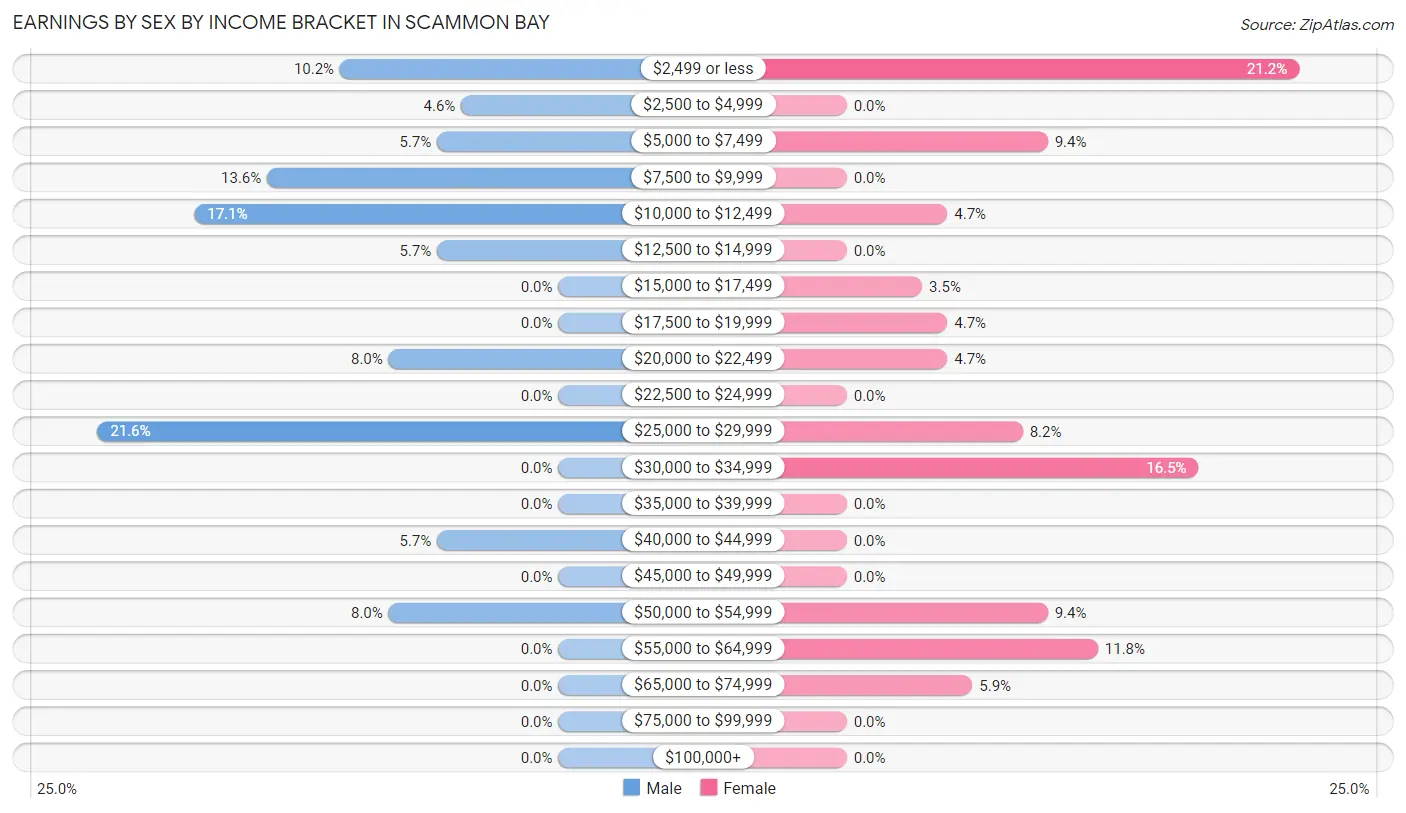
| Income | Male | Female |
| $2,499 or less | 9 (10.2%) | 18 (21.2%) |
| $2,500 to $4,999 | 4 (4.5%) | 0 (0.0%) |
| $5,000 to $7,499 | 5 (5.7%) | 8 (9.4%) |
| $7,500 to $9,999 | 12 (13.6%) | 0 (0.0%) |
| $10,000 to $12,499 | 15 (17.1%) | 4 (4.7%) |
| $12,500 to $14,999 | 5 (5.7%) | 0 (0.0%) |
| $15,000 to $17,499 | 0 (0.0%) | 3 (3.5%) |
| $17,500 to $19,999 | 0 (0.0%) | 4 (4.7%) |
| $20,000 to $22,499 | 7 (8.0%) | 4 (4.7%) |
| $22,500 to $24,999 | 0 (0.0%) | 0 (0.0%) |
| $25,000 to $29,999 | 19 (21.6%) | 7 (8.2%) |
| $30,000 to $34,999 | 0 (0.0%) | 14 (16.5%) |
| $35,000 to $39,999 | 0 (0.0%) | 0 (0.0%) |
| $40,000 to $44,999 | 5 (5.7%) | 0 (0.0%) |
| $45,000 to $49,999 | 0 (0.0%) | 0 (0.0%) |
| $50,000 to $54,999 | 7 (8.0%) | 8 (9.4%) |
| $55,000 to $64,999 | 0 (0.0%) | 10 (11.8%) |
| $65,000 to $74,999 | 0 (0.0%) | 5 (5.9%) |
| $75,000 to $99,999 | 0 (0.0%) | 0 (0.0%) |
| $100,000+ | 0 (0.0%) | 0 (0.0%) |
| Total | 88 (100.0%) | 85 (100.0%) |
Earnings by Sex by Educational Attainment in Scammon Bay
| Educational Attainment | Male Income | Female Income |
| Less than High School | - | - |
| High School Diploma | - | - |
| College or Associate's Degree | - | - |
| Bachelor's Degree | - | - |
| Graduate Degree | - | - |
| Total | - | - |
Family Income in Scammon Bay
Family Income Brackets in Scammon Bay
According to the Scammon Bay family income data, there are 25 families falling into the $50,000 to $74,999 income range, which is the most common income bracket and makes up 24.5% of all families.
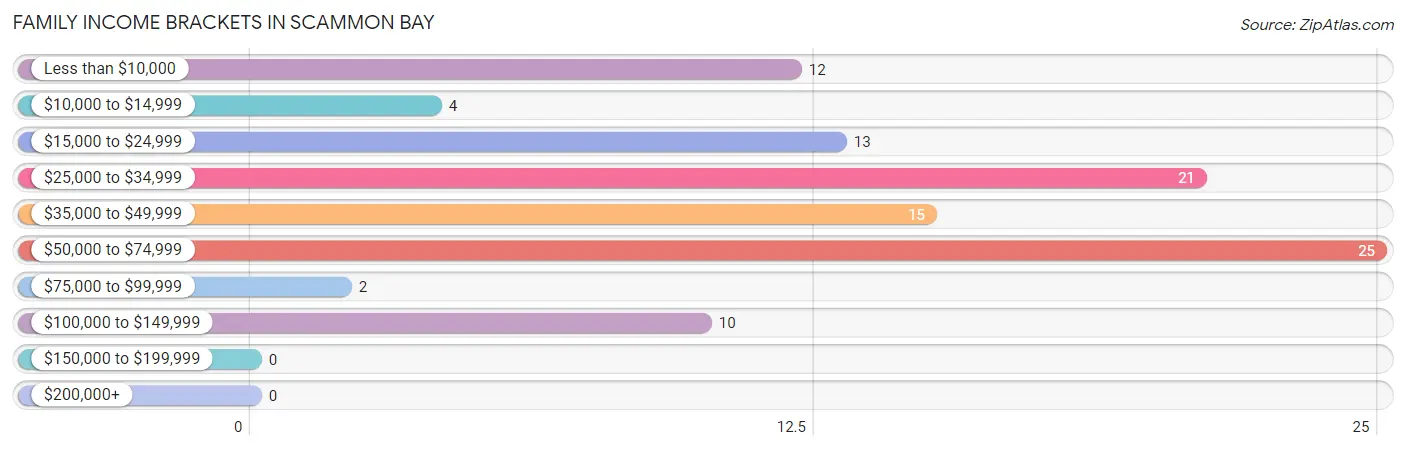
| Income Bracket | # Families | % Families |
| Less than $10,000 | 12 | 11.8% |
| $10,000 to $14,999 | 4 | 3.9% |
| $15,000 to $24,999 | 13 | 12.7% |
| $25,000 to $34,999 | 21 | 20.6% |
| $35,000 to $49,999 | 15 | 14.7% |
| $50,000 to $74,999 | 25 | 24.5% |
| $75,000 to $99,999 | 2 | 2.0% |
| $100,000 to $149,999 | 10 | 9.8% |
| $150,000 to $199,999 | 0 | 0.0% |
| $200,000+ | 0 | 0.0% |
Family Income by Famaliy Size in Scammon Bay
7+ person families (30 | 29.4%) account for the highest median family income in Scammon Bay with $55,833 per family, while 2-person families (15 | 14.7%) have the highest median income of $15,625 per family member.
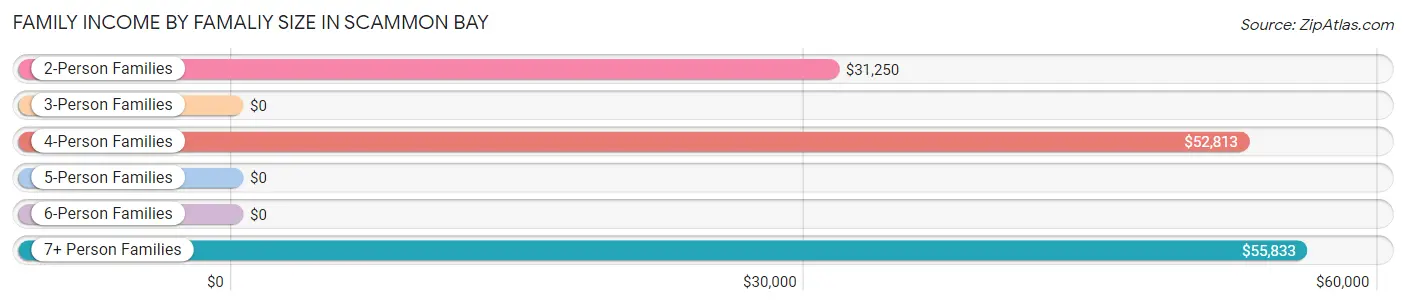
| Income Bracket | # Families | Median Income |
| 2-Person Families | 15 (14.7%) | $31,250 |
| 3-Person Families | 20 (19.6%) | $0 |
| 4-Person Families | 17 (16.7%) | $52,813 |
| 5-Person Families | 7 (6.9%) | $0 |
| 6-Person Families | 13 (12.8%) | $0 |
| 7+ Person Families | 30 (29.4%) | $55,833 |
| Total | 102 (100.0%) | $40,250 |
Family Income by Number of Earners in Scammon Bay
The median family income in Scammon Bay is $40,250, with families comprising 3+ earners (13) having the highest median family income of $85,625, while families with no earners (9) have the lowest median family income of $20,938, accounting for 12.8% and 8.8% of families, respectively.
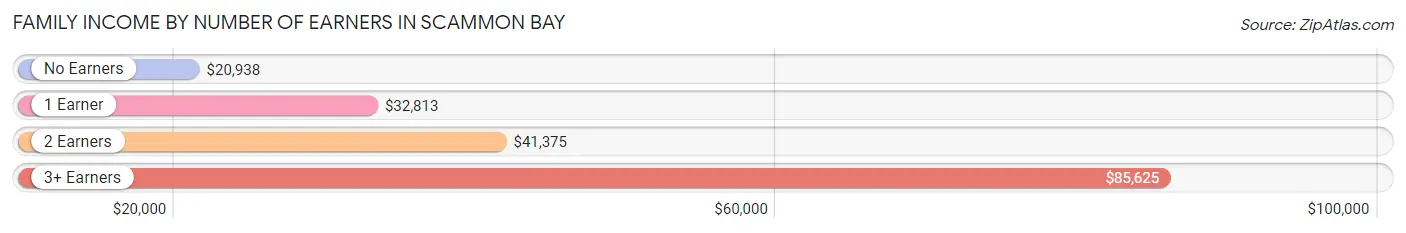
| Number of Earners | # Families | Median Income |
| No Earners | 9 (8.8%) | $20,938 |
| 1 Earner | 51 (50.0%) | $32,813 |
| 2 Earners | 29 (28.4%) | $41,375 |
| 3+ Earners | 13 (12.8%) | $85,625 |
| Total | 102 (100.0%) | $40,250 |
Household Income in Scammon Bay
Household Income Brackets in Scammon Bay
With 29 households falling in the category, the $50,000 to $74,999 income range is the most frequent in Scammon Bay, accounting for 23.0% of all households.
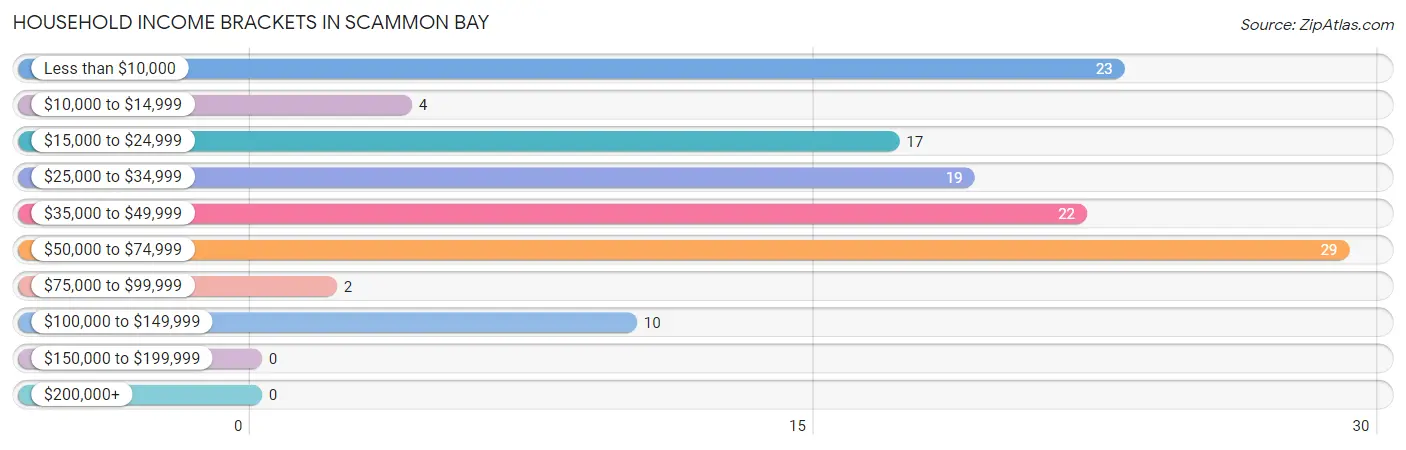
| Income Bracket | # Households | % Households |
| Less than $10,000 | 23 | 18.3% |
| $10,000 to $14,999 | 4 | 3.2% |
| $15,000 to $24,999 | 17 | 13.5% |
| $25,000 to $34,999 | 19 | 15.1% |
| $35,000 to $49,999 | 22 | 17.5% |
| $50,000 to $74,999 | 29 | 23.0% |
| $75,000 to $99,999 | 2 | 1.6% |
| $100,000 to $149,999 | 10 | 7.9% |
| $150,000 to $199,999 | 0 | 0.0% |
| $200,000+ | 0 | 0.0% |
Household Income by Householder Age in Scammon Bay
The median household income in Scammon Bay is $36,250, with the highest median household income of $42,917 found in the 25 to 44 years age bracket for the primary householder. A total of 66 households (52.4%) fall into this category. Meanwhile, the 15 to 24 years age bracket for the primary householder has the lowest median household income of $0, with 5 households (4.0%) in this group.
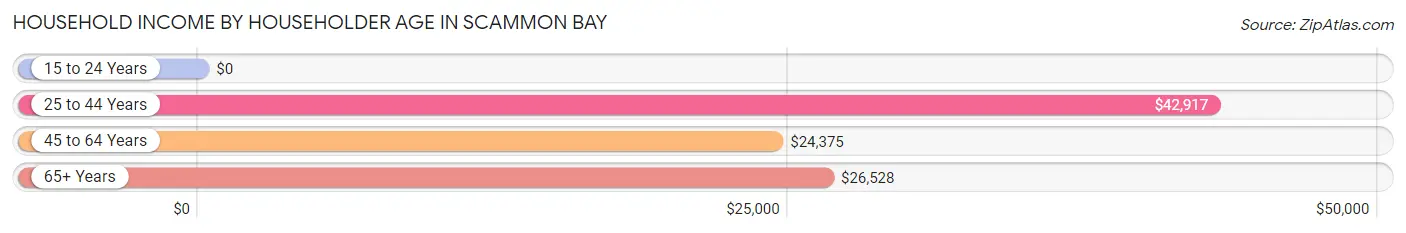
| Income Bracket | # Households | Median Income |
| 15 to 24 Years | 5 (4.0%) | $0 |
| 25 to 44 Years | 66 (52.4%) | $42,917 |
| 45 to 64 Years | 28 (22.2%) | $24,375 |
| 65+ Years | 27 (21.4%) | $26,528 |
| Total | 126 (100.0%) | $36,250 |
Poverty in Scammon Bay
Income Below Poverty by Sex and Age in Scammon Bay
With 48.7% poverty level for males and 48.0% for females among the residents of Scammon Bay, 5 year old males and 15 year old females are the most vulnerable to poverty, with 6 males (100.0%) and 3 females (100.0%) in their respective age groups living below the poverty level.
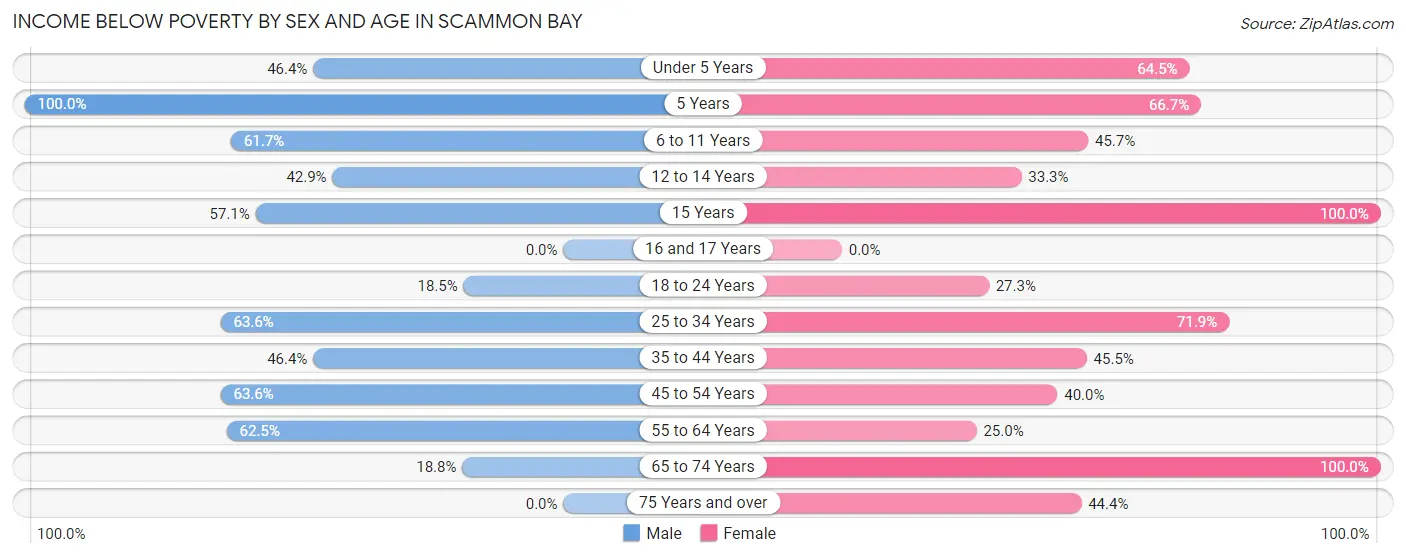
| Age Bracket | Male | Female |
| Under 5 Years | 26 (46.4%) | 20 (64.5%) |
| 5 Years | 6 (100.0%) | 8 (66.7%) |
| 6 to 11 Years | 29 (61.7%) | 16 (45.7%) |
| 12 to 14 Years | 6 (42.9%) | 3 (33.3%) |
| 15 Years | 4 (57.1%) | 3 (100.0%) |
| 16 and 17 Years | 0 (0.0%) | 0 (0.0%) |
| 18 to 24 Years | 5 (18.5%) | 9 (27.3%) |
| 25 to 34 Years | 28 (63.6%) | 23 (71.9%) |
| 35 to 44 Years | 13 (46.4%) | 15 (45.5%) |
| 45 to 54 Years | 7 (63.6%) | 2 (40.0%) |
| 55 to 64 Years | 10 (62.5%) | 3 (25.0%) |
| 65 to 74 Years | 3 (18.8%) | 2 (100.0%) |
| 75 Years and over | 0 (0.0%) | 4 (44.4%) |
| Total | 137 (48.7%) | 108 (48.0%) |
Income Above Poverty by Sex and Age in Scammon Bay
According to the poverty statistics in Scammon Bay, males aged 16 and 17 years and females aged 16 and 17 years are the age groups that are most secure financially, with 100.0% of males and 100.0% of females in these age groups living above the poverty line.
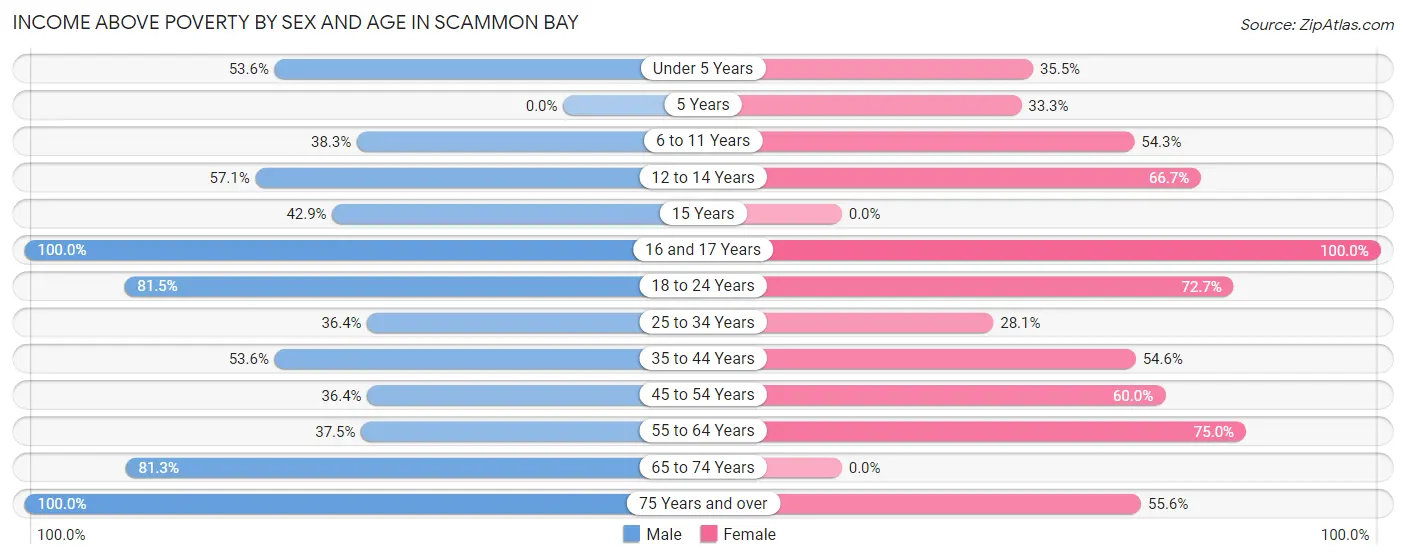
| Age Bracket | Male | Female |
| Under 5 Years | 30 (53.6%) | 11 (35.5%) |
| 5 Years | 0 (0.0%) | 4 (33.3%) |
| 6 to 11 Years | 18 (38.3%) | 19 (54.3%) |
| 12 to 14 Years | 8 (57.1%) | 6 (66.7%) |
| 15 Years | 3 (42.9%) | 0 (0.0%) |
| 16 and 17 Years | 7 (100.0%) | 9 (100.0%) |
| 18 to 24 Years | 22 (81.5%) | 24 (72.7%) |
| 25 to 34 Years | 16 (36.4%) | 9 (28.1%) |
| 35 to 44 Years | 15 (53.6%) | 18 (54.5%) |
| 45 to 54 Years | 4 (36.4%) | 3 (60.0%) |
| 55 to 64 Years | 6 (37.5%) | 9 (75.0%) |
| 65 to 74 Years | 13 (81.2%) | 0 (0.0%) |
| 75 Years and over | 2 (100.0%) | 5 (55.6%) |
| Total | 144 (51.2%) | 117 (52.0%) |
Income Below Poverty Among Married-Couple Families in Scammon Bay
The poverty statistics for married-couple families in Scammon Bay show that 40.4% or 21 of the total 52 families live below the poverty line. Families with 3 or 4 children have the highest poverty rate of 100.0%, comprising of 11 families. On the other hand, families with 1 or 2 children have the lowest poverty rate of 0.0%, which includes 0 families.
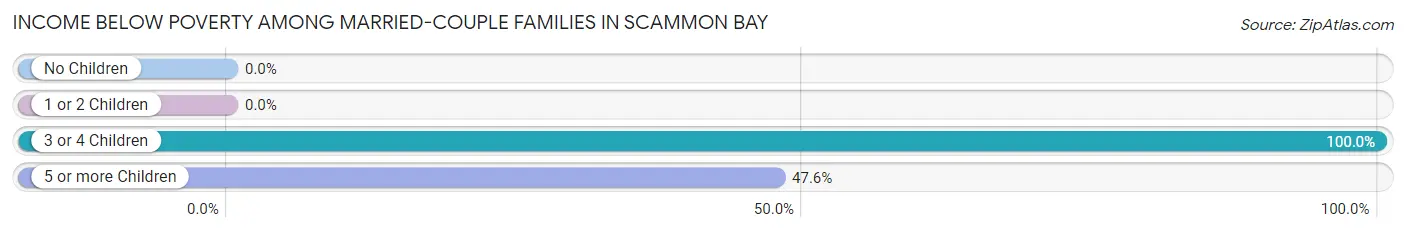
| Children | Above Poverty | Below Poverty |
| No Children | 0 (0.0%) | 0 (0.0%) |
| 1 or 2 Children | 20 (100.0%) | 0 (0.0%) |
| 3 or 4 Children | 0 (0.0%) | 11 (100.0%) |
| 5 or more Children | 11 (52.4%) | 10 (47.6%) |
| Total | 31 (59.6%) | 21 (40.4%) |
Income Below Poverty Among Single-Parent Households in Scammon Bay
According to the poverty data in Scammon Bay, 45.8% or 11 single-father households and 34.6% or 9 single-mother households are living below the poverty line. Among single-father households, those with 5 or more children have the highest poverty rate, with 4 households (100.0%) experiencing poverty. Likewise, among single-mother households, those with 1 or 2 children have the highest poverty rate, with 9 households (40.9%) falling below the poverty line.
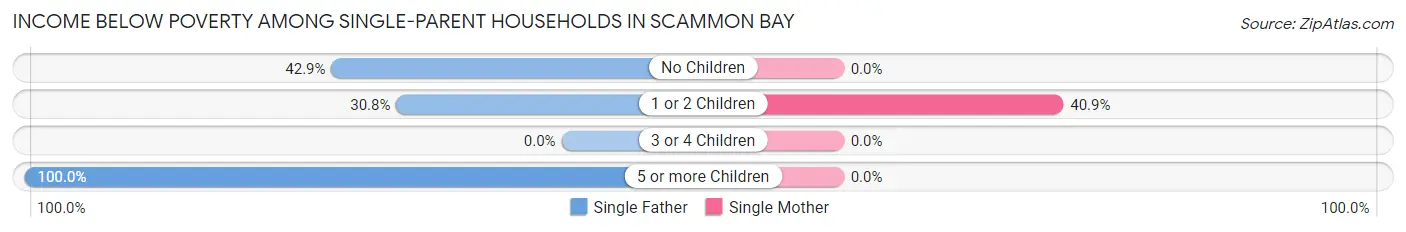
| Children | Single Father | Single Mother |
| No Children | 3 (42.9%) | 0 (0.0%) |
| 1 or 2 Children | 4 (30.8%) | 9 (40.9%) |
| 3 or 4 Children | 0 (0.0%) | 0 (0.0%) |
| 5 or more Children | 4 (100.0%) | 0 (0.0%) |
| Total | 11 (45.8%) | 9 (34.6%) |
Income Below Poverty Among Married-Couple vs Single-Parent Households in Scammon Bay
The poverty data for Scammon Bay shows that 21 of the married-couple family households (40.4%) and 20 of the single-parent households (40.0%) are living below the poverty level. Within the married-couple family households, those with 3 or 4 children have the highest poverty rate, with 11 households (100.0%) falling below the poverty line. Among the single-parent households, those with 5 or more children have the highest poverty rate, with 4 household (100.0%) living below poverty.
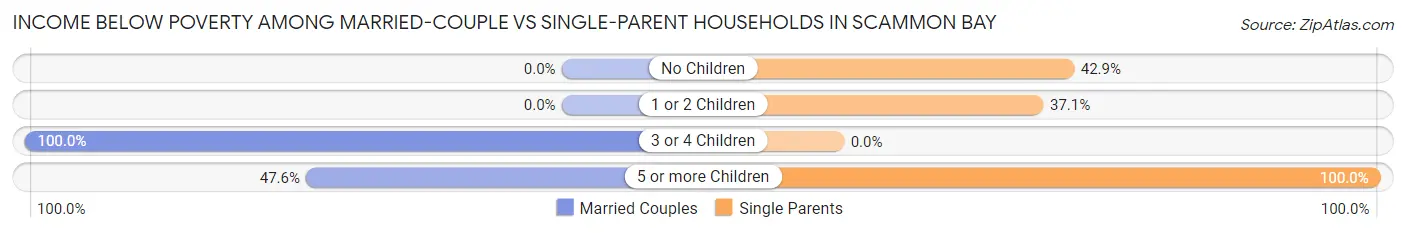
| Children | Married-Couple Families | Single-Parent Households |
| No Children | 0 (0.0%) | 3 (42.9%) |
| 1 or 2 Children | 0 (0.0%) | 13 (37.1%) |
| 3 or 4 Children | 11 (100.0%) | 0 (0.0%) |
| 5 or more Children | 10 (47.6%) | 4 (100.0%) |
| Total | 21 (40.4%) | 20 (40.0%) |
Race in Scammon Bay
The most populous races in Scammon Bay are Native / Alaskan (496 | 98.0%), Hispanic or Latino (9 | 1.8%), and Two or more Races (9 | 1.8%).
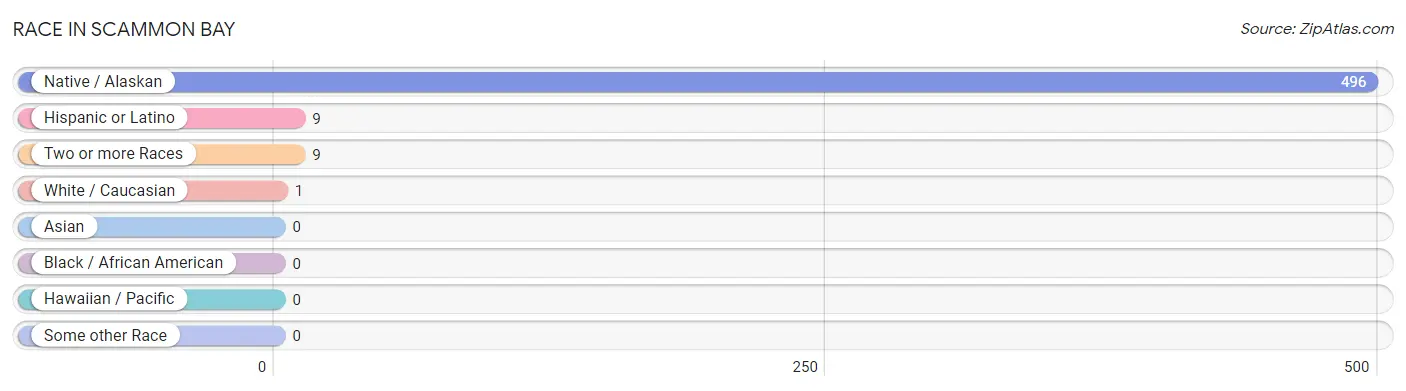
| Race | # Population | % Population |
| Asian | 0 | 0.0% |
| Black / African American | 0 | 0.0% |
| Hawaiian / Pacific | 0 | 0.0% |
| Hispanic or Latino | 9 | 1.8% |
| Native / Alaskan | 496 | 98.0% |
| White / Caucasian | 1 | 0.2% |
| Two or more Races | 9 | 1.8% |
| Some other Race | 0 | 0.0% |
| Total | 506 | 100.0% |
Ancestry in Scammon Bay
The most populous ancestries reported in Scammon Bay are Yup'ik (487 | 96.3%), Mexican (9 | 1.8%), Inupiat (5 | 1.0%), and Alaskan Athabascan (4 | 0.8%), together accounting for 99.8% of all Scammon Bay residents.
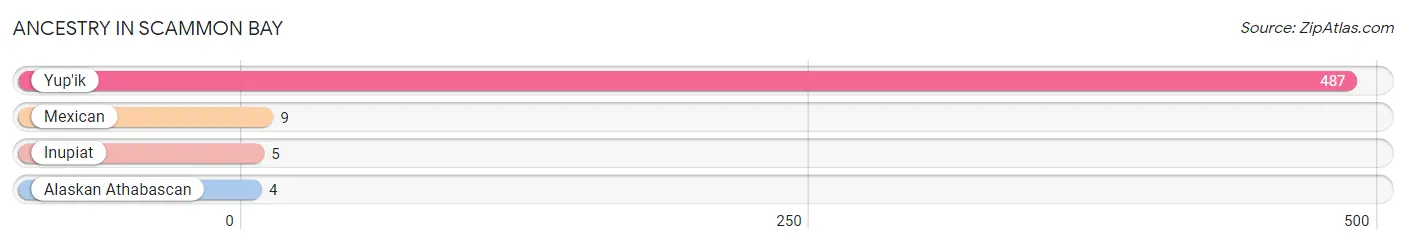
| Ancestry | # Population | % Population |
| Alaskan Athabascan | 4 | 0.8% |
| Inupiat | 5 | 1.0% |
| Mexican | 9 | 1.8% |
| Yup'ik | 487 | 96.3% | View All 4 Rows |
Immigrants in Scammon Bay
The most numerous immigrant groups reported in Scammon Bay came from Central America (9 | 1.8%), Latin America (9 | 1.8%), and Mexico (9 | 1.8%), together accounting for 5.3% of all Scammon Bay residents.
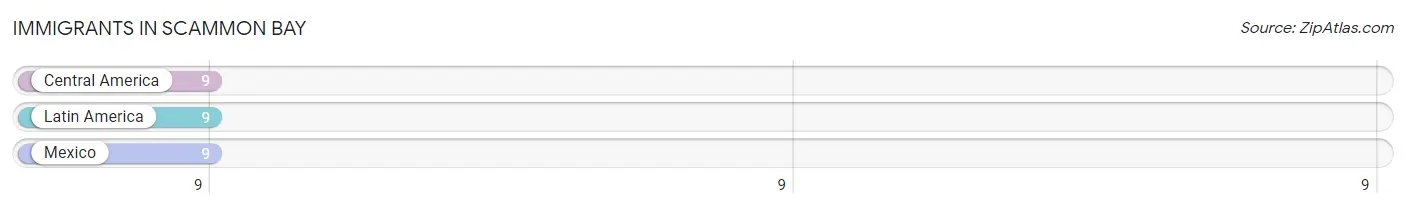
| Immigration Origin | # Population | % Population |
| Central America | 9 | 1.8% |
| Latin America | 9 | 1.8% |
| Mexico | 9 | 1.8% | View All 3 Rows |
Sex and Age in Scammon Bay
Sex and Age in Scammon Bay
The most populous age groups in Scammon Bay are Under 5 Years (56 | 19.9%) for men and Under 5 Years (31 | 13.8%) for women.
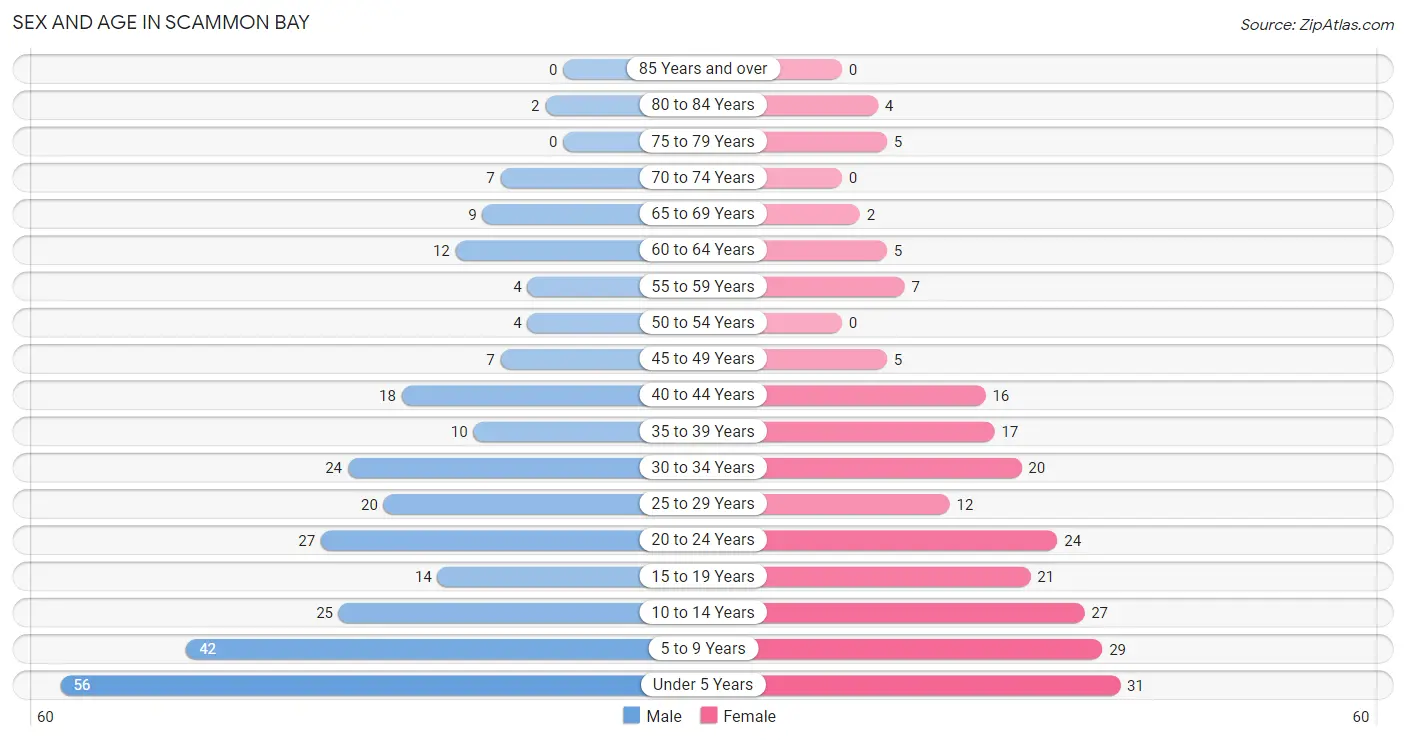
| Age Bracket | Male | Female |
| Under 5 Years | 56 (19.9%) | 31 (13.8%) |
| 5 to 9 Years | 42 (14.9%) | 29 (12.9%) |
| 10 to 14 Years | 25 (8.9%) | 27 (12.0%) |
| 15 to 19 Years | 14 (5.0%) | 21 (9.3%) |
| 20 to 24 Years | 27 (9.6%) | 24 (10.7%) |
| 25 to 29 Years | 20 (7.1%) | 12 (5.3%) |
| 30 to 34 Years | 24 (8.5%) | 20 (8.9%) |
| 35 to 39 Years | 10 (3.6%) | 17 (7.6%) |
| 40 to 44 Years | 18 (6.4%) | 16 (7.1%) |
| 45 to 49 Years | 7 (2.5%) | 5 (2.2%) |
| 50 to 54 Years | 4 (1.4%) | 0 (0.0%) |
| 55 to 59 Years | 4 (1.4%) | 7 (3.1%) |
| 60 to 64 Years | 12 (4.3%) | 5 (2.2%) |
| 65 to 69 Years | 9 (3.2%) | 2 (0.9%) |
| 70 to 74 Years | 7 (2.5%) | 0 (0.0%) |
| 75 to 79 Years | 0 (0.0%) | 5 (2.2%) |
| 80 to 84 Years | 2 (0.7%) | 4 (1.8%) |
| 85 Years and over | 0 (0.0%) | 0 (0.0%) |
| Total | 281 (100.0%) | 225 (100.0%) |
Families and Households in Scammon Bay
Median Family Size in Scammon Bay
The median family size in Scammon Bay is 4.47 persons per family, with married-couple families (52 | 51.0%) accounting for the largest median family size of 5.69 persons per family. On the other hand, single female/mother families (26 | 25.5%) represent the smallest median family size with 3.08 persons per family.
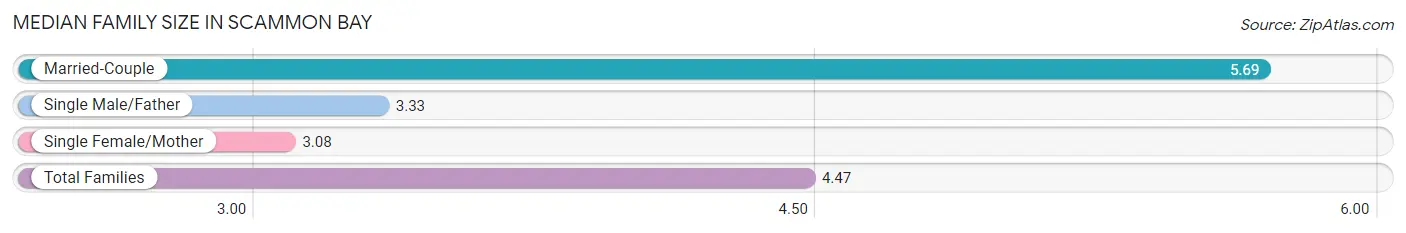
| Family Type | # Families | Family Size |
| Married-Couple | 52 (51.0%) | 5.69 |
| Single Male/Father | 24 (23.5%) | 3.33 |
| Single Female/Mother | 26 (25.5%) | 3.08 |
| Total Families | 102 (100.0%) | 4.47 |
Median Household Size in Scammon Bay
The median household size in Scammon Bay is 4.02 persons per household, with married-couple households (52 | 41.3%) accounting for the largest median household size of 5.81 persons per household. non-family households (24 | 19.1%) represent the smallest median household size with 1.17 persons per household.
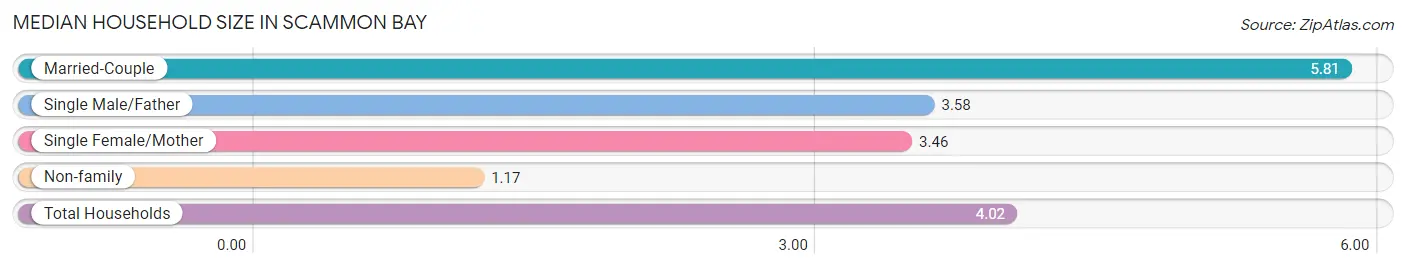
| Household Type | # Households | Household Size |
| Married-Couple | 52 (41.3%) | 5.81 |
| Single Male/Father | 24 (19.1%) | 3.58 |
| Single Female/Mother | 26 (20.6%) | 3.46 |
| Non-family | 24 (19.1%) | 1.17 |
| Total Households | 126 (100.0%) | 4.02 |
Household Size by Marriage Status in Scammon Bay
Out of a total of 126 households in Scammon Bay, 102 (80.9%) are family households, while 24 (19.1%) are nonfamily households. The most numerous type of family households are 7+ person households, comprising 30, and the most common type of nonfamily households are 1-person households, comprising 20.
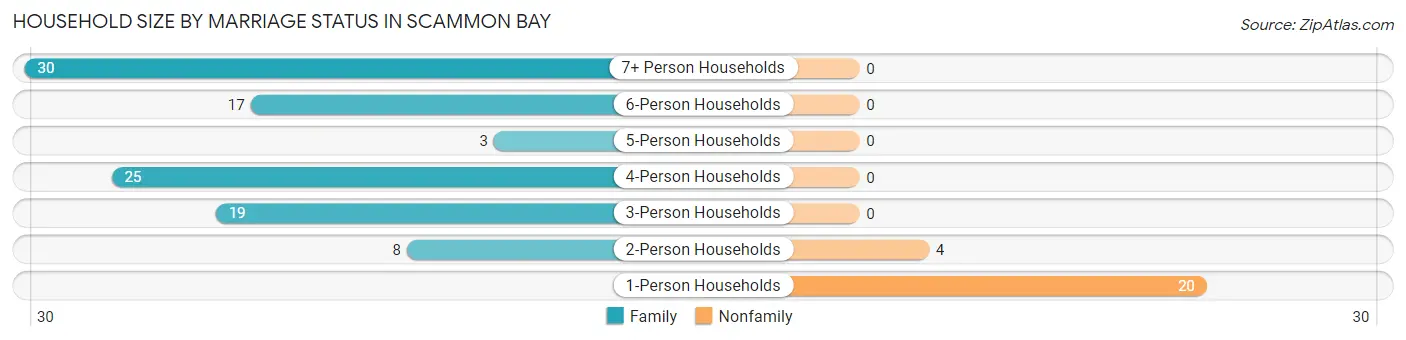
| Household Size | Family Households | Nonfamily Households |
| 1-Person Households | - | 20 (15.9%) |
| 2-Person Households | 8 (6.4%) | 4 (3.2%) |
| 3-Person Households | 19 (15.1%) | 0 (0.0%) |
| 4-Person Households | 25 (19.8%) | 0 (0.0%) |
| 5-Person Households | 3 (2.4%) | 0 (0.0%) |
| 6-Person Households | 17 (13.5%) | 0 (0.0%) |
| 7+ Person Households | 30 (23.8%) | 0 (0.0%) |
| Total | 102 (80.9%) | 24 (19.1%) |
Female Fertility in Scammon Bay
Fertility by Age in Scammon Bay
Average fertility rate in Scammon Bay is 96.0 births per 1,000 women. Women in the age bracket of 20 to 34 years have the highest fertility rate with 196.0 births per 1,000 women. Women in the age bracket of 20 to 34 years acount for 100.0% of all women with births.
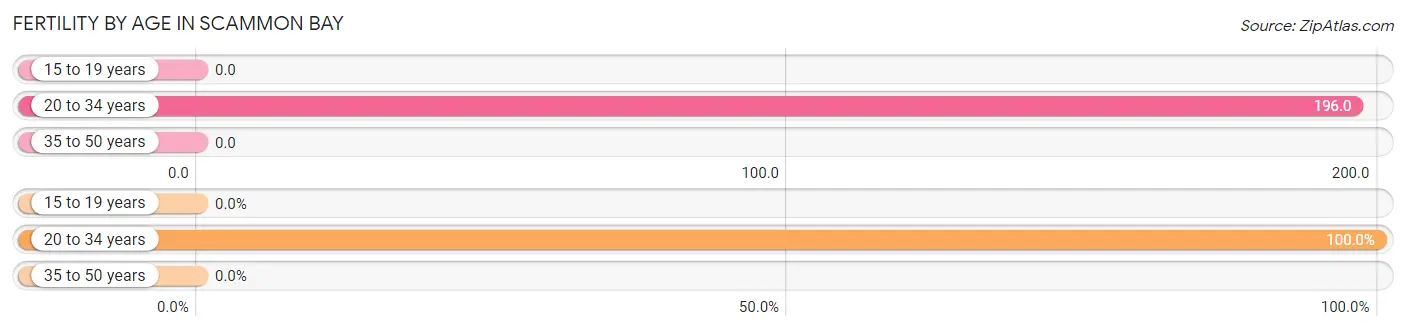
| Age Bracket | Women with Births | Births / 1,000 Women |
| 15 to 19 years | 0 (0.0%) | 0.0 |
| 20 to 34 years | 11 (100.0%) | 196.0 |
| 35 to 50 years | 0 (0.0%) | 0.0 |
| Total | 11 (100.0%) | 96.0 |
Fertility by Age by Marriage Status in Scammon Bay
54.5% of women with births (11) in Scammon Bay are married. The highest percentage of unmarried women with births falls into 20 to 34 years age bracket with 45.5% of them unmarried at the time of birth, while the lowest percentage of unmarried women with births belong to 20 to 34 years age bracket with 45.5% of them unmarried.
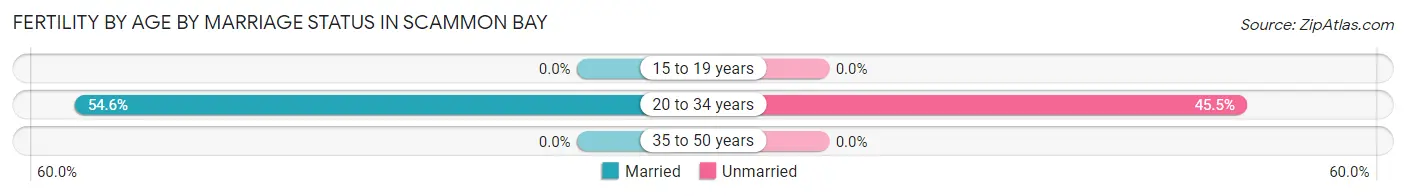
| Age Bracket | Married | Unmarried |
| 15 to 19 years | 0 (0.0%) | 0 (0.0%) |
| 20 to 34 years | 6 (54.5%) | 5 (45.5%) |
| 35 to 50 years | 0 (0.0%) | 0 (0.0%) |
| Total | 6 (54.5%) | 5 (45.5%) |
Fertility by Education in Scammon Bay
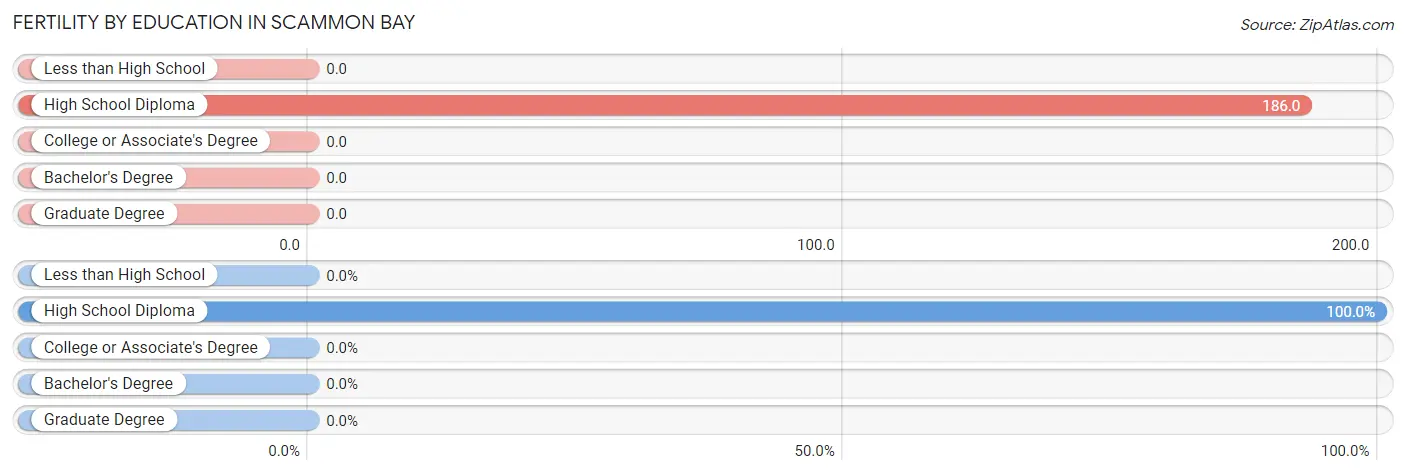
| Educational Attainment | Women with Births | Births / 1,000 Women |
| Less than High School | 0 (0.0%) | 0.0 |
| High School Diploma | 11 (100.0%) | 186.0 |
| College or Associate's Degree | 0 (0.0%) | 0.0 |
| Bachelor's Degree | 0 (0.0%) | 0.0 |
| Graduate Degree | 0 (0.0%) | 0.0 |
| Total | 11 (100.0%) | 96.0 |
Fertility by Education by Marriage Status in Scammon Bay
45.5% of women with births in Scammon Bay are unmarried. Women with the educational attainment of high school diploma are most likely to be married with 54.5% of them married at childbirth, while women with the educational attainment of high school diploma are least likely to be married with 45.5% of them unmarried at childbirth.
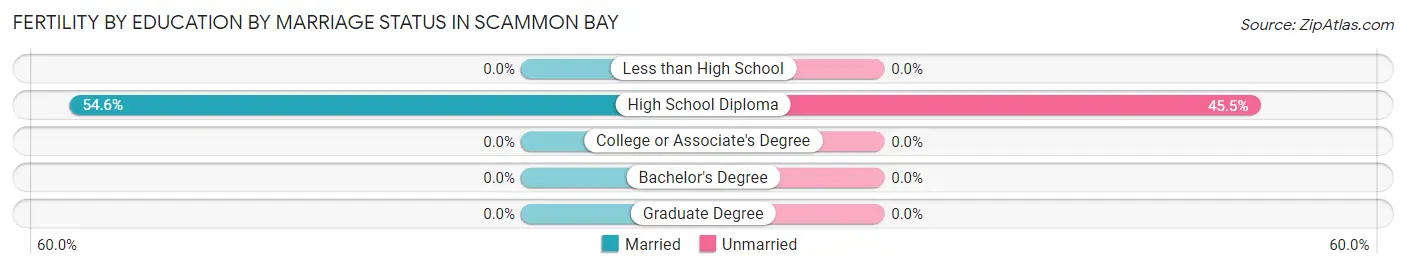
| Educational Attainment | Married | Unmarried |
| Less than High School | 0 (0.0%) | 0 (0.0%) |
| High School Diploma | 6 (54.5%) | 5 (45.5%) |
| College or Associate's Degree | 0 (0.0%) | 0 (0.0%) |
| Bachelor's Degree | 0 (0.0%) | 0 (0.0%) |
| Graduate Degree | 0 (0.0%) | 0 (0.0%) |
| Total | 6 (54.5%) | 5 (45.5%) |
Employment Characteristics in Scammon Bay
Employment by Class of Employer in Scammon Bay
Among the 121 employed individuals in Scammon Bay, state government employees (30 | 24.8%), local government employees (29 | 24.0%), and private company employees (22 | 18.2%) make up the most common classes of employment.
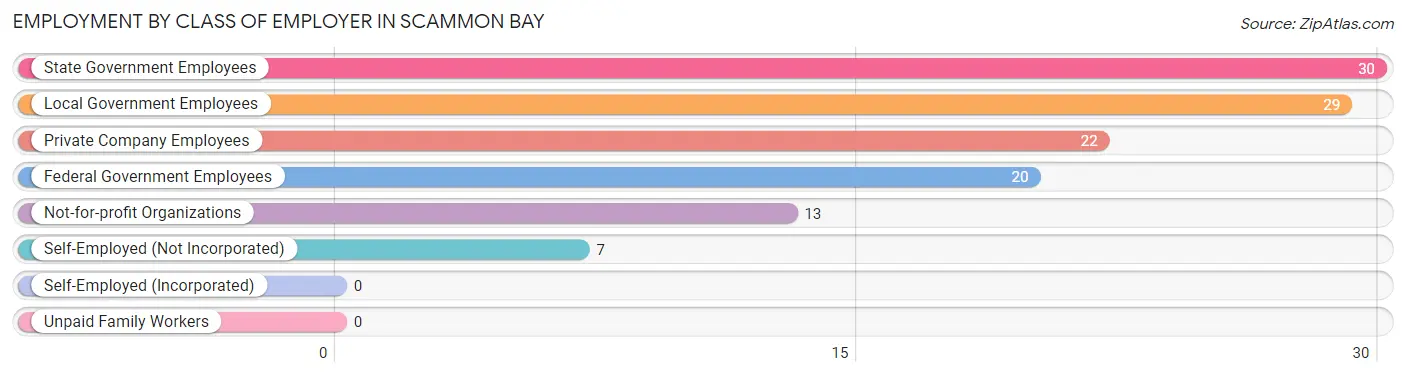
| Employer Class | # Employees | % Employees |
| Private Company Employees | 22 | 18.2% |
| Self-Employed (Incorporated) | 0 | 0.0% |
| Self-Employed (Not Incorporated) | 7 | 5.8% |
| Not-for-profit Organizations | 13 | 10.7% |
| Local Government Employees | 29 | 24.0% |
| State Government Employees | 30 | 24.8% |
| Federal Government Employees | 20 | 16.5% |
| Unpaid Family Workers | 0 | 0.0% |
| Total | 121 | 100.0% |
Employment Status by Age in Scammon Bay
According to the labor force statistics for Scammon Bay, out of the total population over 16 years of age (286), 57.7% or 165 individuals are in the labor force, with 26.7% or 44 of them unemployed. The age group with the highest labor force participation rate is 45 to 54 years, with 81.3% or 13 individuals in the labor force. Within the labor force, the 45 to 54 years age range has the highest percentage of unemployed individuals, with 76.9% or 10 of them being unemployed.
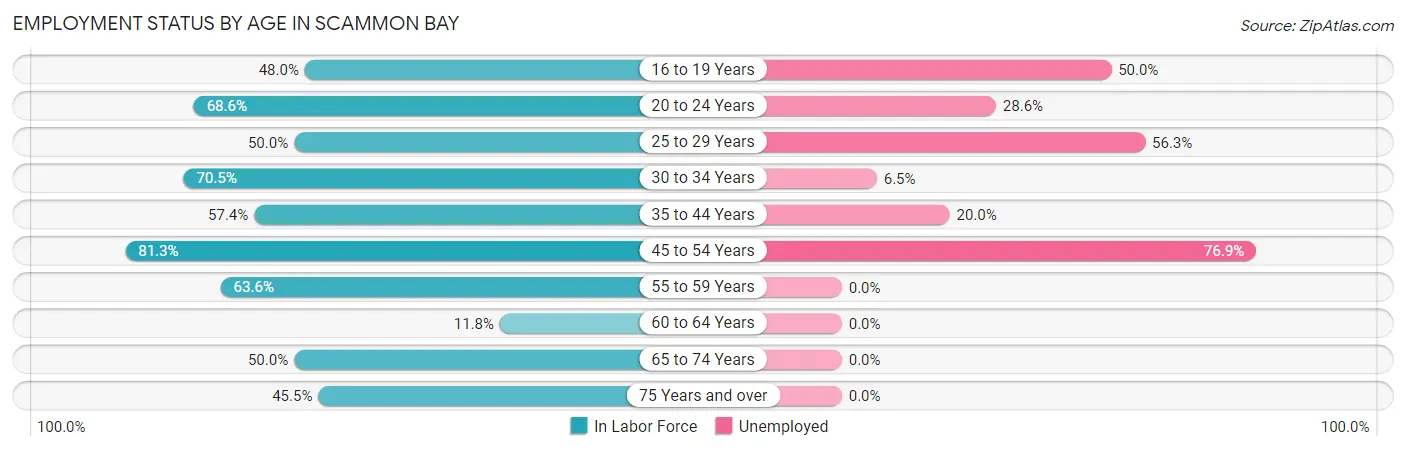
| Age Bracket | In Labor Force | Unemployed |
| 16 to 19 Years | 12 (48.0%) | 6 (50.0%) |
| 20 to 24 Years | 35 (68.6%) | 10 (28.6%) |
| 25 to 29 Years | 16 (50.0%) | 9 (56.3%) |
| 30 to 34 Years | 31 (70.5%) | 2 (6.5%) |
| 35 to 44 Years | 35 (57.4%) | 7 (20.0%) |
| 45 to 54 Years | 13 (81.3%) | 10 (76.9%) |
| 55 to 59 Years | 7 (63.6%) | 0 (0.0%) |
| 60 to 64 Years | 2 (11.8%) | 0 (0.0%) |
| 65 to 74 Years | 9 (50.0%) | 0 (0.0%) |
| 75 Years and over | 5 (45.5%) | 0 (0.0%) |
| Total | 165 (57.7%) | 44 (26.7%) |
Employment Status by Educational Attainment in Scammon Bay
According to labor force statistics for Scammon Bay, 57.5% of individuals (104) out of the total population between 25 and 64 years of age (181) are in the labor force, with 26.9% or 28 of them being unemployed. The group with the highest labor force participation rate are those with the educational attainment of college / associate degree, with 100.0% or 46 individuals in the labor force. Within the labor force, individuals with bachelor's degree or higher education have the highest percentage of unemployment, with 58.3% or 7 of them being unemployed.
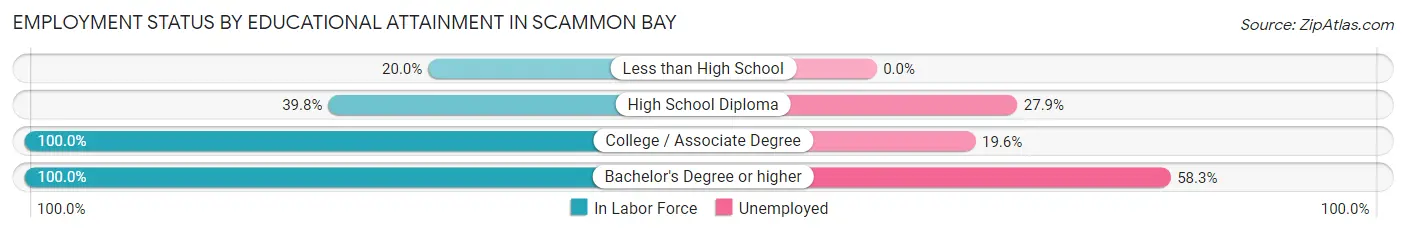
| Educational Attainment | In Labor Force | Unemployed |
| Less than High School | 3 (20.0%) | 0 (0.0%) |
| High School Diploma | 43 (39.8%) | 30 (27.9%) |
| College / Associate Degree | 46 (100.0%) | 9 (19.6%) |
| Bachelor's Degree or higher | 12 (100.0%) | 7 (58.3%) |
| Total | 104 (57.5%) | 49 (26.9%) |
Employment Occupations by Sex in Scammon Bay
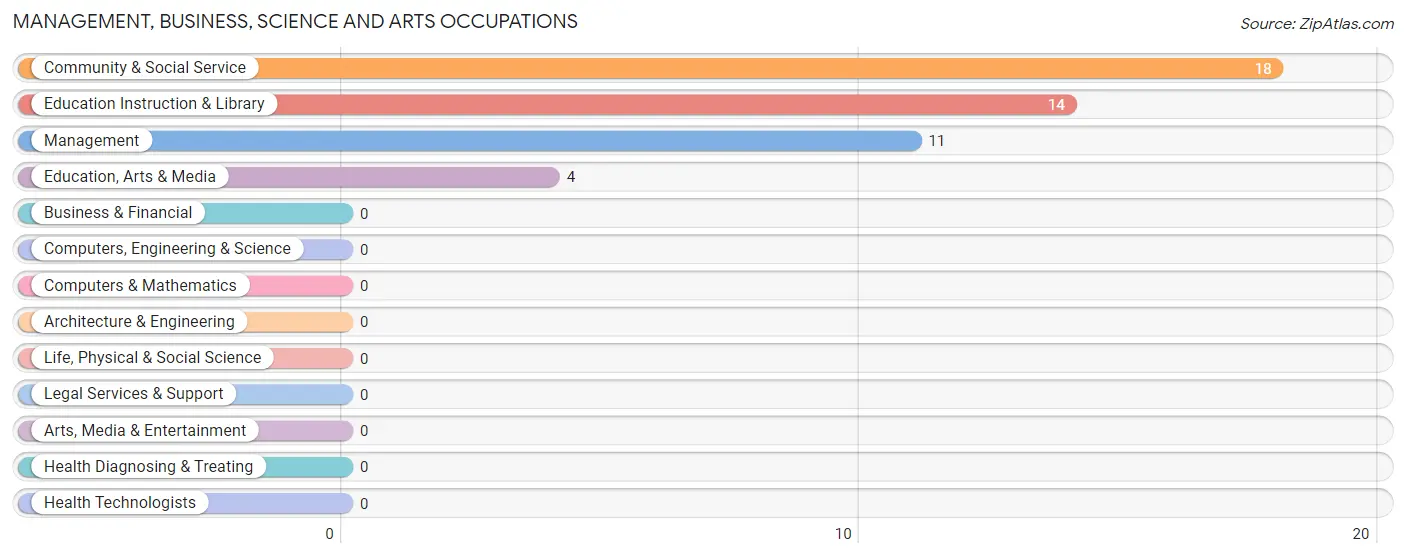
Management, Business, Science and Arts Occupations
The most common Management, Business, Science and Arts occupations in Scammon Bay are Community & Social Service (18 | 14.9%), Education Instruction & Library (14 | 11.6%), Management (11 | 9.1%), and Education, Arts & Media (4 | 3.3%).
Management, Business, Science and Arts Occupations by Sex
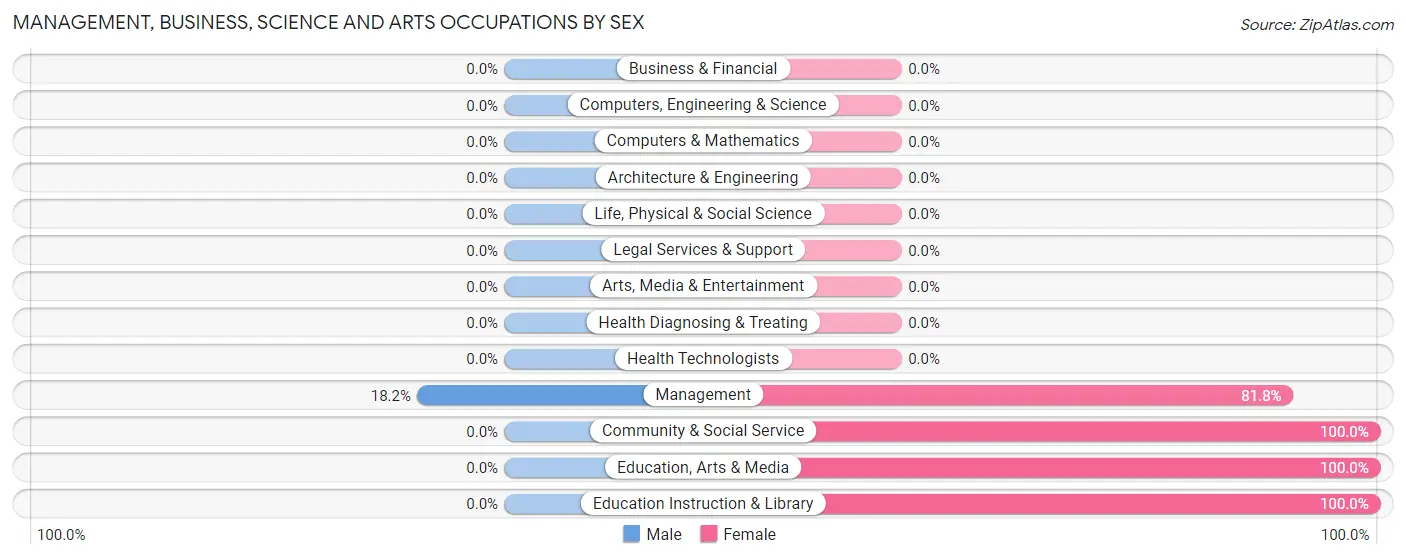
| Occupation | Male | Female |
| Management | 2 (18.2%) | 9 (81.8%) |
| Business & Financial | 0 (0.0%) | 0 (0.0%) |
| Computers, Engineering & Science | 0 (0.0%) | 0 (0.0%) |
| Computers & Mathematics | 0 (0.0%) | 0 (0.0%) |
| Architecture & Engineering | 0 (0.0%) | 0 (0.0%) |
| Life, Physical & Social Science | 0 (0.0%) | 0 (0.0%) |
| Community & Social Service | 0 (0.0%) | 18 (100.0%) |
| Education, Arts & Media | 0 (0.0%) | 4 (100.0%) |
| Legal Services & Support | 0 (0.0%) | 0 (0.0%) |
| Education Instruction & Library | 0 (0.0%) | 14 (100.0%) |
| Arts, Media & Entertainment | 0 (0.0%) | 0 (0.0%) |
| Health Diagnosing & Treating | 0 (0.0%) | 0 (0.0%) |
| Health Technologists | 0 (0.0%) | 0 (0.0%) |
| Total (Category) | 2 (6.9%) | 27 (93.1%) |
| Total (Overall) | 57 (47.1%) | 64 (52.9%) |
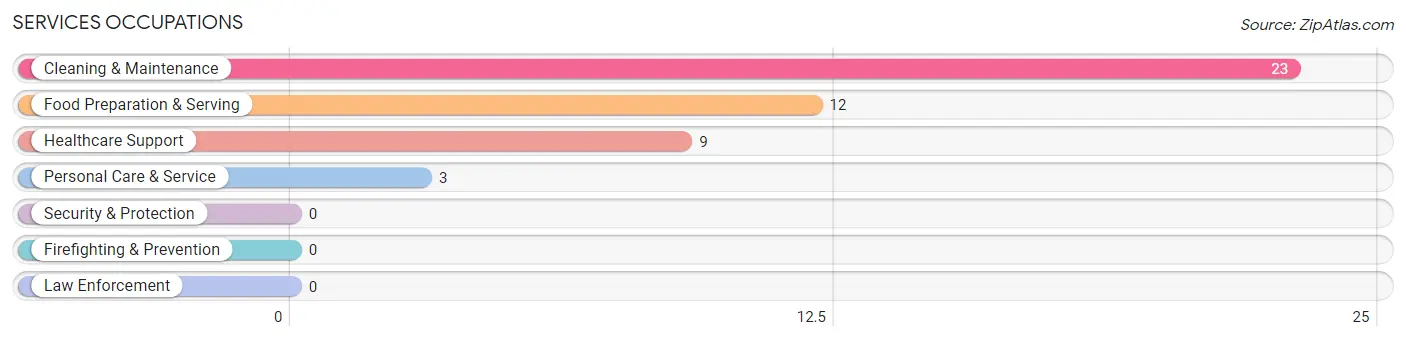
Services Occupations
The most common Services occupations in Scammon Bay are Cleaning & Maintenance (23 | 19.0%), Food Preparation & Serving (12 | 9.9%), Healthcare Support (9 | 7.4%), and Personal Care & Service (3 | 2.5%).
Services Occupations by Sex
Within the Services occupations in Scammon Bay, the most male-oriented occupations are Cleaning & Maintenance (100.0%), Food Preparation & Serving (75.0%), and Healthcare Support (55.6%), while the most female-oriented occupations are Personal Care & Service (100.0%), Healthcare Support (44.4%), and Food Preparation & Serving (25.0%).
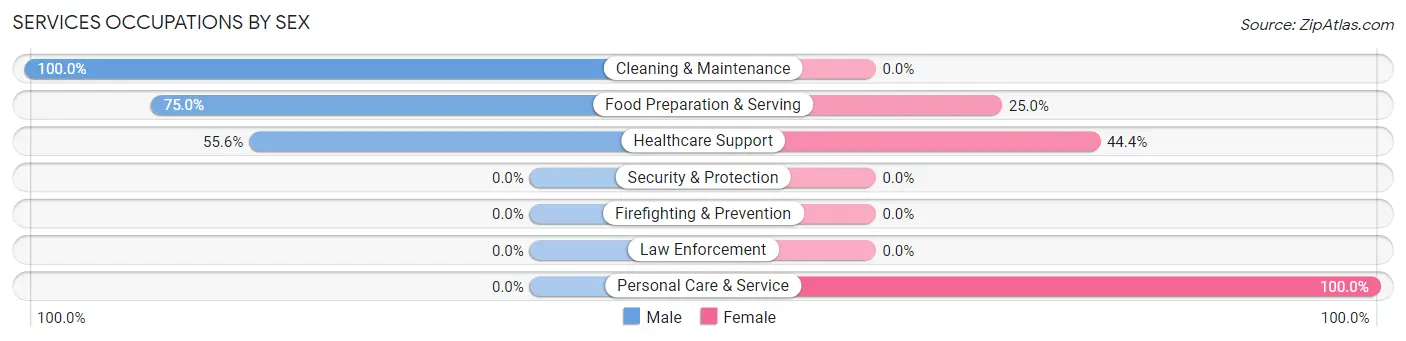
| Occupation | Male | Female |
| Healthcare Support | 5 (55.6%) | 4 (44.4%) |
| Security & Protection | 0 (0.0%) | 0 (0.0%) |
| Firefighting & Prevention | 0 (0.0%) | 0 (0.0%) |
| Law Enforcement | 0 (0.0%) | 0 (0.0%) |
| Food Preparation & Serving | 9 (75.0%) | 3 (25.0%) |
| Cleaning & Maintenance | 23 (100.0%) | 0 (0.0%) |
| Personal Care & Service | 0 (0.0%) | 3 (100.0%) |
| Total (Category) | 37 (78.7%) | 10 (21.3%) |
| Total (Overall) | 57 (47.1%) | 64 (52.9%) |
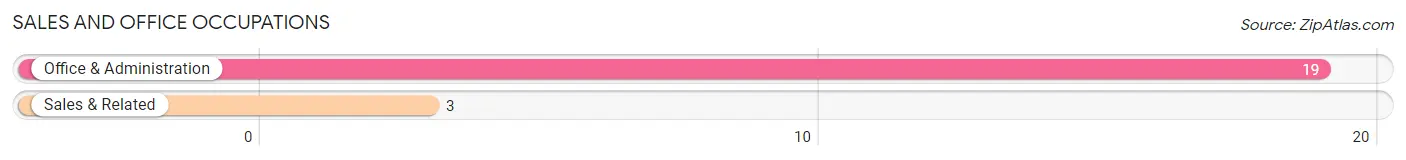
Sales and Office Occupations
The most common Sales and Office occupations in Scammon Bay are Office & Administration (19 | 15.7%), and Sales & Related (3 | 2.5%).
Sales and Office Occupations by Sex
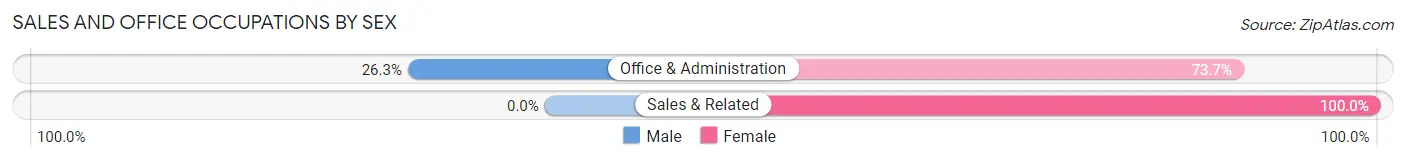
| Occupation | Male | Female |
| Sales & Related | 0 (0.0%) | 3 (100.0%) |
| Office & Administration | 5 (26.3%) | 14 (73.7%) |
| Total (Category) | 5 (22.7%) | 17 (77.3%) |
| Total (Overall) | 57 (47.1%) | 64 (52.9%) |
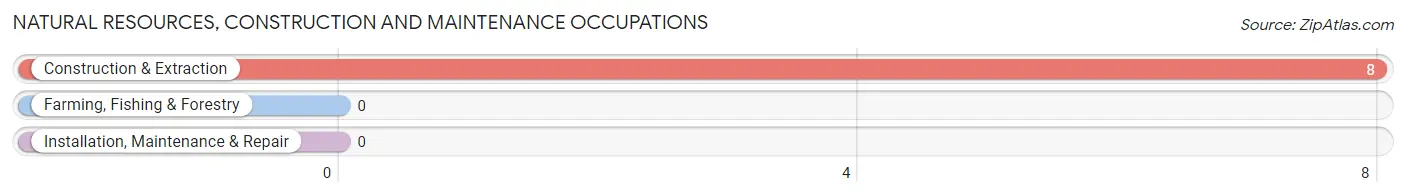
Natural Resources, Construction and Maintenance Occupations
The most common Natural Resources, Construction and Maintenance occupations in Scammon Bay are , and Construction & Extraction (8 | 6.6%).
Natural Resources, Construction and Maintenance Occupations by Sex
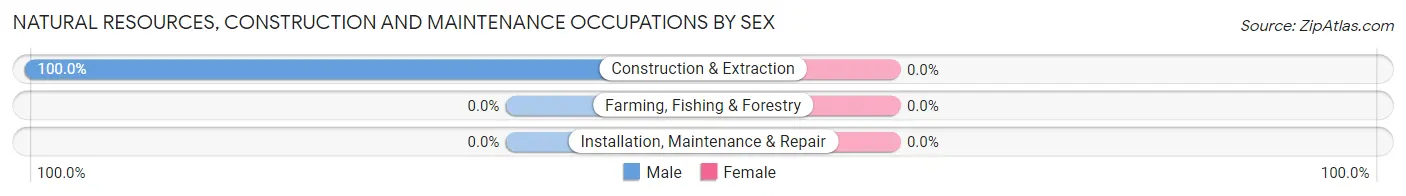
| Occupation | Male | Female |
| Farming, Fishing & Forestry | 0 (0.0%) | 0 (0.0%) |
| Construction & Extraction | 8 (100.0%) | 0 (0.0%) |
| Installation, Maintenance & Repair | 0 (0.0%) | 0 (0.0%) |
| Total (Category) | 8 (100.0%) | 0 (0.0%) |
| Total (Overall) | 57 (47.1%) | 64 (52.9%) |
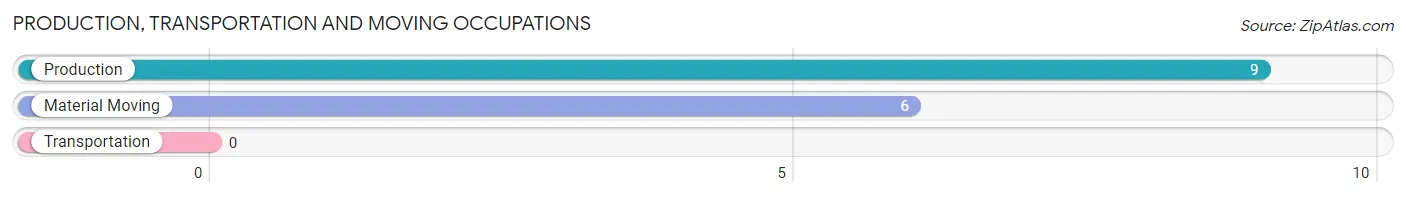
Production, Transportation and Moving Occupations
The most common Production, Transportation and Moving occupations in Scammon Bay are Production (9 | 7.4%), and Material Moving (6 | 5.0%).
Production, Transportation and Moving Occupations by Sex
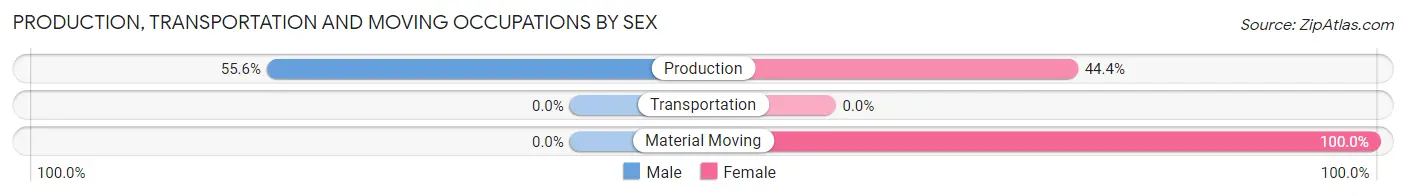
| Occupation | Male | Female |
| Production | 5 (55.6%) | 4 (44.4%) |
| Transportation | 0 (0.0%) | 0 (0.0%) |
| Material Moving | 0 (0.0%) | 6 (100.0%) |
| Total (Category) | 5 (33.3%) | 10 (66.7%) |
| Total (Overall) | 57 (47.1%) | 64 (52.9%) |
Employment Industries by Sex in Scammon Bay
Employment Industries in Scammon Bay
The major employment industries in Scammon Bay include Educational Services (33 | 27.3%), Health Care & Social Assistance (26 | 21.5%), Public Administration (13 | 10.7%), Retail Trade (10 | 8.3%), and Accommodation & Food Services (9 | 7.4%).
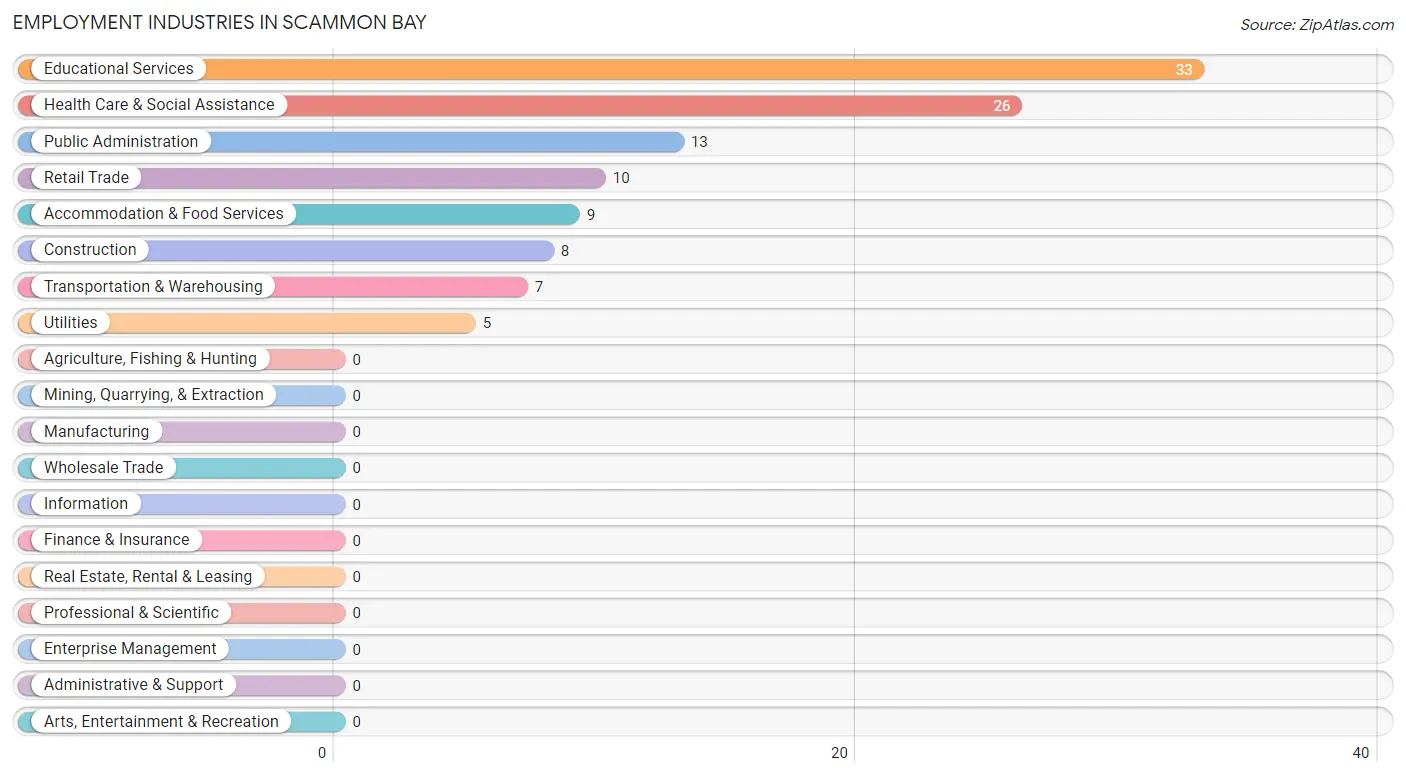
Employment Industries by Sex in Scammon Bay
The Scammon Bay industries that see more men than women are Construction (100.0%), Utilities (100.0%), and Accommodation & Food Services (100.0%), whereas the industries that tend to have a higher number of women are Educational Services (72.7%), Transportation & Warehousing (71.4%), and Public Administration (61.5%).
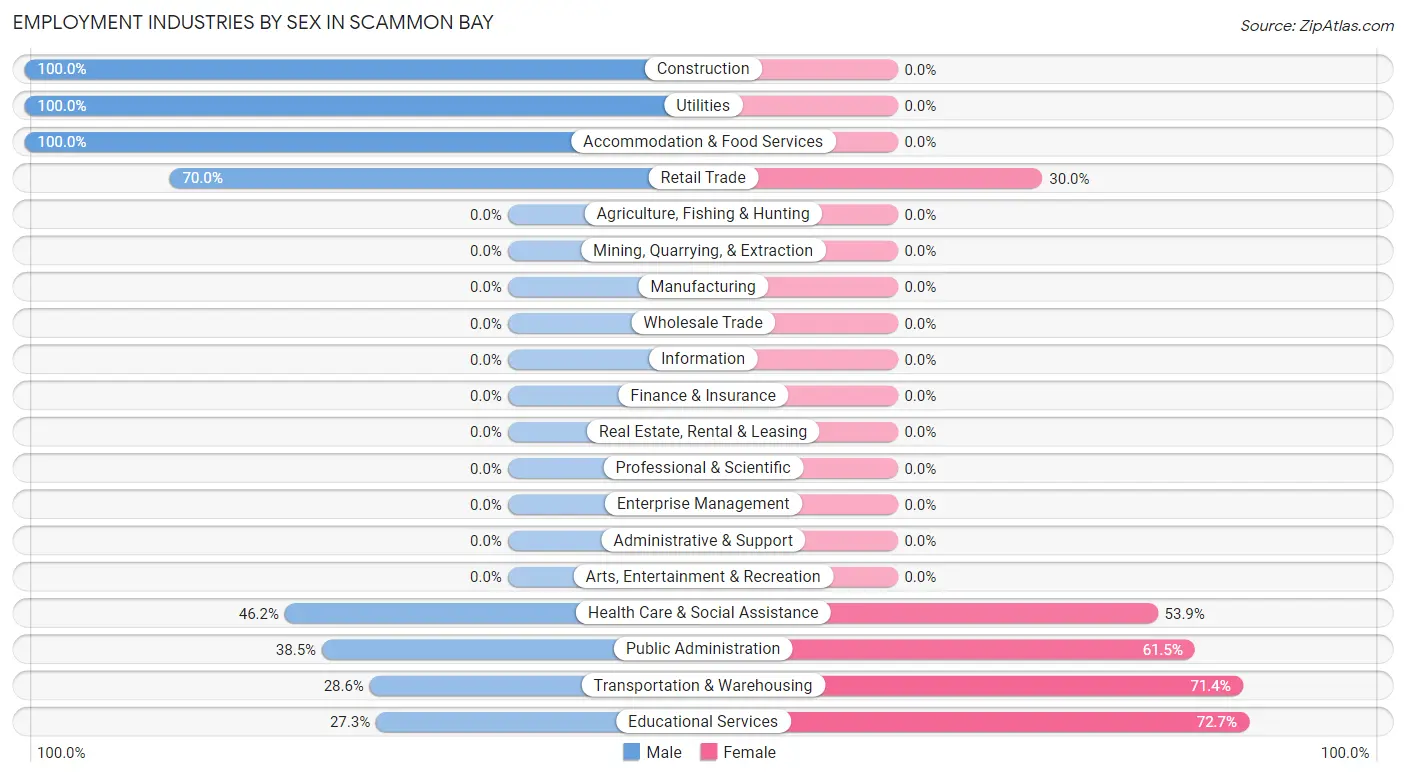
| Industry | Male | Female |
| Agriculture, Fishing & Hunting | 0 (0.0%) | 0 (0.0%) |
| Mining, Quarrying, & Extraction | 0 (0.0%) | 0 (0.0%) |
| Construction | 8 (100.0%) | 0 (0.0%) |
| Manufacturing | 0 (0.0%) | 0 (0.0%) |
| Wholesale Trade | 0 (0.0%) | 0 (0.0%) |
| Retail Trade | 7 (70.0%) | 3 (30.0%) |
| Transportation & Warehousing | 2 (28.6%) | 5 (71.4%) |
| Utilities | 5 (100.0%) | 0 (0.0%) |
| Information | 0 (0.0%) | 0 (0.0%) |
| Finance & Insurance | 0 (0.0%) | 0 (0.0%) |
| Real Estate, Rental & Leasing | 0 (0.0%) | 0 (0.0%) |
| Professional & Scientific | 0 (0.0%) | 0 (0.0%) |
| Enterprise Management | 0 (0.0%) | 0 (0.0%) |
| Administrative & Support | 0 (0.0%) | 0 (0.0%) |
| Educational Services | 9 (27.3%) | 24 (72.7%) |
| Health Care & Social Assistance | 12 (46.2%) | 14 (53.8%) |
| Arts, Entertainment & Recreation | 0 (0.0%) | 0 (0.0%) |
| Accommodation & Food Services | 9 (100.0%) | 0 (0.0%) |
| Public Administration | 5 (38.5%) | 8 (61.5%) |
| Total | 57 (47.1%) | 64 (52.9%) |
Education in Scammon Bay
School Enrollment in Scammon Bay
The most common levels of schooling among the 148 students in Scammon Bay are elementary school (46 | 31.1%), middle school (37 | 25.0%), and high school (30 | 20.3%).
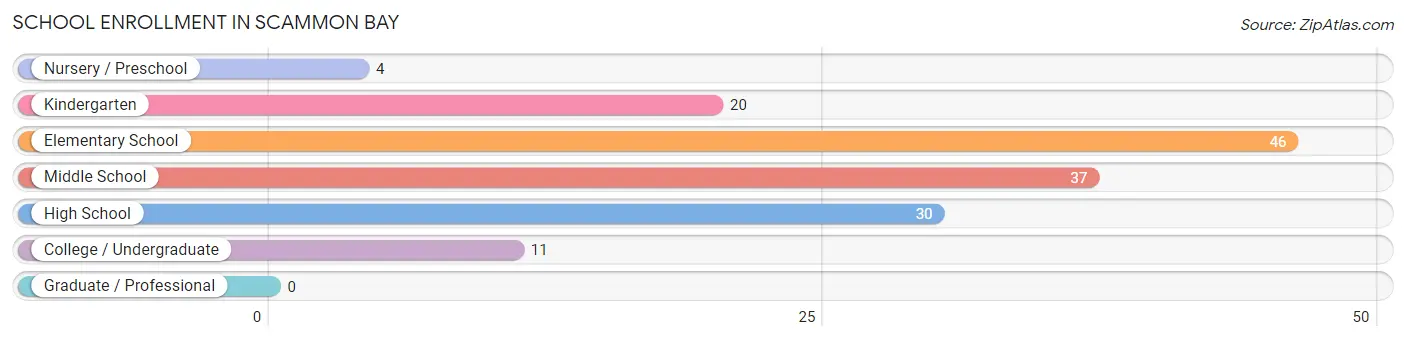
| School Level | # Students | % Students |
| Nursery / Preschool | 4 | 2.7% |
| Kindergarten | 20 | 13.5% |
| Elementary School | 46 | 31.1% |
| Middle School | 37 | 25.0% |
| High School | 30 | 20.3% |
| College / Undergraduate | 11 | 7.4% |
| Graduate / Professional | 0 | 0.0% |
| Total | 148 | 100.0% |
School Enrollment by Age by Funding Source in Scammon Bay
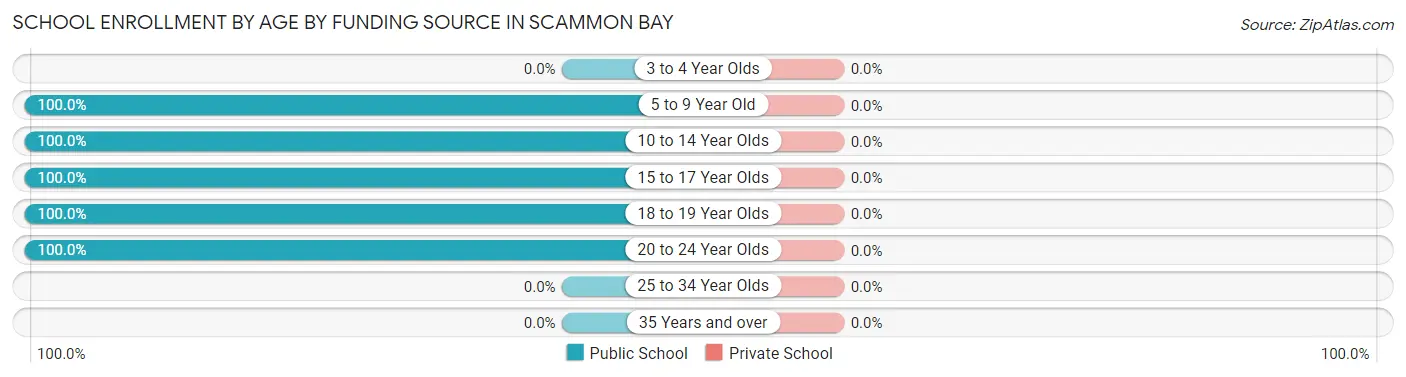
| Age Bracket | Public School | Private School |
| 3 to 4 Year Olds | 0 (0.0%) | 0 (0.0%) |
| 5 to 9 Year Old | 63 (100.0%) | 0 (0.0%) |
| 10 to 14 Year Olds | 48 (100.0%) | 0 (0.0%) |
| 15 to 17 Year Olds | 26 (100.0%) | 0 (0.0%) |
| 18 to 19 Year Olds | 6 (100.0%) | 0 (0.0%) |
| 20 to 24 Year Olds | 5 (100.0%) | 0 (0.0%) |
| 25 to 34 Year Olds | 0 (0.0%) | 0 (0.0%) |
| 35 Years and over | 0 (0.0%) | 0 (0.0%) |
| Total | 148 (100.0%) | 0 (0.0%) |
Educational Attainment by Field of Study in Scammon Bay
Education (5 | 41.7%), business (4 | 33.3%), and communications (3 | 25.0%) are the most common fields of study among 12 individuals in Scammon Bay who have obtained a bachelor's degree or higher.
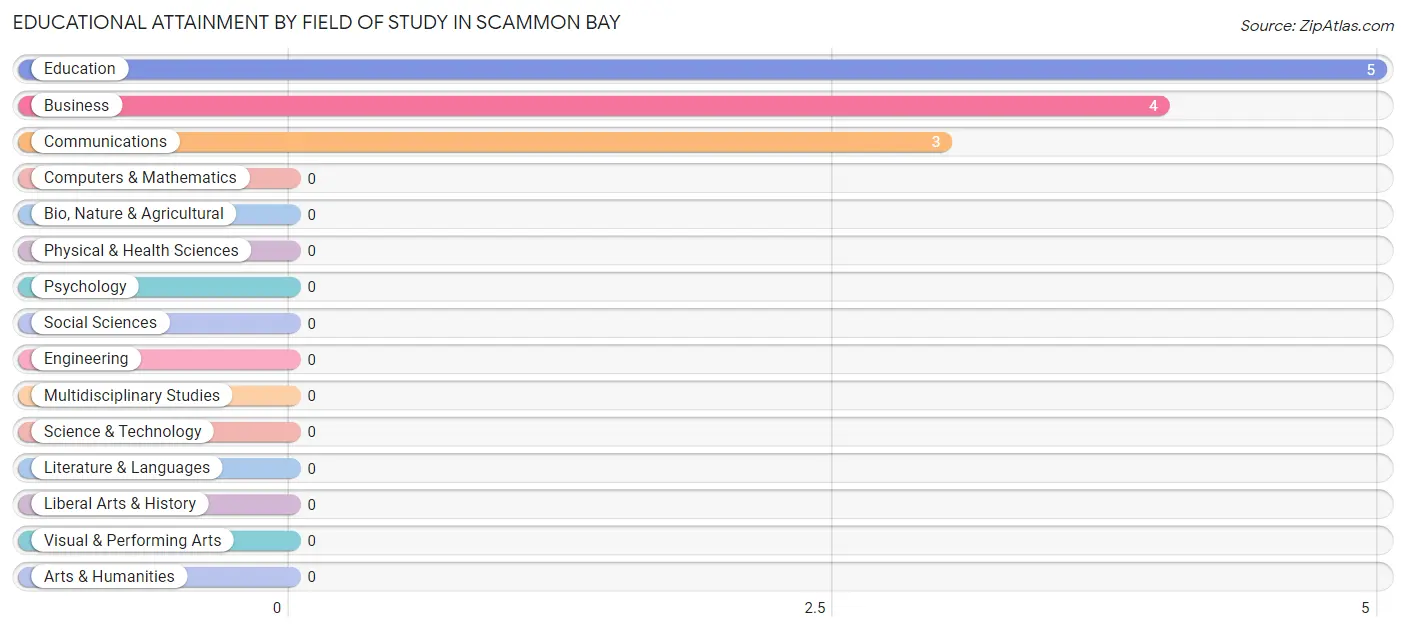
| Field of Study | # Graduates | % Graduates |
| Computers & Mathematics | 0 | 0.0% |
| Bio, Nature & Agricultural | 0 | 0.0% |
| Physical & Health Sciences | 0 | 0.0% |
| Psychology | 0 | 0.0% |
| Social Sciences | 0 | 0.0% |
| Engineering | 0 | 0.0% |
| Multidisciplinary Studies | 0 | 0.0% |
| Science & Technology | 0 | 0.0% |
| Business | 4 | 33.3% |
| Education | 5 | 41.7% |
| Literature & Languages | 0 | 0.0% |
| Liberal Arts & History | 0 | 0.0% |
| Visual & Performing Arts | 0 | 0.0% |
| Communications | 3 | 25.0% |
| Arts & Humanities | 0 | 0.0% |
| Total | 12 | 100.0% |
Transportation & Commute in Scammon Bay
Vehicle Availability by Sex in Scammon Bay
The most prevalent vehicle ownership categories in Scammon Bay are males with no vehicle (57, accounting for 100.0%) and females with no vehicle (64, making up 89.1%).
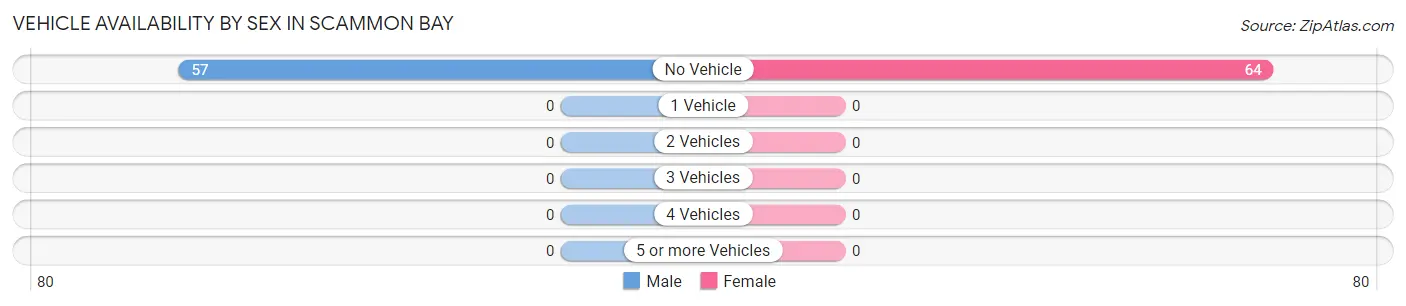
| Vehicles Available | Male | Female |
| No Vehicle | 57 (100.0%) | 64 (100.0%) |
| 1 Vehicle | 0 (0.0%) | 0 (0.0%) |
| 2 Vehicles | 0 (0.0%) | 0 (0.0%) |
| 3 Vehicles | 0 (0.0%) | 0 (0.0%) |
| 4 Vehicles | 0 (0.0%) | 0 (0.0%) |
| 5 or more Vehicles | 0 (0.0%) | 0 (0.0%) |
| Total | 57 (100.0%) | 64 (100.0%) |
Commute Time in Scammon Bay
The most frequently occuring commute durations in Scammon Bay are less than 5 minutes (82 commuters, 73.2%), 5 to 9 minutes (23 commuters, 20.5%), and 10 to 14 minutes (5 commuters, 4.5%).
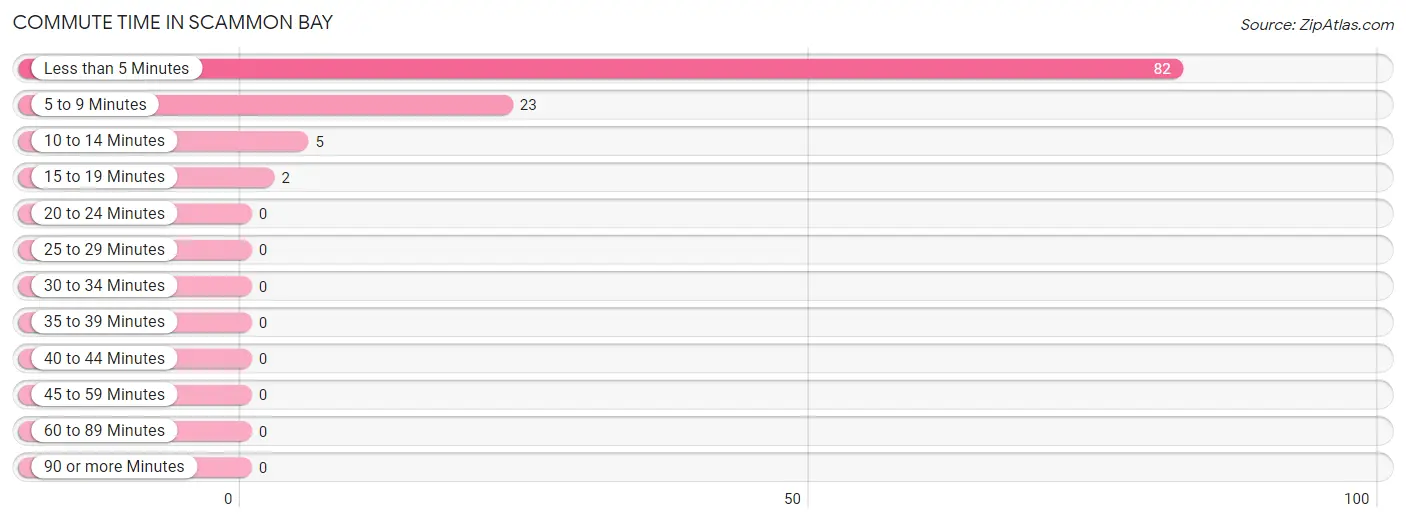
| Commute Time | # Commuters | % Commuters |
| Less than 5 Minutes | 82 | 73.2% |
| 5 to 9 Minutes | 23 | 20.5% |
| 10 to 14 Minutes | 5 | 4.5% |
| 15 to 19 Minutes | 2 | 1.8% |
| 20 to 24 Minutes | 0 | 0.0% |
| 25 to 29 Minutes | 0 | 0.0% |
| 30 to 34 Minutes | 0 | 0.0% |
| 35 to 39 Minutes | 0 | 0.0% |
| 40 to 44 Minutes | 0 | 0.0% |
| 45 to 59 Minutes | 0 | 0.0% |
| 60 to 89 Minutes | 0 | 0.0% |
| 90 or more Minutes | 0 | 0.0% |
Commute Time by Sex in Scammon Bay
The most common commute times in Scammon Bay are less than 5 minutes (34 commuters, 70.8%) for males and less than 5 minutes (48 commuters, 75.0%) for females.
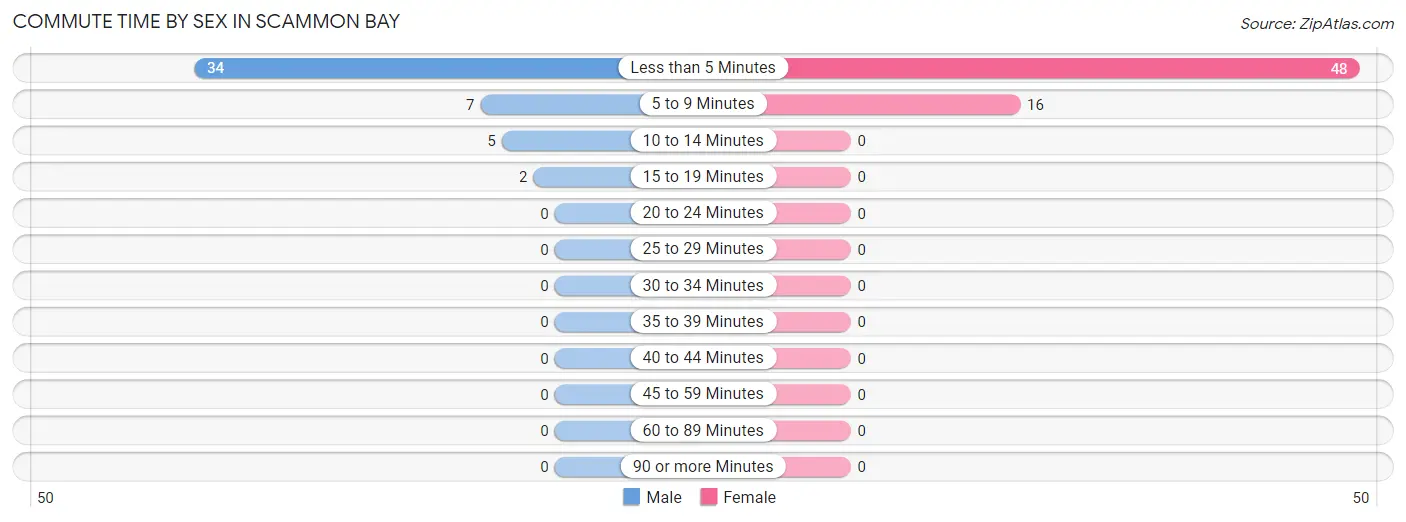
| Commute Time | Male | Female |
| Less than 5 Minutes | 34 (70.8%) | 48 (75.0%) |
| 5 to 9 Minutes | 7 (14.6%) | 16 (25.0%) |
| 10 to 14 Minutes | 5 (10.4%) | 0 (0.0%) |
| 15 to 19 Minutes | 2 (4.2%) | 0 (0.0%) |
| 20 to 24 Minutes | 0 (0.0%) | 0 (0.0%) |
| 25 to 29 Minutes | 0 (0.0%) | 0 (0.0%) |
| 30 to 34 Minutes | 0 (0.0%) | 0 (0.0%) |
| 35 to 39 Minutes | 0 (0.0%) | 0 (0.0%) |
| 40 to 44 Minutes | 0 (0.0%) | 0 (0.0%) |
| 45 to 59 Minutes | 0 (0.0%) | 0 (0.0%) |
| 60 to 89 Minutes | 0 (0.0%) | 0 (0.0%) |
| 90 or more Minutes | 0 (0.0%) | 0 (0.0%) |
Time of Departure to Work by Sex in Scammon Bay
The most frequent times of departure to work in Scammon Bay are 9:00 AM to 9:59 AM (14, 29.2%) for males and 9:00 AM to 9:59 AM (32, 50.0%) for females.
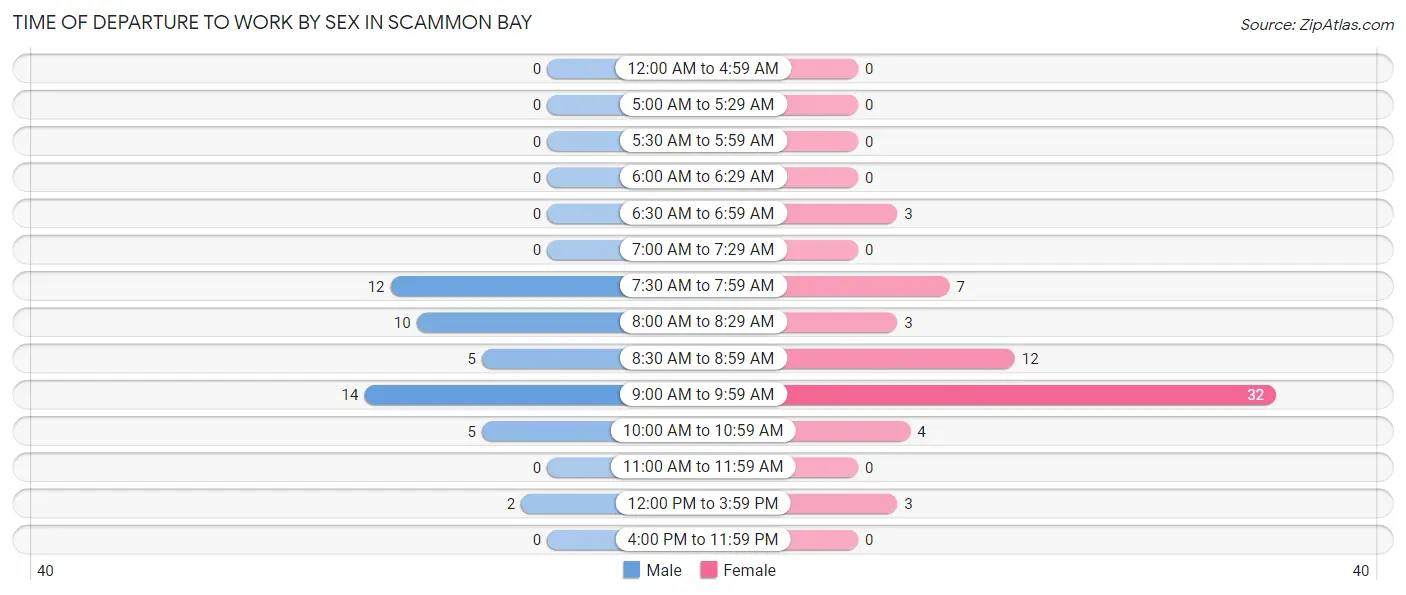
| Time of Departure | Male | Female |
| 12:00 AM to 4:59 AM | 0 (0.0%) | 0 (0.0%) |
| 5:00 AM to 5:29 AM | 0 (0.0%) | 0 (0.0%) |
| 5:30 AM to 5:59 AM | 0 (0.0%) | 0 (0.0%) |
| 6:00 AM to 6:29 AM | 0 (0.0%) | 0 (0.0%) |
| 6:30 AM to 6:59 AM | 0 (0.0%) | 3 (4.7%) |
| 7:00 AM to 7:29 AM | 0 (0.0%) | 0 (0.0%) |
| 7:30 AM to 7:59 AM | 12 (25.0%) | 7 (10.9%) |
| 8:00 AM to 8:29 AM | 10 (20.8%) | 3 (4.7%) |
| 8:30 AM to 8:59 AM | 5 (10.4%) | 12 (18.8%) |
| 9:00 AM to 9:59 AM | 14 (29.2%) | 32 (50.0%) |
| 10:00 AM to 10:59 AM | 5 (10.4%) | 4 (6.2%) |
| 11:00 AM to 11:59 AM | 0 (0.0%) | 0 (0.0%) |
| 12:00 PM to 3:59 PM | 2 (4.2%) | 3 (4.7%) |
| 4:00 PM to 11:59 PM | 0 (0.0%) | 0 (0.0%) |
| Total | 48 (100.0%) | 64 (100.0%) |
Housing Occupancy in Scammon Bay
Occupancy by Ownership in Scammon Bay
Of the total 126 dwellings in Scammon Bay, owner-occupied units account for 79 (62.7%), while renter-occupied units make up 47 (37.3%).
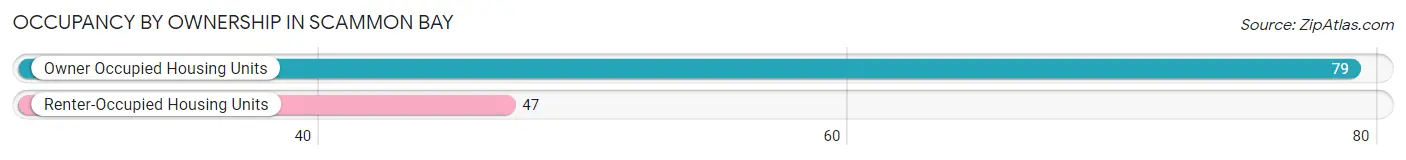
| Occupancy | # Housing Units | % Housing Units |
| Owner Occupied Housing Units | 79 | 62.7% |
| Renter-Occupied Housing Units | 47 | 37.3% |
| Total Occupied Housing Units | 126 | 100.0% |
Occupancy by Household Size in Scammon Bay
| Household Size | # Housing Units | % Housing Units |
| 1-Person Household | 20 | 15.9% |
| 2-Person Household | 12 | 9.5% |
| 3-Person Household | 19 | 15.1% |
| 4+ Person Household | 75 | 59.5% |
| Total Housing Units | 126 | 100.0% |
Occupancy by Ownership by Household Size in Scammon Bay
| Household Size | Owner-occupied | Renter-occupied |
| 1-Person Household | 7 (35.0%) | 13 (65.0%) |
| 2-Person Household | 12 (100.0%) | 0 (0.0%) |
| 3-Person Household | 19 (100.0%) | 0 (0.0%) |
| 4+ Person Household | 41 (54.7%) | 34 (45.3%) |
| Total Housing Units | 79 (62.7%) | 47 (37.3%) |
Occupancy by Educational Attainment in Scammon Bay
| Household Size | Owner-occupied | Renter-occupied |
| Less than High School | 5 (38.5%) | 8 (61.5%) |
| High School Diploma | 37 (75.5%) | 12 (24.5%) |
| College/Associate Degree | 33 (60.0%) | 22 (40.0%) |
| Bachelor's Degree or higher | 4 (44.4%) | 5 (55.6%) |
Occupancy by Age of Householder in Scammon Bay
| Age Bracket | # Households | % Households |
| Under 35 Years | 34 | 27.0% |
| 35 to 44 Years | 37 | 29.4% |
| 45 to 54 Years | 11 | 8.7% |
| 55 to 64 Years | 17 | 13.5% |
| 65 to 74 Years | 16 | 12.7% |
| 75 to 84 Years | 11 | 8.7% |
| 85 Years and Over | 0 | 0.0% |
| Total | 126 | 100.0% |
Housing Finances in Scammon Bay
Median Income by Occupancy in Scammon Bay
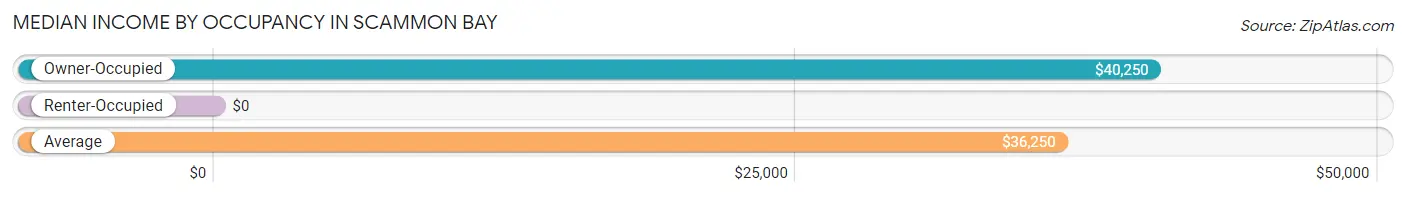
| Occupancy Type | # Households | Median Income |
| Owner-Occupied | 79 (62.7%) | $40,250 |
| Renter-Occupied | 47 (37.3%) | $0 |
| Average | 126 (100.0%) | $36,250 |
Occupancy by Householder Income Bracket in Scammon Bay
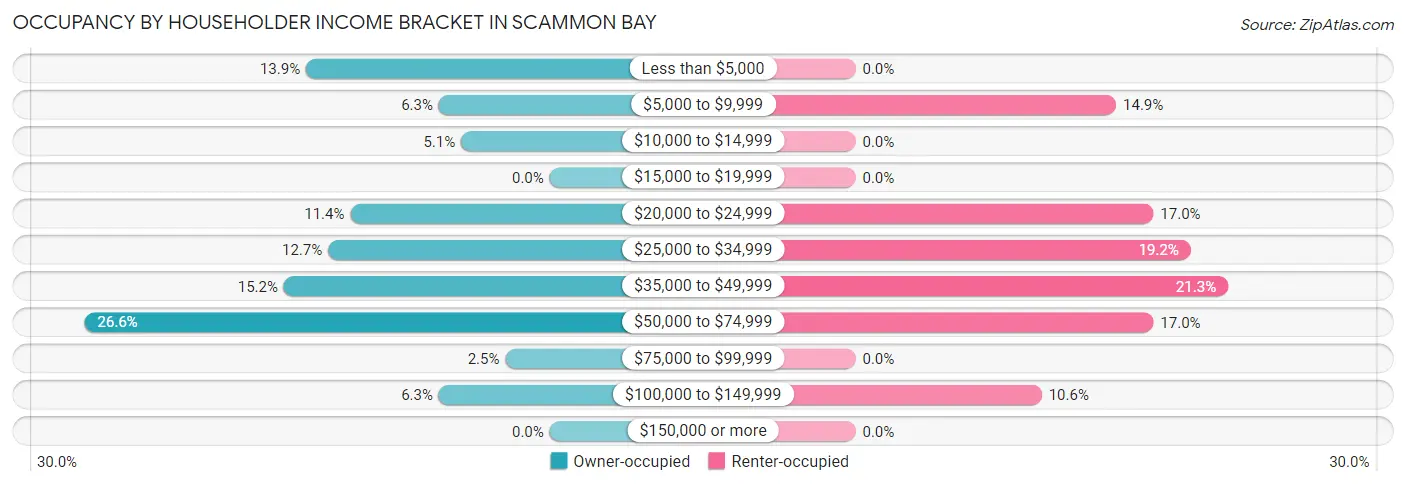
| Income Bracket | Owner-occupied | Renter-occupied |
| Less than $5,000 | 11 (13.9%) | 0 (0.0%) |
| $5,000 to $9,999 | 5 (6.3%) | 7 (14.9%) |
| $10,000 to $14,999 | 4 (5.1%) | 0 (0.0%) |
| $15,000 to $19,999 | 0 (0.0%) | 0 (0.0%) |
| $20,000 to $24,999 | 9 (11.4%) | 8 (17.0%) |
| $25,000 to $34,999 | 10 (12.7%) | 9 (19.2%) |
| $35,000 to $49,999 | 12 (15.2%) | 10 (21.3%) |
| $50,000 to $74,999 | 21 (26.6%) | 8 (17.0%) |
| $75,000 to $99,999 | 2 (2.5%) | 0 (0.0%) |
| $100,000 to $149,999 | 5 (6.3%) | 5 (10.6%) |
| $150,000 or more | 0 (0.0%) | 0 (0.0%) |
| Total | 79 (100.0%) | 47 (100.0%) |
Monthly Housing Cost Tiers in Scammon Bay
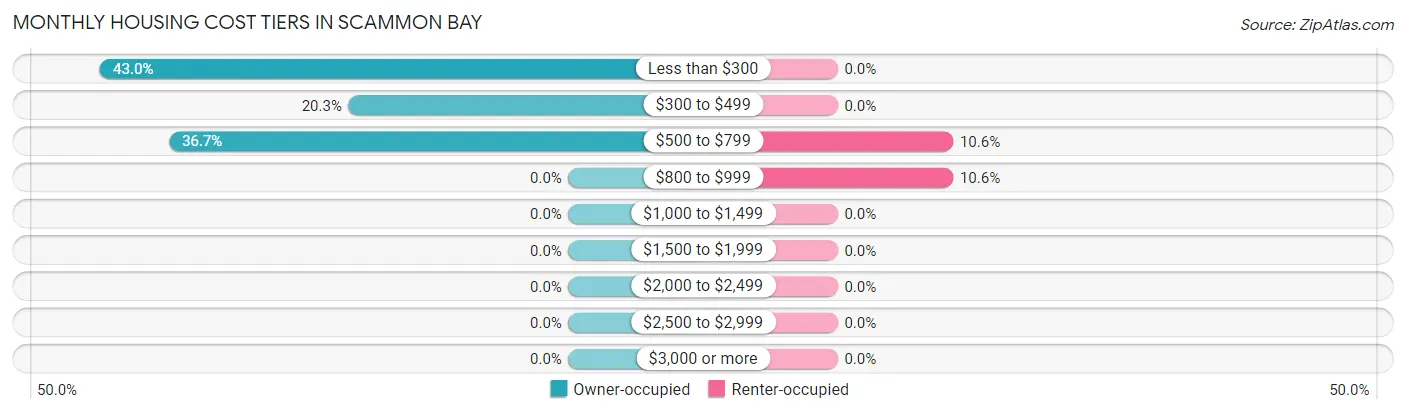
| Monthly Cost | Owner-occupied | Renter-occupied |
| Less than $300 | 34 (43.0%) | 0 (0.0%) |
| $300 to $499 | 16 (20.3%) | 0 (0.0%) |
| $500 to $799 | 29 (36.7%) | 5 (10.6%) |
| $800 to $999 | 0 (0.0%) | 5 (10.6%) |
| $1,000 to $1,499 | 0 (0.0%) | 0 (0.0%) |
| $1,500 to $1,999 | 0 (0.0%) | 0 (0.0%) |
| $2,000 to $2,499 | 0 (0.0%) | 0 (0.0%) |
| $2,500 to $2,999 | 0 (0.0%) | 0 (0.0%) |
| $3,000 or more | 0 (0.0%) | 0 (0.0%) |
| Total | 79 (100.0%) | 47 (100.0%) |
Physical Housing Characteristics in Scammon Bay
Housing Structures in Scammon Bay
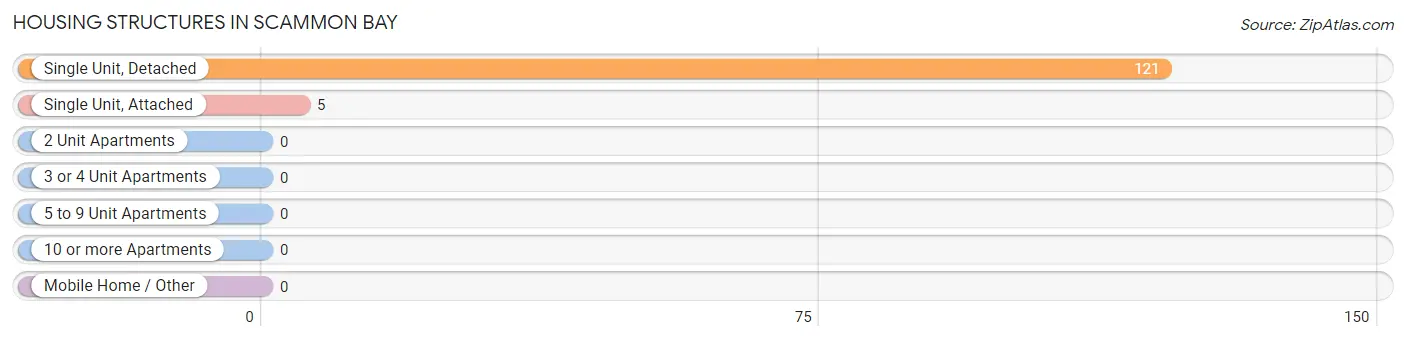
| Structure Type | # Housing Units | % Housing Units |
| Single Unit, Detached | 121 | 96.0% |
| Single Unit, Attached | 5 | 4.0% |
| 2 Unit Apartments | 0 | 0.0% |
| 3 or 4 Unit Apartments | 0 | 0.0% |
| 5 to 9 Unit Apartments | 0 | 0.0% |
| 10 or more Apartments | 0 | 0.0% |
| Mobile Home / Other | 0 | 0.0% |
| Total | 126 | 100.0% |
Housing Structures by Occupancy in Scammon Bay
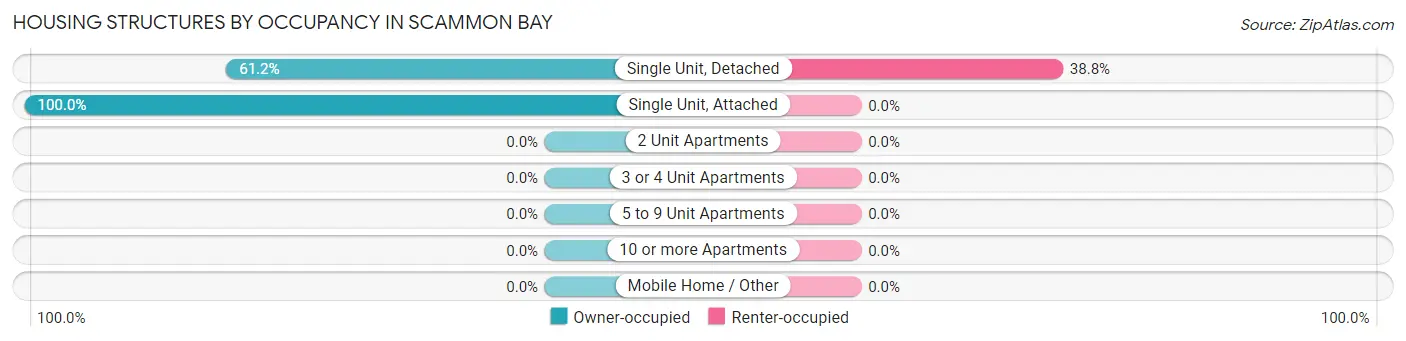
| Structure Type | Owner-occupied | Renter-occupied |
| Single Unit, Detached | 74 (61.2%) | 47 (38.8%) |
| Single Unit, Attached | 5 (100.0%) | 0 (0.0%) |
| 2 Unit Apartments | 0 (0.0%) | 0 (0.0%) |
| 3 or 4 Unit Apartments | 0 (0.0%) | 0 (0.0%) |
| 5 to 9 Unit Apartments | 0 (0.0%) | 0 (0.0%) |
| 10 or more Apartments | 0 (0.0%) | 0 (0.0%) |
| Mobile Home / Other | 0 (0.0%) | 0 (0.0%) |
| Total | 79 (62.7%) | 47 (37.3%) |
Housing Structures by Number of Rooms in Scammon Bay
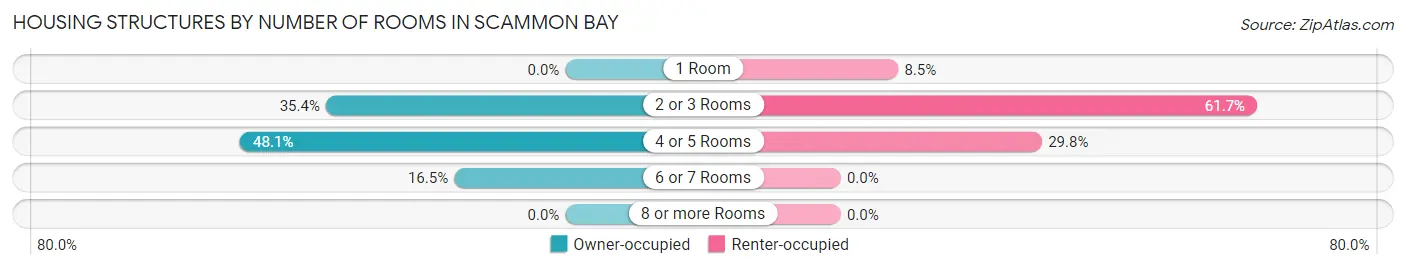
| Number of Rooms | Owner-occupied | Renter-occupied |
| 1 Room | 0 (0.0%) | 4 (8.5%) |
| 2 or 3 Rooms | 28 (35.4%) | 29 (61.7%) |
| 4 or 5 Rooms | 38 (48.1%) | 14 (29.8%) |
| 6 or 7 Rooms | 13 (16.5%) | 0 (0.0%) |
| 8 or more Rooms | 0 (0.0%) | 0 (0.0%) |
| Total | 79 (100.0%) | 47 (100.0%) |
Housing Structure by Heating Type in Scammon Bay
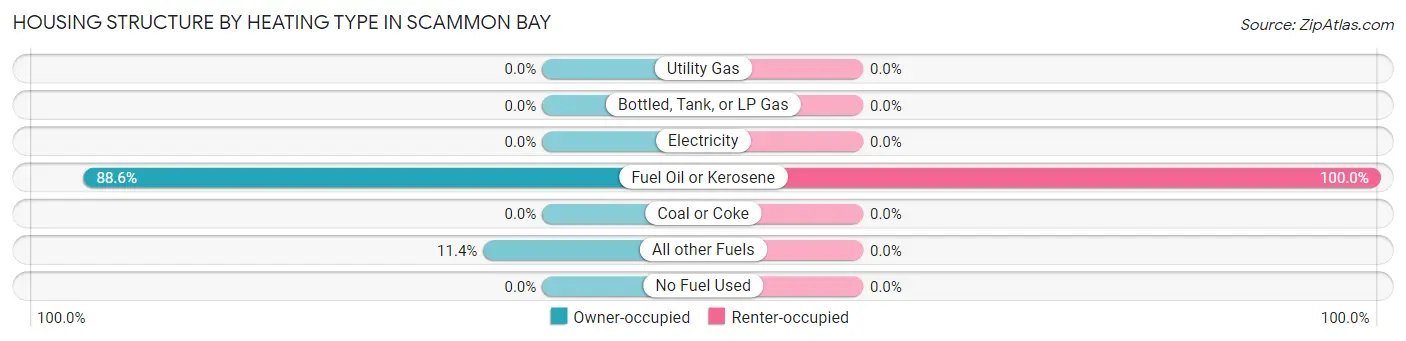
| Heating Type | Owner-occupied | Renter-occupied |
| Utility Gas | 0 (0.0%) | 0 (0.0%) |
| Bottled, Tank, or LP Gas | 0 (0.0%) | 0 (0.0%) |
| Electricity | 0 (0.0%) | 0 (0.0%) |
| Fuel Oil or Kerosene | 70 (88.6%) | 47 (100.0%) |
| Coal or Coke | 0 (0.0%) | 0 (0.0%) |
| All other Fuels | 9 (11.4%) | 0 (0.0%) |
| No Fuel Used | 0 (0.0%) | 0 (0.0%) |
| Total | 79 (100.0%) | 47 (100.0%) |
Household Vehicle Usage in Scammon Bay
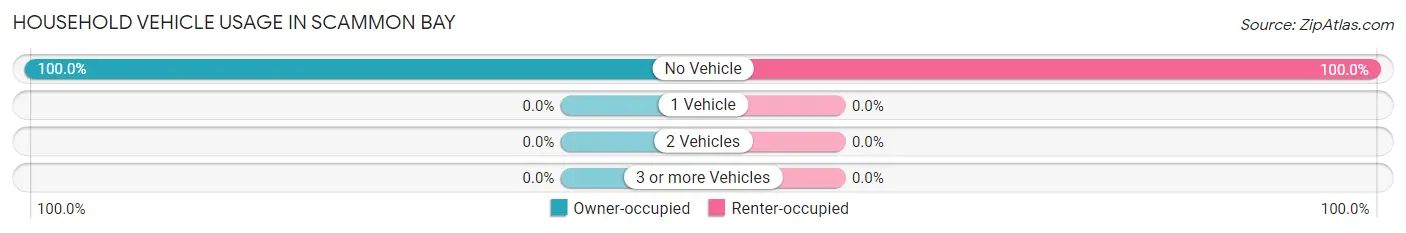
| Vehicles per Household | Owner-occupied | Renter-occupied |
| No Vehicle | 79 (100.0%) | 47 (100.0%) |
| 1 Vehicle | 0 (0.0%) | 0 (0.0%) |
| 2 Vehicles | 0 (0.0%) | 0 (0.0%) |
| 3 or more Vehicles | 0 (0.0%) | 0 (0.0%) |
| Total | 79 (100.0%) | 47 (100.0%) |
Real Estate & Mortgages in Scammon Bay
Real Estate and Mortgage Overview in Scammon Bay
| Characteristic | Without Mortgage | With Mortgage |
| Housing Units | 67 | 12 |
| Median Property Value | $75,400 | $333,300 |
| Median Household Income | $31,750 | $0 |
| Monthly Housing Costs | - | - |
| Real Estate Taxes | - | - |
Property Value by Mortgage Status in Scammon Bay
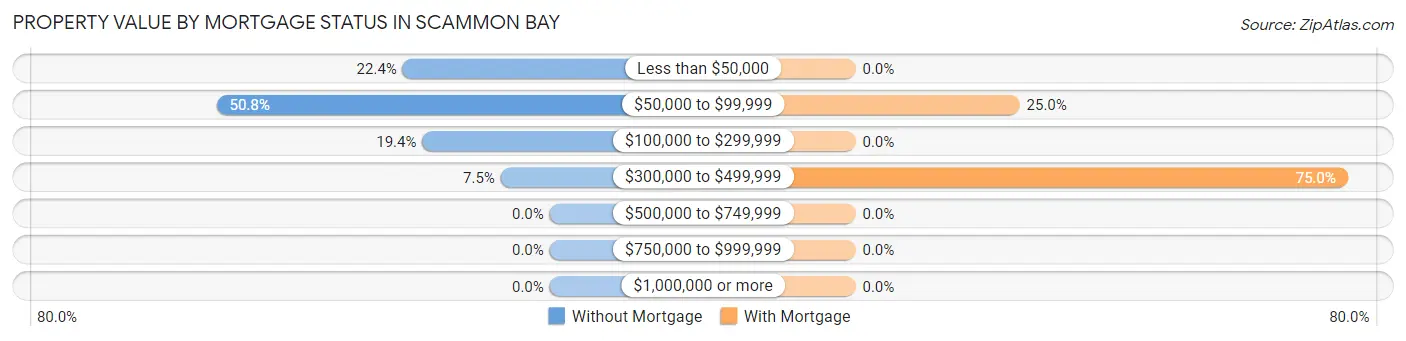
| Property Value | Without Mortgage | With Mortgage |
| Less than $50,000 | 15 (22.4%) | 0 (0.0%) |
| $50,000 to $99,999 | 34 (50.7%) | 3 (25.0%) |
| $100,000 to $299,999 | 13 (19.4%) | 0 (0.0%) |
| $300,000 to $499,999 | 5 (7.5%) | 9 (75.0%) |
| $500,000 to $749,999 | 0 (0.0%) | 0 (0.0%) |
| $750,000 to $999,999 | 0 (0.0%) | 0 (0.0%) |
| $1,000,000 or more | 0 (0.0%) | 0 (0.0%) |
| Total | 67 (100.0%) | 12 (100.0%) |
Household Income by Mortgage Status in Scammon Bay
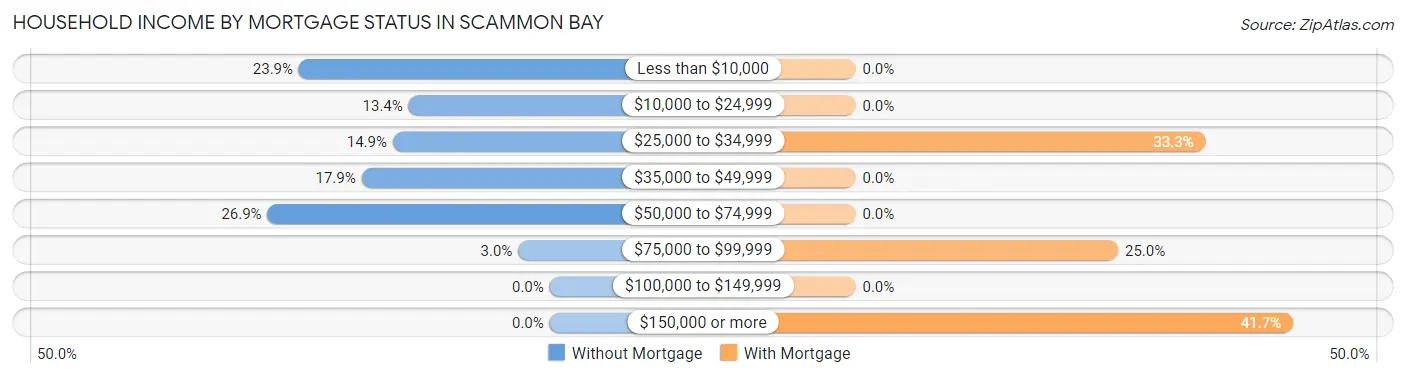
| Household Income | Without Mortgage | With Mortgage |
| Less than $10,000 | 16 (23.9%) | 0 (0.0%) |
| $10,000 to $24,999 | 9 (13.4%) | 0 (0.0%) |
| $25,000 to $34,999 | 10 (14.9%) | 4 (33.3%) |
| $35,000 to $49,999 | 12 (17.9%) | 0 (0.0%) |
| $50,000 to $74,999 | 18 (26.9%) | 0 (0.0%) |
| $75,000 to $99,999 | 2 (3.0%) | 3 (25.0%) |
| $100,000 to $149,999 | 0 (0.0%) | 0 (0.0%) |
| $150,000 or more | 0 (0.0%) | 5 (41.7%) |
| Total | 67 (100.0%) | 12 (100.0%) |
Property Value to Household Income Ratio in Scammon Bay
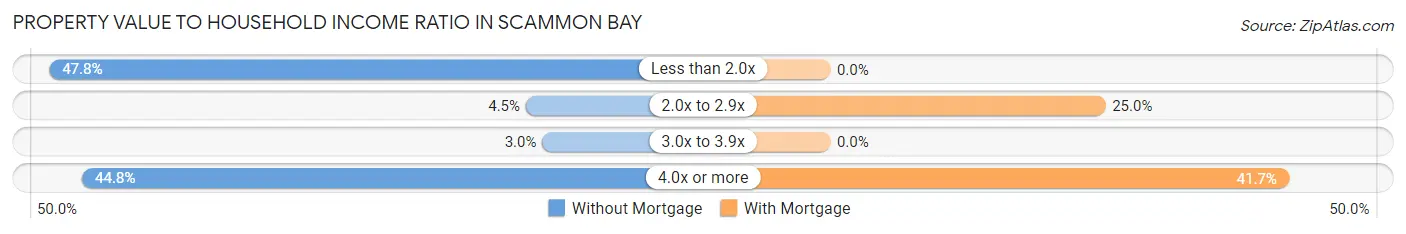
| Value-to-Income Ratio | Without Mortgage | With Mortgage |
| Less than 2.0x | 32 (47.8%) | 0 (0.0%) |
| 2.0x to 2.9x | 3 (4.5%) | 3 (25.0%) |
| 3.0x to 3.9x | 2 (3.0%) | 0 (0.0%) |
| 4.0x or more | 30 (44.8%) | 5 (41.7%) |
| Total | 67 (100.0%) | 12 (100.0%) |
Real Estate Taxes by Mortgage Status in Scammon Bay
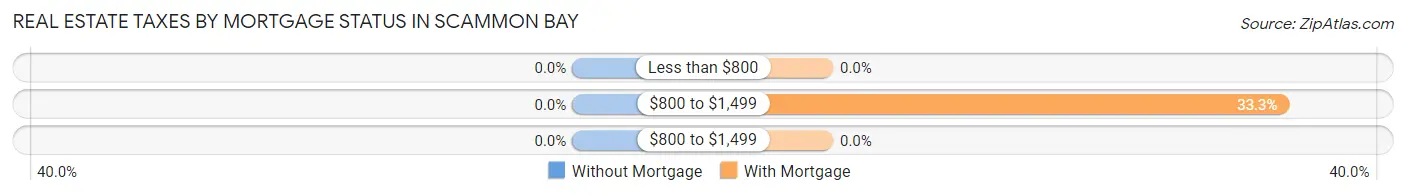
| Property Taxes | Without Mortgage | With Mortgage |
| Less than $800 | 0 (0.0%) | 0 (0.0%) |
| $800 to $1,499 | 0 (0.0%) | 4 (33.3%) |
| $800 to $1,499 | 0 (0.0%) | 0 (0.0%) |
| Total | 67 (100.0%) | 12 (100.0%) |
Health & Disability in Scammon Bay
Health Insurance Coverage by Age in Scammon Bay
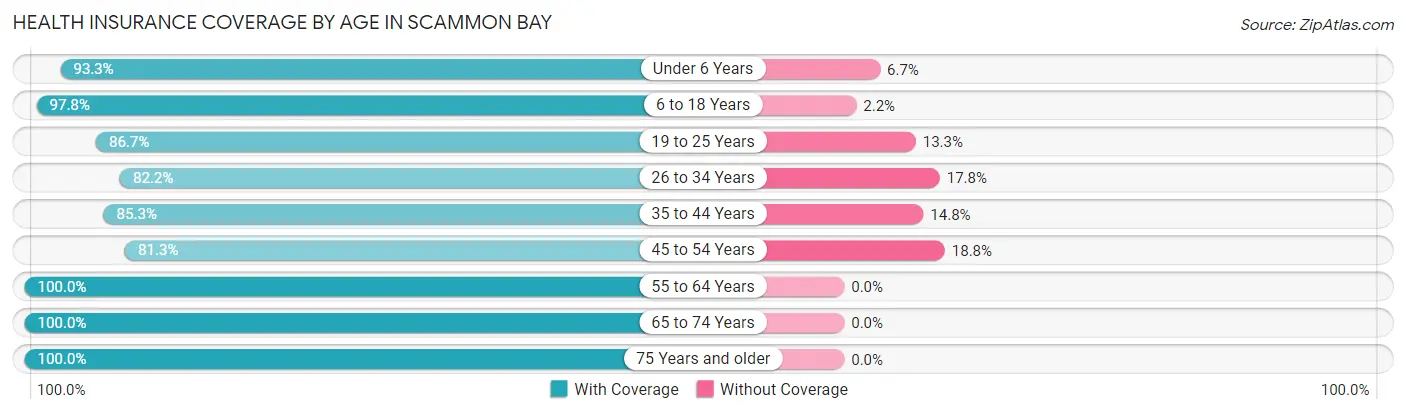
| Age Bracket | With Coverage | Without Coverage |
| Under 6 Years | 98 (93.3%) | 7 (6.7%) |
| 6 to 18 Years | 131 (97.8%) | 3 (2.2%) |
| 19 to 25 Years | 52 (86.7%) | 8 (13.3%) |
| 26 to 34 Years | 60 (82.2%) | 13 (17.8%) |
| 35 to 44 Years | 52 (85.3%) | 9 (14.7%) |
| 45 to 54 Years | 13 (81.2%) | 3 (18.8%) |
| 55 to 64 Years | 28 (100.0%) | 0 (0.0%) |
| 65 to 74 Years | 18 (100.0%) | 0 (0.0%) |
| 75 Years and older | 11 (100.0%) | 0 (0.0%) |
| Total | 463 (91.5%) | 43 (8.5%) |
Health Insurance Coverage by Citizenship Status in Scammon Bay
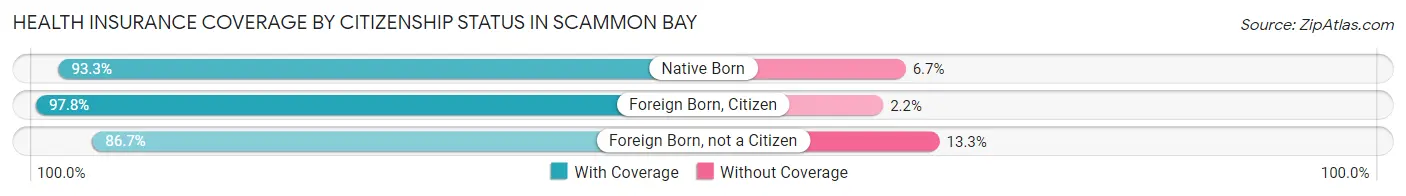
| Citizenship Status | With Coverage | Without Coverage |
| Native Born | 98 (93.3%) | 7 (6.7%) |
| Foreign Born, Citizen | 131 (97.8%) | 3 (2.2%) |
| Foreign Born, not a Citizen | 52 (86.7%) | 8 (13.3%) |
Health Insurance Coverage by Household Income in Scammon Bay
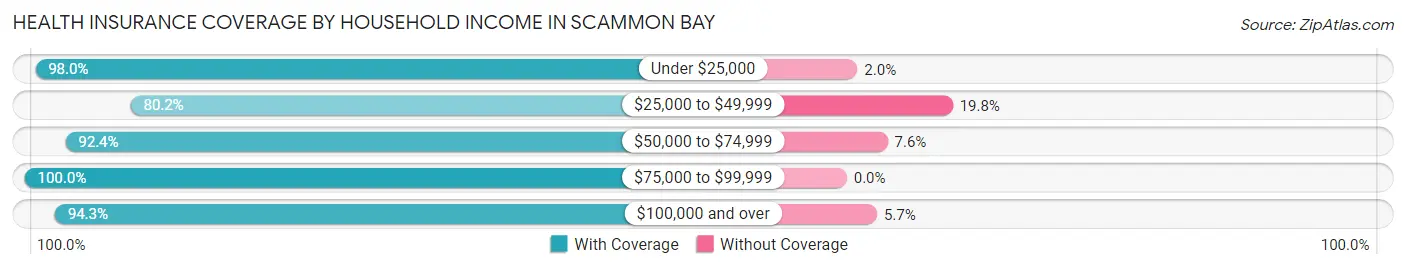
| Household Income | With Coverage | Without Coverage |
| Under $25,000 | 148 (98.0%) | 3 (2.0%) |
| $25,000 to $49,999 | 101 (80.2%) | 25 (19.8%) |
| $50,000 to $74,999 | 145 (92.4%) | 12 (7.6%) |
| $75,000 to $99,999 | 19 (100.0%) | 0 (0.0%) |
| $100,000 and over | 50 (94.3%) | 3 (5.7%) |
Public vs Private Health Insurance Coverage by Age in Scammon Bay
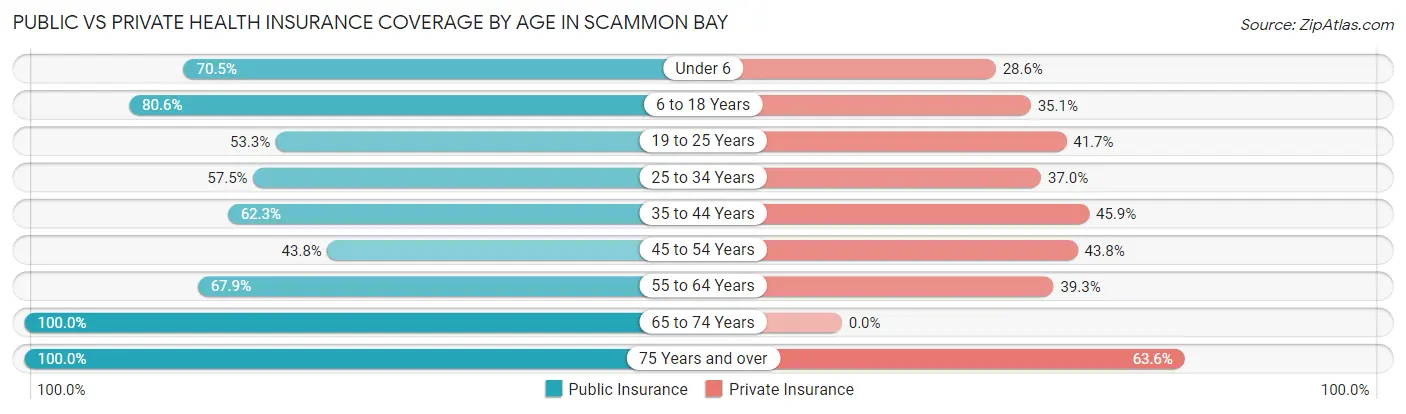
| Age Bracket | Public Insurance | Private Insurance |
| Under 6 | 74 (70.5%) | 30 (28.6%) |
| 6 to 18 Years | 108 (80.6%) | 47 (35.1%) |
| 19 to 25 Years | 32 (53.3%) | 25 (41.7%) |
| 25 to 34 Years | 42 (57.5%) | 27 (37.0%) |
| 35 to 44 Years | 38 (62.3%) | 28 (45.9%) |
| 45 to 54 Years | 7 (43.8%) | 7 (43.8%) |
| 55 to 64 Years | 19 (67.9%) | 11 (39.3%) |
| 65 to 74 Years | 18 (100.0%) | 0 (0.0%) |
| 75 Years and over | 11 (100.0%) | 7 (63.6%) |
| Total | 349 (69.0%) | 182 (36.0%) |
Disability Status by Sex by Age in Scammon Bay
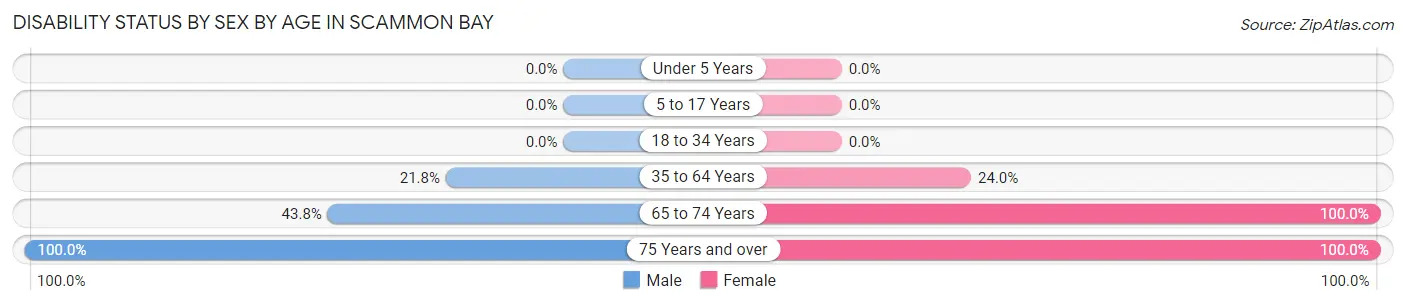
| Age Bracket | Male | Female |
| Under 5 Years | 0 (0.0%) | 0 (0.0%) |
| 5 to 17 Years | 0 (0.0%) | 0 (0.0%) |
| 18 to 34 Years | 0 (0.0%) | 0 (0.0%) |
| 35 to 64 Years | 12 (21.8%) | 12 (24.0%) |
| 65 to 74 Years | 7 (43.8%) | 2 (100.0%) |
| 75 Years and over | 2 (100.0%) | 9 (100.0%) |
Disability Class by Sex by Age in Scammon Bay
Disability Class: Hearing Difficulty
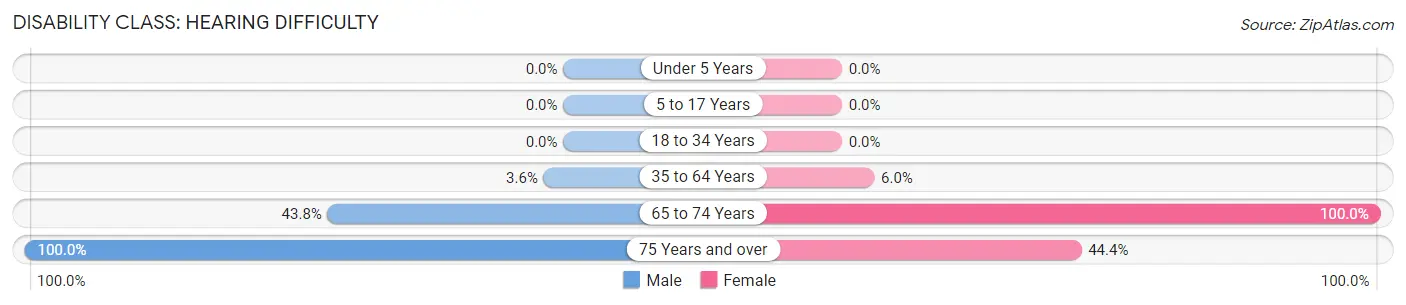
| Age Bracket | Male | Female |
| Under 5 Years | 0 (0.0%) | 0 (0.0%) |
| 5 to 17 Years | 0 (0.0%) | 0 (0.0%) |
| 18 to 34 Years | 0 (0.0%) | 0 (0.0%) |
| 35 to 64 Years | 2 (3.6%) | 3 (6.0%) |
| 65 to 74 Years | 7 (43.8%) | 2 (100.0%) |
| 75 Years and over | 2 (100.0%) | 4 (44.4%) |
Disability Class: Vision Difficulty
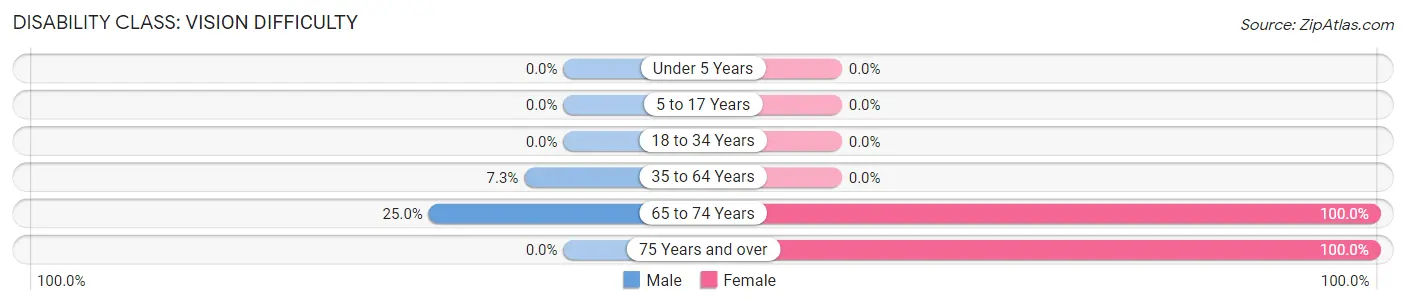
| Age Bracket | Male | Female |
| Under 5 Years | 0 (0.0%) | 0 (0.0%) |
| 5 to 17 Years | 0 (0.0%) | 0 (0.0%) |
| 18 to 34 Years | 0 (0.0%) | 0 (0.0%) |
| 35 to 64 Years | 4 (7.3%) | 0 (0.0%) |
| 65 to 74 Years | 4 (25.0%) | 2 (100.0%) |
| 75 Years and over | 0 (0.0%) | 9 (100.0%) |
Disability Class: Cognitive Difficulty
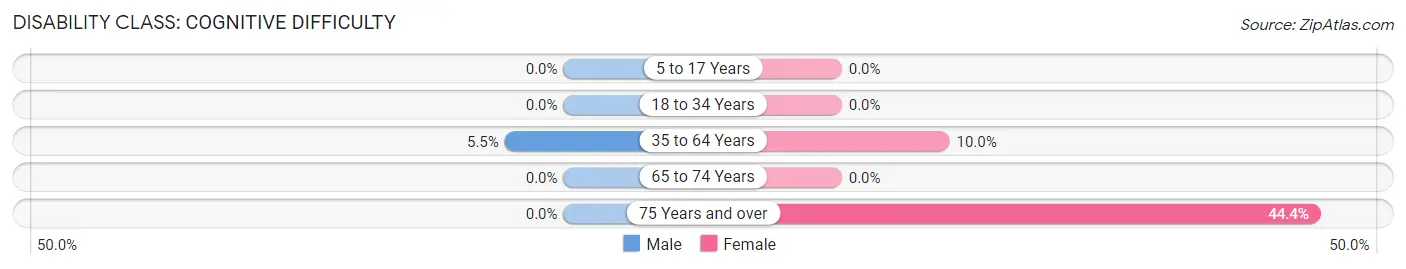
| Age Bracket | Male | Female |
| 5 to 17 Years | 0 (0.0%) | 0 (0.0%) |
| 18 to 34 Years | 0 (0.0%) | 0 (0.0%) |
| 35 to 64 Years | 3 (5.4%) | 5 (10.0%) |
| 65 to 74 Years | 0 (0.0%) | 0 (0.0%) |
| 75 Years and over | 0 (0.0%) | 4 (44.4%) |
Disability Class: Ambulatory Difficulty
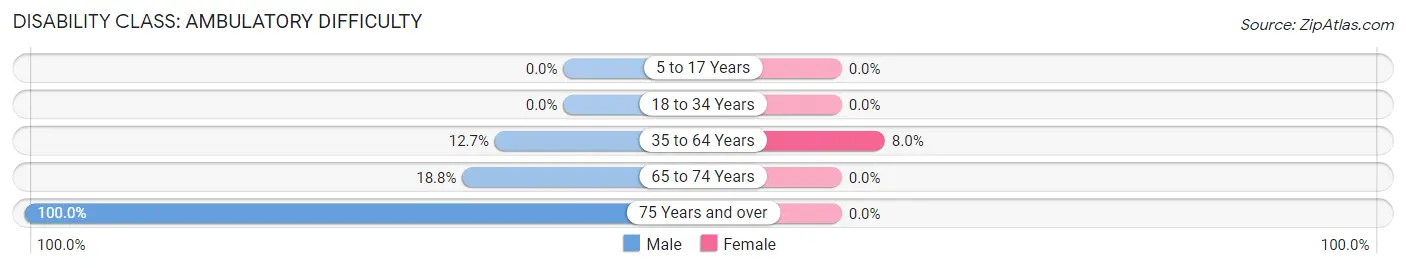
| Age Bracket | Male | Female |
| 5 to 17 Years | 0 (0.0%) | 0 (0.0%) |
| 18 to 34 Years | 0 (0.0%) | 0 (0.0%) |
| 35 to 64 Years | 7 (12.7%) | 4 (8.0%) |
| 65 to 74 Years | 3 (18.8%) | 0 (0.0%) |
| 75 Years and over | 2 (100.0%) | 0 (0.0%) |
Disability Class: Self-Care Difficulty
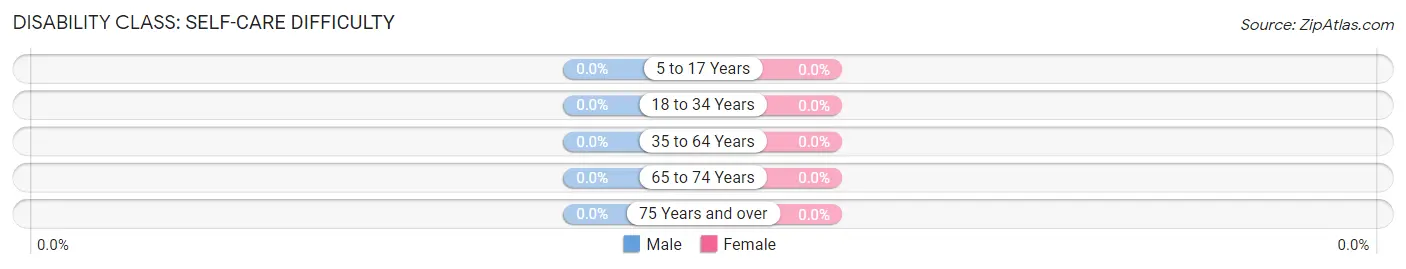
| Age Bracket | Male | Female |
| 5 to 17 Years | 0 (0.0%) | 0 (0.0%) |
| 18 to 34 Years | 0 (0.0%) | 0 (0.0%) |
| 35 to 64 Years | 0 (0.0%) | 0 (0.0%) |
| 65 to 74 Years | 0 (0.0%) | 0 (0.0%) |
| 75 Years and over | 0 (0.0%) | 0 (0.0%) |
Technology Access in Scammon Bay
Computing Device Access in Scammon Bay
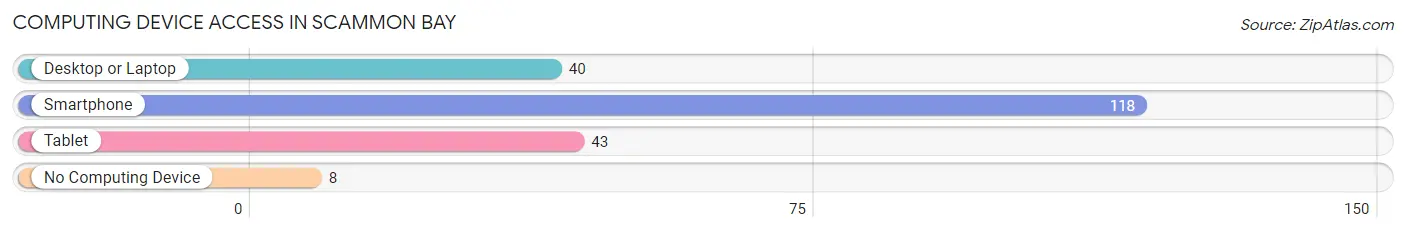
| Device Type | # Households | % Households |
| Desktop or Laptop | 40 | 31.8% |
| Smartphone | 118 | 93.6% |
| Tablet | 43 | 34.1% |
| No Computing Device | 8 | 6.4% |
| Total | 126 | 100.0% |
Internet Access in Scammon Bay
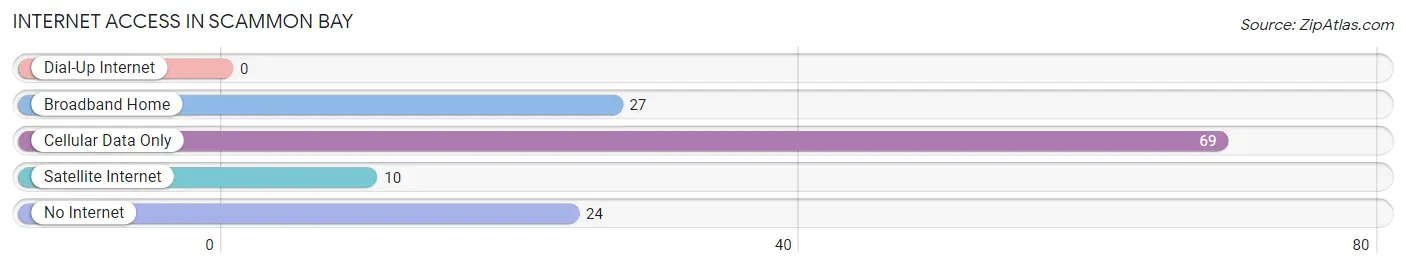
| Internet Type | # Households | % Households |
| Dial-Up Internet | 0 | 0.0% |
| Broadband Home | 27 | 21.4% |
| Cellular Data Only | 69 | 54.8% |
| Satellite Internet | 10 | 7.9% |
| No Internet | 24 | 19.1% |
| Total | 126 | 100.0% |
Scammon Bay Summary
Scammon Bay is a small city located in the western part of Alaska, on the Bering Sea coast. It is part of the Kusilvak Census Area and is the largest city in the area. The population of Scammon Bay was 602 in the 2010 census, making it the second-largest city in the Kusilvak Census Area.
History
Scammon Bay was first settled by the Yup'ik people, who have lived in the area for thousands of years. The Yup'ik name for the area is Qasigialingmiut, which means "people of the bay." The first non-native settlers arrived in the area in the late 1800s, when Russian fur traders and gold miners began to explore the area.
In the early 1900s, the area was settled by a group of Yup'ik people who had been displaced from their traditional villages by the construction of the Alaska Railroad. The Yup'ik people established a village in the area, which they named Scammon Bay after the American whaling captain, Benjamin Scammon.
In the 1950s, the Alaska Native Claims Settlement Act (ANCSA) was passed, which allowed the Yup'ik people to claim land in the area. The Yup'ik people established the village of Scammon Bay, which was incorporated in 1962.
Geography
Scammon Bay is located on the Bering Sea coast, in the western part of Alaska. It is part of the Kusilvak Census Area and is the largest city in the area. The city is located on the north shore of the bay, which is approximately 10 miles long and 5 miles wide. The bay is surrounded by mountains and is home to a variety of wildlife, including seals, sea lions, whales, and sea birds.
The climate in Scammon Bay is subarctic, with cold winters and mild summers. The average temperature in the summer is around 50°F, and the average temperature in the winter is around 10°F.
Economy
The economy of Scammon Bay is largely based on fishing and subsistence activities. The city is home to a number of commercial fishing operations, which harvest salmon, halibut, and other fish from the Bering Sea. The city also has a number of subsistence activities, such as hunting, trapping, and gathering.
The city is also home to a number of small businesses, including a grocery store, a hardware store, and a restaurant. The city also has a number of services, such as a post office, a library, and a health clinic.
Demographics
As of the 2010 census, the population of Scammon Bay was 602. The population is primarily Yup'ik, with a small number of non-native residents. The median age of the population is 28.7 years, and the median household income is $37,500.
Conclusion
Scammon Bay is a small city located in the western part of Alaska, on the Bering Sea coast. It is part of the Kusilvak Census Area and is the largest city in the area. The population of Scammon Bay is primarily Yup'ik, and the economy is largely based on fishing and subsistence activities. The city is home to a number of small businesses, and has a number of services, such as a post office, a library, and a health clinic.
Common Questions
What is Per Capita Income in Scammon Bay?
Per Capita income in Scammon Bay is $10,118.
What is the Median Family Income in Scammon Bay?
Median Family Income in Scammon Bay is $40,250.
What is the Median Household income in Scammon Bay?
Median Household Income in Scammon Bay is $36,250.
What is Income or Wage Gap in Scammon Bay?
Income or Wage Gap in Scammon Bay is 51.7%.
Women in Scammon Bay earn 48.3 cents for every dollar earned by a man.
What is Inequality or Gini Index in Scammon Bay?
Inequality or Gini Index in Scammon Bay is 0.39.
What is the Total Population of Scammon Bay?
Total Population of Scammon Bay is 506.
What is the Total Male Population of Scammon Bay?
Total Male Population of Scammon Bay is 281.
What is the Total Female Population of Scammon Bay?
Total Female Population of Scammon Bay is 225.
What is the Ratio of Males per 100 Females in Scammon Bay?
There are 124.89 Males per 100 Females in Scammon Bay.
What is the Ratio of Females per 100 Males in Scammon Bay?
There are 80.07 Females per 100 Males in Scammon Bay.
What is the Median Population Age in Scammon Bay?
Median Population Age in Scammon Bay is 21.2 Years.
What is the Average Family Size in Scammon Bay
Average Family Size in Scammon Bay is 4.5 People.
What is the Average Household Size in Scammon Bay
Average Household Size in Scammon Bay is 4.0 People.
How Large is the Labor Force in Scammon Bay?
There are 165 People in the Labor Forcein in Scammon Bay.
What is the Percentage of People in the Labor Force in Scammon Bay?
57.7% of People are in the Labor Force in Scammon Bay.
What is the Unemployment Rate in Scammon Bay?
Unemployment Rate in Scammon Bay is 26.7%.