Thornton, WI Map & Demographics
Thornton Map
Thornton Overview
$35,975
PER CAPITA INCOME
$68,125
AVG FAMILY INCOME
$74,583
AVG HOUSEHOLD INCOME
15.7%
WAGE / INCOME GAP [ % ]
84.3¢/ $1
WAGE / INCOME GAP [ $ ]
0.15
INEQUALITY / GINI INDEX
44
TOTAL POPULATION
19
MALE POPULATION
25
FEMALE POPULATION
76.00
MALES / 100 FEMALES
131.58
FEMALES / 100 MALES
38.1
MEDIAN AGE
2.4
AVG FAMILY SIZE
2.1
AVG HOUSEHOLD SIZE
30
LABOR FORCE [ PEOPLE ]
90.9%
PERCENT IN LABOR FORCE
Income in Thornton
Income Overview in Thornton
Per Capita Income in Thornton is $35,975, while median incomes of families and households are $68,125 and $74,583 respectively.
| Characteristic | Number | Measure |
| Per Capita Income | 44 | $35,975 |
| Median Family Income | 15 | $68,125 |
| Mean Family Income | 15 | $74,433 |
| Median Household Income | 21 | $74,583 |
| Mean Household Income | 21 | $82,386 |
| Income Deficit | 15 | $0 |
| Wage / Income Gap (%) | 44 | 15.71% |
| Wage / Income Gap ($) | 44 | 84.29¢ per $1 |
| Gini / Inequality Index | 44 | 0.15 |
Earnings by Sex in Thornton
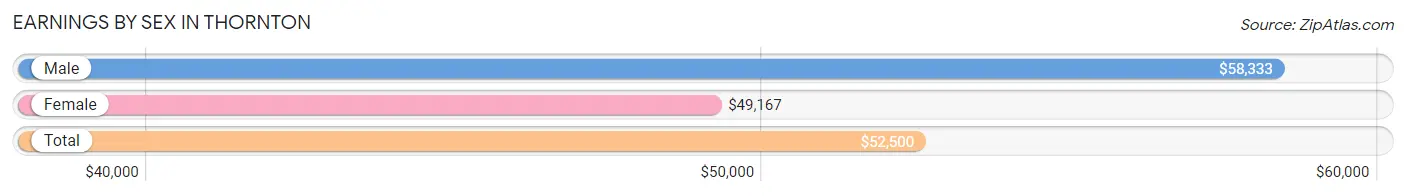
Average Earnings in Thornton are $52,500, $58,333 for men and $49,167 for women, a difference of 15.7%.
| Sex | Number | Average Earnings |
| Male | 14 (46.7%) | $58,333 |
| Female | 16 (53.3%) | $49,167 |
| Total | 30 (100.0%) | $52,500 |
Earnings by Sex by Income Bracket in Thornton
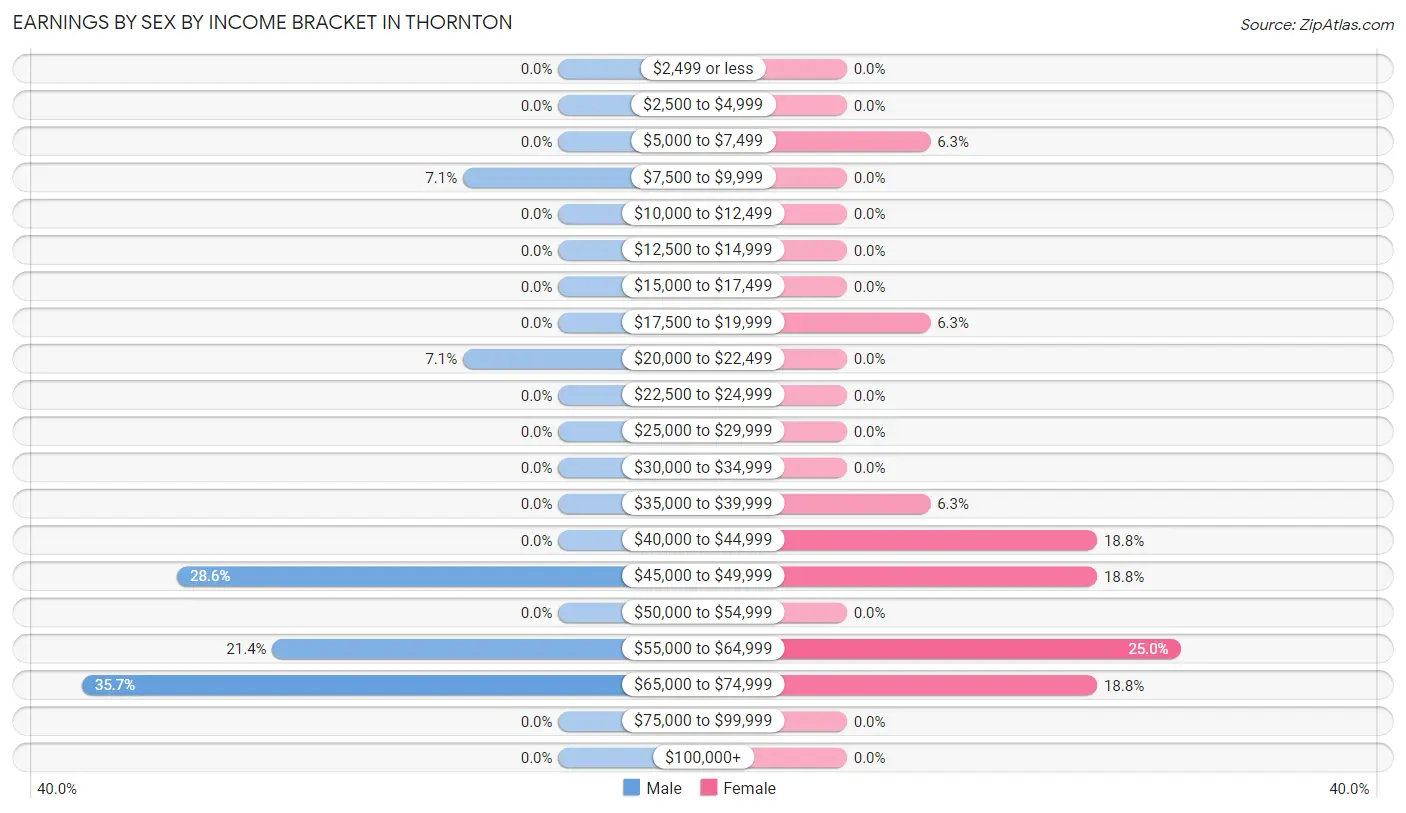
The most common earnings brackets in Thornton are $65,000 to $74,999 for men (5 | 35.7%) and $55,000 to $64,999 for women (4 | 25.0%).
| Income | Male | Female |
| $2,499 or less | 0 (0.0%) | 0 (0.0%) |
| $2,500 to $4,999 | 0 (0.0%) | 0 (0.0%) |
| $5,000 to $7,499 | 0 (0.0%) | 1 (6.2%) |
| $7,500 to $9,999 | 1 (7.1%) | 0 (0.0%) |
| $10,000 to $12,499 | 0 (0.0%) | 0 (0.0%) |
| $12,500 to $14,999 | 0 (0.0%) | 0 (0.0%) |
| $15,000 to $17,499 | 0 (0.0%) | 0 (0.0%) |
| $17,500 to $19,999 | 0 (0.0%) | 1 (6.2%) |
| $20,000 to $22,499 | 1 (7.1%) | 0 (0.0%) |
| $22,500 to $24,999 | 0 (0.0%) | 0 (0.0%) |
| $25,000 to $29,999 | 0 (0.0%) | 0 (0.0%) |
| $30,000 to $34,999 | 0 (0.0%) | 0 (0.0%) |
| $35,000 to $39,999 | 0 (0.0%) | 1 (6.2%) |
| $40,000 to $44,999 | 0 (0.0%) | 3 (18.8%) |
| $45,000 to $49,999 | 4 (28.6%) | 3 (18.8%) |
| $50,000 to $54,999 | 0 (0.0%) | 0 (0.0%) |
| $55,000 to $64,999 | 3 (21.4%) | 4 (25.0%) |
| $65,000 to $74,999 | 5 (35.7%) | 3 (18.8%) |
| $75,000 to $99,999 | 0 (0.0%) | 0 (0.0%) |
| $100,000+ | 0 (0.0%) | 0 (0.0%) |
| Total | 14 (100.0%) | 16 (100.0%) |
Earnings by Sex by Educational Attainment in Thornton
| Educational Attainment | Male Income | Female Income |
| Less than High School | - | - |
| High School Diploma | - | - |
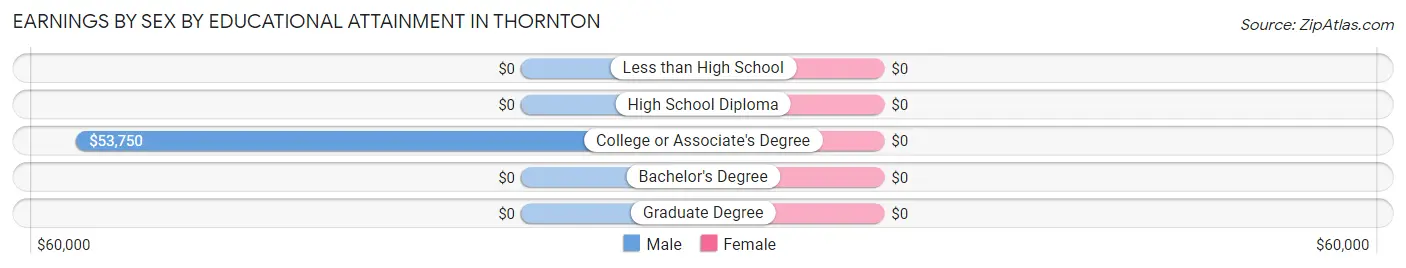
| College or Associate's Degree | $53,750 | $0 |
| Bachelor's Degree | - | - |
| Graduate Degree | - | - |
| Total | $58,333 | $49,167 |
Family Income in Thornton
Family Income Brackets in Thornton
According to the Thornton family income data, there are 7 families falling into the $50,000 to $74,999 income range, which is the most common income bracket and makes up 46.7% of all families.
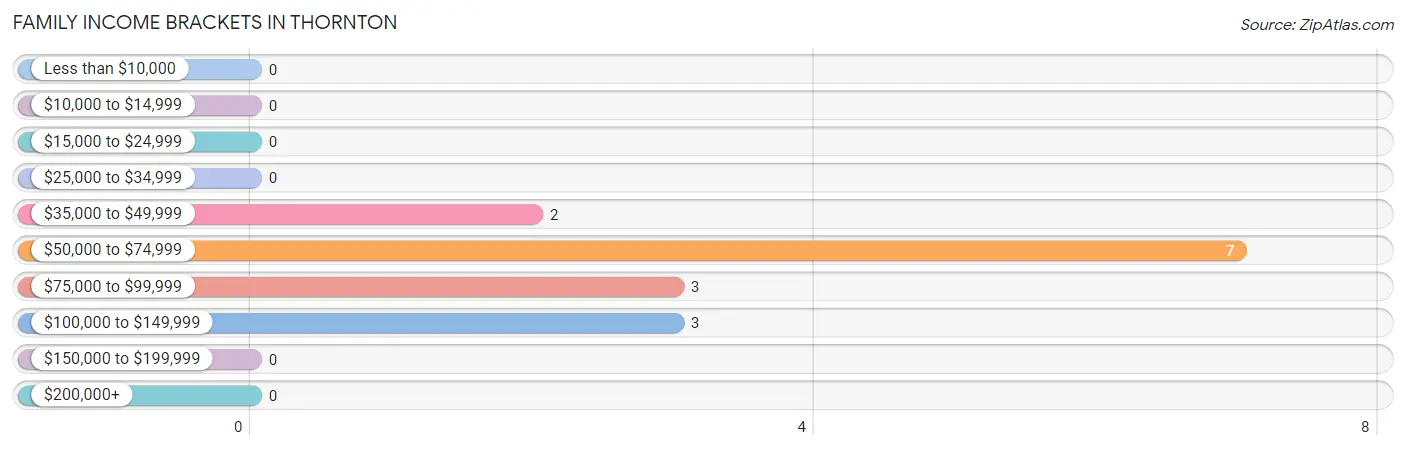
| Income Bracket | # Families | % Families |
| Less than $10,000 | 0 | 0.0% |
| $10,000 to $14,999 | 0 | 0.0% |
| $15,000 to $24,999 | 0 | 0.0% |
| $25,000 to $34,999 | 0 | 0.0% |
| $35,000 to $49,999 | 2 | 13.3% |
| $50,000 to $74,999 | 7 | 46.7% |
| $75,000 to $99,999 | 3 | 20.0% |
| $100,000 to $149,999 | 3 | 20.0% |
| $150,000 to $199,999 | 0 | 0.0% |
| $200,000+ | 0 | 0.0% |
Family Income by Famaliy Size in Thornton
2-person families (9 | 60.0%) account for the highest median family income in Thornton with $96,250 per family, while 2-person families (9 | 60.0%) have the highest median income of $48,125 per family member.
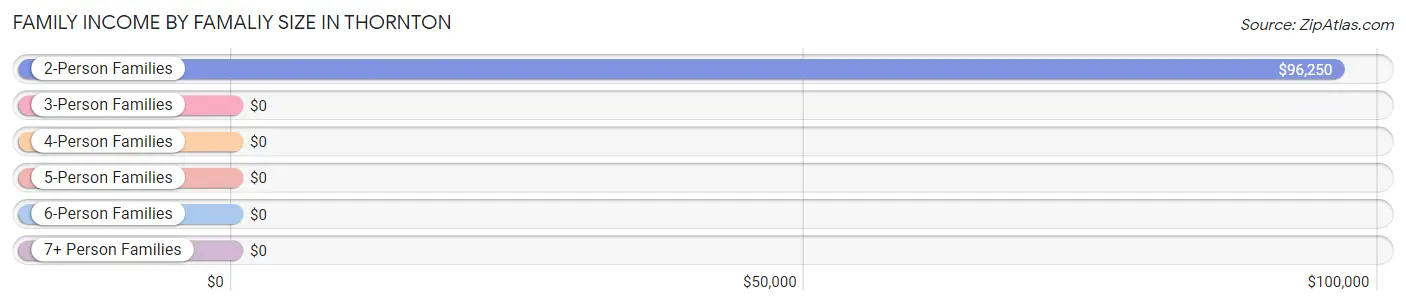
| Income Bracket | # Families | Median Income |
| 2-Person Families | 9 (60.0%) | $96,250 |
| 3-Person Families | 4 (26.7%) | $0 |
| 4-Person Families | 0 (0.0%) | $0 |
| 5-Person Families | 2 (13.3%) | $0 |
| 6-Person Families | 0 (0.0%) | $0 |
| 7+ Person Families | 0 (0.0%) | $0 |
| Total | 15 (100.0%) | $68,125 |
Family Income by Number of Earners in Thornton
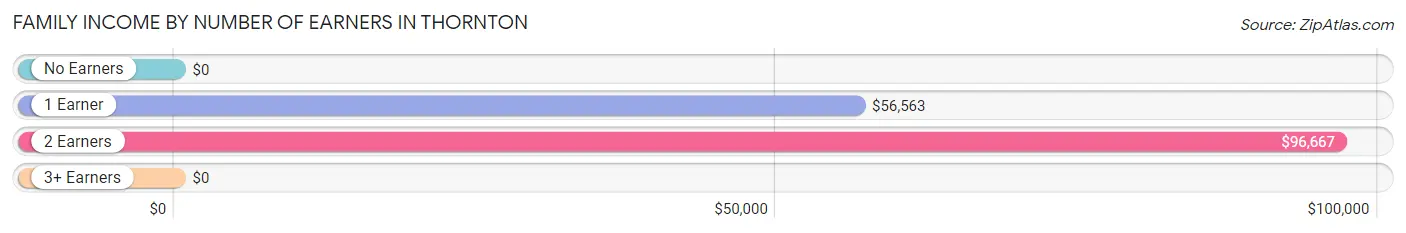
| Number of Earners | # Families | Median Income |
| No Earners | 0 (0.0%) | $0 |
| 1 Earner | 7 (46.7%) | $56,563 |
| 2 Earners | 8 (53.3%) | $96,667 |
| 3+ Earners | 0 (0.0%) | $0 |
| Total | 15 (100.0%) | $68,125 |
Household Income in Thornton
Household Income Brackets in Thornton
With 9 households falling in the category, the $50,000 to $74,999 income range is the most frequent in Thornton, accounting for 42.9% of all households.
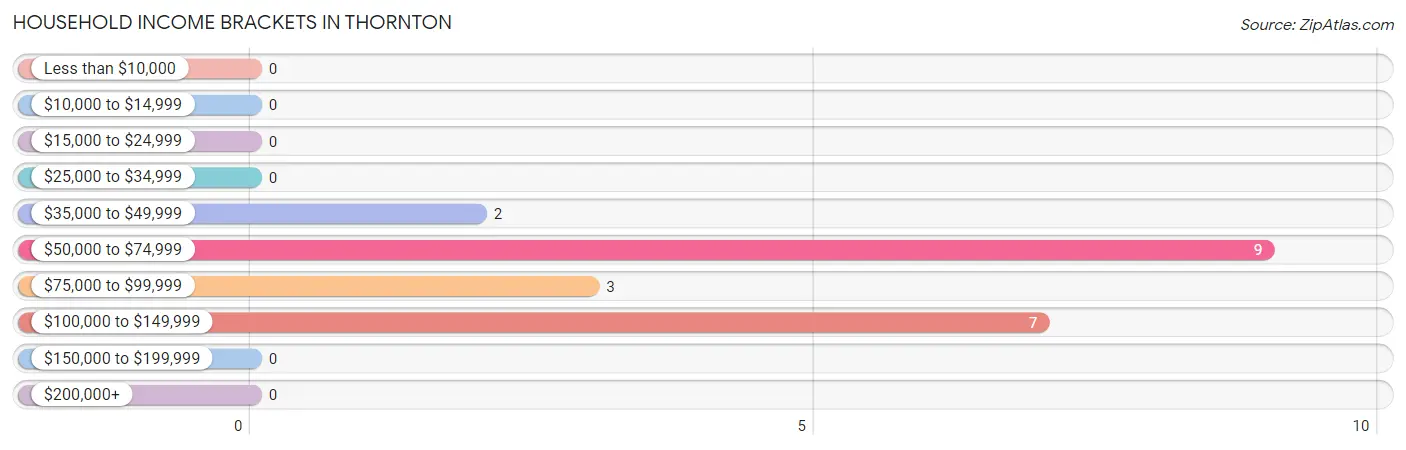
| Income Bracket | # Households | % Households |
| Less than $10,000 | 0 | 0.0% |
| $10,000 to $14,999 | 0 | 0.0% |
| $15,000 to $24,999 | 0 | 0.0% |
| $25,000 to $34,999 | 0 | 0.0% |
| $35,000 to $49,999 | 2 | 9.5% |
| $50,000 to $74,999 | 9 | 42.9% |
| $75,000 to $99,999 | 3 | 14.3% |
| $100,000 to $149,999 | 7 | 33.3% |
| $150,000 to $199,999 | 0 | 0.0% |
| $200,000+ | 0 | 0.0% |
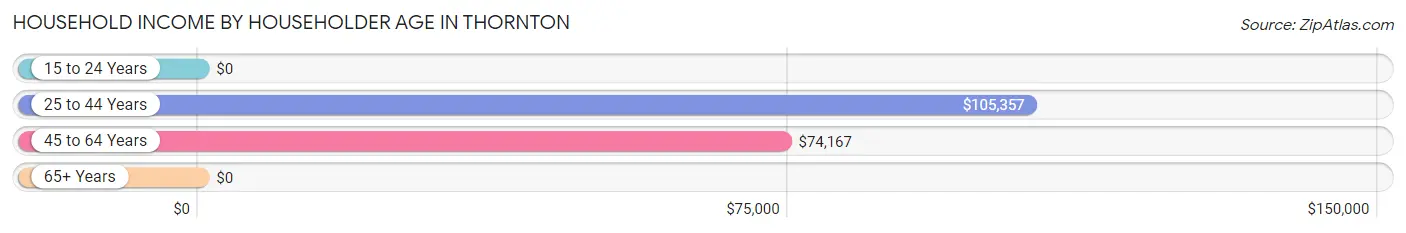
Household Income by Householder Age in Thornton
The median household income in Thornton is $74,583, with the highest median household income of $105,357 found in the 25 to 44 years age bracket for the primary householder. A total of 12 households (57.1%) fall into this category.
| Income Bracket | # Households | Median Income |
| 15 to 24 Years | 0 (0.0%) | $0 |
| 25 to 44 Years | 12 (57.1%) | $105,357 |
| 45 to 64 Years | 8 (38.1%) | $74,167 |
| 65+ Years | 1 (4.8%) | $0 |
| Total | 21 (100.0%) | $74,583 |
Poverty in Thornton
Income Below Poverty by Sex and Age in Thornton
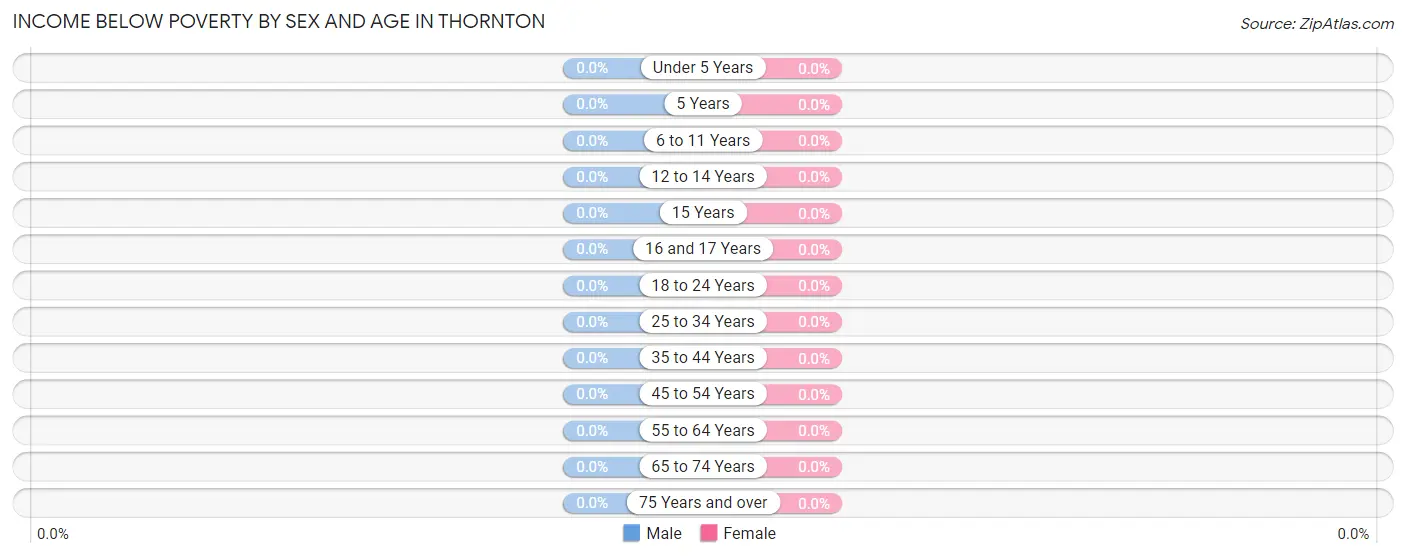
| Age Bracket | Male | Female |
| Under 5 Years | 0 (0.0%) | 0 (0.0%) |
| 5 Years | 0 (0.0%) | 0 (0.0%) |
| 6 to 11 Years | 0 (0.0%) | 0 (0.0%) |
| 12 to 14 Years | 0 (0.0%) | 0 (0.0%) |
| 15 Years | 0 (0.0%) | 0 (0.0%) |
| 16 and 17 Years | 0 (0.0%) | 0 (0.0%) |
| 18 to 24 Years | 0 (0.0%) | 0 (0.0%) |
| 25 to 34 Years | 0 (0.0%) | 0 (0.0%) |
| 35 to 44 Years | 0 (0.0%) | 0 (0.0%) |
| 45 to 54 Years | 0 (0.0%) | 0 (0.0%) |
| 55 to 64 Years | 0 (0.0%) | 0 (0.0%) |
| 65 to 74 Years | 0 (0.0%) | 0 (0.0%) |
| 75 Years and over | 0 (0.0%) | 0 (0.0%) |
| Total | 0 (0.0%) | 0 (0.0%) |
Income Above Poverty by Sex and Age in Thornton
According to the poverty statistics in Thornton, males aged under 5 years and females aged under 5 years are the age groups that are most secure financially, with 100.0% of males and 100.0% of females in these age groups living above the poverty line.
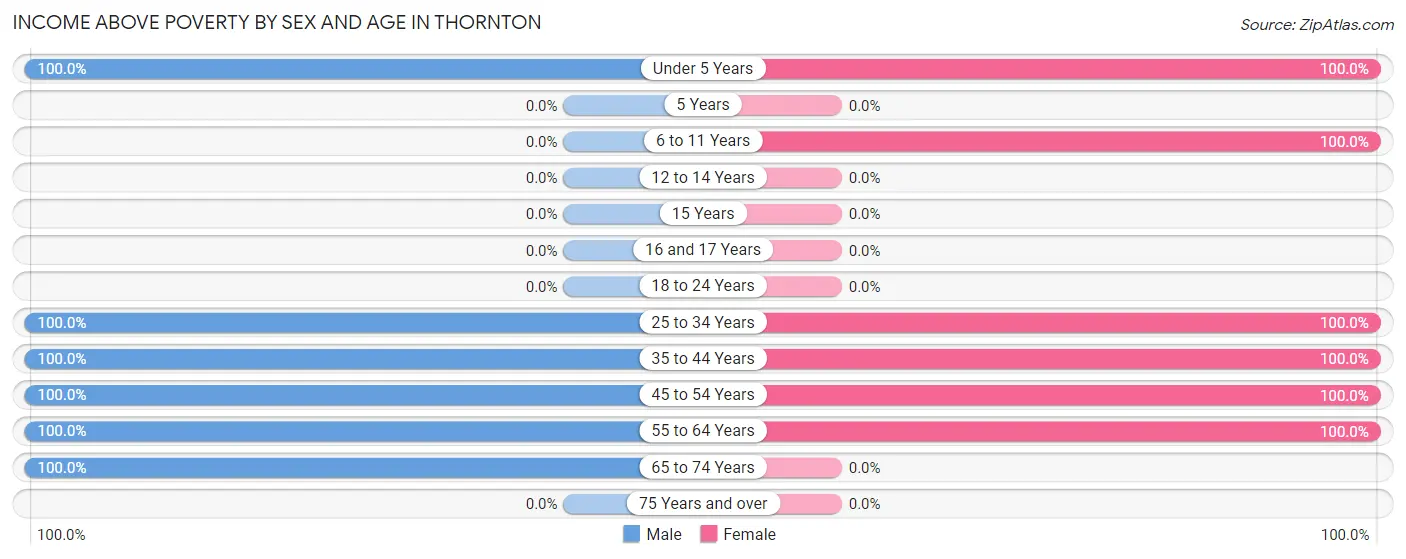
| Age Bracket | Male | Female |
| Under 5 Years | 4 (100.0%) | 3 (100.0%) |
| 5 Years | 0 (0.0%) | 0 (0.0%) |
| 6 to 11 Years | 0 (0.0%) | 4 (100.0%) |
| 12 to 14 Years | 0 (0.0%) | 0 (0.0%) |
| 15 Years | 0 (0.0%) | 0 (0.0%) |
| 16 and 17 Years | 0 (0.0%) | 0 (0.0%) |
| 18 to 24 Years | 0 (0.0%) | 0 (0.0%) |
| 25 to 34 Years | 5 (100.0%) | 5 (100.0%) |
| 35 to 44 Years | 5 (100.0%) | 4 (100.0%) |
| 45 to 54 Years | 3 (100.0%) | 4 (100.0%) |
| 55 to 64 Years | 1 (100.0%) | 5 (100.0%) |
| 65 to 74 Years | 1 (100.0%) | 0 (0.0%) |
| 75 Years and over | 0 (0.0%) | 0 (0.0%) |
| Total | 19 (100.0%) | 25 (100.0%) |
Income Below Poverty Among Married-Couple Families in Thornton
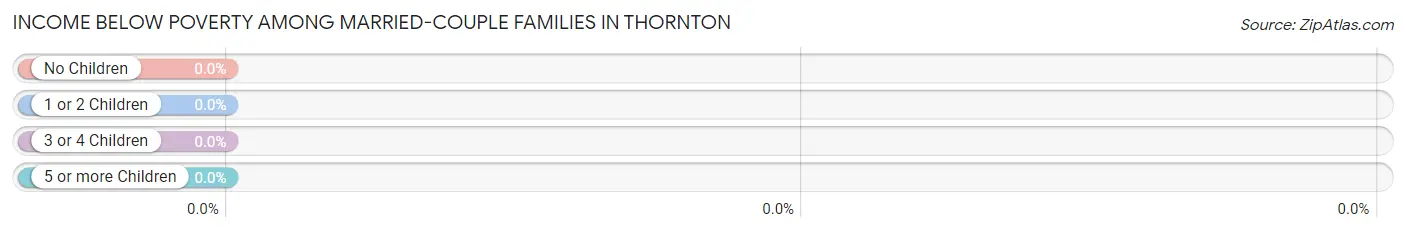
| Children | Above Poverty | Below Poverty |
| No Children | 9 (100.0%) | 0 (0.0%) |
| 1 or 2 Children | 0 (0.0%) | 0 (0.0%) |
| 3 or 4 Children | 2 (100.0%) | 0 (0.0%) |
| 5 or more Children | 0 (0.0%) | 0 (0.0%) |
| Total | 11 (100.0%) | 0 (0.0%) |
Income Below Poverty Among Single-Parent Households in Thornton
| Children | Single Father | Single Mother |
| No Children | 0 (0.0%) | 0 (0.0%) |
| 1 or 2 Children | 0 (0.0%) | 0 (0.0%) |
| 3 or 4 Children | 0 (0.0%) | 0 (0.0%) |
| 5 or more Children | 0 (0.0%) | 0 (0.0%) |
| Total | 0 (0.0%) | 0 (0.0%) |
Income Below Poverty Among Married-Couple vs Single-Parent Households in Thornton
| Children | Married-Couple Families | Single-Parent Households |
| No Children | 0 (0.0%) | 0 (0.0%) |
| 1 or 2 Children | 0 (0.0%) | 0 (0.0%) |
| 3 or 4 Children | 0 (0.0%) | 0 (0.0%) |
| 5 or more Children | 0 (0.0%) | 0 (0.0%) |
| Total | 0 (0.0%) | 0 (0.0%) |
Race in Thornton
The most populous races in Thornton are White / Caucasian (43 | 97.7%), Hispanic or Latino (4 | 9.1%), and Native / Alaskan (1 | 2.3%).
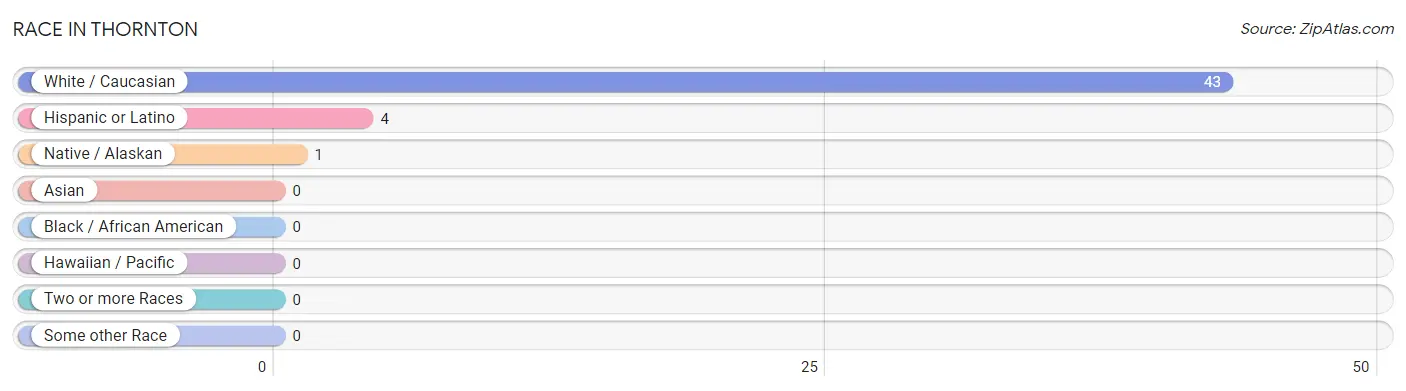
| Race | # Population | % Population |
| Asian | 0 | 0.0% |
| Black / African American | 0 | 0.0% |
| Hawaiian / Pacific | 0 | 0.0% |
| Hispanic or Latino | 4 | 9.1% |
| Native / Alaskan | 1 | 2.3% |
| White / Caucasian | 43 | 97.7% |
| Two or more Races | 0 | 0.0% |
| Some other Race | 0 | 0.0% |
| Total | 44 | 100.0% |
Ancestry in Thornton
The most populous ancestries reported in Thornton are German (29 | 65.9%), Norwegian (5 | 11.4%), European (2 | 4.5%), American (1 | 2.3%), and Irish (1 | 2.3%), together accounting for 86.4% of all Thornton residents.
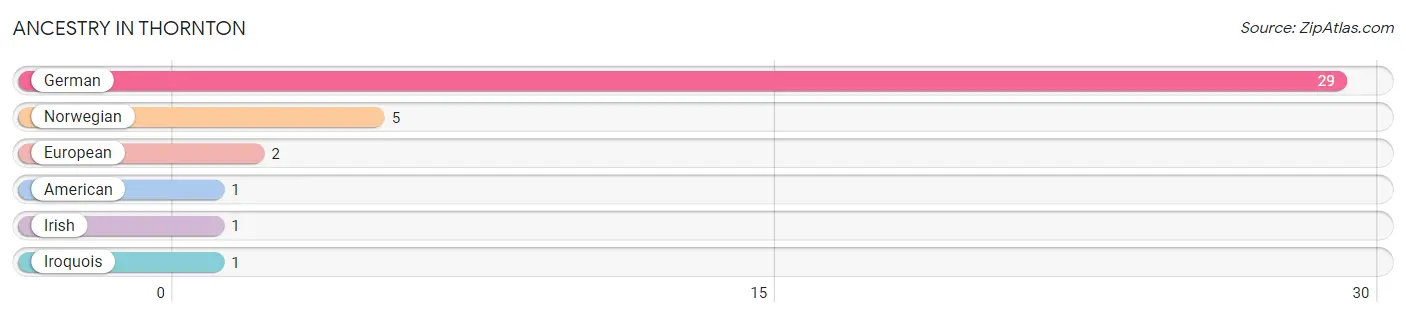
| Ancestry | # Population | % Population |
| American | 1 | 2.3% |
| European | 2 | 4.5% |
| German | 29 | 65.9% |
| Irish | 1 | 2.3% |
| Iroquois | 1 | 2.3% |
| Norwegian | 5 | 11.4% | View All 6 Rows |
Immigrants in Thornton

| Immigration Origin | # Population | % Population | View All 0 Rows |
Sex and Age in Thornton
Sex and Age in Thornton
The most populous age groups in Thornton are 25 to 29 Years (5 | 26.3%) for men and 25 to 29 Years (5 | 20.0%) for women.
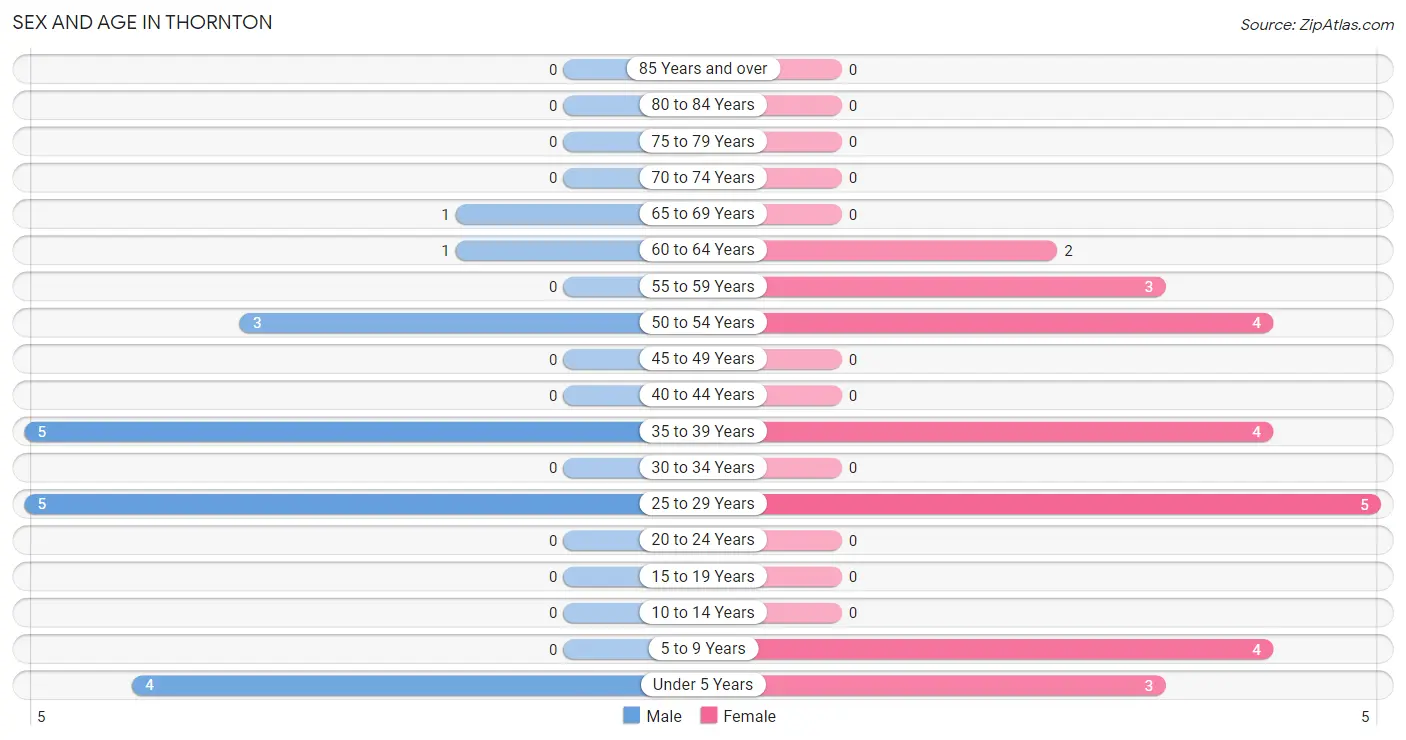
| Age Bracket | Male | Female |
| Under 5 Years | 4 (21.0%) | 3 (12.0%) |
| 5 to 9 Years | 0 (0.0%) | 4 (16.0%) |
| 10 to 14 Years | 0 (0.0%) | 0 (0.0%) |
| 15 to 19 Years | 0 (0.0%) | 0 (0.0%) |
| 20 to 24 Years | 0 (0.0%) | 0 (0.0%) |
| 25 to 29 Years | 5 (26.3%) | 5 (20.0%) |
| 30 to 34 Years | 0 (0.0%) | 0 (0.0%) |
| 35 to 39 Years | 5 (26.3%) | 4 (16.0%) |
| 40 to 44 Years | 0 (0.0%) | 0 (0.0%) |
| 45 to 49 Years | 0 (0.0%) | 0 (0.0%) |
| 50 to 54 Years | 3 (15.8%) | 4 (16.0%) |
| 55 to 59 Years | 0 (0.0%) | 3 (12.0%) |
| 60 to 64 Years | 1 (5.3%) | 2 (8.0%) |
| 65 to 69 Years | 1 (5.3%) | 0 (0.0%) |
| 70 to 74 Years | 0 (0.0%) | 0 (0.0%) |
| 75 to 79 Years | 0 (0.0%) | 0 (0.0%) |
| 80 to 84 Years | 0 (0.0%) | 0 (0.0%) |
| 85 Years and over | 0 (0.0%) | 0 (0.0%) |
| Total | 19 (100.0%) | 25 (100.0%) |
Families and Households in Thornton
Median Family Size in Thornton
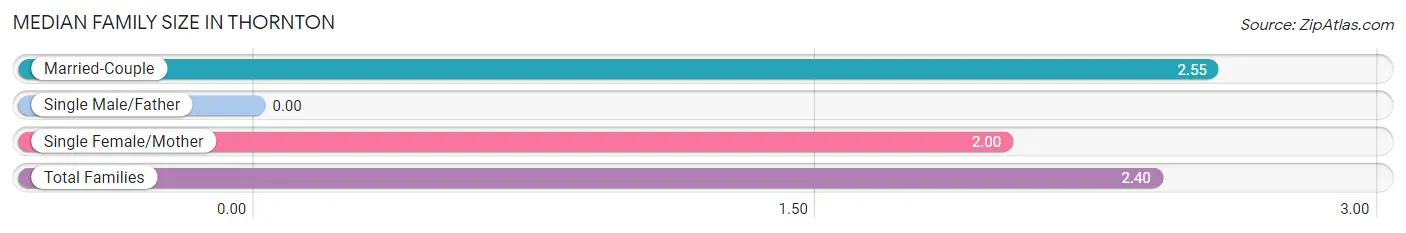
| Family Type | # Families | Family Size |
| Married-Couple | 11 (73.3%) | 2.55 |
| Single Male/Father | 0 (0.0%) | - |
| Single Female/Mother | 4 (26.7%) | 2.00 |
| Total Families | 15 (100.0%) | 2.40 |
Median Household Size in Thornton
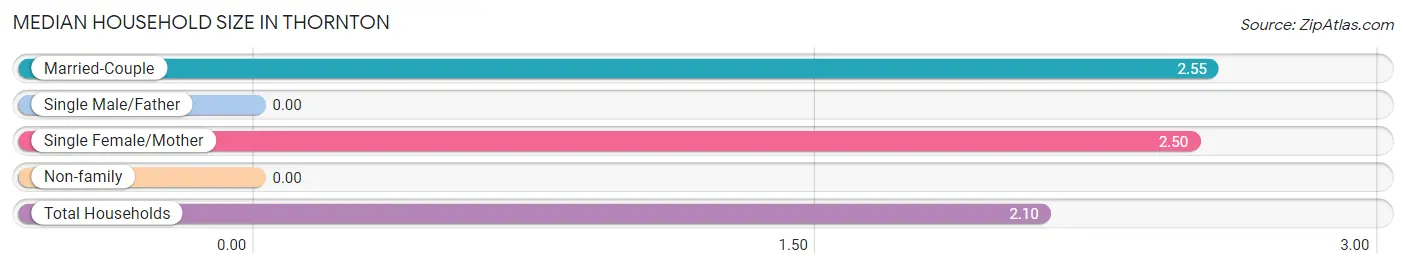
| Household Type | # Households | Household Size |
| Married-Couple | 11 (52.4%) | 2.55 |
| Single Male/Father | 0 (0.0%) | - |
| Single Female/Mother | 4 (19.1%) | 2.50 |
| Non-family | 6 (28.6%) | - |
| Total Households | 21 (100.0%) | 2.10 |
Household Size by Marriage Status in Thornton
Out of a total of 21 households in Thornton, 15 (71.4%) are family households, while 6 (28.6%) are nonfamily households. The most numerous type of family households are 2-person households, comprising 9, and the most common type of nonfamily households are 1-person households, comprising 6.
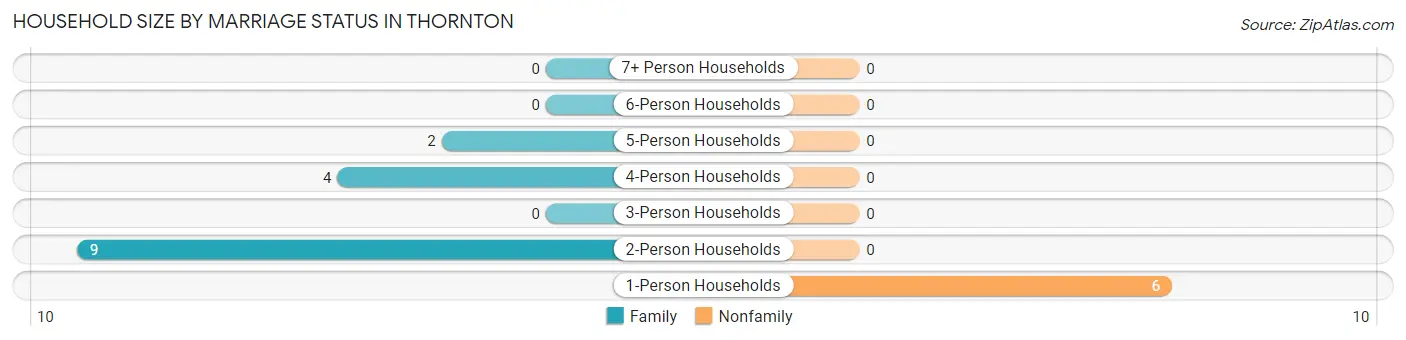
| Household Size | Family Households | Nonfamily Households |
| 1-Person Households | - | 6 (28.6%) |
| 2-Person Households | 9 (42.9%) | 0 (0.0%) |
| 3-Person Households | 0 (0.0%) | 0 (0.0%) |
| 4-Person Households | 4 (19.1%) | 0 (0.0%) |
| 5-Person Households | 2 (9.5%) | 0 (0.0%) |
| 6-Person Households | 0 (0.0%) | 0 (0.0%) |
| 7+ Person Households | 0 (0.0%) | 0 (0.0%) |
| Total | 15 (71.4%) | 6 (28.6%) |
Female Fertility in Thornton
Fertility by Age in Thornton
| Age Bracket | Women with Births | Births / 1,000 Women |
| 15 to 19 years | 0 (0.0%) | 0.0 |
| 20 to 34 years | 0 (0.0%) | 0.0 |
| 35 to 50 years | 0 (0.0%) | 0.0 |
| Total | 0 (0.0%) | 0.0 |
Fertility by Age by Marriage Status in Thornton
| Age Bracket | Married | Unmarried |
| 15 to 19 years | 0 (0.0%) | 0 (0.0%) |
| 20 to 34 years | 0 (0.0%) | 0 (0.0%) |
| 35 to 50 years | 0 (0.0%) | 0 (0.0%) |
| Total | 0 (0.0%) | 0 (0.0%) |
Fertility by Education in Thornton
| Educational Attainment | Women with Births | Births / 1,000 Women |
| Less than High School | 0 (0.0%) | 0.0 |
| High School Diploma | 0 (0.0%) | 0.0 |
| College or Associate's Degree | 0 (0.0%) | 0.0 |
| Bachelor's Degree | 0 (0.0%) | 0.0 |
| Graduate Degree | 0 (0.0%) | 0.0 |
| Total | 0 (0.0%) | 0.0 |
Fertility by Education by Marriage Status in Thornton
| Educational Attainment | Married | Unmarried |
| Less than High School | 0 (0.0%) | 0 (0.0%) |
| High School Diploma | 0 (0.0%) | 0 (0.0%) |
| College or Associate's Degree | 0 (0.0%) | 0 (0.0%) |
| Bachelor's Degree | 0 (0.0%) | 0 (0.0%) |
| Graduate Degree | 0 (0.0%) | 0 (0.0%) |
| Total | 0 (0.0%) | 0 (0.0%) |
Employment Characteristics in Thornton
Employment by Class of Employer in Thornton
Among the 30 employed individuals in Thornton, private company employees (17 | 56.7%), not-for-profit organizations (4 | 13.3%), and federal government employees (4 | 13.3%) make up the most common classes of employment.
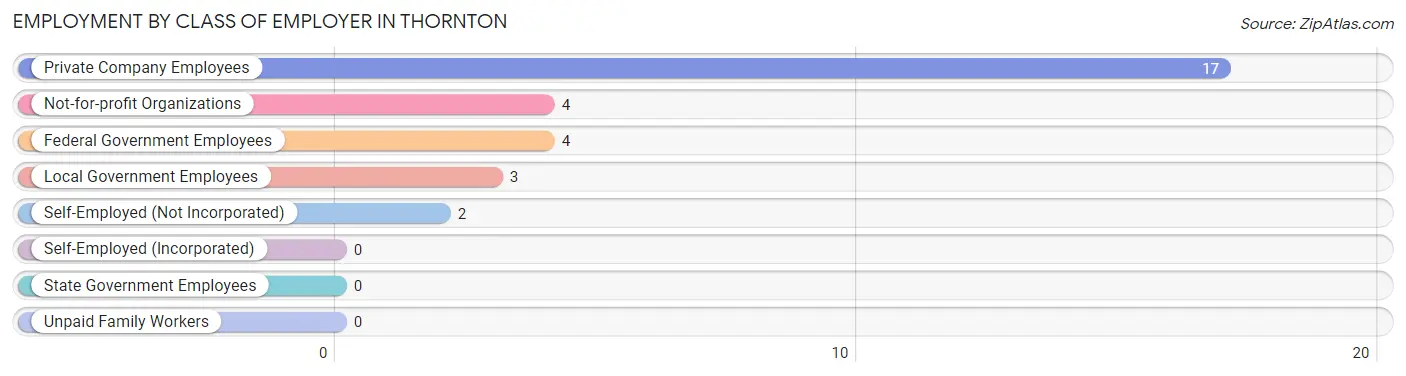
| Employer Class | # Employees | % Employees |
| Private Company Employees | 17 | 56.7% |
| Self-Employed (Incorporated) | 0 | 0.0% |
| Self-Employed (Not Incorporated) | 2 | 6.7% |
| Not-for-profit Organizations | 4 | 13.3% |
| Local Government Employees | 3 | 10.0% |
| State Government Employees | 0 | 0.0% |
| Federal Government Employees | 4 | 13.3% |
| Unpaid Family Workers | 0 | 0.0% |
| Total | 30 | 100.0% |
Employment Status by Age in Thornton
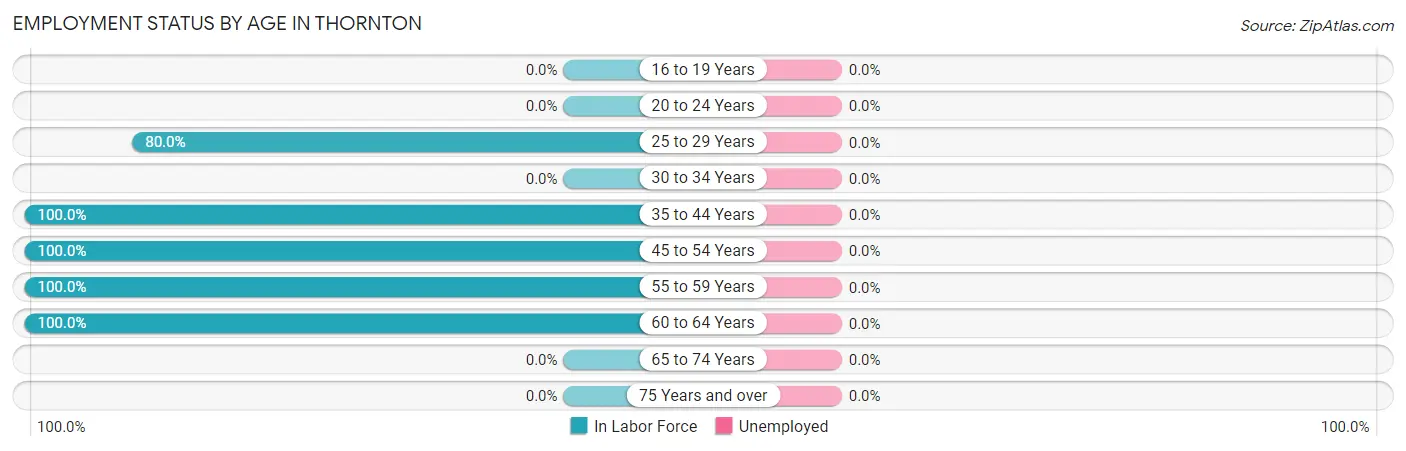
| Age Bracket | In Labor Force | Unemployed |
| 16 to 19 Years | 0 (0.0%) | 0 (0.0%) |
| 20 to 24 Years | 0 (0.0%) | 0 (0.0%) |
| 25 to 29 Years | 8 (80.0%) | 0 (0.0%) |
| 30 to 34 Years | 0 (0.0%) | 0 (0.0%) |
| 35 to 44 Years | 9 (100.0%) | 0 (0.0%) |
| 45 to 54 Years | 7 (100.0%) | 0 (0.0%) |
| 55 to 59 Years | 3 (100.0%) | 0 (0.0%) |
| 60 to 64 Years | 3 (100.0%) | 0 (0.0%) |
| 65 to 74 Years | 0 (0.0%) | 0 (0.0%) |
| 75 Years and over | 0 (0.0%) | 0 (0.0%) |
| Total | 30 (90.9%) | 0 (0.0%) |
Employment Status by Educational Attainment in Thornton
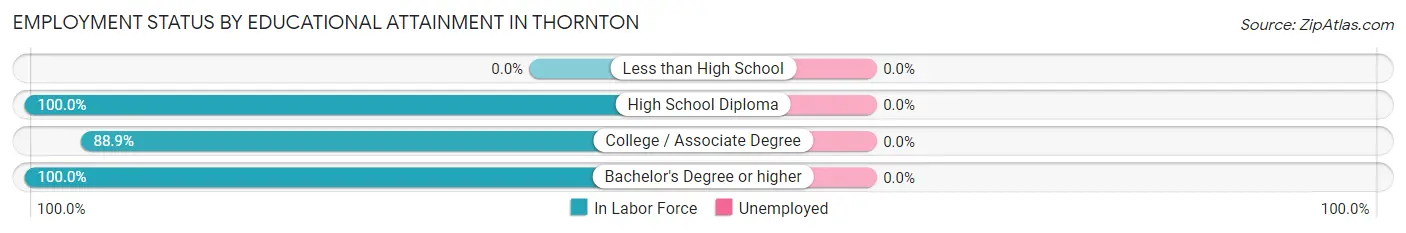
| Educational Attainment | In Labor Force | Unemployed |
| Less than High School | 0 (0.0%) | 0 (0.0%) |
| High School Diploma | 7 (100.0%) | 0 (0.0%) |
| College / Associate Degree | 16 (88.9%) | 0 (0.0%) |
| Bachelor's Degree or higher | 7 (100.0%) | 0 (0.0%) |
| Total | 30 (93.8%) | 0 (0.0%) |
Employment Occupations by Sex in Thornton
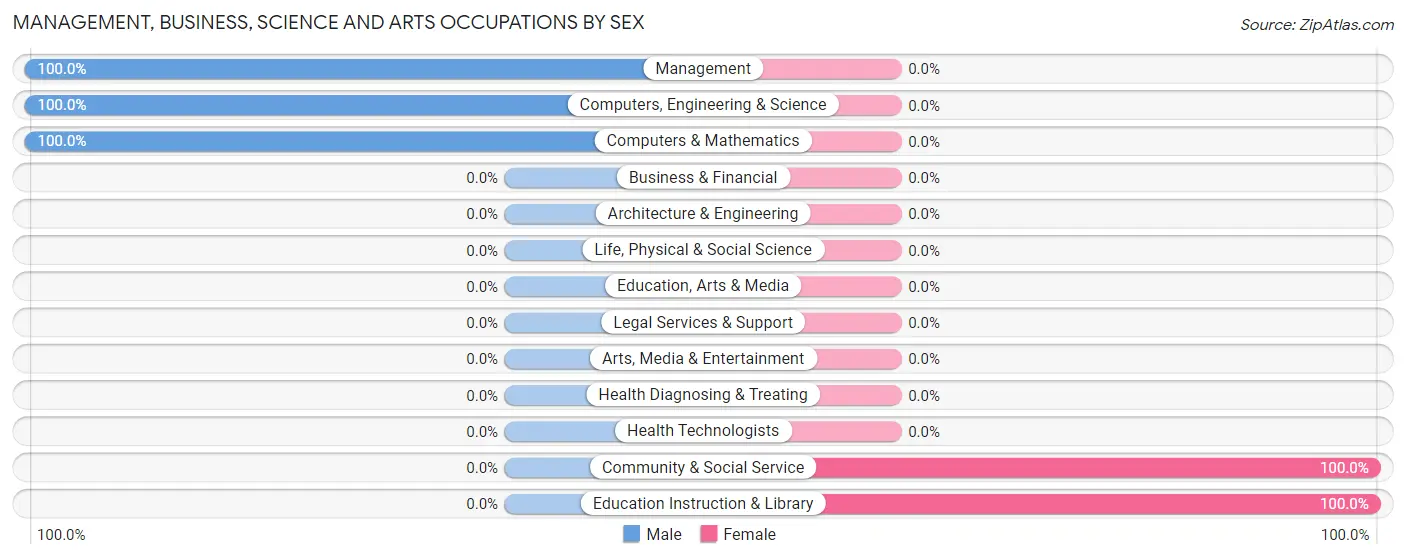
Management, Business, Science and Arts Occupations
The most common Management, Business, Science and Arts occupations in Thornton are Management (4 | 13.3%), Community & Social Service (4 | 13.3%), Education Instruction & Library (4 | 13.3%), Computers, Engineering & Science (3 | 10.0%), and Computers & Mathematics (3 | 10.0%).
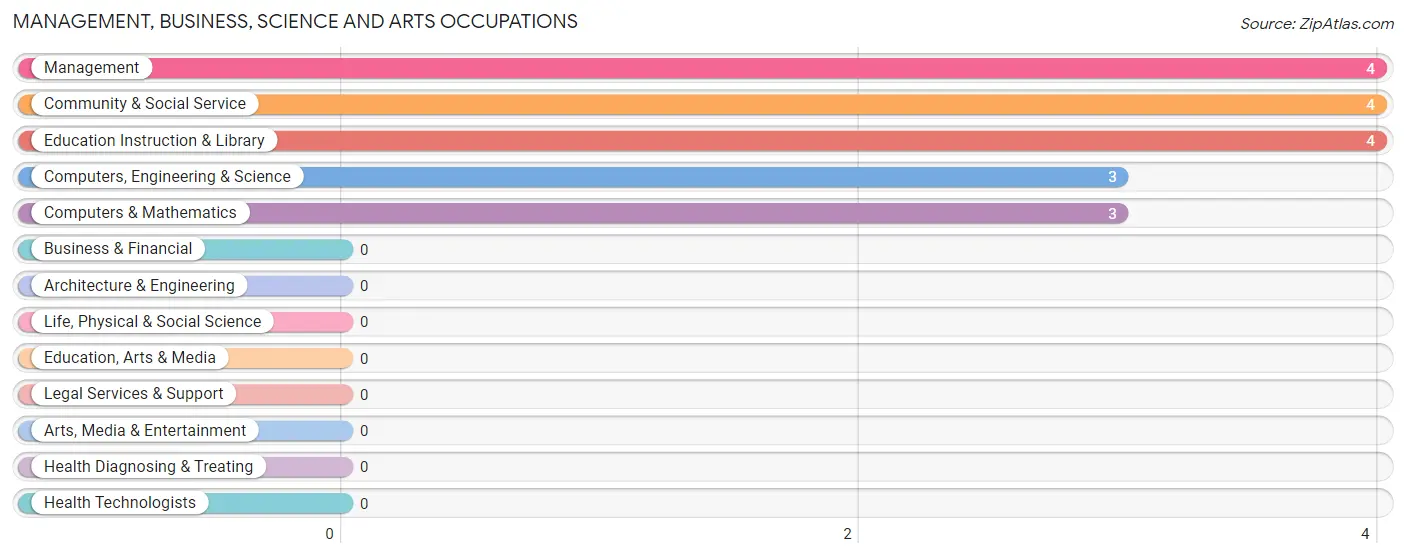
Management, Business, Science and Arts Occupations by Sex
Within the Management, Business, Science and Arts occupations in Thornton, the most male-oriented occupations are Management (100.0%), Computers, Engineering & Science (100.0%), and Computers & Mathematics (100.0%), while the most female-oriented occupations are Community & Social Service (100.0%), and Education Instruction & Library (100.0%).
| Occupation | Male | Female |
| Management | 4 (100.0%) | 0 (0.0%) |
| Business & Financial | 0 (0.0%) | 0 (0.0%) |
| Computers, Engineering & Science | 3 (100.0%) | 0 (0.0%) |
| Computers & Mathematics | 3 (100.0%) | 0 (0.0%) |
| Architecture & Engineering | 0 (0.0%) | 0 (0.0%) |
| Life, Physical & Social Science | 0 (0.0%) | 0 (0.0%) |
| Community & Social Service | 0 (0.0%) | 4 (100.0%) |
| Education, Arts & Media | 0 (0.0%) | 0 (0.0%) |
| Legal Services & Support | 0 (0.0%) | 0 (0.0%) |
| Education Instruction & Library | 0 (0.0%) | 4 (100.0%) |
| Arts, Media & Entertainment | 0 (0.0%) | 0 (0.0%) |
| Health Diagnosing & Treating | 0 (0.0%) | 0 (0.0%) |
| Health Technologists | 0 (0.0%) | 0 (0.0%) |
| Total (Category) | 7 (63.6%) | 4 (36.4%) |
| Total (Overall) | 14 (46.7%) | 16 (53.3%) |
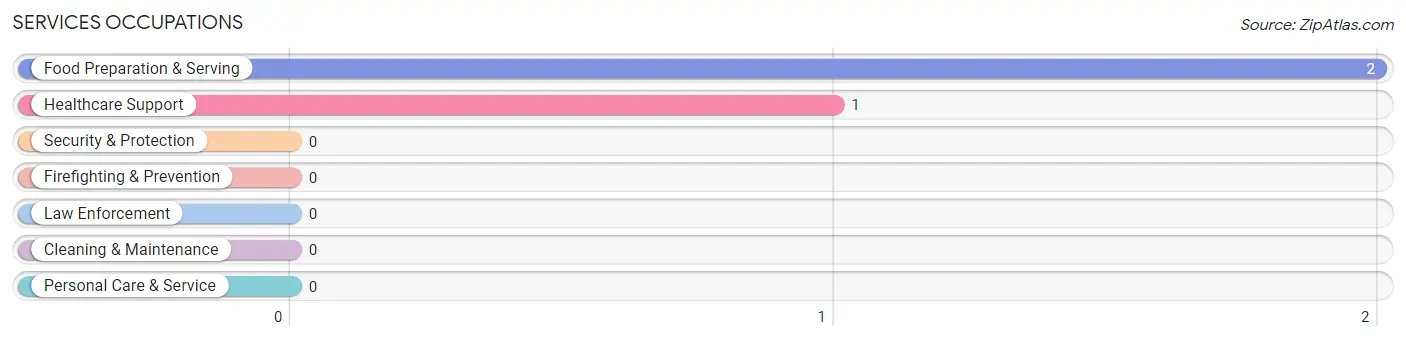
Services Occupations
The most common Services occupations in Thornton are Food Preparation & Serving (2 | 6.7%), and Healthcare Support (1 | 3.3%).
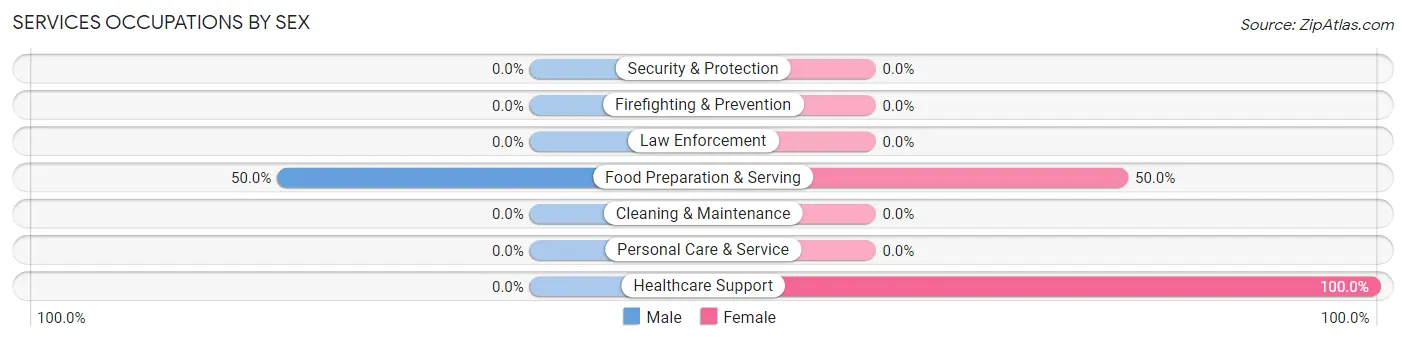
Services Occupations by Sex
| Occupation | Male | Female |
| Healthcare Support | 0 (0.0%) | 1 (100.0%) |
| Security & Protection | 0 (0.0%) | 0 (0.0%) |
| Firefighting & Prevention | 0 (0.0%) | 0 (0.0%) |
| Law Enforcement | 0 (0.0%) | 0 (0.0%) |
| Food Preparation & Serving | 1 (50.0%) | 1 (50.0%) |
| Cleaning & Maintenance | 0 (0.0%) | 0 (0.0%) |
| Personal Care & Service | 0 (0.0%) | 0 (0.0%) |
| Total (Category) | 1 (33.3%) | 2 (66.7%) |
| Total (Overall) | 14 (46.7%) | 16 (53.3%) |
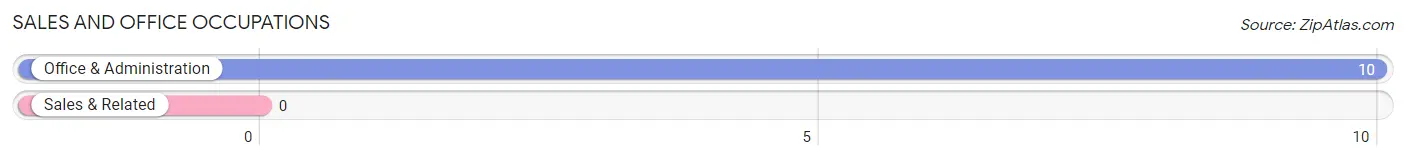
Sales and Office Occupations
The most common Sales and Office occupations in Thornton are , and Office & Administration (10 | 33.3%).
Sales and Office Occupations by Sex
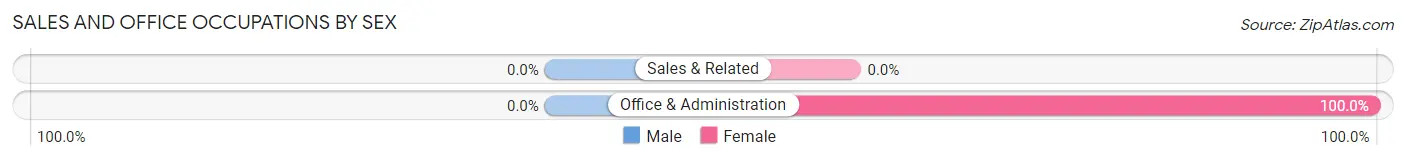
| Occupation | Male | Female |
| Sales & Related | 0 (0.0%) | 0 (0.0%) |
| Office & Administration | 0 (0.0%) | 10 (100.0%) |
| Total (Category) | 0 (0.0%) | 10 (100.0%) |
| Total (Overall) | 14 (46.7%) | 16 (53.3%) |
Natural Resources, Construction and Maintenance Occupations
The most common Natural Resources, Construction and Maintenance occupations in Thornton are , and Construction & Extraction (1 | 3.3%).
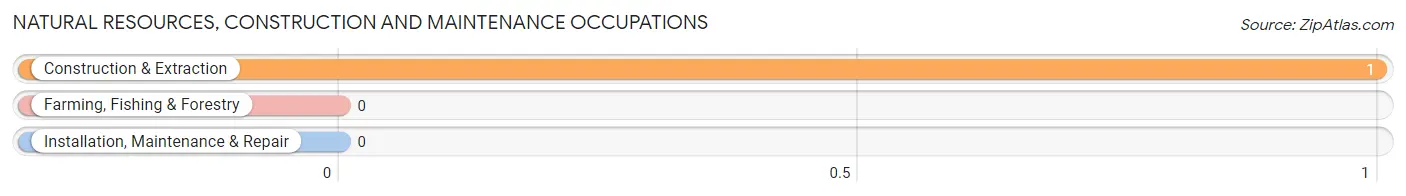
Natural Resources, Construction and Maintenance Occupations by Sex
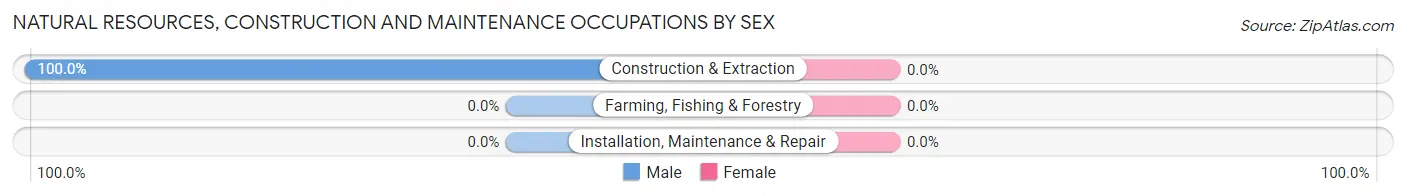
| Occupation | Male | Female |
| Farming, Fishing & Forestry | 0 (0.0%) | 0 (0.0%) |
| Construction & Extraction | 1 (100.0%) | 0 (0.0%) |
| Installation, Maintenance & Repair | 0 (0.0%) | 0 (0.0%) |
| Total (Category) | 1 (100.0%) | 0 (0.0%) |
| Total (Overall) | 14 (46.7%) | 16 (53.3%) |
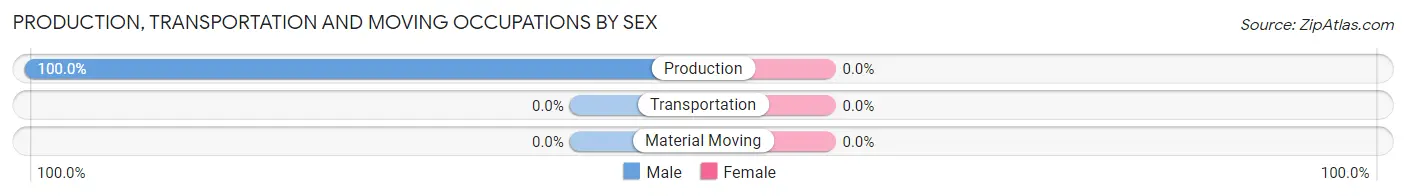
Production, Transportation and Moving Occupations
The most common Production, Transportation and Moving occupations in Thornton are , and Production (5 | 16.7%).
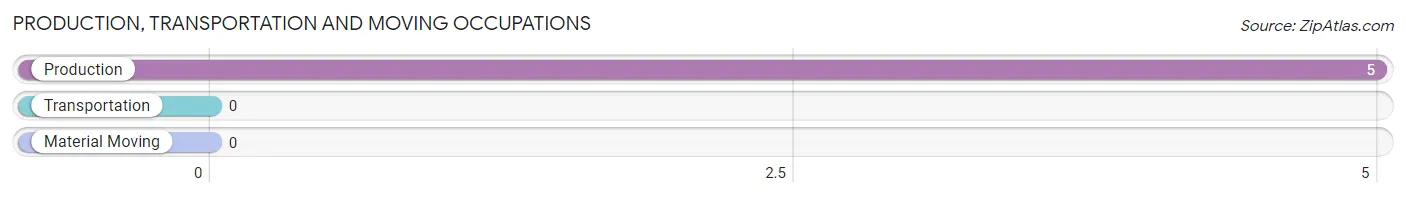
Production, Transportation and Moving Occupations by Sex
| Occupation | Male | Female |
| Production | 5 (100.0%) | 0 (0.0%) |
| Transportation | 0 (0.0%) | 0 (0.0%) |
| Material Moving | 0 (0.0%) | 0 (0.0%) |
| Total (Category) | 5 (100.0%) | 0 (0.0%) |
| Total (Overall) | 14 (46.7%) | 16 (53.3%) |
Employment Industries by Sex in Thornton
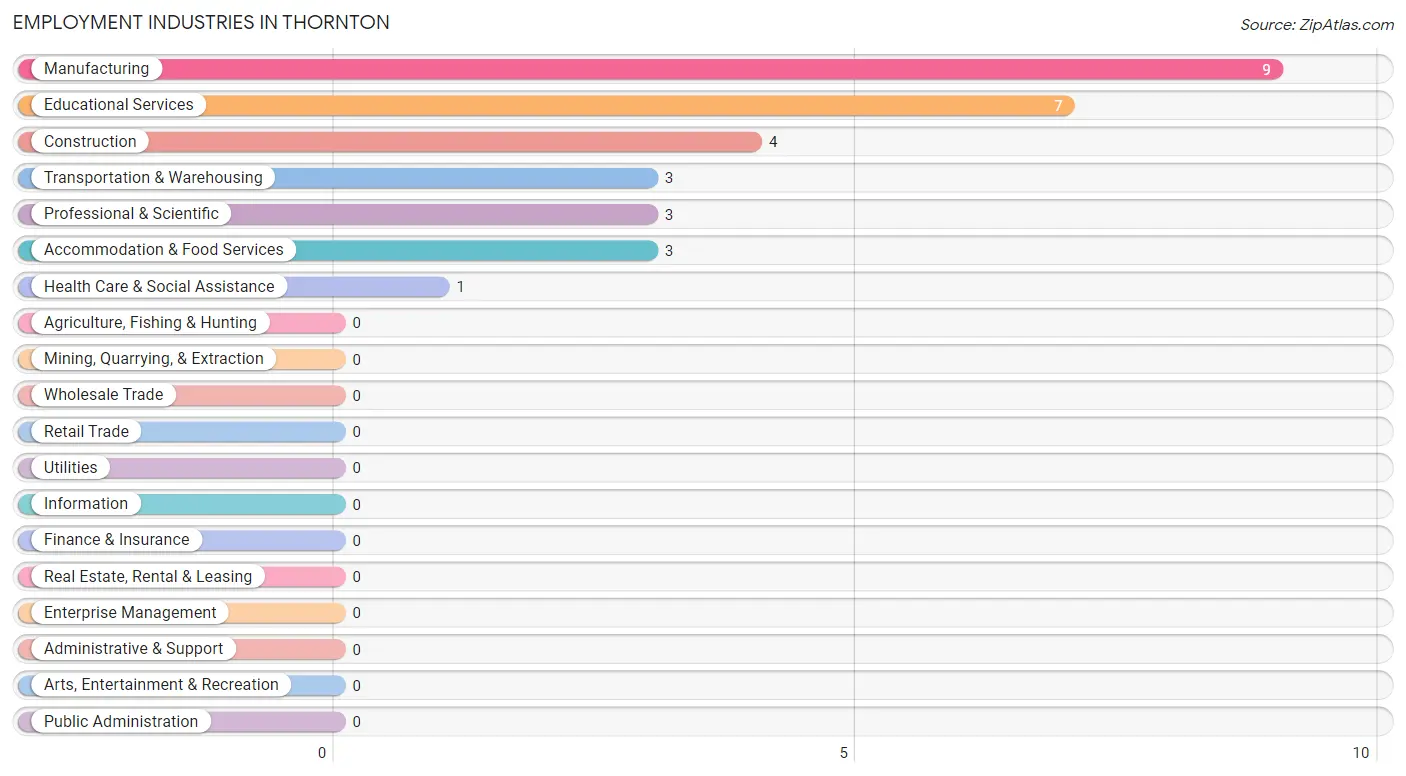
Employment Industries in Thornton
The major employment industries in Thornton include Manufacturing (9 | 30.0%), Educational Services (7 | 23.3%), Construction (4 | 13.3%), Transportation & Warehousing (3 | 10.0%), and Professional & Scientific (3 | 10.0%).
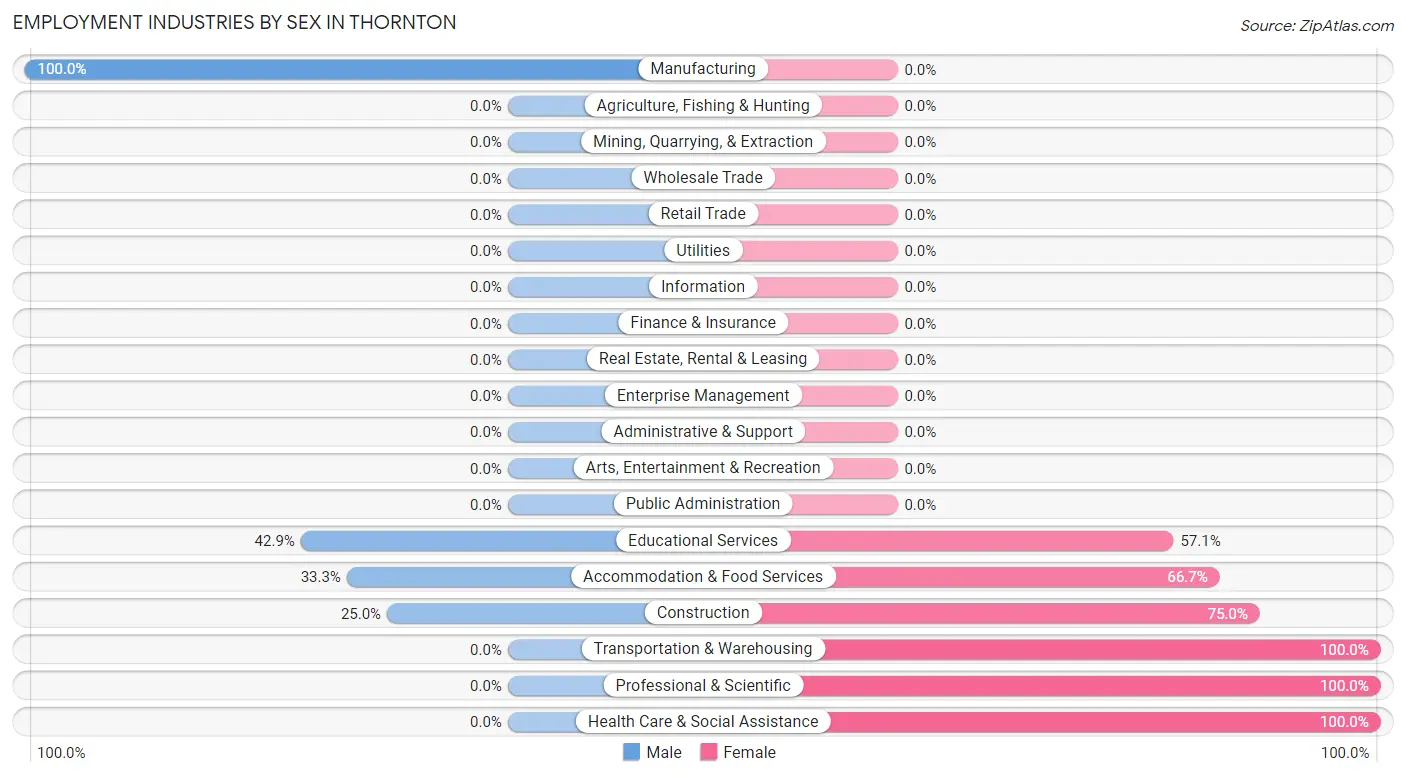
Employment Industries by Sex in Thornton
The Thornton industries that see more men than women are Manufacturing (100.0%), Educational Services (42.9%), and Accommodation & Food Services (33.3%), whereas the industries that tend to have a higher number of women are Transportation & Warehousing (100.0%), Professional & Scientific (100.0%), and Health Care & Social Assistance (100.0%).
| Industry | Male | Female |
| Agriculture, Fishing & Hunting | 0 (0.0%) | 0 (0.0%) |
| Mining, Quarrying, & Extraction | 0 (0.0%) | 0 (0.0%) |
| Construction | 1 (25.0%) | 3 (75.0%) |
| Manufacturing | 9 (100.0%) | 0 (0.0%) |
| Wholesale Trade | 0 (0.0%) | 0 (0.0%) |
| Retail Trade | 0 (0.0%) | 0 (0.0%) |
| Transportation & Warehousing | 0 (0.0%) | 3 (100.0%) |
| Utilities | 0 (0.0%) | 0 (0.0%) |
| Information | 0 (0.0%) | 0 (0.0%) |
| Finance & Insurance | 0 (0.0%) | 0 (0.0%) |
| Real Estate, Rental & Leasing | 0 (0.0%) | 0 (0.0%) |
| Professional & Scientific | 0 (0.0%) | 3 (100.0%) |
| Enterprise Management | 0 (0.0%) | 0 (0.0%) |
| Administrative & Support | 0 (0.0%) | 0 (0.0%) |
| Educational Services | 3 (42.9%) | 4 (57.1%) |
| Health Care & Social Assistance | 0 (0.0%) | 1 (100.0%) |
| Arts, Entertainment & Recreation | 0 (0.0%) | 0 (0.0%) |
| Accommodation & Food Services | 1 (33.3%) | 2 (66.7%) |
| Public Administration | 0 (0.0%) | 0 (0.0%) |
| Total | 14 (46.7%) | 16 (53.3%) |
Education in Thornton
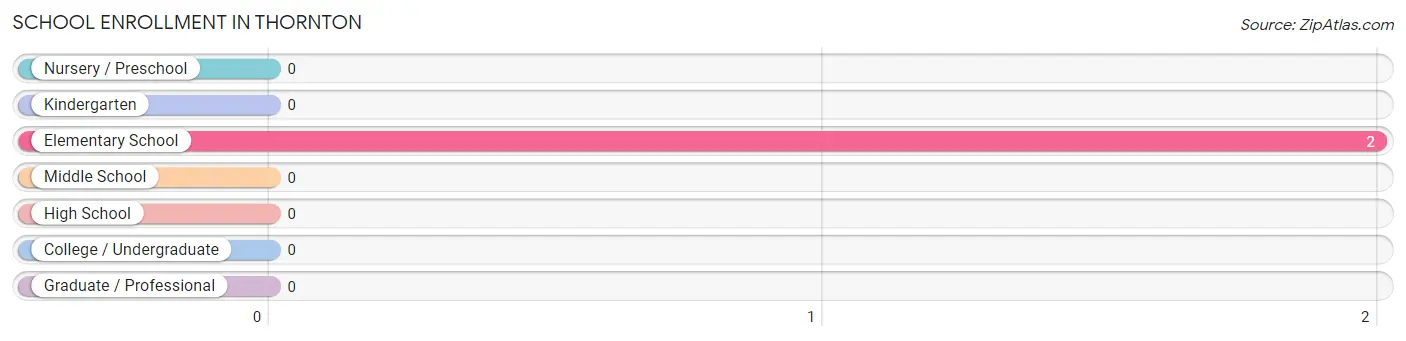
School Enrollment in Thornton
| School Level | # Students | % Students |
| Nursery / Preschool | 0 | 0.0% |
| Kindergarten | 0 | 0.0% |
| Elementary School | 2 | 100.0% |
| Middle School | 0 | 0.0% |
| High School | 0 | 0.0% |
| College / Undergraduate | 0 | 0.0% |
| Graduate / Professional | 0 | 0.0% |
| Total | 2 | 100.0% |
School Enrollment by Age by Funding Source in Thornton
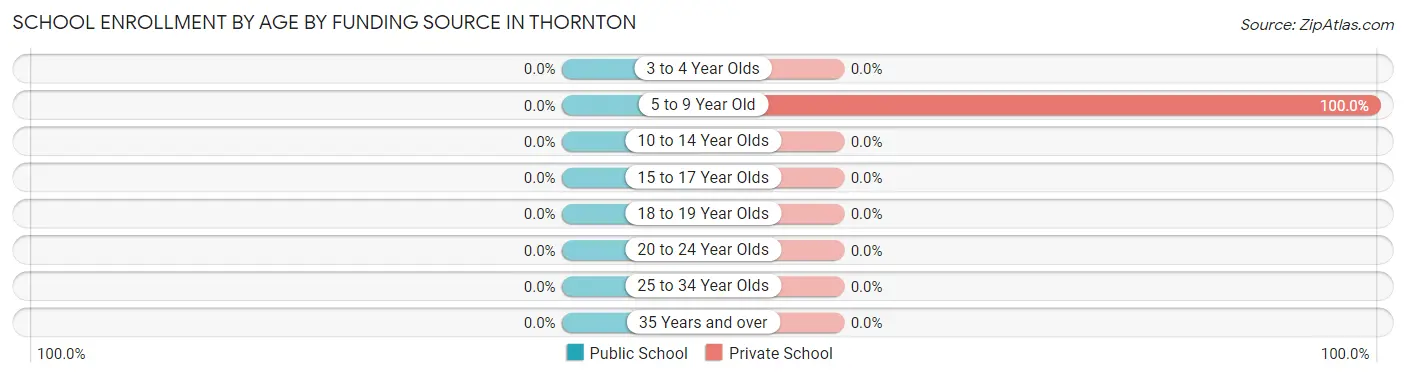
| Age Bracket | Public School | Private School |
| 3 to 4 Year Olds | 0 (0.0%) | 0 (0.0%) |
| 5 to 9 Year Old | 0 (0.0%) | 2 (100.0%) |
| 10 to 14 Year Olds | 0 (0.0%) | 0 (0.0%) |
| 15 to 17 Year Olds | 0 (0.0%) | 0 (0.0%) |
| 18 to 19 Year Olds | 0 (0.0%) | 0 (0.0%) |
| 20 to 24 Year Olds | 0 (0.0%) | 0 (0.0%) |
| 25 to 34 Year Olds | 0 (0.0%) | 0 (0.0%) |
| 35 Years and over | 0 (0.0%) | 0 (0.0%) |
| Total | 0 (0.0%) | 2 (100.0%) |
Educational Attainment by Field of Study in Thornton
Education (4 | 57.1%), and communications (3 | 42.9%) are the most common fields of study among 7 individuals in Thornton who have obtained a bachelor's degree or higher.
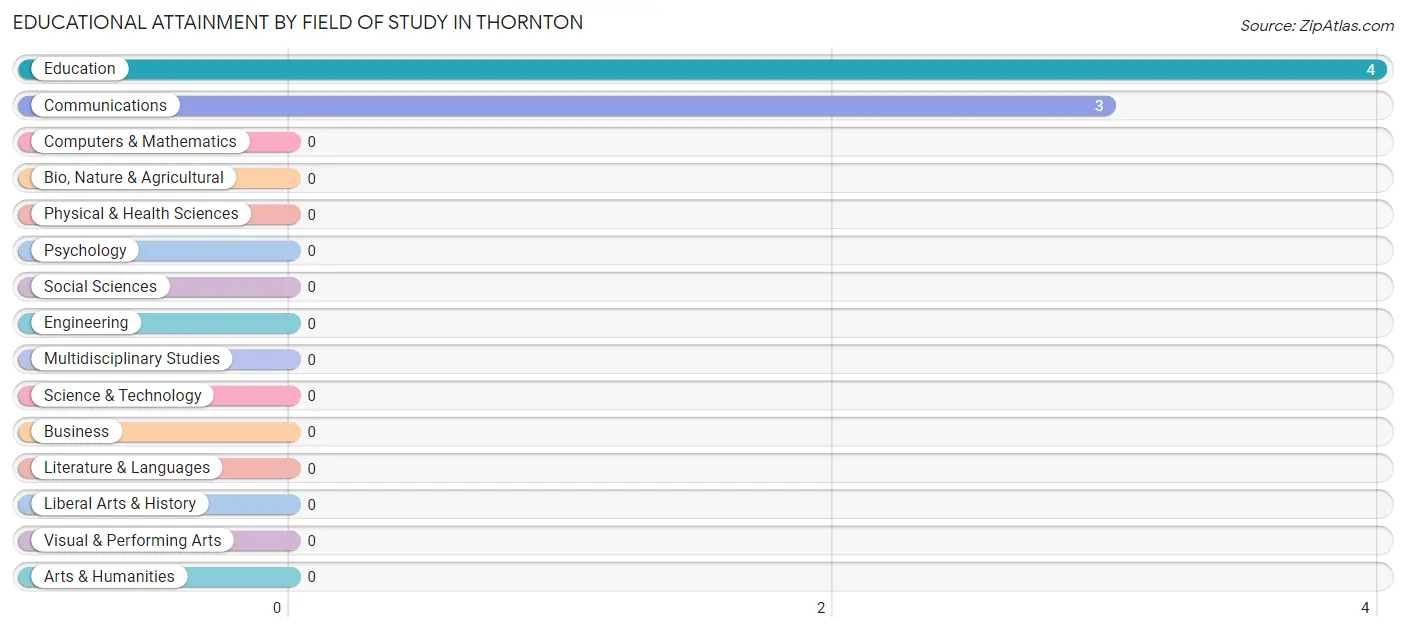
| Field of Study | # Graduates | % Graduates |
| Computers & Mathematics | 0 | 0.0% |
| Bio, Nature & Agricultural | 0 | 0.0% |
| Physical & Health Sciences | 0 | 0.0% |
| Psychology | 0 | 0.0% |
| Social Sciences | 0 | 0.0% |
| Engineering | 0 | 0.0% |
| Multidisciplinary Studies | 0 | 0.0% |
| Science & Technology | 0 | 0.0% |
| Business | 0 | 0.0% |
| Education | 4 | 57.1% |
| Literature & Languages | 0 | 0.0% |
| Liberal Arts & History | 0 | 0.0% |
| Visual & Performing Arts | 0 | 0.0% |
| Communications | 3 | 42.9% |
| Arts & Humanities | 0 | 0.0% |
| Total | 7 | 100.0% |
Transportation & Commute in Thornton
Vehicle Availability by Sex in Thornton
The most prevalent vehicle ownership categories in Thornton are males with 2 vehicles (11, accounting for 78.6%) and females with 2 vehicles (9, making up 68.8%).
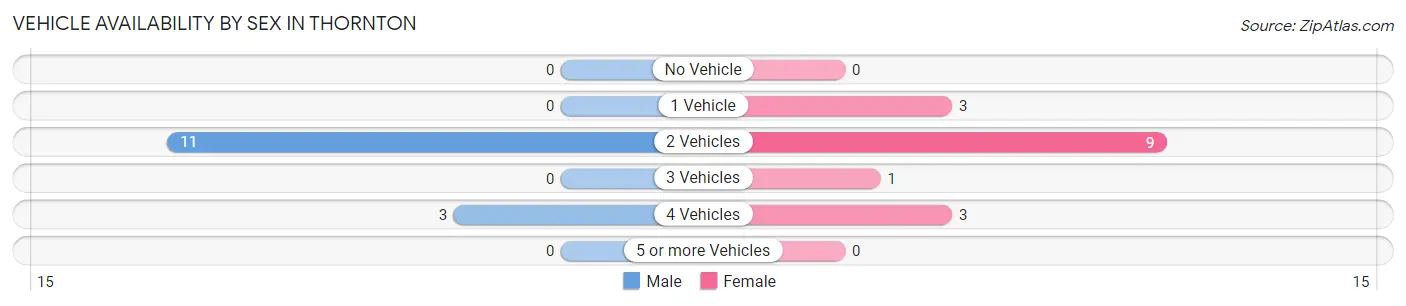
| Vehicles Available | Male | Female |
| No Vehicle | 0 (0.0%) | 0 (0.0%) |
| 1 Vehicle | 0 (0.0%) | 3 (18.8%) |
| 2 Vehicles | 11 (78.6%) | 9 (56.2%) |
| 3 Vehicles | 0 (0.0%) | 1 (6.2%) |
| 4 Vehicles | 3 (21.4%) | 3 (18.8%) |
| 5 or more Vehicles | 0 (0.0%) | 0 (0.0%) |
| Total | 14 (100.0%) | 16 (100.0%) |
Commute Time in Thornton
The most frequently occuring commute durations in Thornton are 20 to 24 minutes (5 commuters, 16.7%), 5 to 9 minutes (4 commuters, 13.3%), and 15 to 19 minutes (4 commuters, 13.3%).
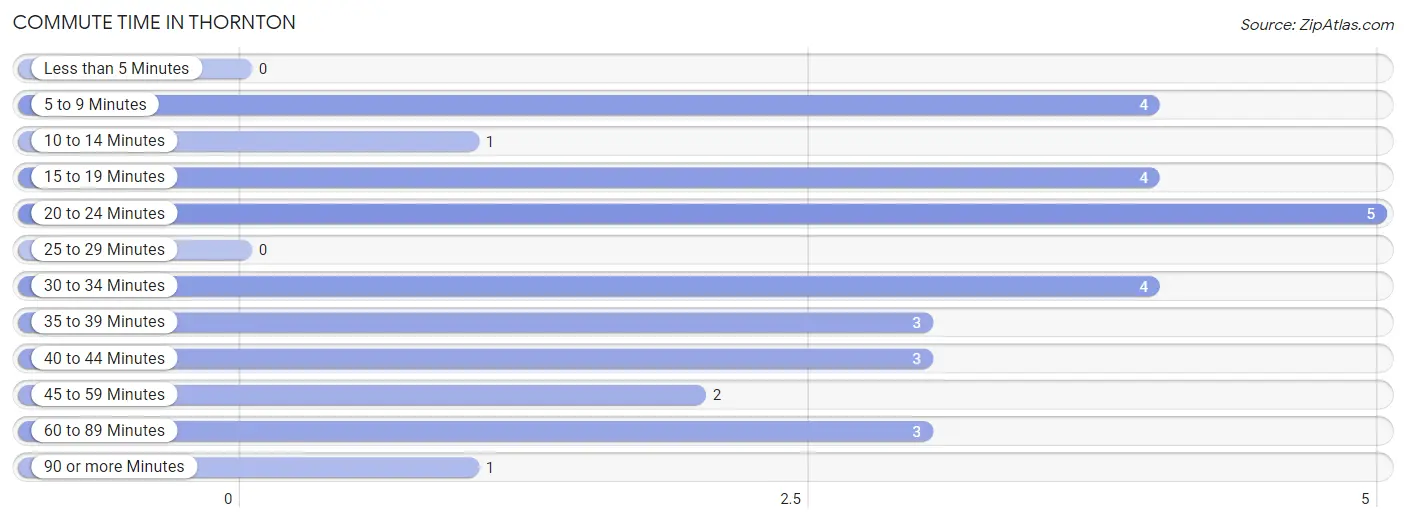
| Commute Time | # Commuters | % Commuters |
| Less than 5 Minutes | 0 | 0.0% |
| 5 to 9 Minutes | 4 | 13.3% |
| 10 to 14 Minutes | 1 | 3.3% |
| 15 to 19 Minutes | 4 | 13.3% |
| 20 to 24 Minutes | 5 | 16.7% |
| 25 to 29 Minutes | 0 | 0.0% |
| 30 to 34 Minutes | 4 | 13.3% |
| 35 to 39 Minutes | 3 | 10.0% |
| 40 to 44 Minutes | 3 | 10.0% |
| 45 to 59 Minutes | 2 | 6.7% |
| 60 to 89 Minutes | 3 | 10.0% |
| 90 or more Minutes | 1 | 3.3% |
Commute Time by Sex in Thornton
The most common commute times in Thornton are 15 to 19 minutes (4 commuters, 28.6%) for males and 5 to 9 minutes (4 commuters, 25.0%) for females.
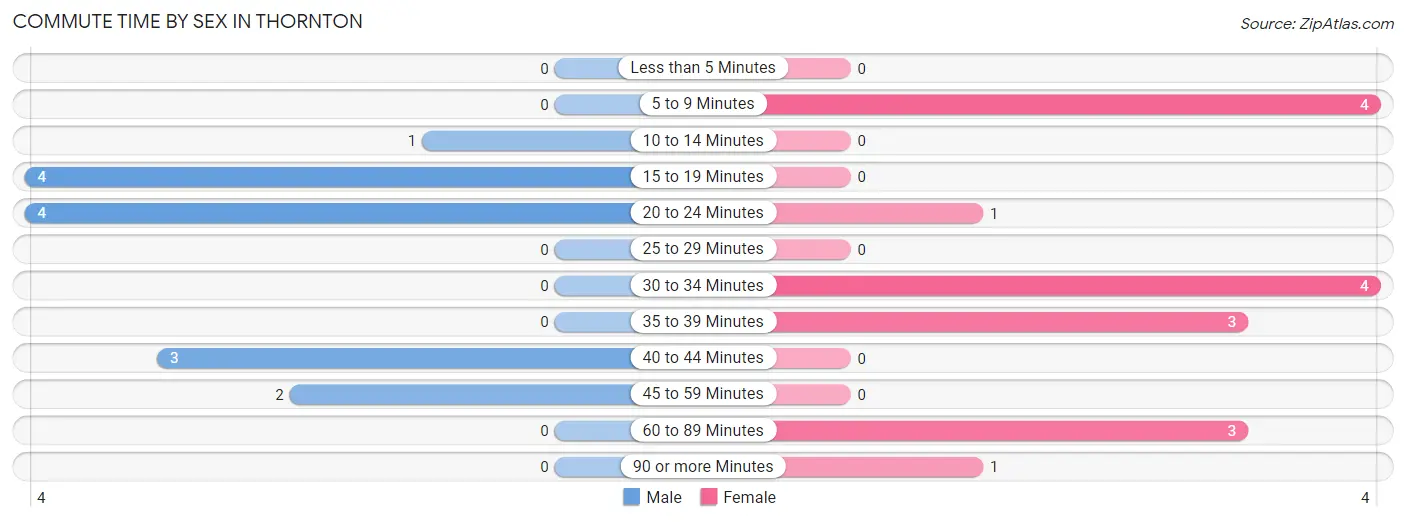
| Commute Time | Male | Female |
| Less than 5 Minutes | 0 (0.0%) | 0 (0.0%) |
| 5 to 9 Minutes | 0 (0.0%) | 4 (25.0%) |
| 10 to 14 Minutes | 1 (7.1%) | 0 (0.0%) |
| 15 to 19 Minutes | 4 (28.6%) | 0 (0.0%) |
| 20 to 24 Minutes | 4 (28.6%) | 1 (6.2%) |
| 25 to 29 Minutes | 0 (0.0%) | 0 (0.0%) |
| 30 to 34 Minutes | 0 (0.0%) | 4 (25.0%) |
| 35 to 39 Minutes | 0 (0.0%) | 3 (18.8%) |
| 40 to 44 Minutes | 3 (21.4%) | 0 (0.0%) |
| 45 to 59 Minutes | 2 (14.3%) | 0 (0.0%) |
| 60 to 89 Minutes | 0 (0.0%) | 3 (18.8%) |
| 90 or more Minutes | 0 (0.0%) | 1 (6.2%) |
Time of Departure to Work by Sex in Thornton
The most frequent times of departure to work in Thornton are 6:30 AM to 6:59 AM (6, 42.9%) for males and 6:30 AM to 6:59 AM (7, 43.8%) for females.
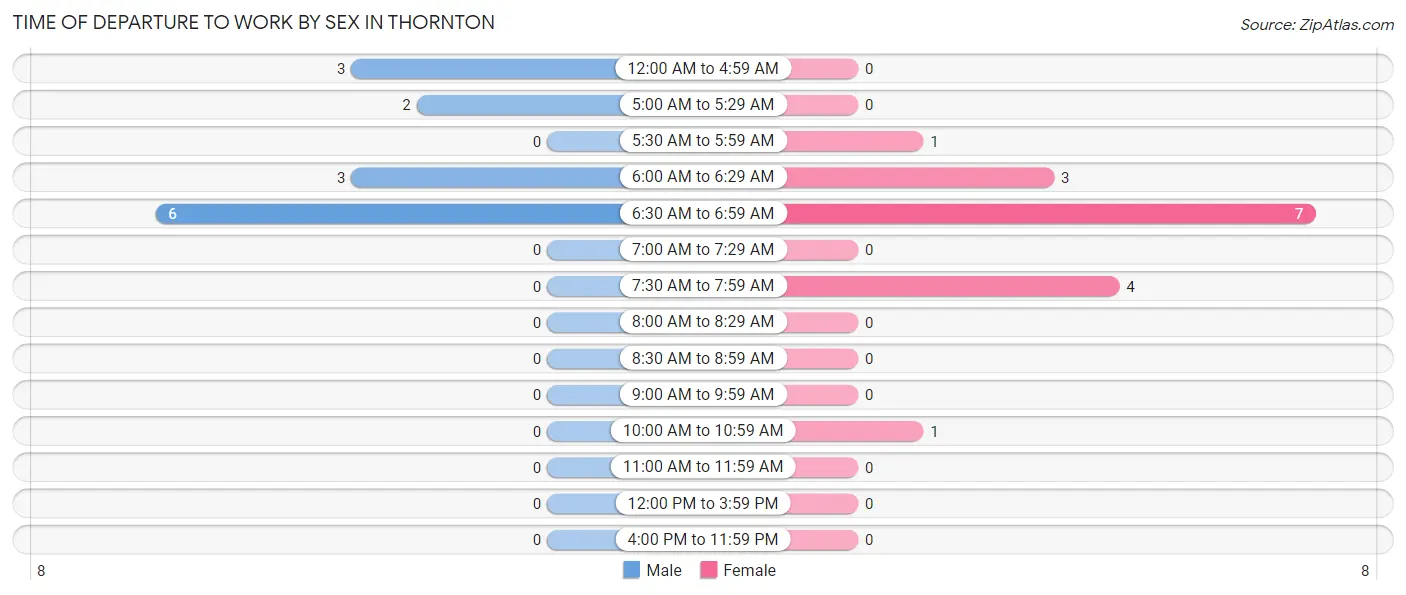
| Time of Departure | Male | Female |
| 12:00 AM to 4:59 AM | 3 (21.4%) | 0 (0.0%) |
| 5:00 AM to 5:29 AM | 2 (14.3%) | 0 (0.0%) |
| 5:30 AM to 5:59 AM | 0 (0.0%) | 1 (6.2%) |
| 6:00 AM to 6:29 AM | 3 (21.4%) | 3 (18.8%) |
| 6:30 AM to 6:59 AM | 6 (42.9%) | 7 (43.8%) |
| 7:00 AM to 7:29 AM | 0 (0.0%) | 0 (0.0%) |
| 7:30 AM to 7:59 AM | 0 (0.0%) | 4 (25.0%) |
| 8:00 AM to 8:29 AM | 0 (0.0%) | 0 (0.0%) |
| 8:30 AM to 8:59 AM | 0 (0.0%) | 0 (0.0%) |
| 9:00 AM to 9:59 AM | 0 (0.0%) | 0 (0.0%) |
| 10:00 AM to 10:59 AM | 0 (0.0%) | 1 (6.2%) |
| 11:00 AM to 11:59 AM | 0 (0.0%) | 0 (0.0%) |
| 12:00 PM to 3:59 PM | 0 (0.0%) | 0 (0.0%) |
| 4:00 PM to 11:59 PM | 0 (0.0%) | 0 (0.0%) |
| Total | 14 (100.0%) | 16 (100.0%) |
Housing Occupancy in Thornton
Occupancy by Ownership in Thornton
Of the total 21 dwellings in Thornton, owner-occupied units account for 21 (100.0%), while renter-occupied units make up 0 (0.0%).
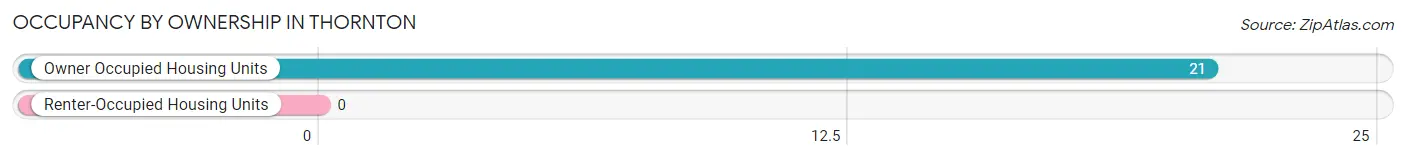
| Occupancy | # Housing Units | % Housing Units |
| Owner Occupied Housing Units | 21 | 100.0% |
| Renter-Occupied Housing Units | 0 | 0.0% |
| Total Occupied Housing Units | 21 | 100.0% |
Occupancy by Household Size in Thornton
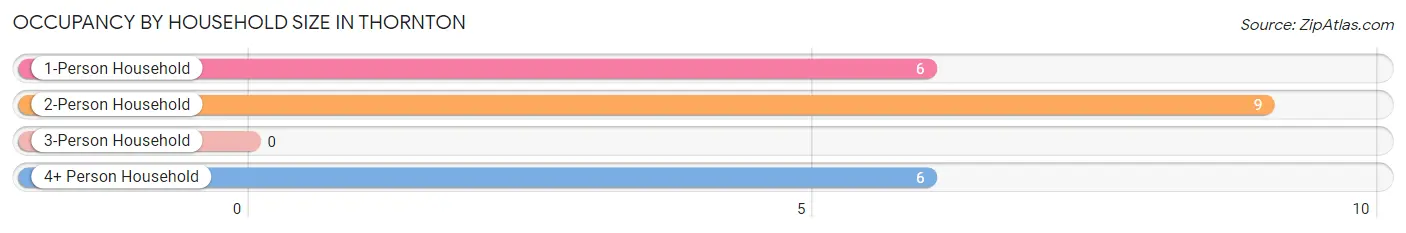
| Household Size | # Housing Units | % Housing Units |
| 1-Person Household | 6 | 28.6% |
| 2-Person Household | 9 | 42.9% |
| 3-Person Household | 0 | 0.0% |
| 4+ Person Household | 6 | 28.6% |
| Total Housing Units | 21 | 100.0% |
Occupancy by Ownership by Household Size in Thornton
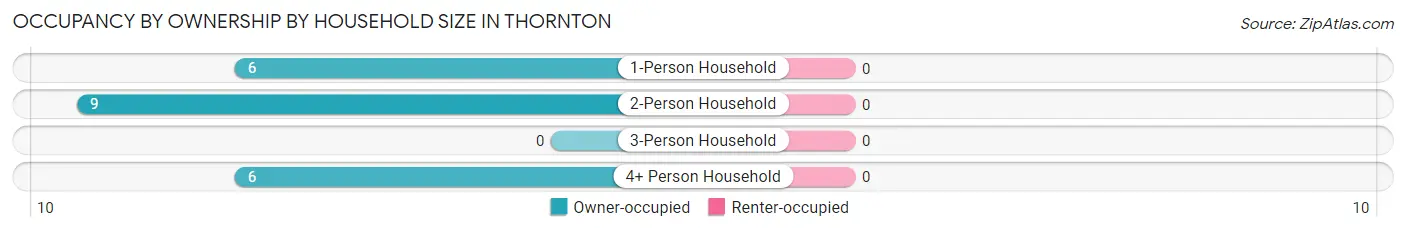
| Household Size | Owner-occupied | Renter-occupied |
| 1-Person Household | 6 (100.0%) | 0 (0.0%) |
| 2-Person Household | 9 (100.0%) | 0 (0.0%) |
| 3-Person Household | 0 (0.0%) | 0 (0.0%) |
| 4+ Person Household | 6 (100.0%) | 0 (0.0%) |
| Total Housing Units | 21 (100.0%) | 0 (0.0%) |
Occupancy by Educational Attainment in Thornton
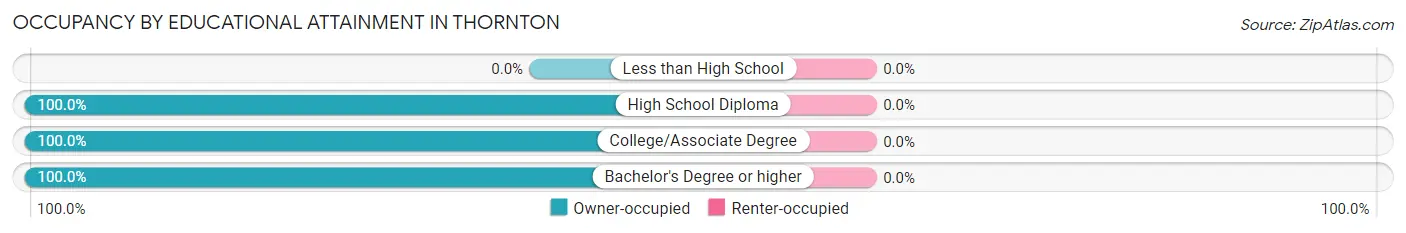
| Household Size | Owner-occupied | Renter-occupied |
| Less than High School | 0 (0.0%) | 0 (0.0%) |
| High School Diploma | 8 (100.0%) | 0 (0.0%) |
| College/Associate Degree | 6 (100.0%) | 0 (0.0%) |
| Bachelor's Degree or higher | 7 (100.0%) | 0 (0.0%) |
Occupancy by Age of Householder in Thornton
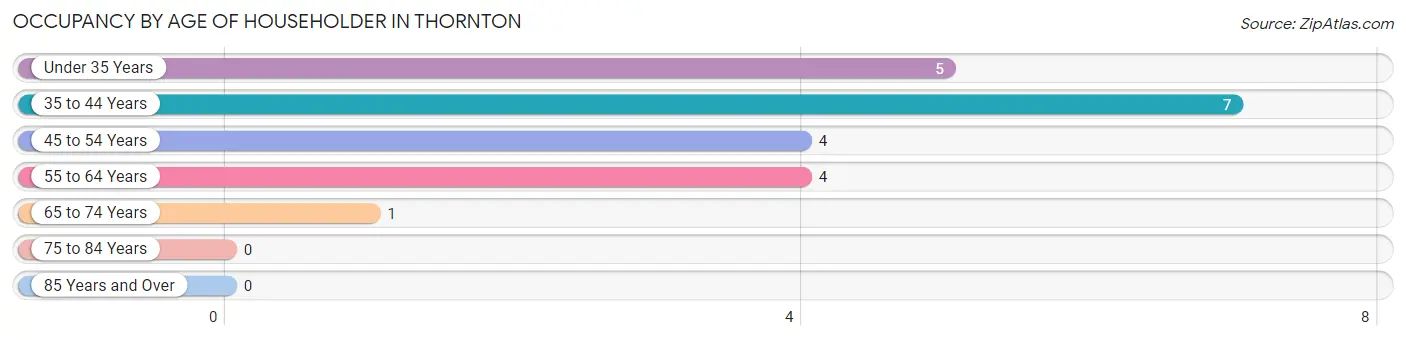
| Age Bracket | # Households | % Households |
| Under 35 Years | 5 | 23.8% |
| 35 to 44 Years | 7 | 33.3% |
| 45 to 54 Years | 4 | 19.1% |
| 55 to 64 Years | 4 | 19.1% |
| 65 to 74 Years | 1 | 4.8% |
| 75 to 84 Years | 0 | 0.0% |
| 85 Years and Over | 0 | 0.0% |
| Total | 21 | 100.0% |
Housing Finances in Thornton
Median Income by Occupancy in Thornton
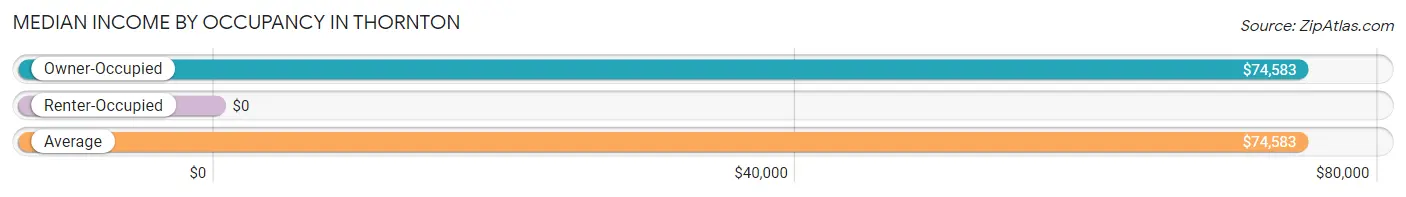
| Occupancy Type | # Households | Median Income |
| Owner-Occupied | 21 (100.0%) | $74,583 |
| Renter-Occupied | 0 (0.0%) | $0 |
| Average | 21 (100.0%) | $74,583 |
Occupancy by Householder Income Bracket in Thornton
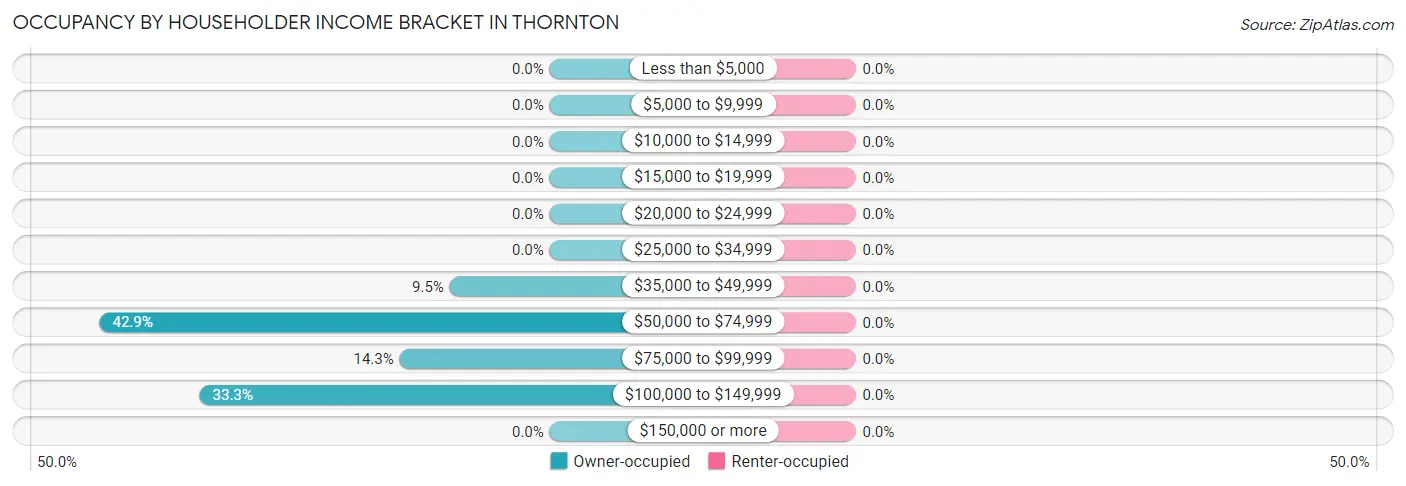
| Income Bracket | Owner-occupied | Renter-occupied |
| Less than $5,000 | 0 (0.0%) | 0 (0.0%) |
| $5,000 to $9,999 | 0 (0.0%) | 0 (0.0%) |
| $10,000 to $14,999 | 0 (0.0%) | 0 (0.0%) |
| $15,000 to $19,999 | 0 (0.0%) | 0 (0.0%) |
| $20,000 to $24,999 | 0 (0.0%) | 0 (0.0%) |
| $25,000 to $34,999 | 0 (0.0%) | 0 (0.0%) |
| $35,000 to $49,999 | 2 (9.5%) | 0 (0.0%) |
| $50,000 to $74,999 | 9 (42.9%) | 0 (0.0%) |
| $75,000 to $99,999 | 3 (14.3%) | 0 (0.0%) |
| $100,000 to $149,999 | 7 (33.3%) | 0 (0.0%) |
| $150,000 or more | 0 (0.0%) | 0 (0.0%) |
| Total | 21 (100.0%) | 0 (0.0%) |
Monthly Housing Cost Tiers in Thornton
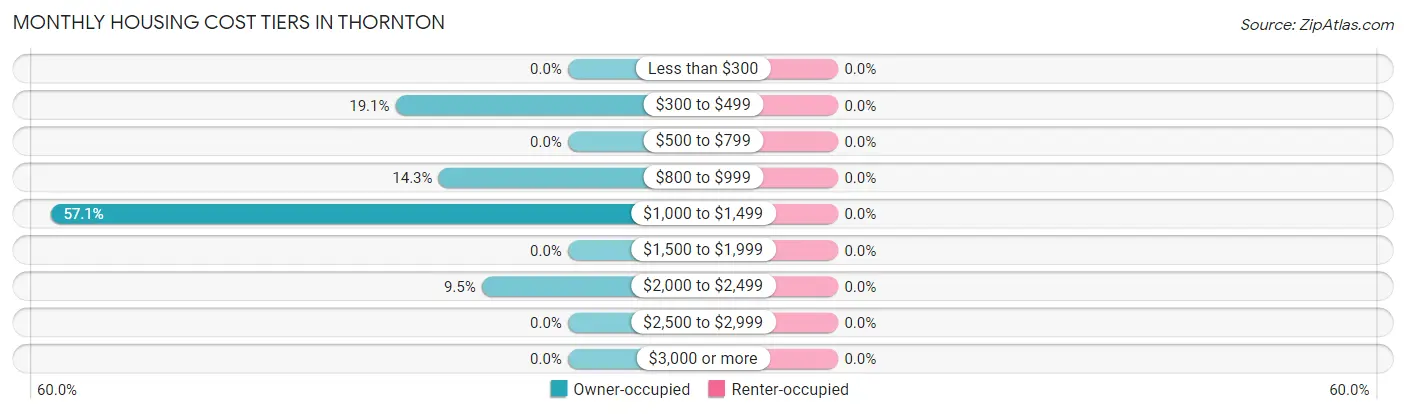
| Monthly Cost | Owner-occupied | Renter-occupied |
| Less than $300 | 0 (0.0%) | 0 (0.0%) |
| $300 to $499 | 4 (19.1%) | 0 (0.0%) |
| $500 to $799 | 0 (0.0%) | 0 (0.0%) |
| $800 to $999 | 3 (14.3%) | 0 (0.0%) |
| $1,000 to $1,499 | 12 (57.1%) | 0 (0.0%) |
| $1,500 to $1,999 | 0 (0.0%) | 0 (0.0%) |
| $2,000 to $2,499 | 2 (9.5%) | 0 (0.0%) |
| $2,500 to $2,999 | 0 (0.0%) | 0 (0.0%) |
| $3,000 or more | 0 (0.0%) | 0 (0.0%) |
| Total | 21 (100.0%) | 0 (0.0%) |
Physical Housing Characteristics in Thornton
Housing Structures in Thornton
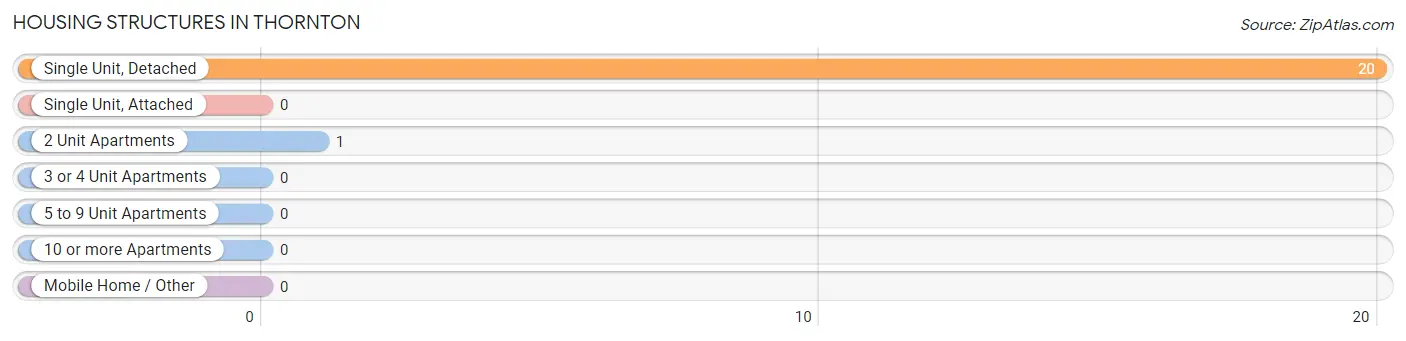
| Structure Type | # Housing Units | % Housing Units |
| Single Unit, Detached | 20 | 95.2% |
| Single Unit, Attached | 0 | 0.0% |
| 2 Unit Apartments | 1 | 4.8% |
| 3 or 4 Unit Apartments | 0 | 0.0% |
| 5 to 9 Unit Apartments | 0 | 0.0% |
| 10 or more Apartments | 0 | 0.0% |
| Mobile Home / Other | 0 | 0.0% |
| Total | 21 | 100.0% |
Housing Structures by Occupancy in Thornton
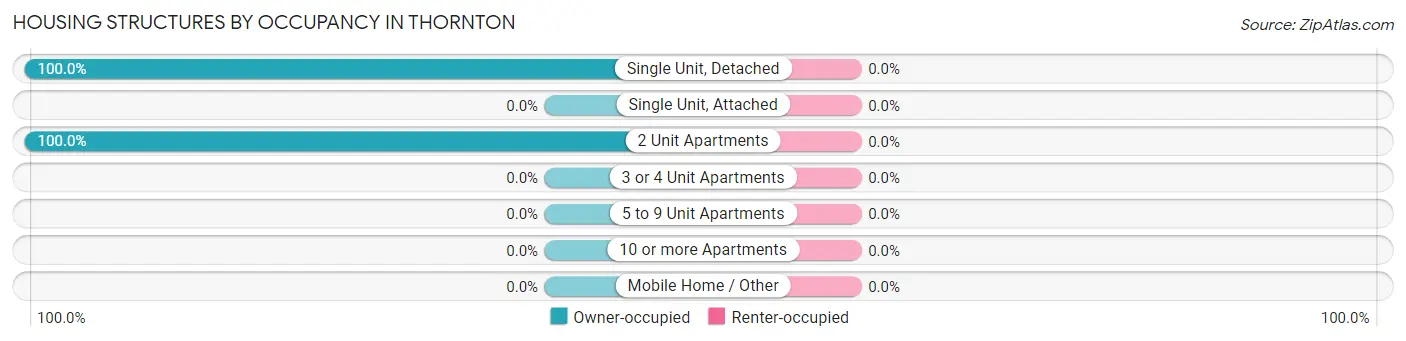
| Structure Type | Owner-occupied | Renter-occupied |
| Single Unit, Detached | 20 (100.0%) | 0 (0.0%) |
| Single Unit, Attached | 0 (0.0%) | 0 (0.0%) |
| 2 Unit Apartments | 1 (100.0%) | 0 (0.0%) |
| 3 or 4 Unit Apartments | 0 (0.0%) | 0 (0.0%) |
| 5 to 9 Unit Apartments | 0 (0.0%) | 0 (0.0%) |
| 10 or more Apartments | 0 (0.0%) | 0 (0.0%) |
| Mobile Home / Other | 0 (0.0%) | 0 (0.0%) |
| Total | 21 (100.0%) | 0 (0.0%) |
Housing Structures by Number of Rooms in Thornton
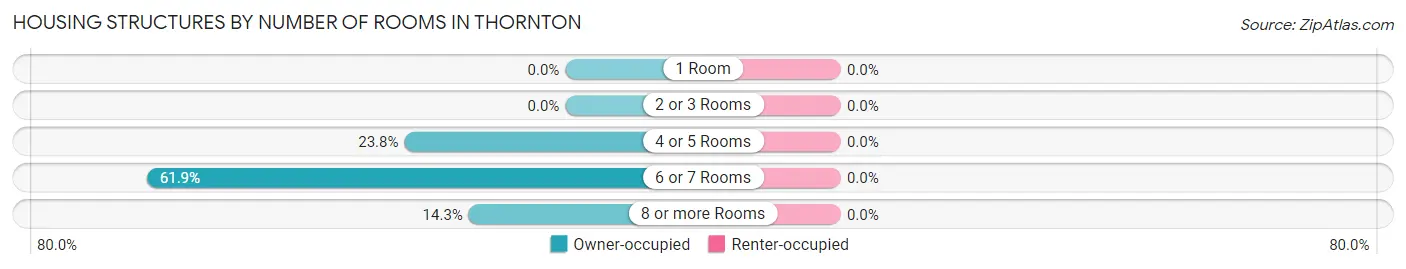
| Number of Rooms | Owner-occupied | Renter-occupied |
| 1 Room | 0 (0.0%) | 0 (0.0%) |
| 2 or 3 Rooms | 0 (0.0%) | 0 (0.0%) |
| 4 or 5 Rooms | 5 (23.8%) | 0 (0.0%) |
| 6 or 7 Rooms | 13 (61.9%) | 0 (0.0%) |
| 8 or more Rooms | 3 (14.3%) | 0 (0.0%) |
| Total | 21 (100.0%) | 0 (0.0%) |
Housing Structure by Heating Type in Thornton
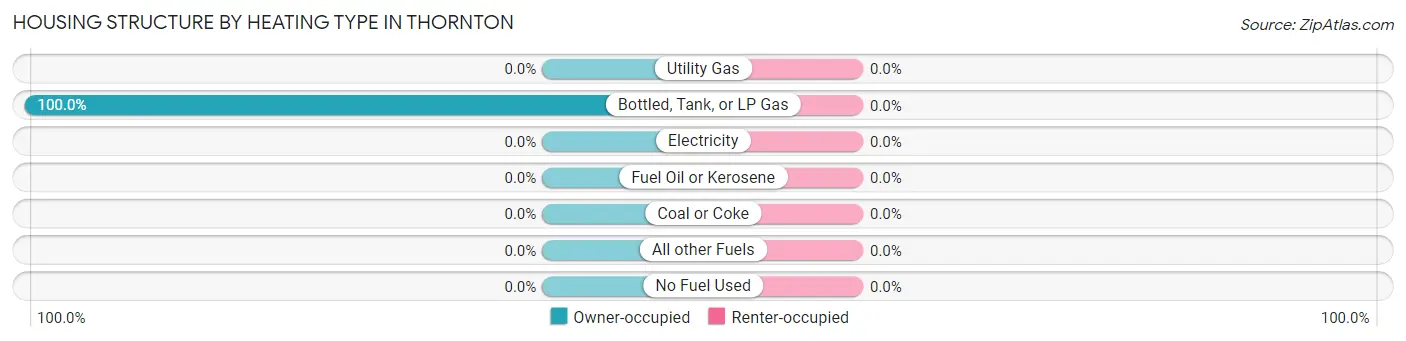
| Heating Type | Owner-occupied | Renter-occupied |
| Utility Gas | 0 (0.0%) | 0 (0.0%) |
| Bottled, Tank, or LP Gas | 21 (100.0%) | 0 (0.0%) |
| Electricity | 0 (0.0%) | 0 (0.0%) |
| Fuel Oil or Kerosene | 0 (0.0%) | 0 (0.0%) |
| Coal or Coke | 0 (0.0%) | 0 (0.0%) |
| All other Fuels | 0 (0.0%) | 0 (0.0%) |
| No Fuel Used | 0 (0.0%) | 0 (0.0%) |
| Total | 21 (100.0%) | 0 (0.0%) |
Household Vehicle Usage in Thornton
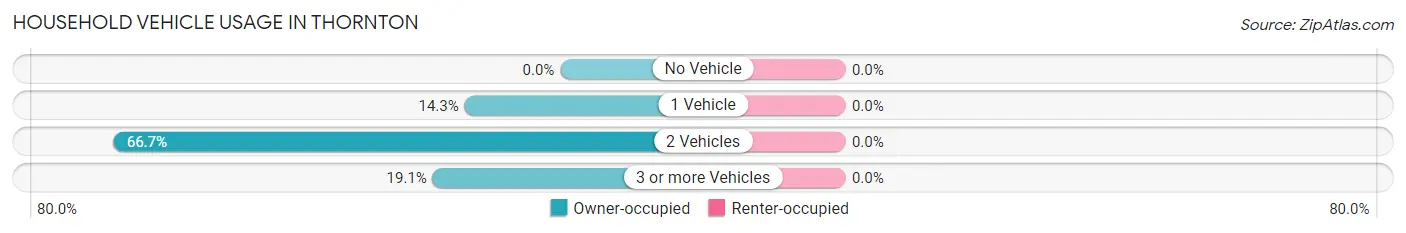
| Vehicles per Household | Owner-occupied | Renter-occupied |
| No Vehicle | 0 (0.0%) | 0 (0.0%) |
| 1 Vehicle | 3 (14.3%) | 0 (0.0%) |
| 2 Vehicles | 14 (66.7%) | 0 (0.0%) |
| 3 or more Vehicles | 4 (19.1%) | 0 (0.0%) |
| Total | 21 (100.0%) | 0 (0.0%) |
Real Estate & Mortgages in Thornton
Real Estate and Mortgage Overview in Thornton
| Characteristic | Without Mortgage | With Mortgage |
| Housing Units | 5 | 16 |
| Median Property Value | $85,000 | $150,000 |
| Median Household Income | - | - |
| Monthly Housing Costs | - | - |
| Real Estate Taxes | $1,313 | $0 |
Property Value by Mortgage Status in Thornton

| Property Value | Without Mortgage | With Mortgage |
| Less than $50,000 | 1 (20.0%) | 0 (0.0%) |
| $50,000 to $99,999 | 3 (60.0%) | 0 (0.0%) |
| $100,000 to $299,999 | 1 (20.0%) | 16 (100.0%) |
| $300,000 to $499,999 | 0 (0.0%) | 0 (0.0%) |
| $500,000 to $749,999 | 0 (0.0%) | 0 (0.0%) |
| $750,000 to $999,999 | 0 (0.0%) | 0 (0.0%) |
| $1,000,000 or more | 0 (0.0%) | 0 (0.0%) |
| Total | 5 (100.0%) | 16 (100.0%) |
Household Income by Mortgage Status in Thornton
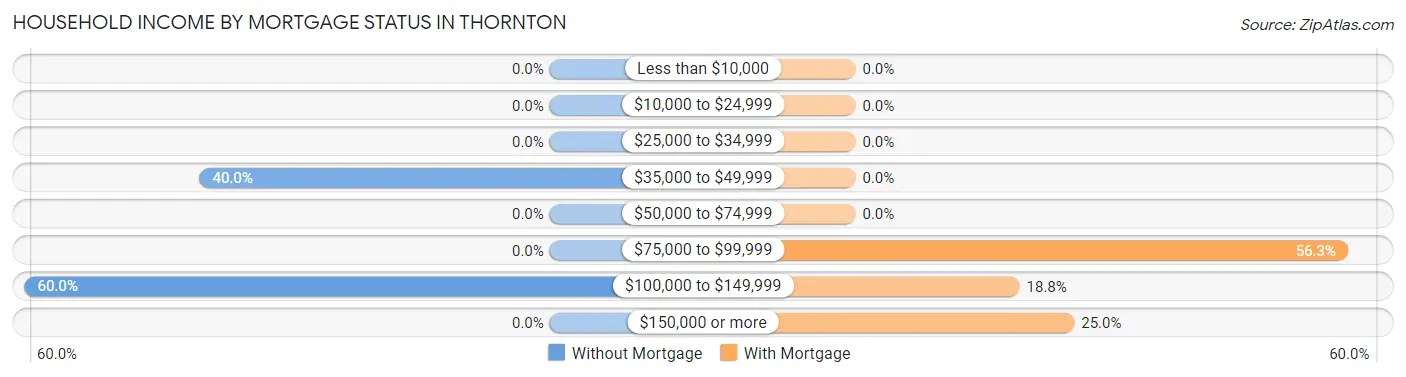
| Household Income | Without Mortgage | With Mortgage |
| Less than $10,000 | 0 (0.0%) | 0 (0.0%) |
| $10,000 to $24,999 | 0 (0.0%) | 0 (0.0%) |
| $25,000 to $34,999 | 0 (0.0%) | 0 (0.0%) |
| $35,000 to $49,999 | 2 (40.0%) | 0 (0.0%) |
| $50,000 to $74,999 | 0 (0.0%) | 0 (0.0%) |
| $75,000 to $99,999 | 0 (0.0%) | 9 (56.2%) |
| $100,000 to $149,999 | 3 (60.0%) | 3 (18.8%) |
| $150,000 or more | 0 (0.0%) | 4 (25.0%) |
| Total | 5 (100.0%) | 16 (100.0%) |
Property Value to Household Income Ratio in Thornton
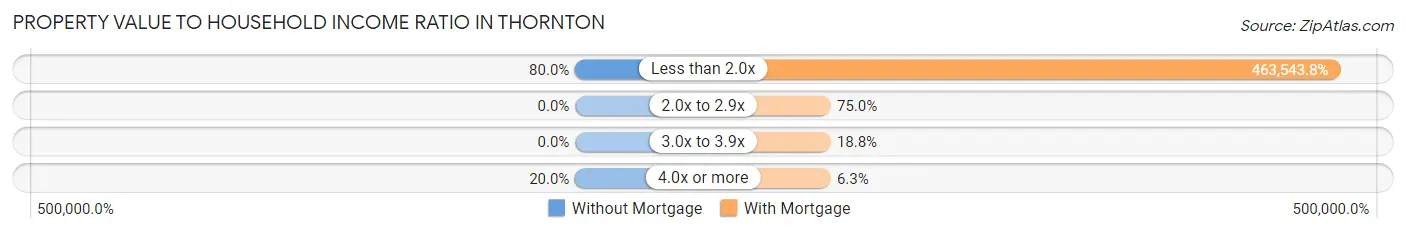
| Value-to-Income Ratio | Without Mortgage | With Mortgage |
| Less than 2.0x | 4 (80.0%) | 74,167 (463,543.8%) |
| 2.0x to 2.9x | 0 (0.0%) | 12 (75.0%) |
| 3.0x to 3.9x | 0 (0.0%) | 3 (18.8%) |
| 4.0x or more | 1 (20.0%) | 1 (6.2%) |
| Total | 5 (100.0%) | 16 (100.0%) |
Real Estate Taxes by Mortgage Status in Thornton
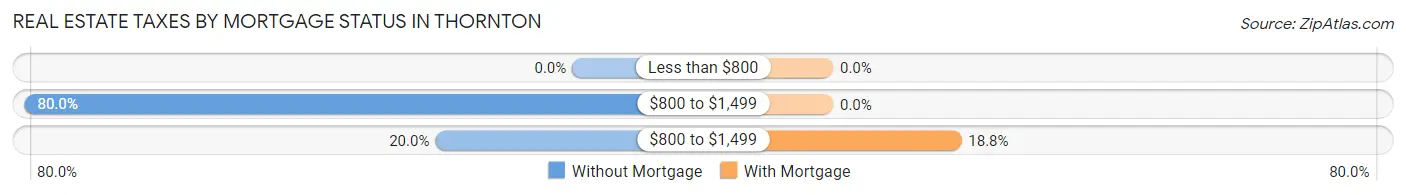
| Property Taxes | Without Mortgage | With Mortgage |
| Less than $800 | 0 (0.0%) | 0 (0.0%) |
| $800 to $1,499 | 4 (80.0%) | 0 (0.0%) |
| $800 to $1,499 | 1 (20.0%) | 3 (18.8%) |
| Total | 5 (100.0%) | 16 (100.0%) |
Health & Disability in Thornton
Health Insurance Coverage by Age in Thornton
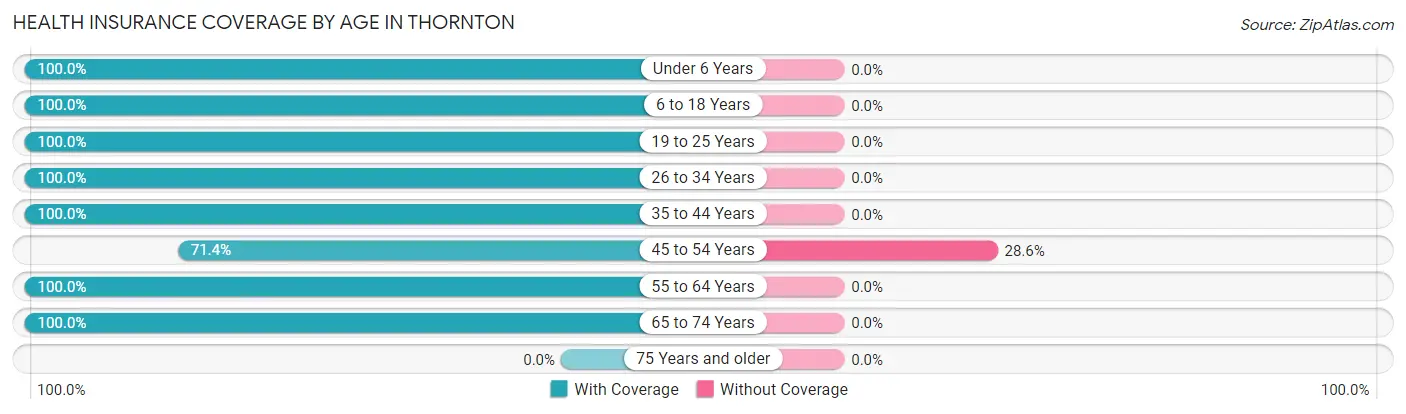
| Age Bracket | With Coverage | Without Coverage |
| Under 6 Years | 7 (100.0%) | 0 (0.0%) |
| 6 to 18 Years | 4 (100.0%) | 0 (0.0%) |
| 19 to 25 Years | 3 (100.0%) | 0 (0.0%) |
| 26 to 34 Years | 7 (100.0%) | 0 (0.0%) |
| 35 to 44 Years | 9 (100.0%) | 0 (0.0%) |
| 45 to 54 Years | 5 (71.4%) | 2 (28.6%) |
| 55 to 64 Years | 6 (100.0%) | 0 (0.0%) |
| 65 to 74 Years | 1 (100.0%) | 0 (0.0%) |
| 75 Years and older | 0 (0.0%) | 0 (0.0%) |
| Total | 42 (95.5%) | 2 (4.5%) |
Health Insurance Coverage by Citizenship Status in Thornton
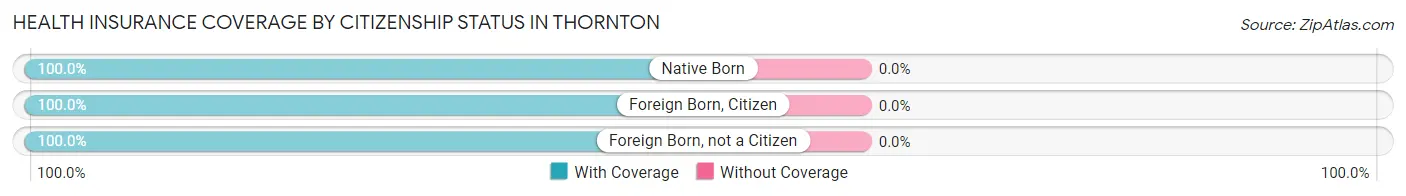
| Citizenship Status | With Coverage | Without Coverage |
| Native Born | 7 (100.0%) | 0 (0.0%) |
| Foreign Born, Citizen | 4 (100.0%) | 0 (0.0%) |
| Foreign Born, not a Citizen | 3 (100.0%) | 0 (0.0%) |
Health Insurance Coverage by Household Income in Thornton
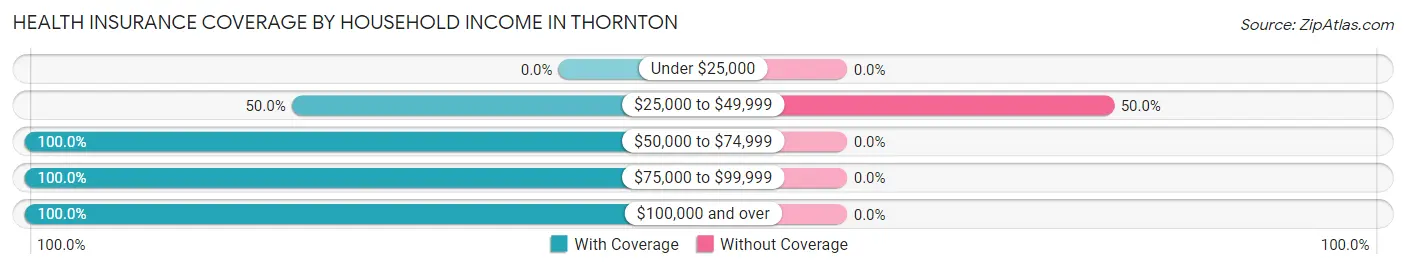
| Household Income | With Coverage | Without Coverage |
| Under $25,000 | 0 (0.0%) | 0 (0.0%) |
| $25,000 to $49,999 | 2 (50.0%) | 2 (50.0%) |
| $50,000 to $74,999 | 19 (100.0%) | 0 (0.0%) |
| $75,000 to $99,999 | 5 (100.0%) | 0 (0.0%) |
| $100,000 and over | 16 (100.0%) | 0 (0.0%) |
Public vs Private Health Insurance Coverage by Age in Thornton
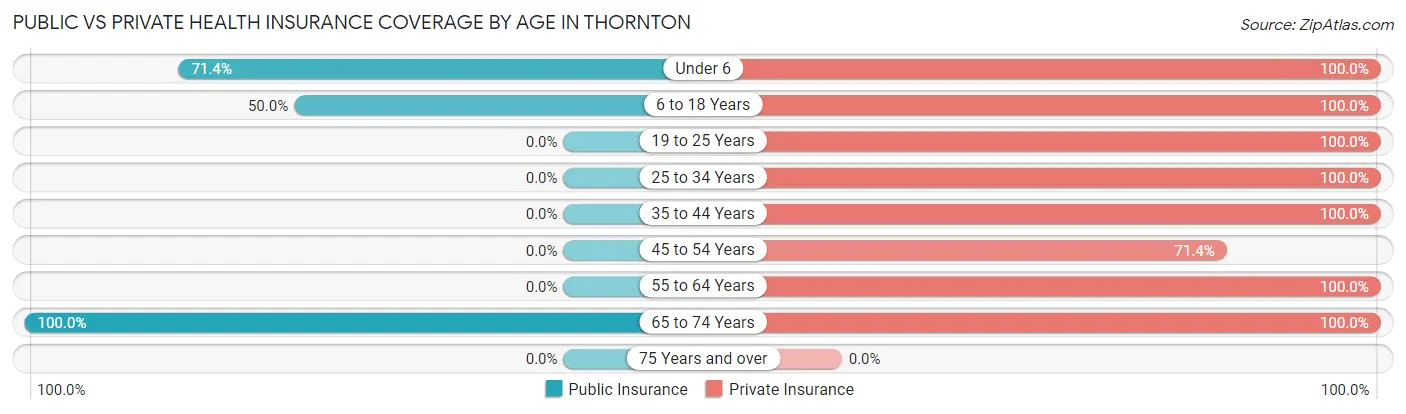
| Age Bracket | Public Insurance | Private Insurance |
| Under 6 | 5 (71.4%) | 7 (100.0%) |
| 6 to 18 Years | 2 (50.0%) | 4 (100.0%) |
| 19 to 25 Years | 0 (0.0%) | 3 (100.0%) |
| 25 to 34 Years | 0 (0.0%) | 7 (100.0%) |
| 35 to 44 Years | 0 (0.0%) | 9 (100.0%) |
| 45 to 54 Years | 0 (0.0%) | 5 (71.4%) |
| 55 to 64 Years | 0 (0.0%) | 6 (100.0%) |
| 65 to 74 Years | 1 (100.0%) | 1 (100.0%) |
| 75 Years and over | 0 (0.0%) | 0 (0.0%) |
| Total | 8 (18.2%) | 42 (95.5%) |
Disability Status by Sex by Age in Thornton
| Age Bracket | Male | Female |
| Under 5 Years | 0 (0.0%) | 0 (0.0%) |
| 5 to 17 Years | 0 (0.0%) | 0 (0.0%) |
| 18 to 34 Years | 0 (0.0%) | 0 (0.0%) |
| 35 to 64 Years | 0 (0.0%) | 0 (0.0%) |
| 65 to 74 Years | 0 (0.0%) | 0 (0.0%) |
| 75 Years and over | 0 (0.0%) | 0 (0.0%) |
Disability Class by Sex by Age in Thornton
Disability Class: Hearing Difficulty
| Age Bracket | Male | Female |
| Under 5 Years | 0 (0.0%) | 0 (0.0%) |
| 5 to 17 Years | 0 (0.0%) | 0 (0.0%) |
| 18 to 34 Years | 0 (0.0%) | 0 (0.0%) |
| 35 to 64 Years | 0 (0.0%) | 0 (0.0%) |
| 65 to 74 Years | 0 (0.0%) | 0 (0.0%) |
| 75 Years and over | 0 (0.0%) | 0 (0.0%) |
Disability Class: Vision Difficulty
| Age Bracket | Male | Female |
| Under 5 Years | 0 (0.0%) | 0 (0.0%) |
| 5 to 17 Years | 0 (0.0%) | 0 (0.0%) |
| 18 to 34 Years | 0 (0.0%) | 0 (0.0%) |
| 35 to 64 Years | 0 (0.0%) | 0 (0.0%) |
| 65 to 74 Years | 0 (0.0%) | 0 (0.0%) |
| 75 Years and over | 0 (0.0%) | 0 (0.0%) |
Disability Class: Cognitive Difficulty
| Age Bracket | Male | Female |
| 5 to 17 Years | 0 (0.0%) | 0 (0.0%) |
| 18 to 34 Years | 0 (0.0%) | 0 (0.0%) |
| 35 to 64 Years | 0 (0.0%) | 0 (0.0%) |
| 65 to 74 Years | 0 (0.0%) | 0 (0.0%) |
| 75 Years and over | 0 (0.0%) | 0 (0.0%) |
Disability Class: Ambulatory Difficulty
| Age Bracket | Male | Female |
| 5 to 17 Years | 0 (0.0%) | 0 (0.0%) |
| 18 to 34 Years | 0 (0.0%) | 0 (0.0%) |
| 35 to 64 Years | 0 (0.0%) | 0 (0.0%) |
| 65 to 74 Years | 0 (0.0%) | 0 (0.0%) |
| 75 Years and over | 0 (0.0%) | 0 (0.0%) |
Disability Class: Self-Care Difficulty

| Age Bracket | Male | Female |
| 5 to 17 Years | 0 (0.0%) | 0 (0.0%) |
| 18 to 34 Years | 0 (0.0%) | 0 (0.0%) |
| 35 to 64 Years | 0 (0.0%) | 0 (0.0%) |
| 65 to 74 Years | 0 (0.0%) | 0 (0.0%) |
| 75 Years and over | 0 (0.0%) | 0 (0.0%) |
Technology Access in Thornton
Computing Device Access in Thornton
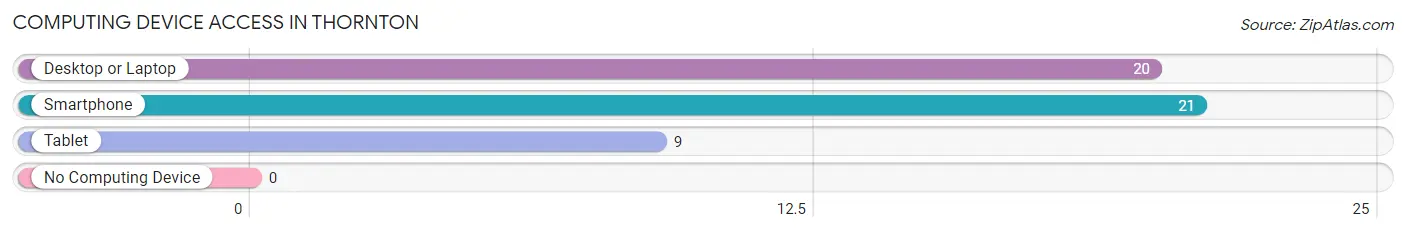
| Device Type | # Households | % Households |
| Desktop or Laptop | 20 | 95.2% |
| Smartphone | 21 | 100.0% |
| Tablet | 9 | 42.9% |
| No Computing Device | 0 | 0.0% |
| Total | 21 | 100.0% |
Internet Access in Thornton
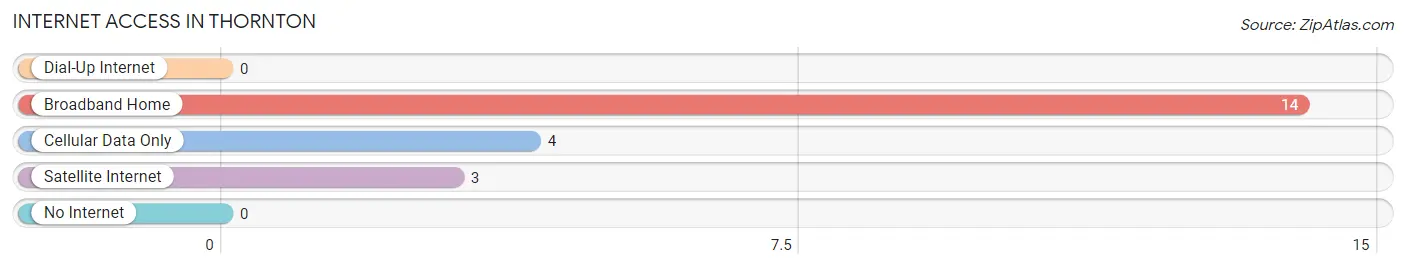
| Internet Type | # Households | % Households |
| Dial-Up Internet | 0 | 0.0% |
| Broadband Home | 14 | 66.7% |
| Cellular Data Only | 4 | 19.1% |
| Satellite Internet | 3 | 14.3% |
| No Internet | 0 | 0.0% |
| Total | 21 | 100.0% |
Thornton Summary
Thornton, Wisconsin is a small town located in the northern part of the state, in the county of Barron. It is situated on the banks of the Chippewa River, and is home to a population of just over 500 people. The town was founded in 1883, and has a rich history of logging, farming, and small business.
Geography
Thornton is located in the northwest corner of Wisconsin, in Barron County. It is situated on the banks of the Chippewa River, and is surrounded by rolling hills and forests. The town is located about 25 miles from the city of Rice Lake, and is about an hour and a half drive from the Twin Cities of Minneapolis and St. Paul. The town is also close to the Wisconsin-Minnesota border, and is about a two hour drive from Duluth, Minnesota.
Economy
Thornton’s economy is largely based on agriculture and small businesses. The town is home to several small businesses, including a grocery store, a hardware store, a restaurant, and a few other small shops. The town also has a few small manufacturing businesses, such as a woodworking shop and a metal fabrication shop. The town is also home to a few farms, which produce a variety of crops, including corn, soybeans, and hay.
Demographics
As of the 2010 census, Thornton had a population of 517 people. The town is predominantly white, with a small percentage of African Americans, Hispanics, and Native Americans. The median household income in Thornton is $41,250, and the median age is 44. The town has a high rate of homeownership, with over 80% of the population owning their own homes.
History
Thornton was founded in 1883 by a group of settlers from Minnesota. The town was originally called “Thorntonville”, and was named after the first settler, John Thornton. The town was originally a logging and farming community, and the first businesses in the town were a sawmill and a general store. The town grew slowly over the years, and by the early 1900s, it had become a thriving community. The town was home to several small businesses, including a blacksmith, a barber shop, and a hotel.
In the late 1950s, the town began to decline, as many of the businesses closed and the population began to dwindle. However, in the late 1980s, the town began to experience a resurgence, as new businesses opened and the population began to grow again. Today, Thornton is a small, but vibrant community, with a strong sense of community and pride.
Common Questions
What is Per Capita Income in Thornton?
Per Capita income in Thornton is $35,975.
What is the Median Family Income in Thornton?
Median Family Income in Thornton is $68,125.
What is the Median Household income in Thornton?
Median Household Income in Thornton is $74,583.
What is Income or Wage Gap in Thornton?
Income or Wage Gap in Thornton is 15.7%.
Women in Thornton earn 84.3 cents for every dollar earned by a man.
What is Inequality or Gini Index in Thornton?
Inequality or Gini Index in Thornton is 0.15.
What is the Total Population of Thornton?
Total Population of Thornton is 44.
What is the Total Male Population of Thornton?
Total Male Population of Thornton is 19.
What is the Total Female Population of Thornton?
Total Female Population of Thornton is 25.
What is the Ratio of Males per 100 Females in Thornton?
There are 76.00 Males per 100 Females in Thornton.
What is the Ratio of Females per 100 Males in Thornton?
There are 131.58 Females per 100 Males in Thornton.
What is the Median Population Age in Thornton?
Median Population Age in Thornton is 38.1 Years.
What is the Average Family Size in Thornton
Average Family Size in Thornton is 2.4 People.
What is the Average Household Size in Thornton
Average Household Size in Thornton is 2.1 People.
How Large is the Labor Force in Thornton?
There are 30 People in the Labor Forcein in Thornton.
What is the Percentage of People in the Labor Force in Thornton?
90.9% of People are in the Labor Force in Thornton.