Cornucopia, WI Map & Demographics
Cornucopia Map
Cornucopia Overview
$36,438
PER CAPITA INCOME
$83,125
AVG FAMILY INCOME
$45,139
AVG HOUSEHOLD INCOME
5.4%
WAGE / INCOME GAP [ % ]
94.6¢/ $1
WAGE / INCOME GAP [ $ ]
0.42
INEQUALITY / GINI INDEX
103
TOTAL POPULATION
57
MALE POPULATION
46
FEMALE POPULATION
123.91
MALES / 100 FEMALES
80.70
FEMALES / 100 MALES
71.7
MEDIAN AGE
2.1
AVG FAMILY SIZE
1.6
AVG HOUSEHOLD SIZE
32
LABOR FORCE [ PEOPLE ]
32.3%
PERCENT IN LABOR FORCE
Cornucopia Zip Codes
Cornucopia Area Codes
Income in Cornucopia
Income Overview in Cornucopia
Per Capita Income in Cornucopia is $36,438, while median incomes of families and households are $83,125 and $45,139 respectively.
| Characteristic | Number | Measure |
| Per Capita Income | 103 | $36,438 |
| Median Family Income | 35 | $83,125 |
| Mean Family Income | 35 | $74,077 |
| Median Household Income | 65 | $45,139 |
| Mean Household Income | 65 | $56,446 |
| Income Deficit | 35 | $0 |
| Wage / Income Gap (%) | 103 | 5.45% |
| Wage / Income Gap ($) | 103 | 94.55¢ per $1 |
| Gini / Inequality Index | 103 | 0.42 |
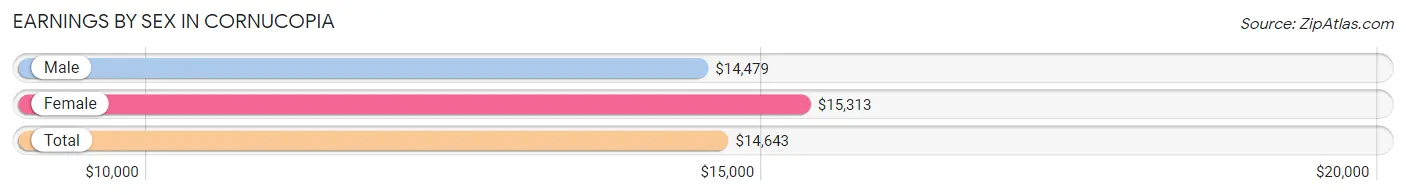
Earnings by Sex in Cornucopia
Average Earnings in Cornucopia are $14,643, $14,479 for men and $15,313 for women, a difference of 5.4%.
| Sex | Number | Average Earnings |
| Male | 23 (63.9%) | $14,479 |
| Female | 13 (36.1%) | $15,313 |
| Total | 36 (100.0%) | $14,643 |
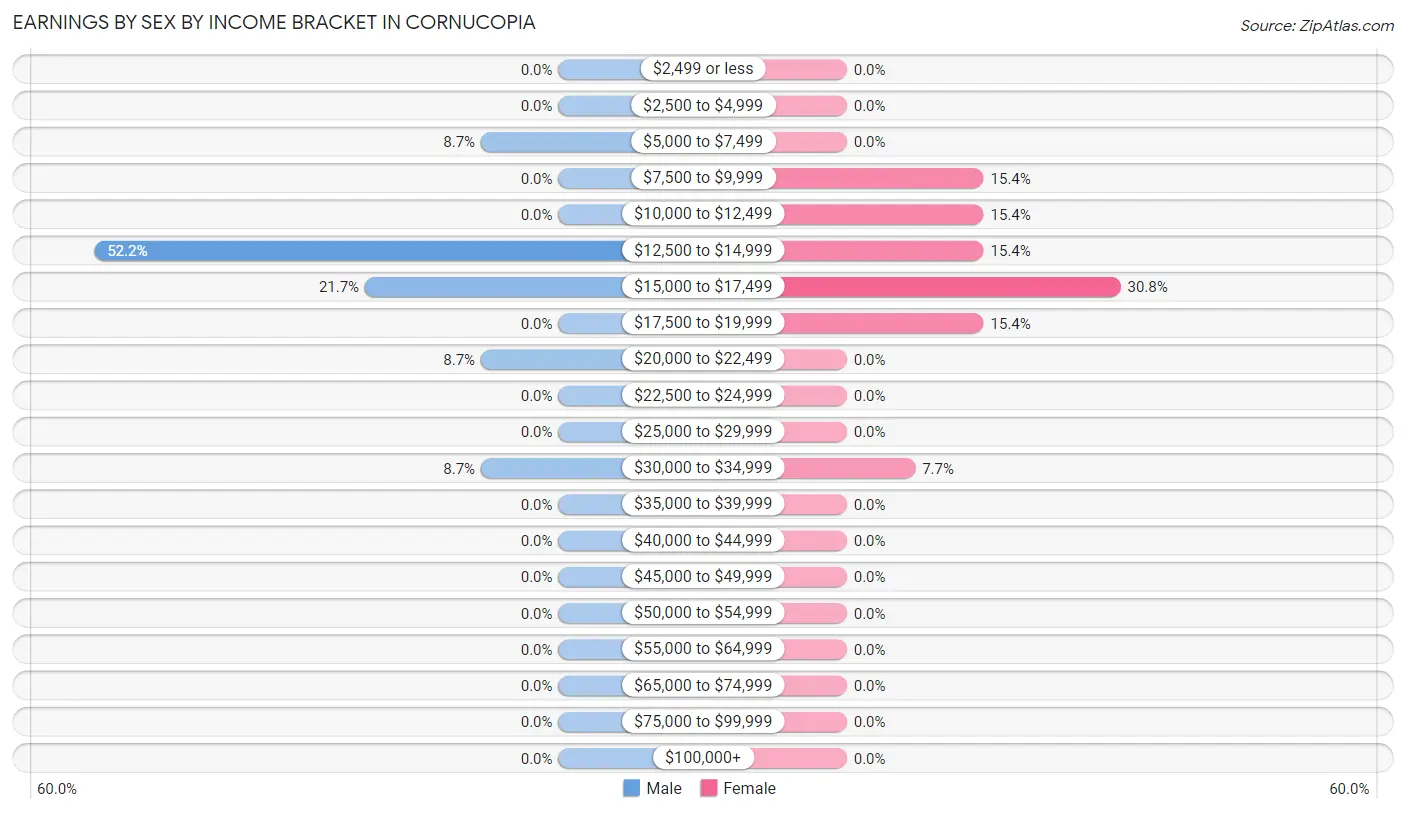
Earnings by Sex by Income Bracket in Cornucopia
The most common earnings brackets in Cornucopia are $12,500 to $14,999 for men (12 | 52.2%) and $15,000 to $17,499 for women (4 | 30.8%).
| Income | Male | Female |
| $2,499 or less | 0 (0.0%) | 0 (0.0%) |
| $2,500 to $4,999 | 0 (0.0%) | 0 (0.0%) |
| $5,000 to $7,499 | 2 (8.7%) | 0 (0.0%) |
| $7,500 to $9,999 | 0 (0.0%) | 2 (15.4%) |
| $10,000 to $12,499 | 0 (0.0%) | 2 (15.4%) |
| $12,500 to $14,999 | 12 (52.2%) | 2 (15.4%) |
| $15,000 to $17,499 | 5 (21.7%) | 4 (30.8%) |
| $17,500 to $19,999 | 0 (0.0%) | 2 (15.4%) |
| $20,000 to $22,499 | 2 (8.7%) | 0 (0.0%) |
| $22,500 to $24,999 | 0 (0.0%) | 0 (0.0%) |
| $25,000 to $29,999 | 0 (0.0%) | 0 (0.0%) |
| $30,000 to $34,999 | 2 (8.7%) | 1 (7.7%) |
| $35,000 to $39,999 | 0 (0.0%) | 0 (0.0%) |
| $40,000 to $44,999 | 0 (0.0%) | 0 (0.0%) |
| $45,000 to $49,999 | 0 (0.0%) | 0 (0.0%) |
| $50,000 to $54,999 | 0 (0.0%) | 0 (0.0%) |
| $55,000 to $64,999 | 0 (0.0%) | 0 (0.0%) |
| $65,000 to $74,999 | 0 (0.0%) | 0 (0.0%) |
| $75,000 to $99,999 | 0 (0.0%) | 0 (0.0%) |
| $100,000+ | 0 (0.0%) | 0 (0.0%) |
| Total | 23 (100.0%) | 13 (100.0%) |
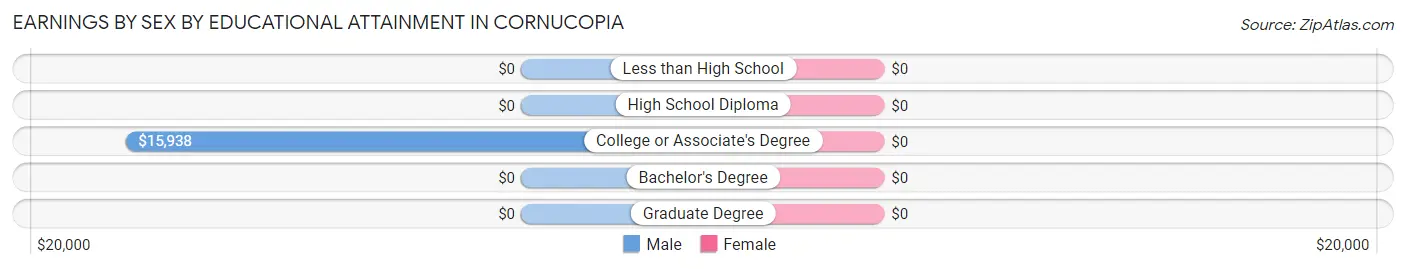
Earnings by Sex by Educational Attainment in Cornucopia
| Educational Attainment | Male Income | Female Income |
| Less than High School | - | - |
| High School Diploma | - | - |
| College or Associate's Degree | $15,938 | $0 |
| Bachelor's Degree | - | - |
| Graduate Degree | - | - |
| Total | $16,500 | $15,938 |
Family Income in Cornucopia
Family Income Brackets in Cornucopia
According to the Cornucopia family income data, there are 12 families falling into the $35,000 to $49,999 income range, which is the most common income bracket and makes up 34.3% of all families.
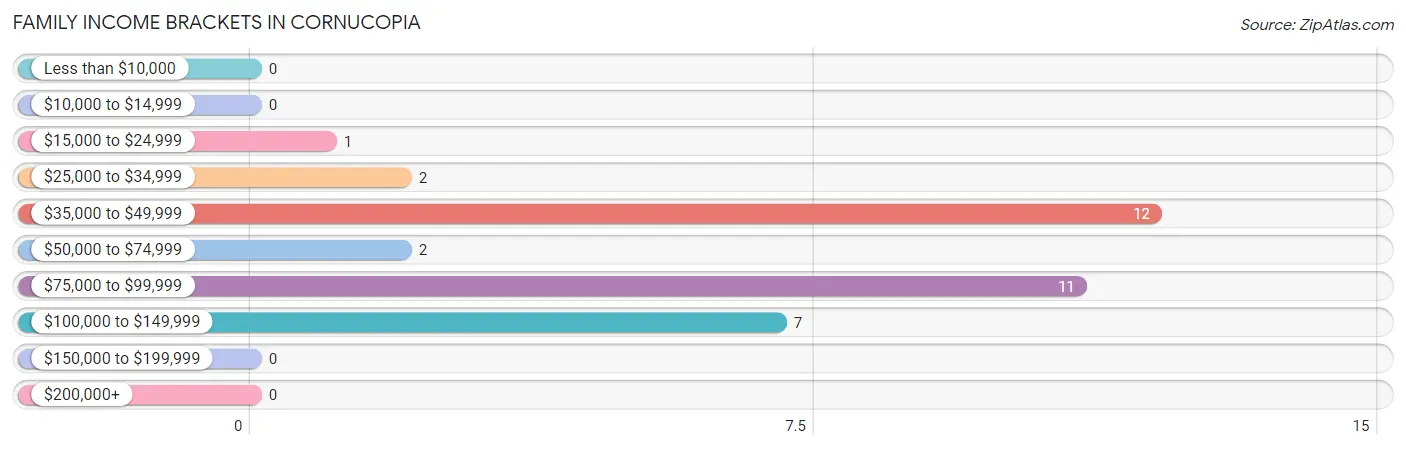
| Income Bracket | # Families | % Families |
| Less than $10,000 | 0 | 0.0% |
| $10,000 to $14,999 | 0 | 0.0% |
| $15,000 to $24,999 | 1 | 2.9% |
| $25,000 to $34,999 | 2 | 5.7% |
| $35,000 to $49,999 | 12 | 34.3% |
| $50,000 to $74,999 | 2 | 5.7% |
| $75,000 to $99,999 | 11 | 31.4% |
| $100,000 to $149,999 | 7 | 20.0% |
| $150,000 to $199,999 | 0 | 0.0% |
| $200,000+ | 0 | 0.0% |
Family Income by Famaliy Size in Cornucopia
2-person families (33 | 94.3%) account for the highest median family income in Cornucopia with $84,375 per family, while 2-person families (33 | 94.3%) have the highest median income of $42,188 per family member.
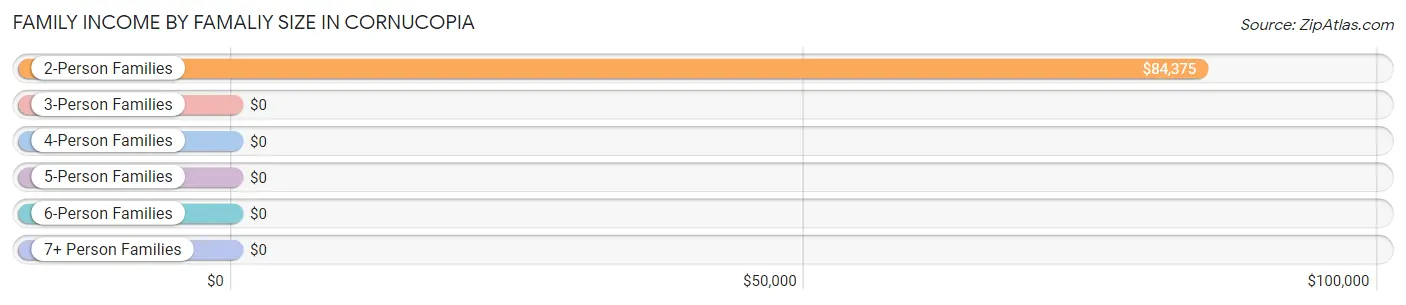
| Income Bracket | # Families | Median Income |
| 2-Person Families | 33 (94.3%) | $84,375 |
| 3-Person Families | 0 (0.0%) | $0 |
| 4-Person Families | 2 (5.7%) | $0 |
| 5-Person Families | 0 (0.0%) | $0 |
| 6-Person Families | 0 (0.0%) | $0 |
| 7+ Person Families | 0 (0.0%) | $0 |
| Total | 35 (100.0%) | $83,125 |
Family Income by Number of Earners in Cornucopia
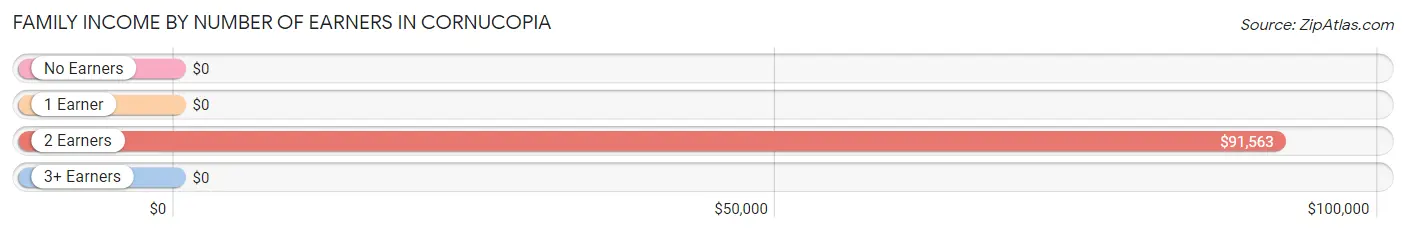
| Number of Earners | # Families | Median Income |
| No Earners | 23 (65.7%) | $0 |
| 1 Earner | 1 (2.9%) | $0 |
| 2 Earners | 11 (31.4%) | $91,563 |
| 3+ Earners | 0 (0.0%) | $0 |
| Total | 35 (100.0%) | $83,125 |
Household Income in Cornucopia
Household Income Brackets in Cornucopia
With 21 households falling in the category, the $35,000 to $49,999 income range is the most frequent in Cornucopia, accounting for 32.3% of all households.
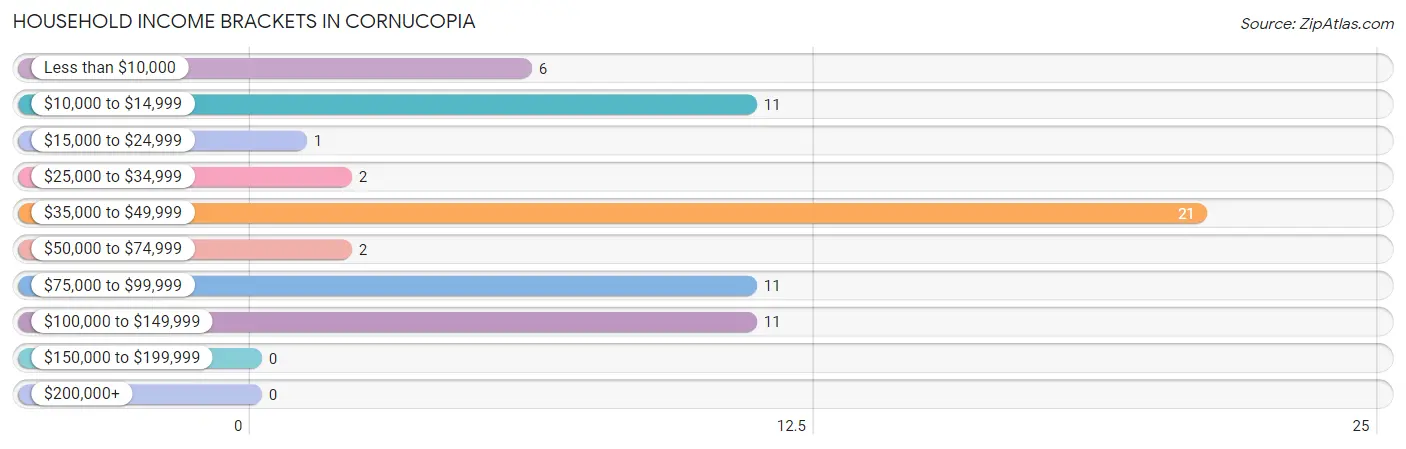
| Income Bracket | # Households | % Households |
| Less than $10,000 | 6 | 9.2% |
| $10,000 to $14,999 | 11 | 16.9% |
| $15,000 to $24,999 | 1 | 1.5% |
| $25,000 to $34,999 | 2 | 3.1% |
| $35,000 to $49,999 | 21 | 32.3% |
| $50,000 to $74,999 | 2 | 3.1% |
| $75,000 to $99,999 | 11 | 16.9% |
| $100,000 to $149,999 | 11 | 16.9% |
| $150,000 to $199,999 | 0 | 0.0% |
| $200,000+ | 0 | 0.0% |
Household Income by Householder Age in Cornucopia
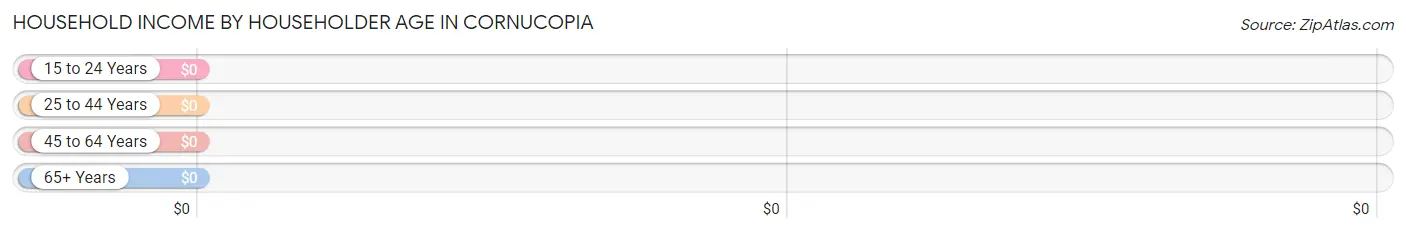
| Income Bracket | # Households | Median Income |
| 15 to 24 Years | 11 (16.9%) | $0 |
| 25 to 44 Years | 2 (3.1%) | $0 |
| 45 to 64 Years | 8 (12.3%) | $0 |
| 65+ Years | 44 (67.7%) | $0 |
| Total | 65 (100.0%) | $45,139 |
Poverty in Cornucopia
Income Below Poverty by Sex and Age in Cornucopia
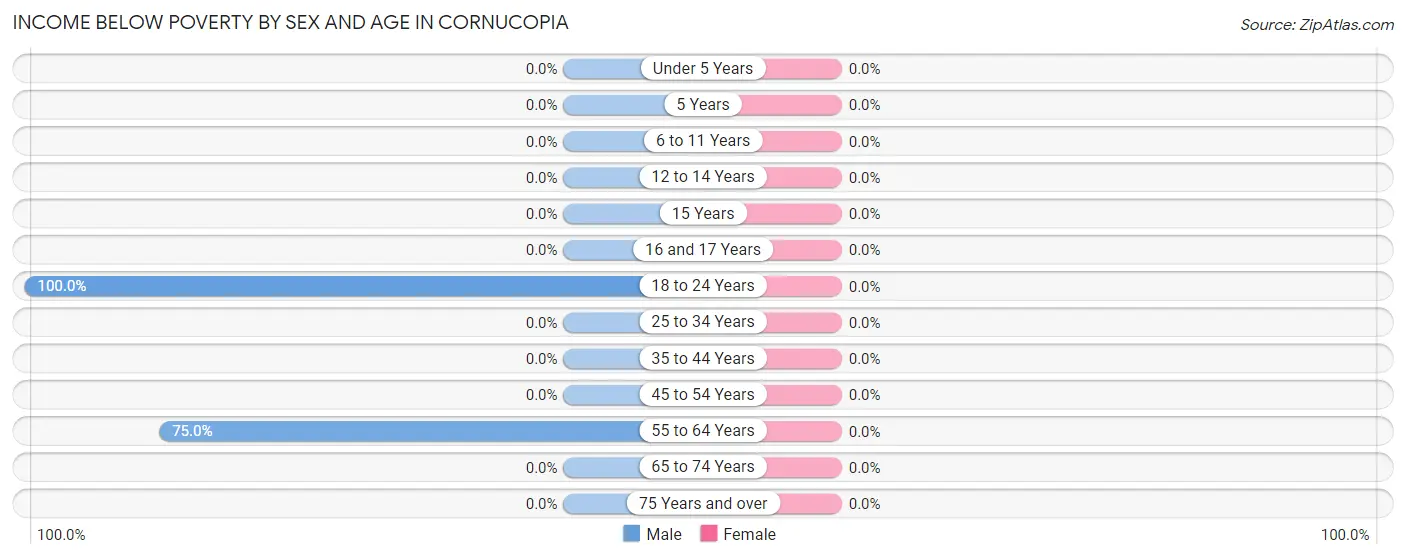
| Age Bracket | Male | Female |
| Under 5 Years | 0 (0.0%) | 0 (0.0%) |
| 5 Years | 0 (0.0%) | 0 (0.0%) |
| 6 to 11 Years | 0 (0.0%) | 0 (0.0%) |
| 12 to 14 Years | 0 (0.0%) | 0 (0.0%) |
| 15 Years | 0 (0.0%) | 0 (0.0%) |
| 16 and 17 Years | 0 (0.0%) | 0 (0.0%) |
| 18 to 24 Years | 11 (100.0%) | 0 (0.0%) |
| 25 to 34 Years | 0 (0.0%) | 0 (0.0%) |
| 35 to 44 Years | 0 (0.0%) | 0 (0.0%) |
| 45 to 54 Years | 0 (0.0%) | 0 (0.0%) |
| 55 to 64 Years | 6 (75.0%) | 0 (0.0%) |
| 65 to 74 Years | 0 (0.0%) | 0 (0.0%) |
| 75 Years and over | 0 (0.0%) | 0 (0.0%) |
| Total | 17 (29.8%) | 0 (0.0%) |
Income Above Poverty by Sex and Age in Cornucopia
According to the poverty statistics in Cornucopia, males aged 12 to 14 years and females aged 6 to 11 years are the age groups that are most secure financially, with 100.0% of males and 100.0% of females in these age groups living above the poverty line.
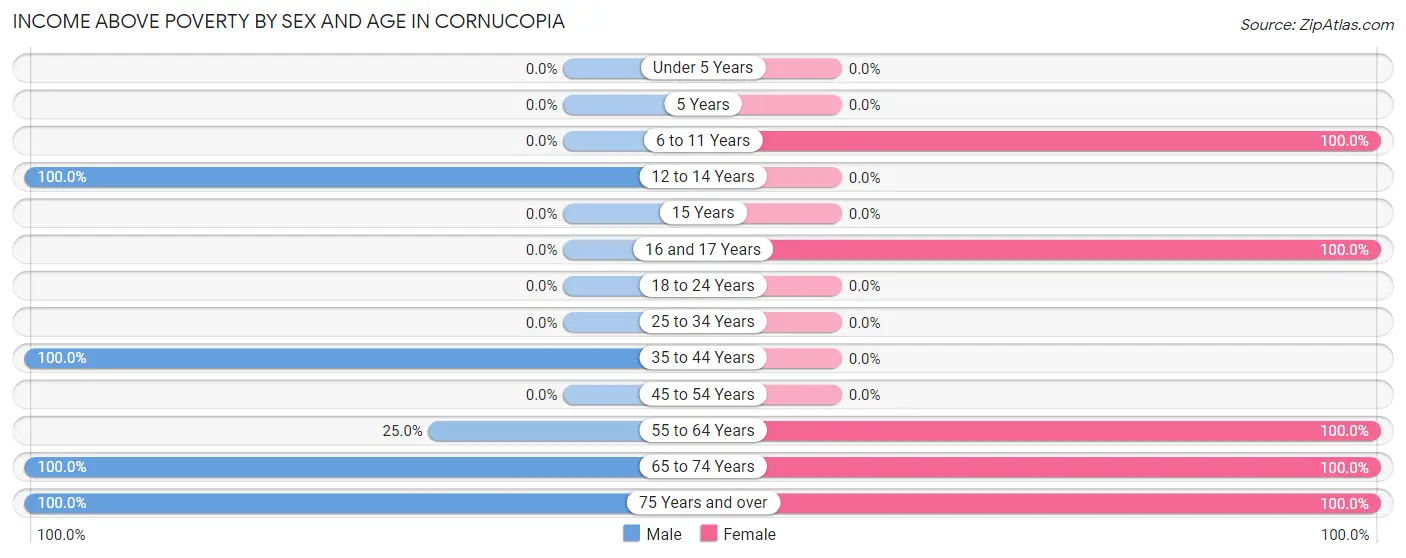
| Age Bracket | Male | Female |
| Under 5 Years | 0 (0.0%) | 0 (0.0%) |
| 5 Years | 0 (0.0%) | 0 (0.0%) |
| 6 to 11 Years | 0 (0.0%) | 2 (100.0%) |
| 12 to 14 Years | 2 (100.0%) | 0 (0.0%) |
| 15 Years | 0 (0.0%) | 0 (0.0%) |
| 16 and 17 Years | 0 (0.0%) | 2 (100.0%) |
| 18 to 24 Years | 0 (0.0%) | 0 (0.0%) |
| 25 to 34 Years | 0 (0.0%) | 0 (0.0%) |
| 35 to 44 Years | 2 (100.0%) | 0 (0.0%) |
| 45 to 54 Years | 0 (0.0%) | 0 (0.0%) |
| 55 to 64 Years | 2 (25.0%) | 5 (100.0%) |
| 65 to 74 Years | 13 (100.0%) | 17 (100.0%) |
| 75 Years and over | 21 (100.0%) | 20 (100.0%) |
| Total | 40 (70.2%) | 46 (100.0%) |
Income Below Poverty Among Married-Couple Families in Cornucopia
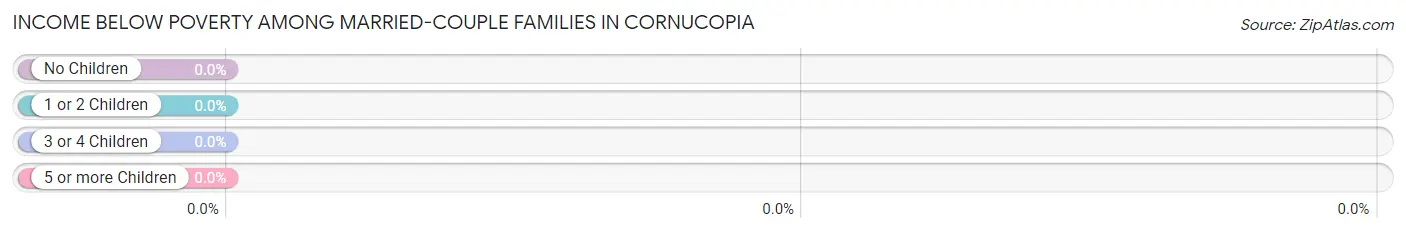
| Children | Above Poverty | Below Poverty |
| No Children | 33 (100.0%) | 0 (0.0%) |
| 1 or 2 Children | 0 (0.0%) | 0 (0.0%) |
| 3 or 4 Children | 0 (0.0%) | 0 (0.0%) |
| 5 or more Children | 0 (0.0%) | 0 (0.0%) |
| Total | 33 (100.0%) | 0 (0.0%) |
Income Below Poverty Among Single-Parent Households in Cornucopia
| Children | Single Father | Single Mother |
| No Children | 0 (0.0%) | 0 (0.0%) |
| 1 or 2 Children | 0 (0.0%) | 0 (0.0%) |
| 3 or 4 Children | 0 (0.0%) | 0 (0.0%) |
| 5 or more Children | 0 (0.0%) | 0 (0.0%) |
| Total | 0 (0.0%) | 0 (0.0%) |
Income Below Poverty Among Married-Couple vs Single-Parent Households in Cornucopia
| Children | Married-Couple Families | Single-Parent Households |
| No Children | 0 (0.0%) | 0 (0.0%) |
| 1 or 2 Children | 0 (0.0%) | 0 (0.0%) |
| 3 or 4 Children | 0 (0.0%) | 0 (0.0%) |
| 5 or more Children | 0 (0.0%) | 0 (0.0%) |
| Total | 0 (0.0%) | 0 (0.0%) |
Race in Cornucopia
The most populous races in Cornucopia are White / Caucasian (93 | 90.3%), Two or more Races (10 | 9.7%), and Hispanic or Latino (6 | 5.8%).
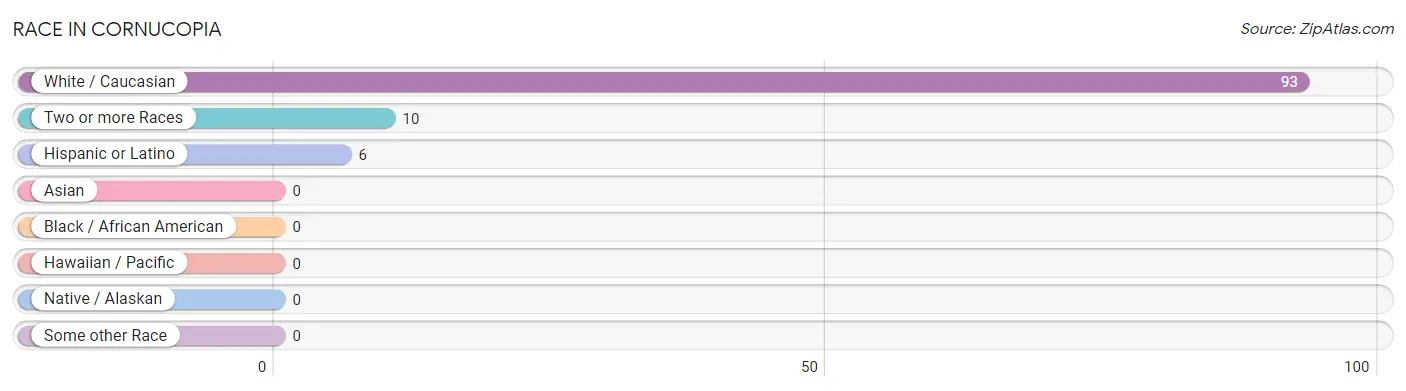
| Race | # Population | % Population |
| Asian | 0 | 0.0% |
| Black / African American | 0 | 0.0% |
| Hawaiian / Pacific | 0 | 0.0% |
| Hispanic or Latino | 6 | 5.8% |
| Native / Alaskan | 0 | 0.0% |
| White / Caucasian | 93 | 90.3% |
| Two or more Races | 10 | 9.7% |
| Some other Race | 0 | 0.0% |
| Total | 103 | 100.0% |
Ancestry in Cornucopia
The most populous ancestries reported in Cornucopia are German (30 | 29.1%), Polish (24 | 23.3%), Norwegian (19 | 18.4%), English (18 | 17.5%), and Irish (10 | 9.7%), together accounting for 98.1% of all Cornucopia residents.
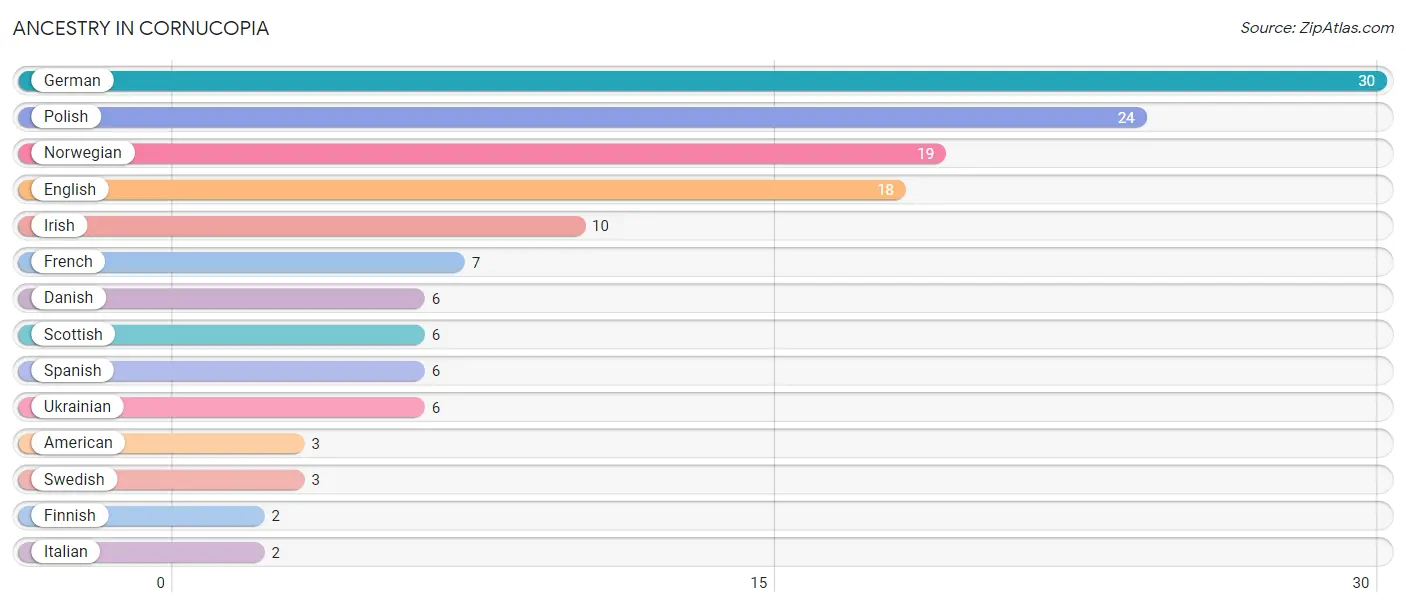
| Ancestry | # Population | % Population |
| American | 3 | 2.9% |
| Danish | 6 | 5.8% |
| English | 18 | 17.5% |
| Finnish | 2 | 1.9% |
| French | 7 | 6.8% |
| German | 30 | 29.1% |
| Irish | 10 | 9.7% |
| Italian | 2 | 1.9% |
| Norwegian | 19 | 18.4% |
| Polish | 24 | 23.3% |
| Scottish | 6 | 5.8% |
| Spanish | 6 | 5.8% |
| Swedish | 3 | 2.9% |
| Ukrainian | 6 | 5.8% | View All 14 Rows |
Immigrants in Cornucopia
The most numerous immigrant groups reported in Cornucopia came from Eastern Europe (6 | 5.8%), Europe (6 | 5.8%), and Poland (6 | 5.8%), together accounting for 17.5% of all Cornucopia residents.
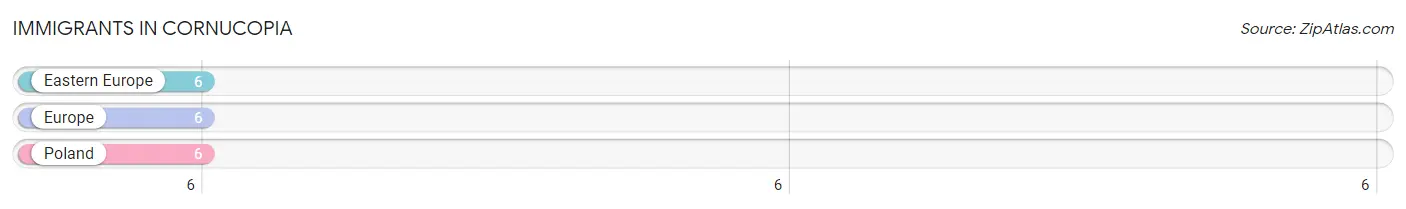
| Immigration Origin | # Population | % Population |
| Eastern Europe | 6 | 5.8% |
| Europe | 6 | 5.8% |
| Poland | 6 | 5.8% | View All 3 Rows |
Sex and Age in Cornucopia
Sex and Age in Cornucopia
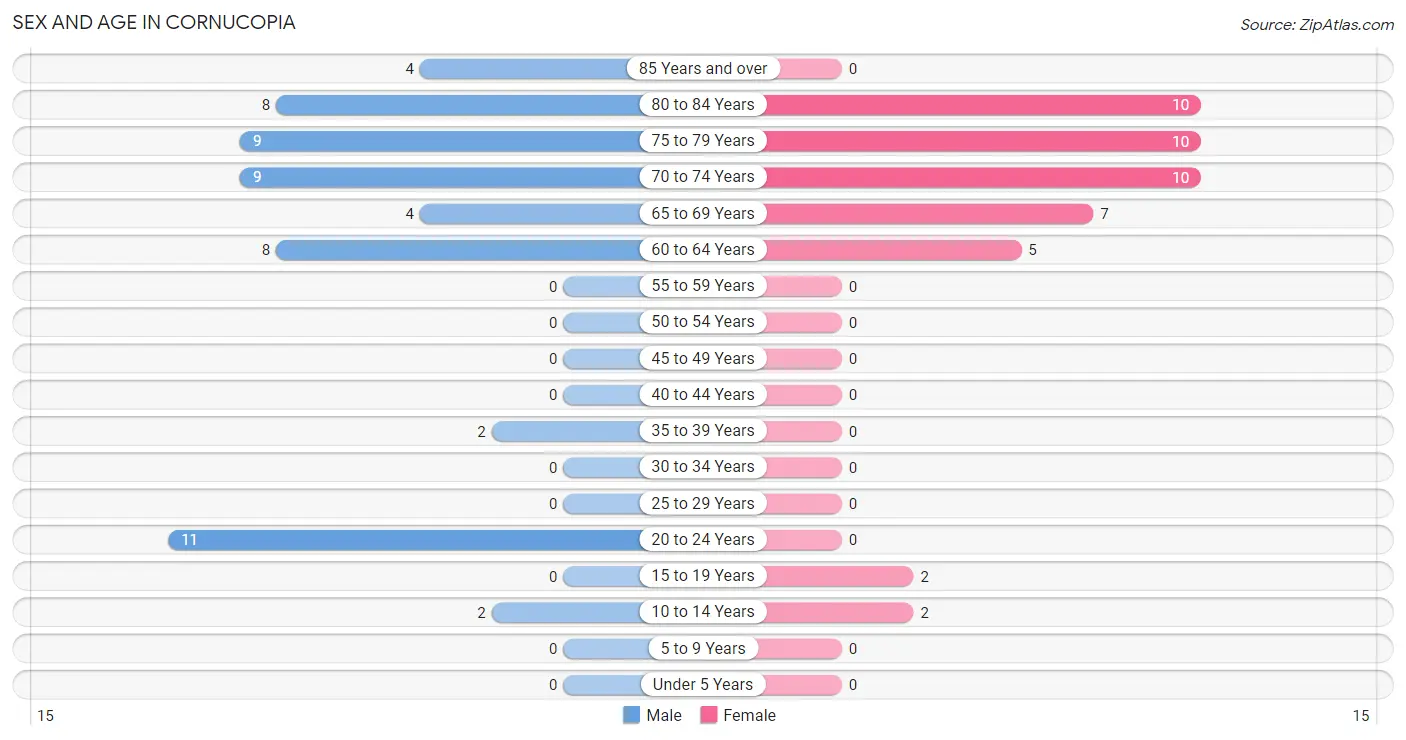
The most populous age groups in Cornucopia are 20 to 24 Years (11 | 19.3%) for men and 70 to 74 Years (10 | 21.7%) for women.
| Age Bracket | Male | Female |
| Under 5 Years | 0 (0.0%) | 0 (0.0%) |
| 5 to 9 Years | 0 (0.0%) | 0 (0.0%) |
| 10 to 14 Years | 2 (3.5%) | 2 (4.3%) |
| 15 to 19 Years | 0 (0.0%) | 2 (4.3%) |
| 20 to 24 Years | 11 (19.3%) | 0 (0.0%) |
| 25 to 29 Years | 0 (0.0%) | 0 (0.0%) |
| 30 to 34 Years | 0 (0.0%) | 0 (0.0%) |
| 35 to 39 Years | 2 (3.5%) | 0 (0.0%) |
| 40 to 44 Years | 0 (0.0%) | 0 (0.0%) |
| 45 to 49 Years | 0 (0.0%) | 0 (0.0%) |
| 50 to 54 Years | 0 (0.0%) | 0 (0.0%) |
| 55 to 59 Years | 0 (0.0%) | 0 (0.0%) |
| 60 to 64 Years | 8 (14.0%) | 5 (10.9%) |
| 65 to 69 Years | 4 (7.0%) | 7 (15.2%) |
| 70 to 74 Years | 9 (15.8%) | 10 (21.7%) |
| 75 to 79 Years | 9 (15.8%) | 10 (21.7%) |
| 80 to 84 Years | 8 (14.0%) | 10 (21.7%) |
| 85 Years and over | 4 (7.0%) | 0 (0.0%) |
| Total | 57 (100.0%) | 46 (100.0%) |
Families and Households in Cornucopia
Median Family Size in Cornucopia
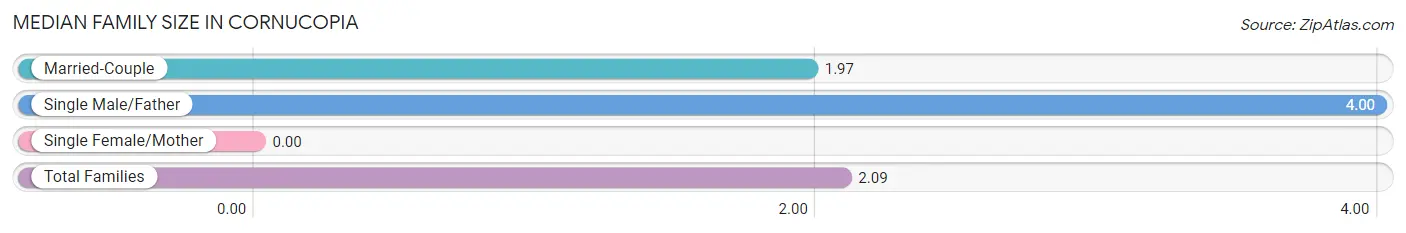
| Family Type | # Families | Family Size |
| Married-Couple | 33 (94.3%) | 1.97 |
| Single Male/Father | 2 (5.7%) | 4.00 |
| Single Female/Mother | 0 (0.0%) | - |
| Total Families | 35 (100.0%) | 2.09 |
Median Household Size in Cornucopia
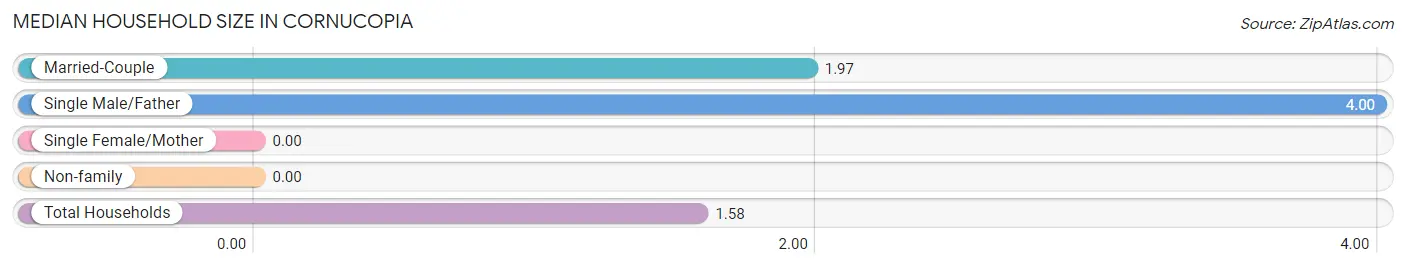
| Household Type | # Households | Household Size |
| Married-Couple | 33 (50.8%) | 1.97 |
| Single Male/Father | 2 (3.1%) | 4.00 |
| Single Female/Mother | 0 (0.0%) | - |
| Non-family | 30 (46.2%) | - |
| Total Households | 65 (100.0%) | 1.58 |
Household Size by Marriage Status in Cornucopia
Out of a total of 65 households in Cornucopia, 35 (53.8%) are family households, while 30 (46.2%) are nonfamily households. The most numerous type of family households are 2-person households, comprising 33, and the most common type of nonfamily households are 1-person households, comprising 30.
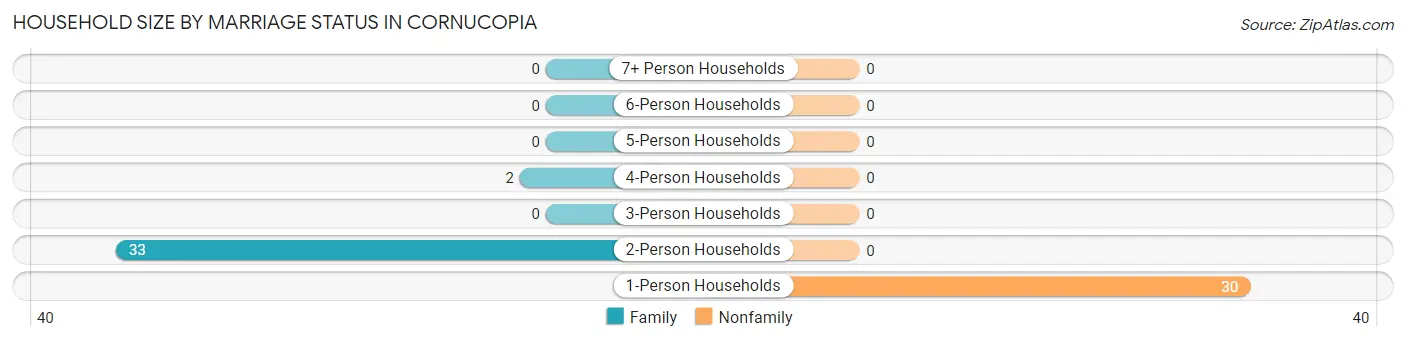
| Household Size | Family Households | Nonfamily Households |
| 1-Person Households | - | 30 (46.2%) |
| 2-Person Households | 33 (50.8%) | 0 (0.0%) |
| 3-Person Households | 0 (0.0%) | 0 (0.0%) |
| 4-Person Households | 2 (3.1%) | 0 (0.0%) |
| 5-Person Households | 0 (0.0%) | 0 (0.0%) |
| 6-Person Households | 0 (0.0%) | 0 (0.0%) |
| 7+ Person Households | 0 (0.0%) | 0 (0.0%) |
| Total | 35 (53.8%) | 30 (46.2%) |
Female Fertility in Cornucopia
Fertility by Age in Cornucopia
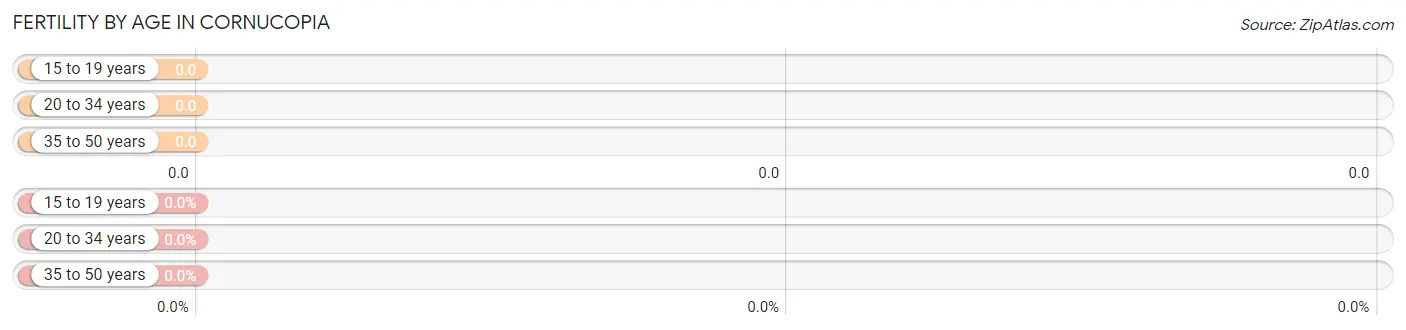
| Age Bracket | Women with Births | Births / 1,000 Women |
| 15 to 19 years | 0 (0.0%) | 0.0 |
| 20 to 34 years | 0 (0.0%) | 0.0 |
| 35 to 50 years | 0 (0.0%) | 0.0 |
| Total | 0 (0.0%) | 0.0 |
Fertility by Age by Marriage Status in Cornucopia
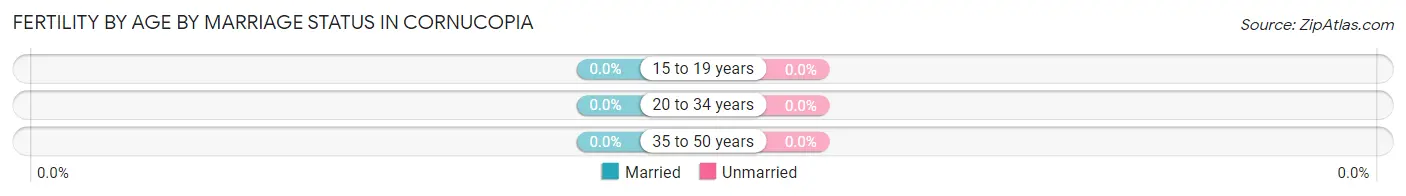
| Age Bracket | Married | Unmarried |
| 15 to 19 years | 0 (0.0%) | 0 (0.0%) |
| 20 to 34 years | 0 (0.0%) | 0 (0.0%) |
| 35 to 50 years | 0 (0.0%) | 0 (0.0%) |
| Total | 0 (0.0%) | 0 (0.0%) |
Fertility by Education in Cornucopia
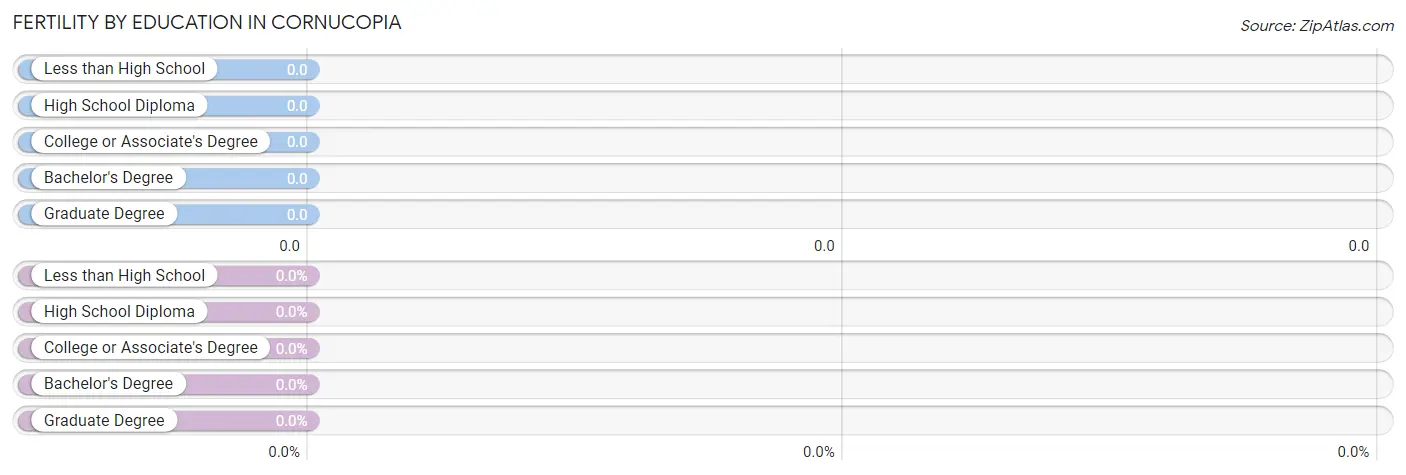
| Educational Attainment | Women with Births | Births / 1,000 Women |
| Less than High School | 0 (0.0%) | 0.0 |
| High School Diploma | 0 (0.0%) | 0.0 |
| College or Associate's Degree | 0 (0.0%) | 0.0 |
| Bachelor's Degree | 0 (0.0%) | 0.0 |
| Graduate Degree | 0 (0.0%) | 0.0 |
| Total | 0 (0.0%) | 0.0 |
Fertility by Education by Marriage Status in Cornucopia
| Educational Attainment | Married | Unmarried |
| Less than High School | 0 (0.0%) | 0 (0.0%) |
| High School Diploma | 0 (0.0%) | 0 (0.0%) |
| College or Associate's Degree | 0 (0.0%) | 0 (0.0%) |
| Bachelor's Degree | 0 (0.0%) | 0 (0.0%) |
| Graduate Degree | 0 (0.0%) | 0 (0.0%) |
| Total | 0 (0.0%) | 0 (0.0%) |
Employment Characteristics in Cornucopia
Employment by Class of Employer in Cornucopia
Among the 30 employed individuals in Cornucopia, state government employees (11 | 36.7%), private company employees (8 | 26.7%), and local government employees (7 | 23.3%) make up the most common classes of employment.
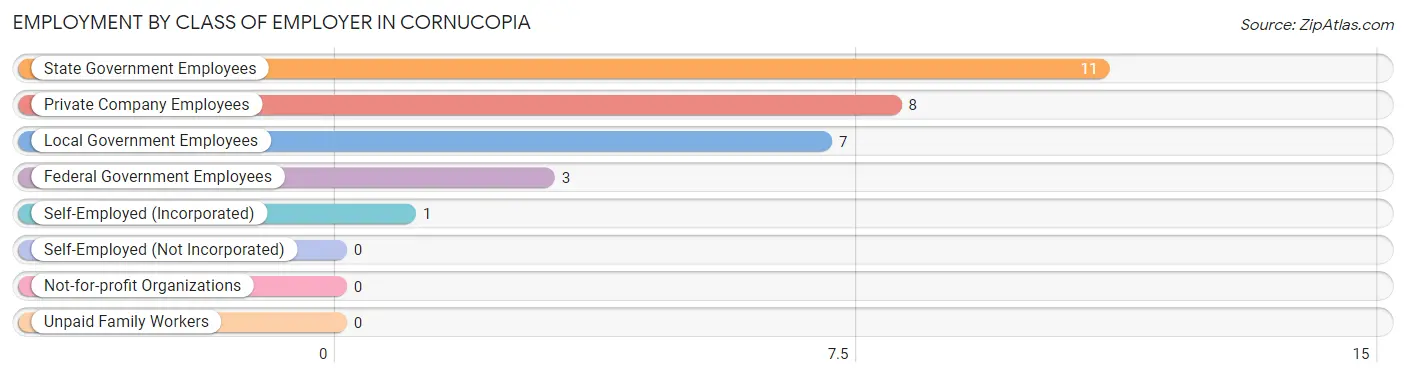
| Employer Class | # Employees | % Employees |
| Private Company Employees | 8 | 26.7% |
| Self-Employed (Incorporated) | 1 | 3.3% |
| Self-Employed (Not Incorporated) | 0 | 0.0% |
| Not-for-profit Organizations | 0 | 0.0% |
| Local Government Employees | 7 | 23.3% |
| State Government Employees | 11 | 36.7% |
| Federal Government Employees | 3 | 10.0% |
| Unpaid Family Workers | 0 | 0.0% |
| Total | 30 | 100.0% |
Employment Status by Age in Cornucopia
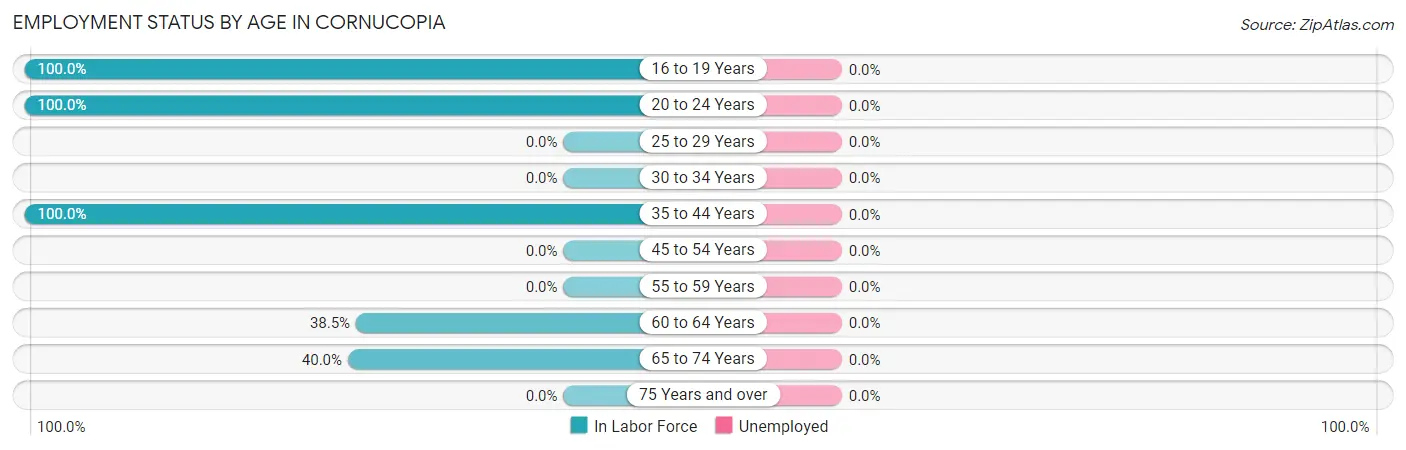
| Age Bracket | In Labor Force | Unemployed |
| 16 to 19 Years | 2 (100.0%) | 0 (0.0%) |
| 20 to 24 Years | 11 (100.0%) | 0 (0.0%) |
| 25 to 29 Years | 0 (0.0%) | 0 (0.0%) |
| 30 to 34 Years | 0 (0.0%) | 0 (0.0%) |
| 35 to 44 Years | 2 (100.0%) | 0 (0.0%) |
| 45 to 54 Years | 0 (0.0%) | 0 (0.0%) |
| 55 to 59 Years | 0 (0.0%) | 0 (0.0%) |
| 60 to 64 Years | 5 (38.5%) | 0 (0.0%) |
| 65 to 74 Years | 12 (40.0%) | 0 (0.0%) |
| 75 Years and over | 0 (0.0%) | 0 (0.0%) |
| Total | 32 (32.3%) | 0 (0.0%) |
Employment Status by Educational Attainment in Cornucopia
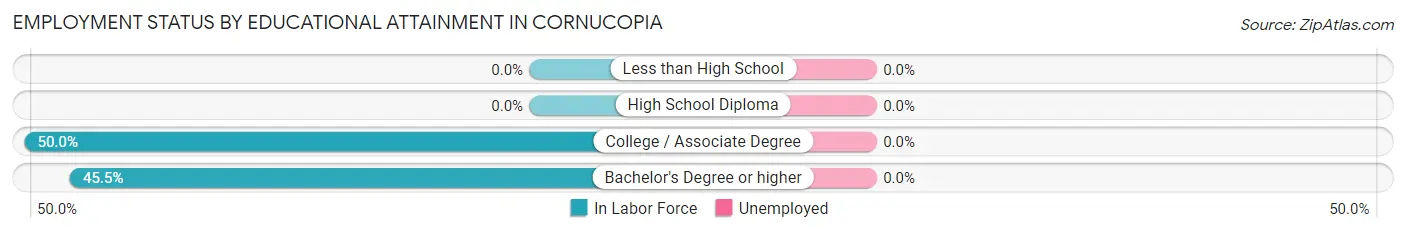
| Educational Attainment | In Labor Force | Unemployed |
| Less than High School | 0 (0.0%) | 0 (0.0%) |
| High School Diploma | 0 (0.0%) | 0 (0.0%) |
| College / Associate Degree | 2 (50.0%) | 0 (0.0%) |
| Bachelor's Degree or higher | 5 (45.5%) | 0 (0.0%) |
| Total | 7 (46.7%) | 0 (0.0%) |
Employment Occupations by Sex in Cornucopia
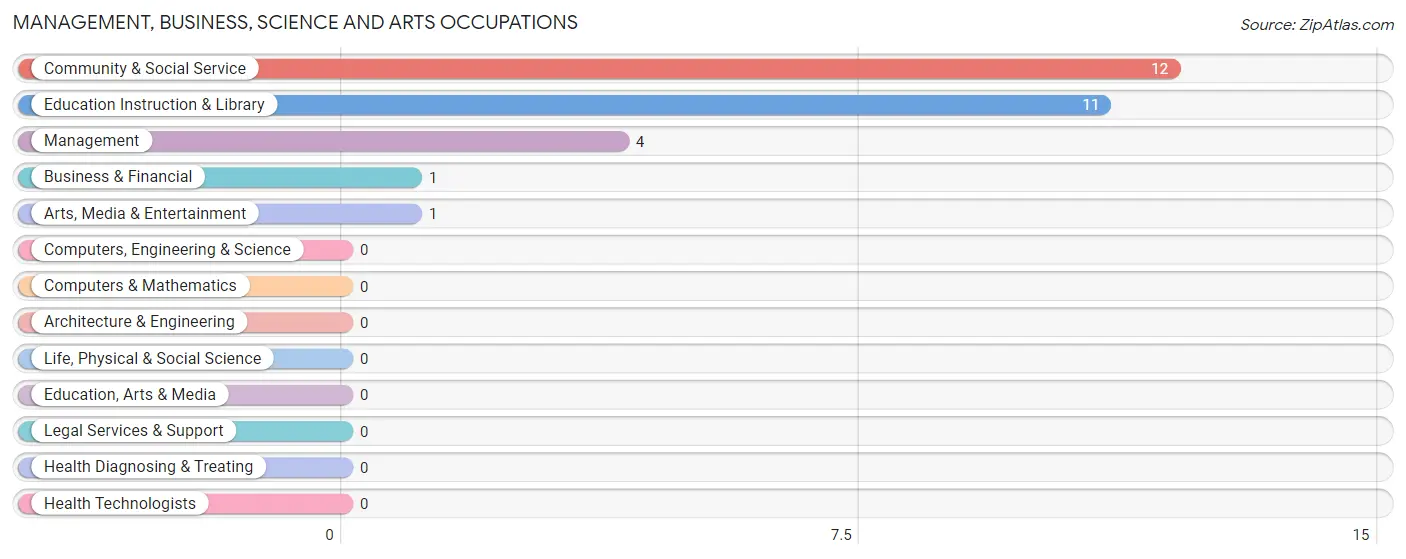
Management, Business, Science and Arts Occupations
The most common Management, Business, Science and Arts occupations in Cornucopia are Community & Social Service (12 | 37.5%), Education Instruction & Library (11 | 34.4%), Management (4 | 12.5%), Business & Financial (1 | 3.1%), and Arts, Media & Entertainment (1 | 3.1%).
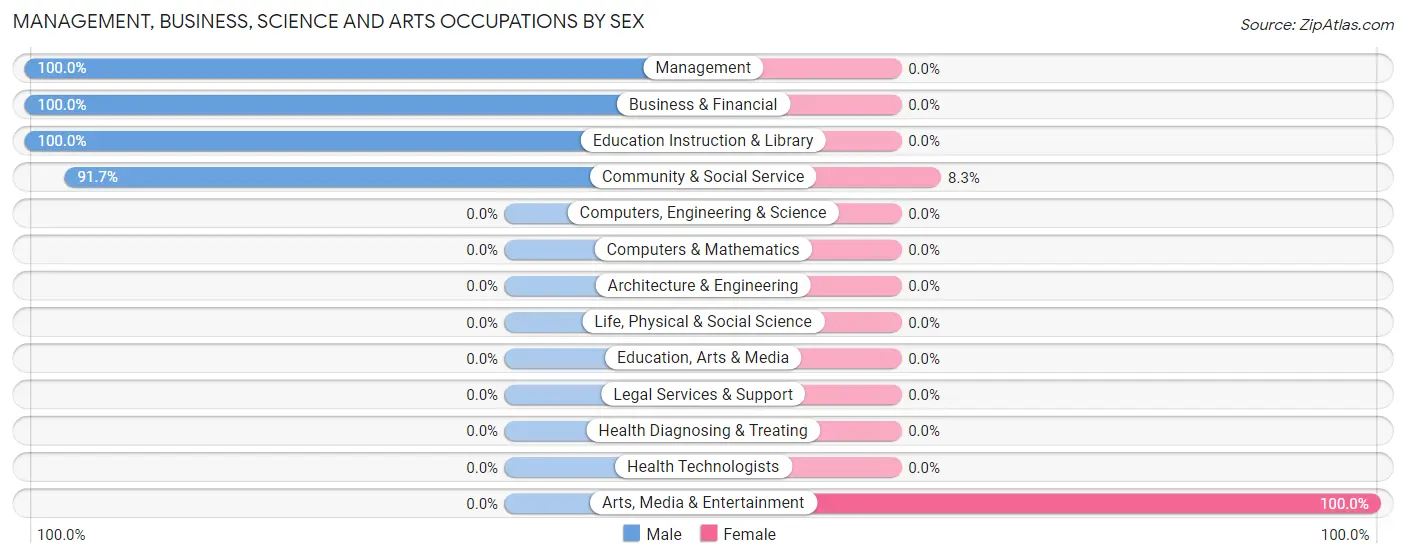
Management, Business, Science and Arts Occupations by Sex
Within the Management, Business, Science and Arts occupations in Cornucopia, the most male-oriented occupations are Management (100.0%), Business & Financial (100.0%), and Education Instruction & Library (100.0%), while the most female-oriented occupations are Arts, Media & Entertainment (100.0%), and Community & Social Service (8.3%).
| Occupation | Male | Female |
| Management | 4 (100.0%) | 0 (0.0%) |
| Business & Financial | 1 (100.0%) | 0 (0.0%) |
| Computers, Engineering & Science | 0 (0.0%) | 0 (0.0%) |
| Computers & Mathematics | 0 (0.0%) | 0 (0.0%) |
| Architecture & Engineering | 0 (0.0%) | 0 (0.0%) |
| Life, Physical & Social Science | 0 (0.0%) | 0 (0.0%) |
| Community & Social Service | 11 (91.7%) | 1 (8.3%) |
| Education, Arts & Media | 0 (0.0%) | 0 (0.0%) |
| Legal Services & Support | 0 (0.0%) | 0 (0.0%) |
| Education Instruction & Library | 11 (100.0%) | 0 (0.0%) |
| Arts, Media & Entertainment | 0 (0.0%) | 1 (100.0%) |
| Health Diagnosing & Treating | 0 (0.0%) | 0 (0.0%) |
| Health Technologists | 0 (0.0%) | 0 (0.0%) |
| Total (Category) | 16 (94.1%) | 1 (5.9%) |
| Total (Overall) | 21 (65.6%) | 11 (34.4%) |
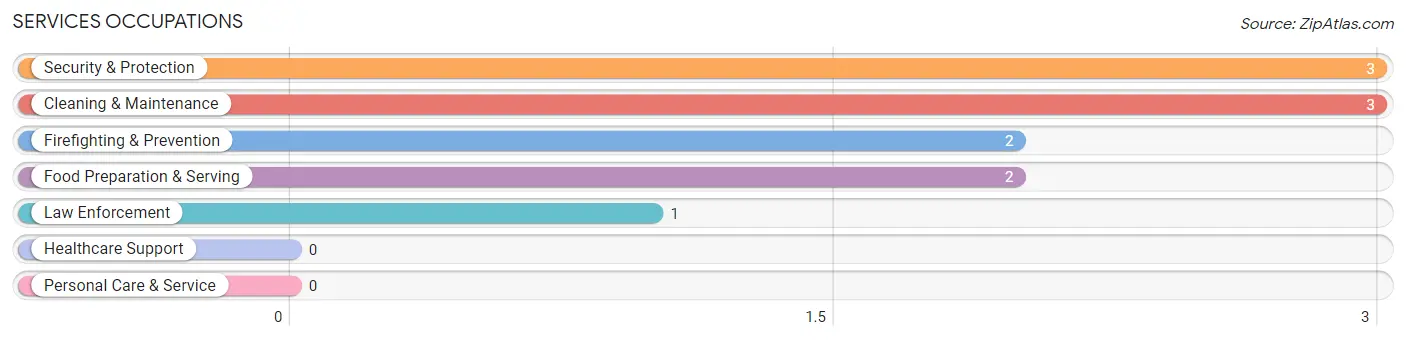
Services Occupations
The most common Services occupations in Cornucopia are Security & Protection (3 | 9.4%), Cleaning & Maintenance (3 | 9.4%), Firefighting & Prevention (2 | 6.2%), Food Preparation & Serving (2 | 6.2%), and Law Enforcement (1 | 3.1%).
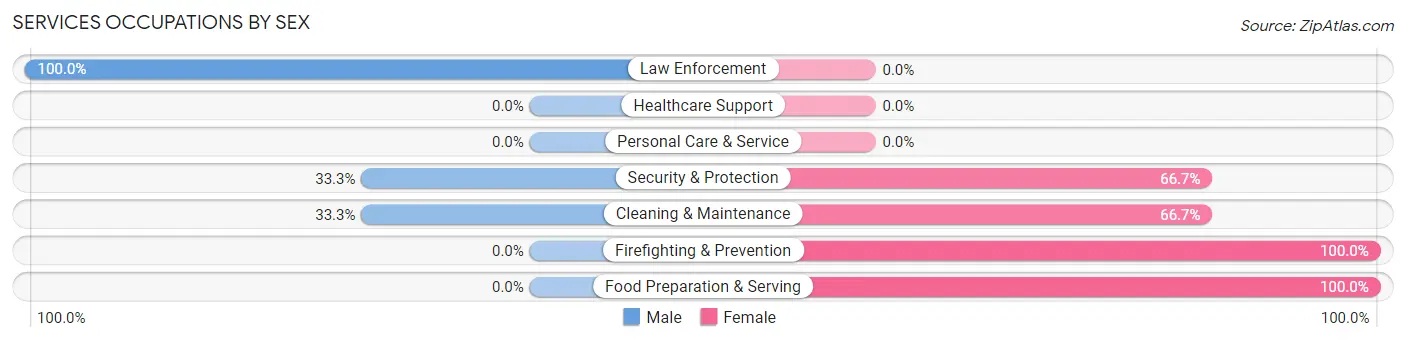
Services Occupations by Sex
Within the Services occupations in Cornucopia, the most male-oriented occupations are Law Enforcement (100.0%), Security & Protection (33.3%), and Cleaning & Maintenance (33.3%), while the most female-oriented occupations are Firefighting & Prevention (100.0%), Food Preparation & Serving (100.0%), and Security & Protection (66.7%).
| Occupation | Male | Female |
| Healthcare Support | 0 (0.0%) | 0 (0.0%) |
| Security & Protection | 1 (33.3%) | 2 (66.7%) |
| Firefighting & Prevention | 0 (0.0%) | 2 (100.0%) |
| Law Enforcement | 1 (100.0%) | 0 (0.0%) |
| Food Preparation & Serving | 0 (0.0%) | 2 (100.0%) |
| Cleaning & Maintenance | 1 (33.3%) | 2 (66.7%) |
| Personal Care & Service | 0 (0.0%) | 0 (0.0%) |
| Total (Category) | 2 (25.0%) | 6 (75.0%) |
| Total (Overall) | 21 (65.6%) | 11 (34.4%) |
Sales and Office Occupations
The most common Sales and Office occupations in Cornucopia are Sales & Related (4 | 12.5%), and Office & Administration (2 | 6.2%).
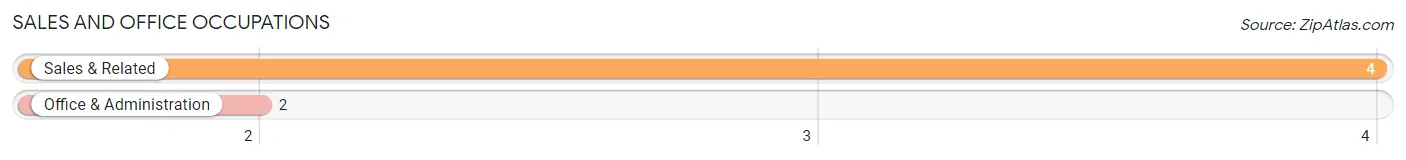
Sales and Office Occupations by Sex

| Occupation | Male | Female |
| Sales & Related | 0 (0.0%) | 4 (100.0%) |
| Office & Administration | 2 (100.0%) | 0 (0.0%) |
| Total (Category) | 2 (33.3%) | 4 (66.7%) |
| Total (Overall) | 21 (65.6%) | 11 (34.4%) |
Natural Resources, Construction and Maintenance Occupations
The most common Natural Resources, Construction and Maintenance occupations in Cornucopia are , and Construction & Extraction (1 | 3.1%).
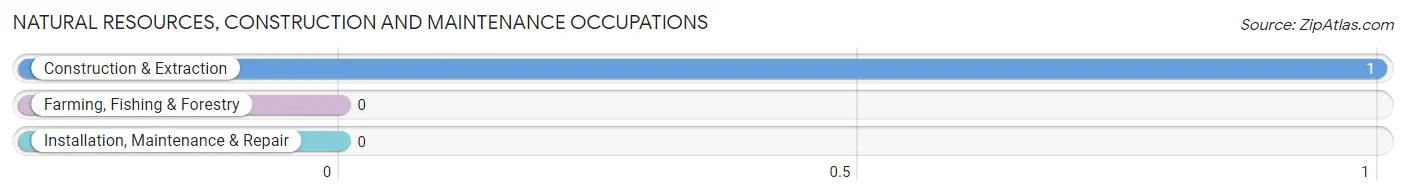
Natural Resources, Construction and Maintenance Occupations by Sex
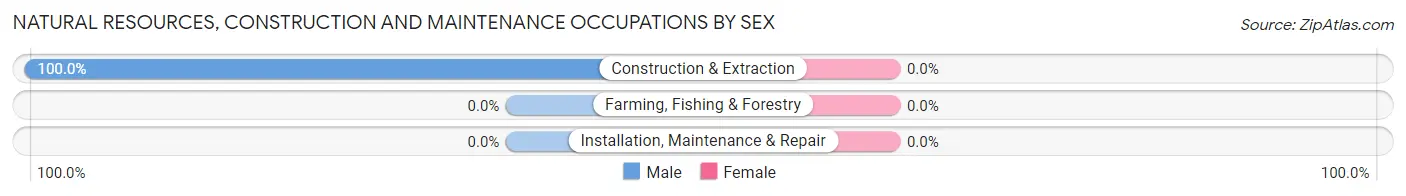
| Occupation | Male | Female |
| Farming, Fishing & Forestry | 0 (0.0%) | 0 (0.0%) |
| Construction & Extraction | 1 (100.0%) | 0 (0.0%) |
| Installation, Maintenance & Repair | 0 (0.0%) | 0 (0.0%) |
| Total (Category) | 1 (100.0%) | 0 (0.0%) |
| Total (Overall) | 21 (65.6%) | 11 (34.4%) |
Production, Transportation and Moving Occupations
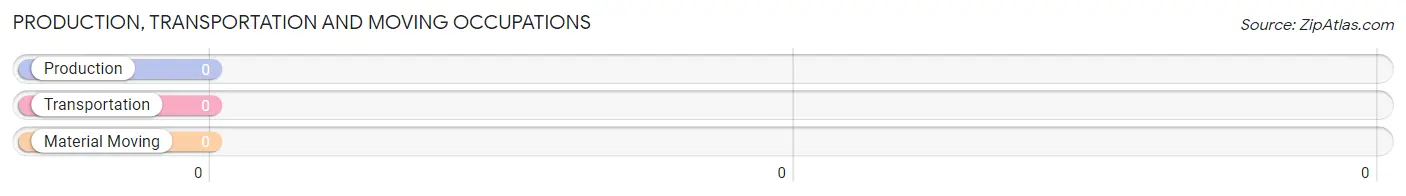
Production, Transportation and Moving Occupations by Sex
| Occupation | Male | Female |
| Production | 0 (0.0%) | 0 (0.0%) |
| Transportation | 0 (0.0%) | 0 (0.0%) |
| Material Moving | 0 (0.0%) | 0 (0.0%) |
| Total (Category) | 0 (0.0%) | 0 (0.0%) |
| Total (Overall) | 21 (65.6%) | 11 (34.4%) |
Employment Industries by Sex in Cornucopia
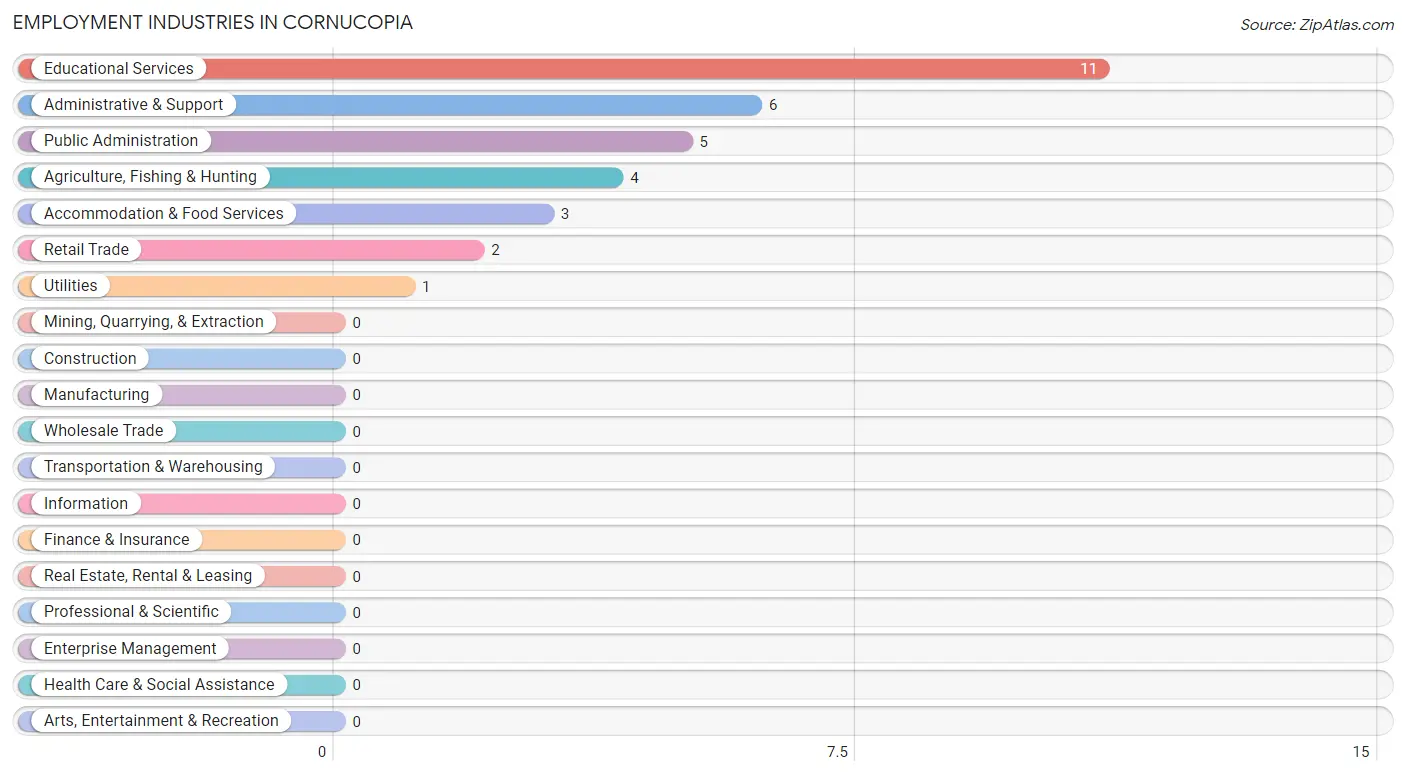
Employment Industries in Cornucopia
The major employment industries in Cornucopia include Educational Services (11 | 34.4%), Administrative & Support (6 | 18.8%), Public Administration (5 | 15.6%), Agriculture, Fishing & Hunting (4 | 12.5%), and Accommodation & Food Services (3 | 9.4%).
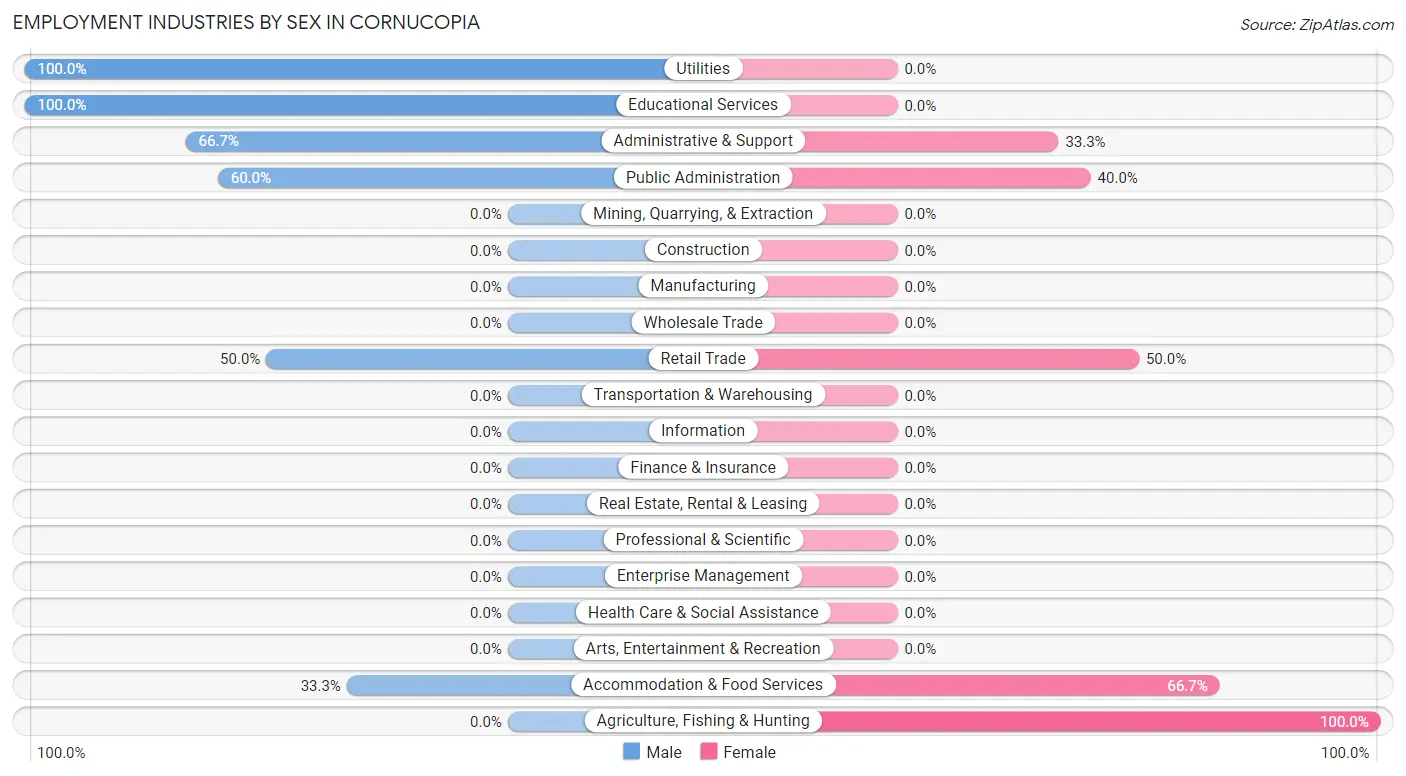
Employment Industries by Sex in Cornucopia
The Cornucopia industries that see more men than women are Utilities (100.0%), Educational Services (100.0%), and Administrative & Support (66.7%), whereas the industries that tend to have a higher number of women are Agriculture, Fishing & Hunting (100.0%), Accommodation & Food Services (66.7%), and Retail Trade (50.0%).
| Industry | Male | Female |
| Agriculture, Fishing & Hunting | 0 (0.0%) | 4 (100.0%) |
| Mining, Quarrying, & Extraction | 0 (0.0%) | 0 (0.0%) |
| Construction | 0 (0.0%) | 0 (0.0%) |
| Manufacturing | 0 (0.0%) | 0 (0.0%) |
| Wholesale Trade | 0 (0.0%) | 0 (0.0%) |
| Retail Trade | 1 (50.0%) | 1 (50.0%) |
| Transportation & Warehousing | 0 (0.0%) | 0 (0.0%) |
| Utilities | 1 (100.0%) | 0 (0.0%) |
| Information | 0 (0.0%) | 0 (0.0%) |
| Finance & Insurance | 0 (0.0%) | 0 (0.0%) |
| Real Estate, Rental & Leasing | 0 (0.0%) | 0 (0.0%) |
| Professional & Scientific | 0 (0.0%) | 0 (0.0%) |
| Enterprise Management | 0 (0.0%) | 0 (0.0%) |
| Administrative & Support | 4 (66.7%) | 2 (33.3%) |
| Educational Services | 11 (100.0%) | 0 (0.0%) |
| Health Care & Social Assistance | 0 (0.0%) | 0 (0.0%) |
| Arts, Entertainment & Recreation | 0 (0.0%) | 0 (0.0%) |
| Accommodation & Food Services | 1 (33.3%) | 2 (66.7%) |
| Public Administration | 3 (60.0%) | 2 (40.0%) |
| Total | 21 (65.6%) | 11 (34.4%) |
Education in Cornucopia
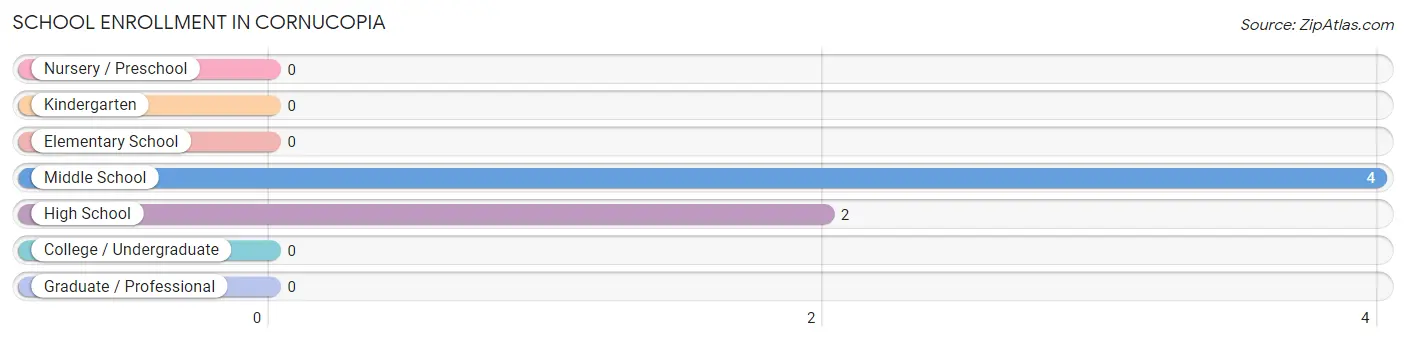
School Enrollment in Cornucopia
The most common levels of schooling among the 6 students in Cornucopia are middle school (4 | 66.7%), and high school (2 | 33.3%).
| School Level | # Students | % Students |
| Nursery / Preschool | 0 | 0.0% |
| Kindergarten | 0 | 0.0% |
| Elementary School | 0 | 0.0% |
| Middle School | 4 | 66.7% |
| High School | 2 | 33.3% |
| College / Undergraduate | 0 | 0.0% |
| Graduate / Professional | 0 | 0.0% |
| Total | 6 | 100.0% |
School Enrollment by Age by Funding Source in Cornucopia
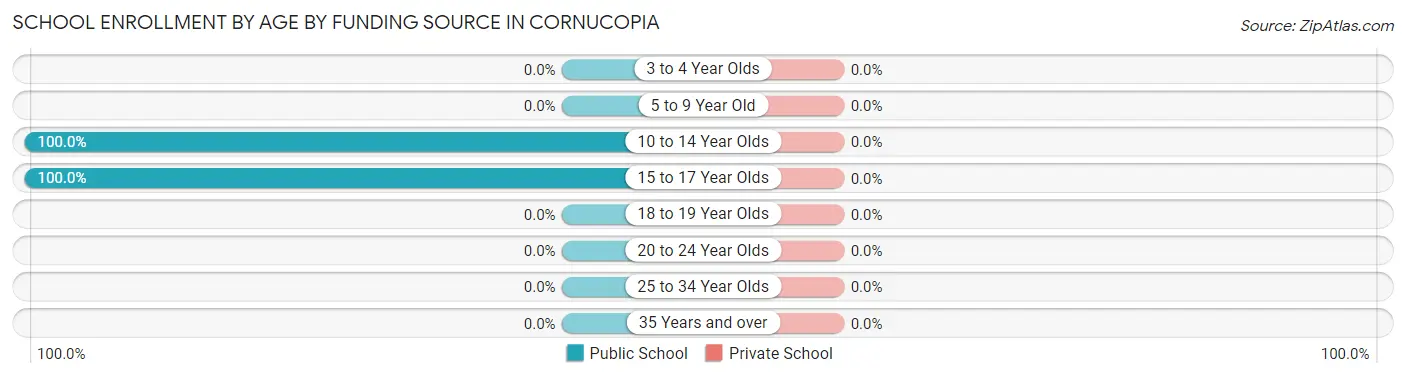
| Age Bracket | Public School | Private School |
| 3 to 4 Year Olds | 0 (0.0%) | 0 (0.0%) |
| 5 to 9 Year Old | 0 (0.0%) | 0 (0.0%) |
| 10 to 14 Year Olds | 4 (100.0%) | 0 (0.0%) |
| 15 to 17 Year Olds | 2 (100.0%) | 0 (0.0%) |
| 18 to 19 Year Olds | 0 (0.0%) | 0 (0.0%) |
| 20 to 24 Year Olds | 0 (0.0%) | 0 (0.0%) |
| 25 to 34 Year Olds | 0 (0.0%) | 0 (0.0%) |
| 35 Years and over | 0 (0.0%) | 0 (0.0%) |
| Total | 6 (100.0%) | 0 (0.0%) |
Educational Attainment by Field of Study in Cornucopia
Education (18 | 34.6%), business (12 | 23.1%), literature & languages (6 | 11.5%), social sciences (5 | 9.6%), and bio, nature & agricultural (4 | 7.7%) are the most common fields of study among 52 individuals in Cornucopia who have obtained a bachelor's degree or higher.
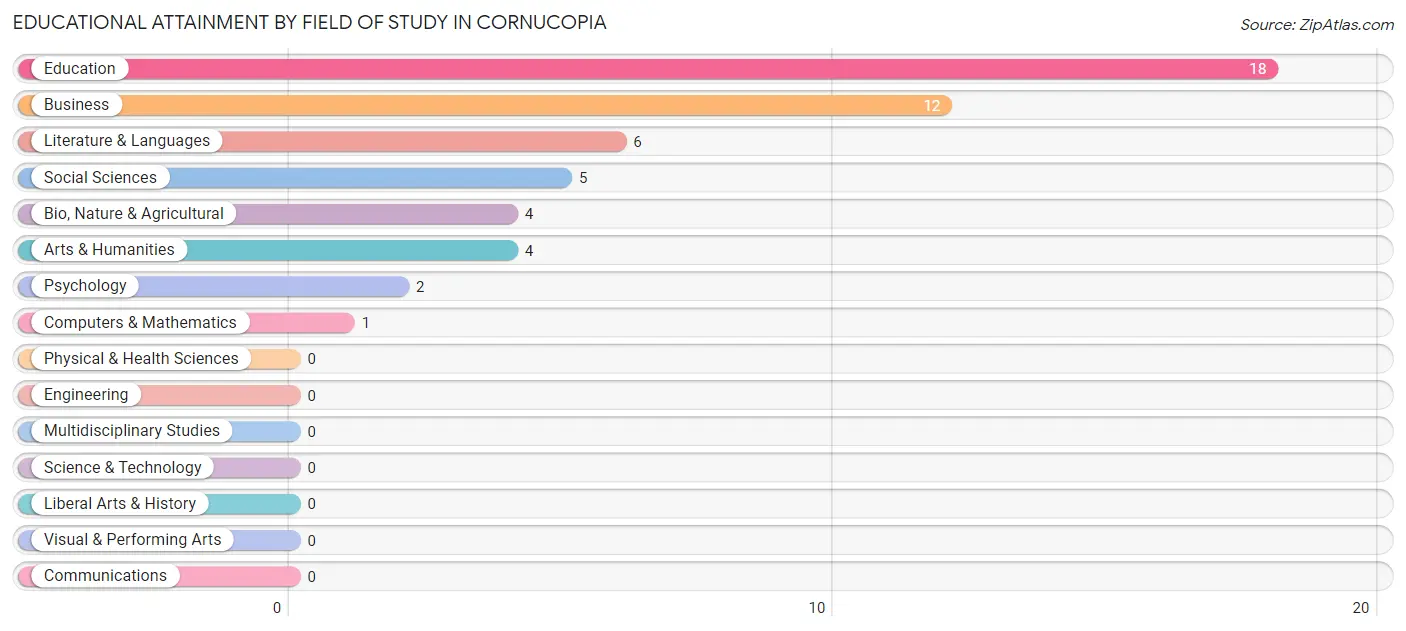
| Field of Study | # Graduates | % Graduates |
| Computers & Mathematics | 1 | 1.9% |
| Bio, Nature & Agricultural | 4 | 7.7% |
| Physical & Health Sciences | 0 | 0.0% |
| Psychology | 2 | 3.8% |
| Social Sciences | 5 | 9.6% |
| Engineering | 0 | 0.0% |
| Multidisciplinary Studies | 0 | 0.0% |
| Science & Technology | 0 | 0.0% |
| Business | 12 | 23.1% |
| Education | 18 | 34.6% |
| Literature & Languages | 6 | 11.5% |
| Liberal Arts & History | 0 | 0.0% |
| Visual & Performing Arts | 0 | 0.0% |
| Communications | 0 | 0.0% |
| Arts & Humanities | 4 | 7.7% |
| Total | 52 | 100.0% |
Transportation & Commute in Cornucopia
Vehicle Availability by Sex in Cornucopia
The most prevalent vehicle ownership categories in Cornucopia are males with 1 vehicle (11, accounting for 52.4%) and females with 1 vehicle (0, making up 122.2%).
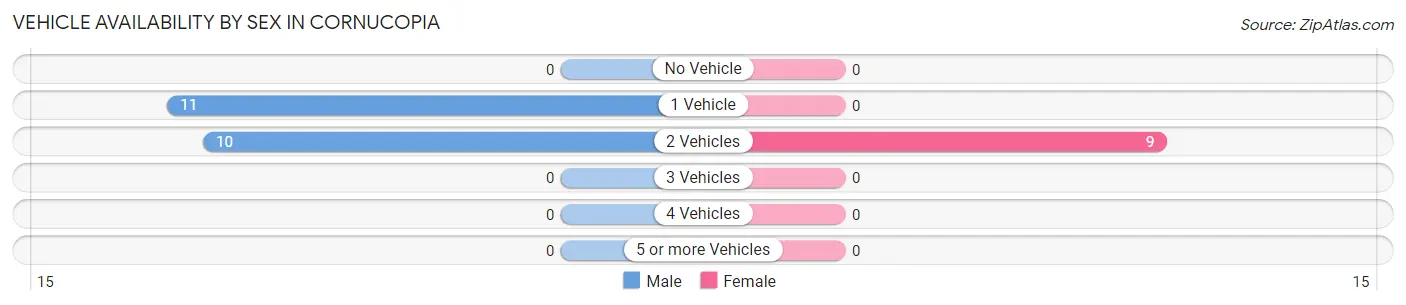
| Vehicles Available | Male | Female |
| No Vehicle | 0 (0.0%) | 0 (0.0%) |
| 1 Vehicle | 11 (52.4%) | 0 (0.0%) |
| 2 Vehicles | 10 (47.6%) | 9 (100.0%) |
| 3 Vehicles | 0 (0.0%) | 0 (0.0%) |
| 4 Vehicles | 0 (0.0%) | 0 (0.0%) |
| 5 or more Vehicles | 0 (0.0%) | 0 (0.0%) |
| Total | 21 (100.0%) | 9 (100.0%) |
Commute Time in Cornucopia
The most frequently occuring commute durations in Cornucopia are 20 to 24 minutes (14 commuters, 48.3%), less than 5 minutes (5 commuters, 17.2%), and 60 to 89 minutes (4 commuters, 13.8%).
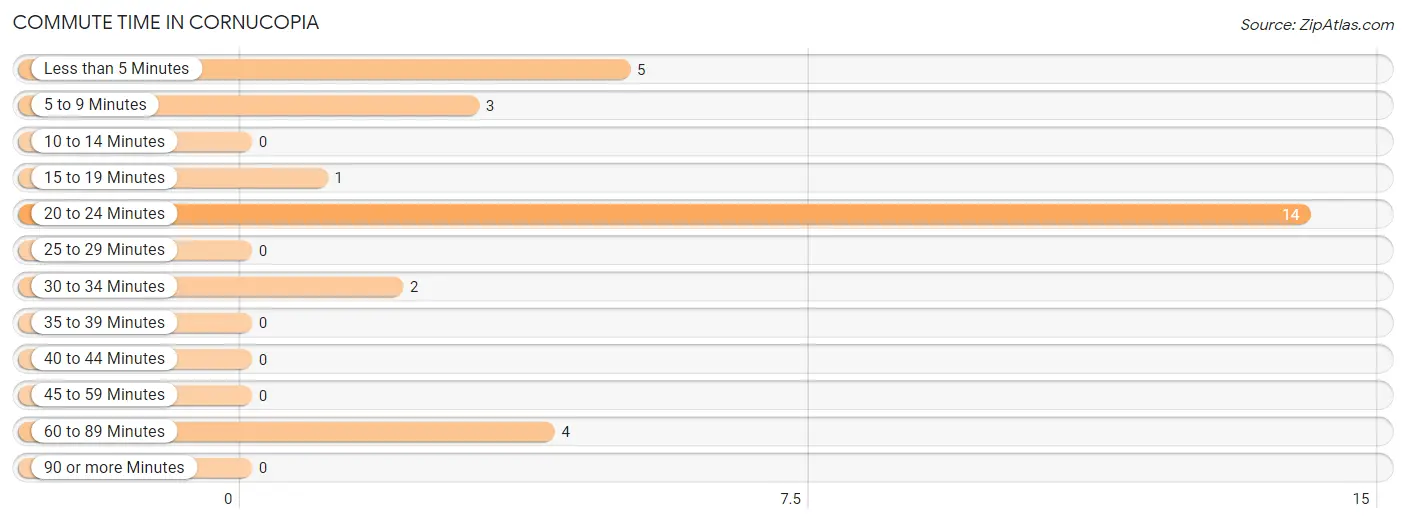
| Commute Time | # Commuters | % Commuters |
| Less than 5 Minutes | 5 | 17.2% |
| 5 to 9 Minutes | 3 | 10.3% |
| 10 to 14 Minutes | 0 | 0.0% |
| 15 to 19 Minutes | 1 | 3.5% |
| 20 to 24 Minutes | 14 | 48.3% |
| 25 to 29 Minutes | 0 | 0.0% |
| 30 to 34 Minutes | 2 | 6.9% |
| 35 to 39 Minutes | 0 | 0.0% |
| 40 to 44 Minutes | 0 | 0.0% |
| 45 to 59 Minutes | 0 | 0.0% |
| 60 to 89 Minutes | 4 | 13.8% |
| 90 or more Minutes | 0 | 0.0% |
Commute Time by Sex in Cornucopia
The most common commute times in Cornucopia are 20 to 24 minutes (12 commuters, 60.0%) for males and 60 to 89 minutes (4 commuters, 44.4%) for females.
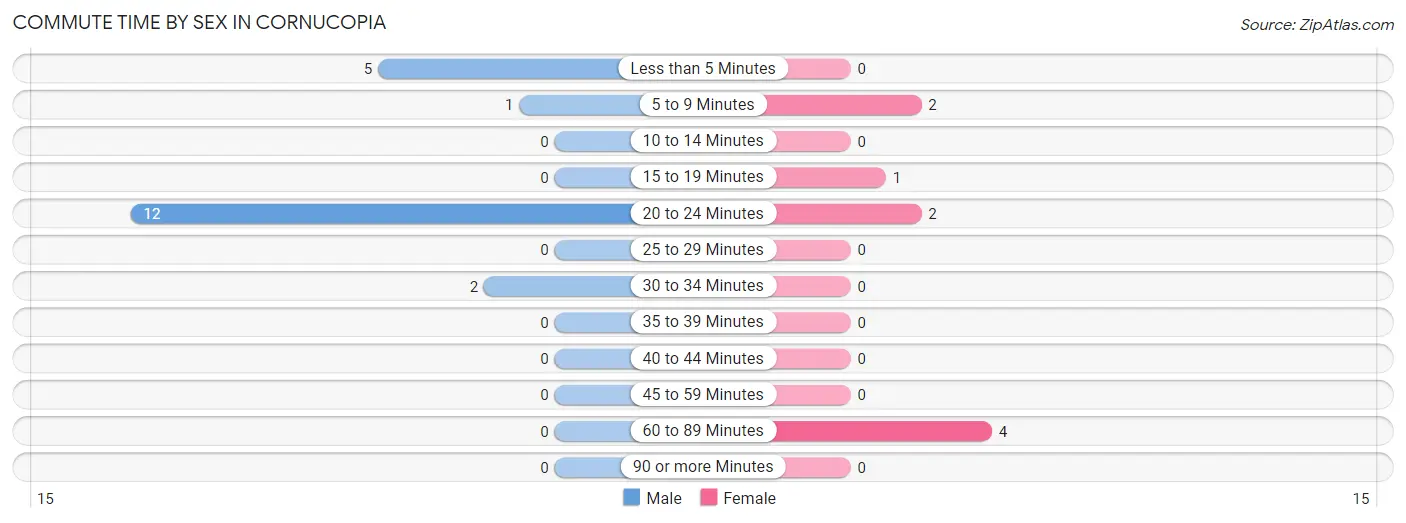
| Commute Time | Male | Female |
| Less than 5 Minutes | 5 (25.0%) | 0 (0.0%) |
| 5 to 9 Minutes | 1 (5.0%) | 2 (22.2%) |
| 10 to 14 Minutes | 0 (0.0%) | 0 (0.0%) |
| 15 to 19 Minutes | 0 (0.0%) | 1 (11.1%) |
| 20 to 24 Minutes | 12 (60.0%) | 2 (22.2%) |
| 25 to 29 Minutes | 0 (0.0%) | 0 (0.0%) |
| 30 to 34 Minutes | 2 (10.0%) | 0 (0.0%) |
| 35 to 39 Minutes | 0 (0.0%) | 0 (0.0%) |
| 40 to 44 Minutes | 0 (0.0%) | 0 (0.0%) |
| 45 to 59 Minutes | 0 (0.0%) | 0 (0.0%) |
| 60 to 89 Minutes | 0 (0.0%) | 4 (44.4%) |
| 90 or more Minutes | 0 (0.0%) | 0 (0.0%) |
Time of Departure to Work by Sex in Cornucopia
The most frequent times of departure to work in Cornucopia are 8:30 AM to 8:59 AM (11, 55.0%) for males and 10:00 AM to 10:59 AM (4, 44.4%) for females.
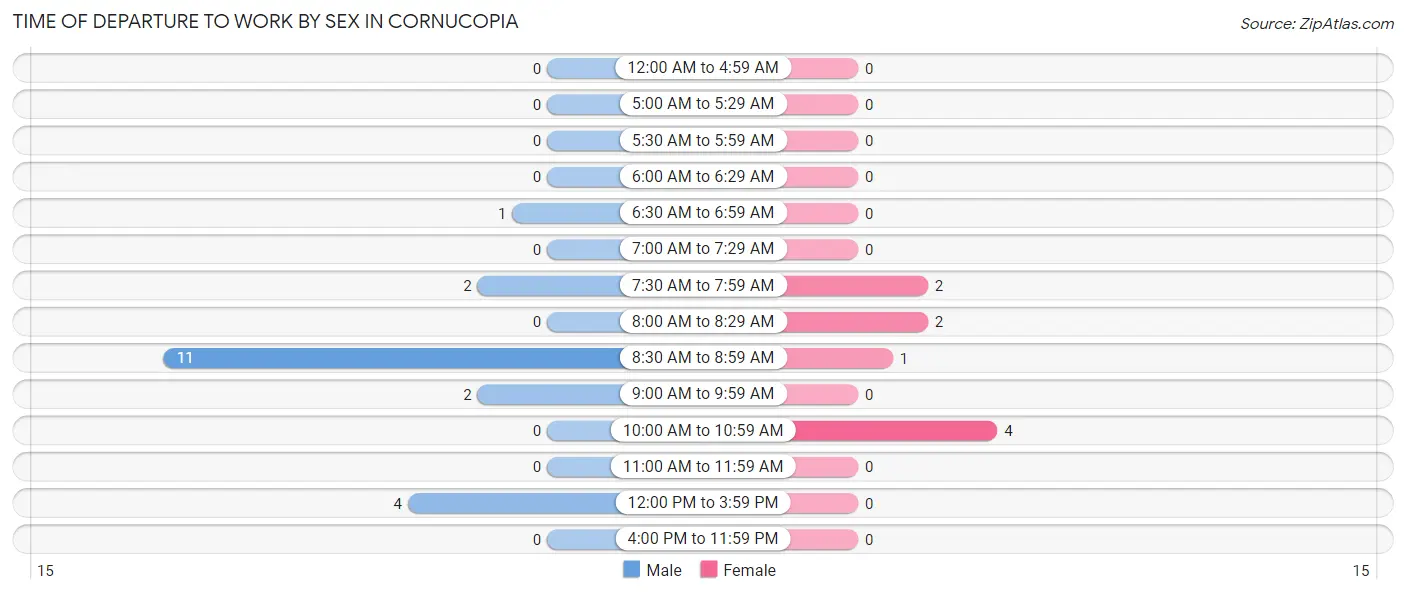
| Time of Departure | Male | Female |
| 12:00 AM to 4:59 AM | 0 (0.0%) | 0 (0.0%) |
| 5:00 AM to 5:29 AM | 0 (0.0%) | 0 (0.0%) |
| 5:30 AM to 5:59 AM | 0 (0.0%) | 0 (0.0%) |
| 6:00 AM to 6:29 AM | 0 (0.0%) | 0 (0.0%) |
| 6:30 AM to 6:59 AM | 1 (5.0%) | 0 (0.0%) |
| 7:00 AM to 7:29 AM | 0 (0.0%) | 0 (0.0%) |
| 7:30 AM to 7:59 AM | 2 (10.0%) | 2 (22.2%) |
| 8:00 AM to 8:29 AM | 0 (0.0%) | 2 (22.2%) |
| 8:30 AM to 8:59 AM | 11 (55.0%) | 1 (11.1%) |
| 9:00 AM to 9:59 AM | 2 (10.0%) | 0 (0.0%) |
| 10:00 AM to 10:59 AM | 0 (0.0%) | 4 (44.4%) |
| 11:00 AM to 11:59 AM | 0 (0.0%) | 0 (0.0%) |
| 12:00 PM to 3:59 PM | 4 (20.0%) | 0 (0.0%) |
| 4:00 PM to 11:59 PM | 0 (0.0%) | 0 (0.0%) |
| Total | 20 (100.0%) | 9 (100.0%) |
Housing Occupancy in Cornucopia
Occupancy by Ownership in Cornucopia
Of the total 65 dwellings in Cornucopia, owner-occupied units account for 65 (100.0%), while renter-occupied units make up 0 (0.0%).
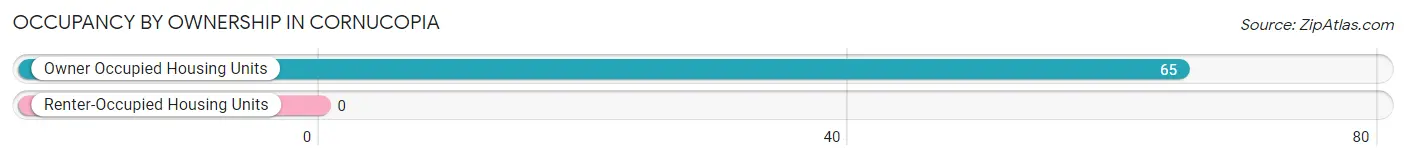
| Occupancy | # Housing Units | % Housing Units |
| Owner Occupied Housing Units | 65 | 100.0% |
| Renter-Occupied Housing Units | 0 | 0.0% |
| Total Occupied Housing Units | 65 | 100.0% |
Occupancy by Household Size in Cornucopia
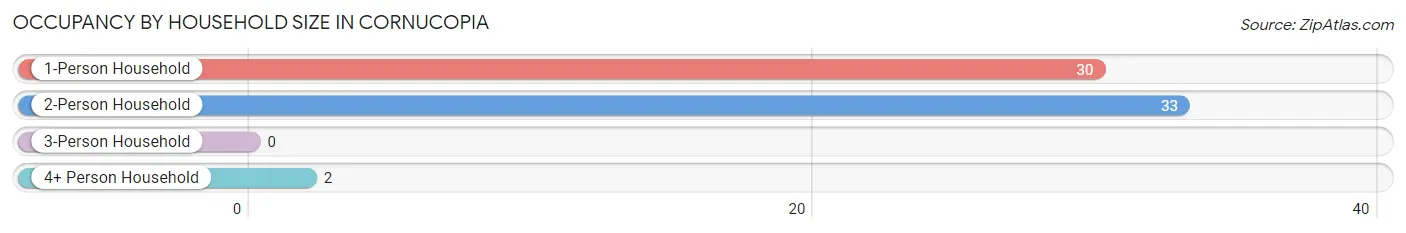
| Household Size | # Housing Units | % Housing Units |
| 1-Person Household | 30 | 46.2% |
| 2-Person Household | 33 | 50.8% |
| 3-Person Household | 0 | 0.0% |
| 4+ Person Household | 2 | 3.1% |
| Total Housing Units | 65 | 100.0% |
Occupancy by Ownership by Household Size in Cornucopia
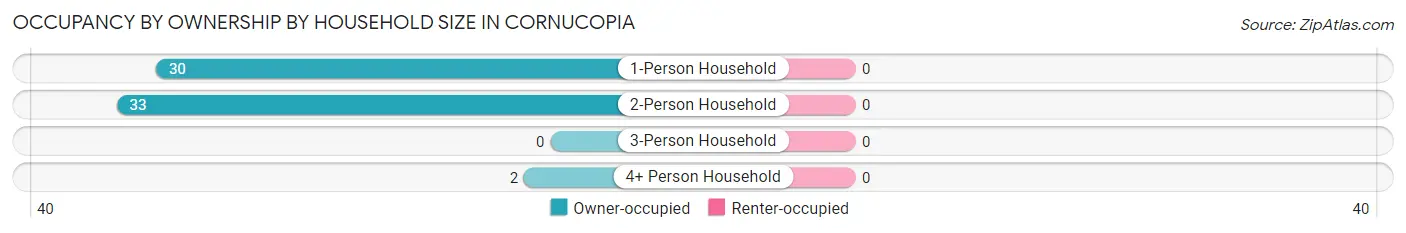
| Household Size | Owner-occupied | Renter-occupied |
| 1-Person Household | 30 (100.0%) | 0 (0.0%) |
| 2-Person Household | 33 (100.0%) | 0 (0.0%) |
| 3-Person Household | 0 (0.0%) | 0 (0.0%) |
| 4+ Person Household | 2 (100.0%) | 0 (0.0%) |
| Total Housing Units | 65 (100.0%) | 0 (0.0%) |
Occupancy by Educational Attainment in Cornucopia
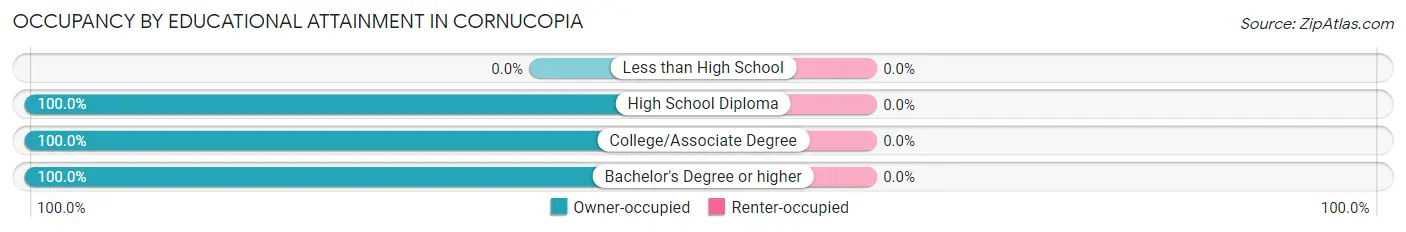
| Household Size | Owner-occupied | Renter-occupied |
| Less than High School | 0 (0.0%) | 0 (0.0%) |
| High School Diploma | 7 (100.0%) | 0 (0.0%) |
| College/Associate Degree | 19 (100.0%) | 0 (0.0%) |
| Bachelor's Degree or higher | 39 (100.0%) | 0 (0.0%) |
Occupancy by Age of Householder in Cornucopia
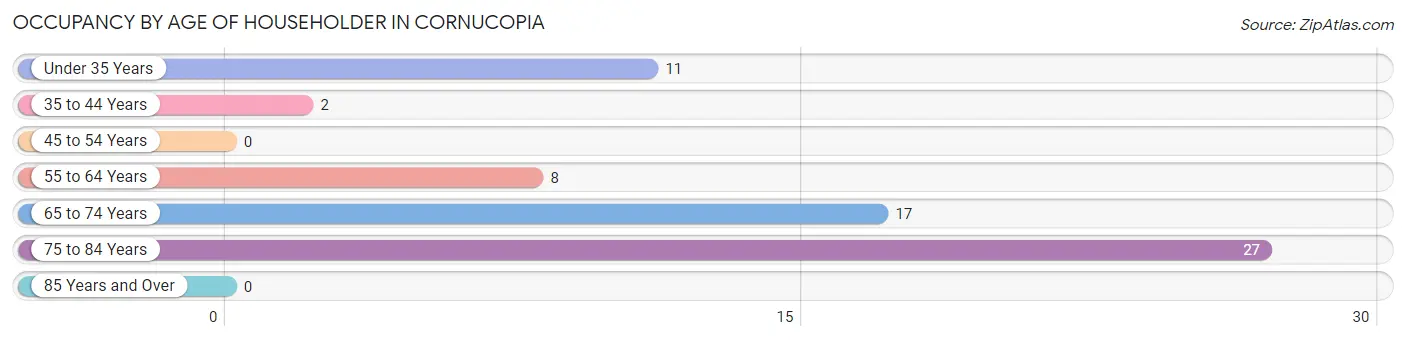
| Age Bracket | # Households | % Households |
| Under 35 Years | 11 | 16.9% |
| 35 to 44 Years | 2 | 3.1% |
| 45 to 54 Years | 0 | 0.0% |
| 55 to 64 Years | 8 | 12.3% |
| 65 to 74 Years | 17 | 26.2% |
| 75 to 84 Years | 27 | 41.5% |
| 85 Years and Over | 0 | 0.0% |
| Total | 65 | 100.0% |
Housing Finances in Cornucopia
Median Income by Occupancy in Cornucopia
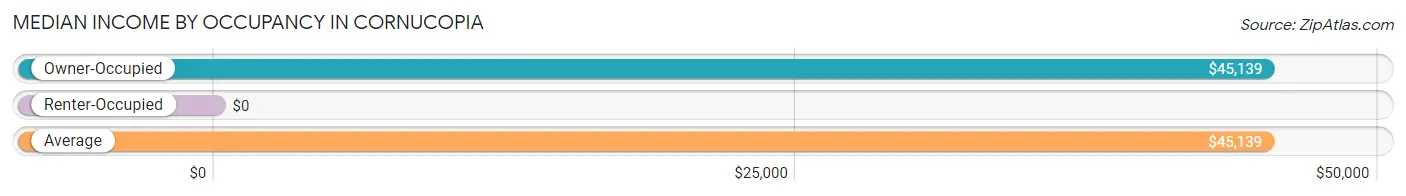
| Occupancy Type | # Households | Median Income |
| Owner-Occupied | 65 (100.0%) | $45,139 |
| Renter-Occupied | 0 (0.0%) | $0 |
| Average | 65 (100.0%) | $45,139 |
Occupancy by Householder Income Bracket in Cornucopia
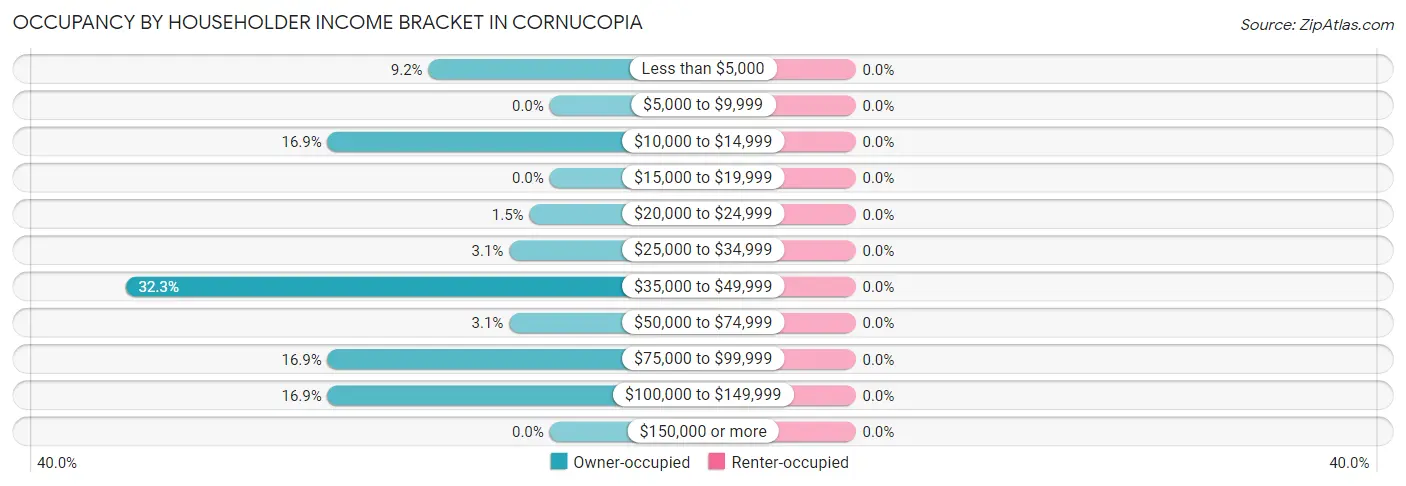
| Income Bracket | Owner-occupied | Renter-occupied |
| Less than $5,000 | 6 (9.2%) | 0 (0.0%) |
| $5,000 to $9,999 | 0 (0.0%) | 0 (0.0%) |
| $10,000 to $14,999 | 11 (16.9%) | 0 (0.0%) |
| $15,000 to $19,999 | 0 (0.0%) | 0 (0.0%) |
| $20,000 to $24,999 | 1 (1.5%) | 0 (0.0%) |
| $25,000 to $34,999 | 2 (3.1%) | 0 (0.0%) |
| $35,000 to $49,999 | 21 (32.3%) | 0 (0.0%) |
| $50,000 to $74,999 | 2 (3.1%) | 0 (0.0%) |
| $75,000 to $99,999 | 11 (16.9%) | 0 (0.0%) |
| $100,000 to $149,999 | 11 (16.9%) | 0 (0.0%) |
| $150,000 or more | 0 (0.0%) | 0 (0.0%) |
| Total | 65 (100.0%) | 0 (0.0%) |
Monthly Housing Cost Tiers in Cornucopia
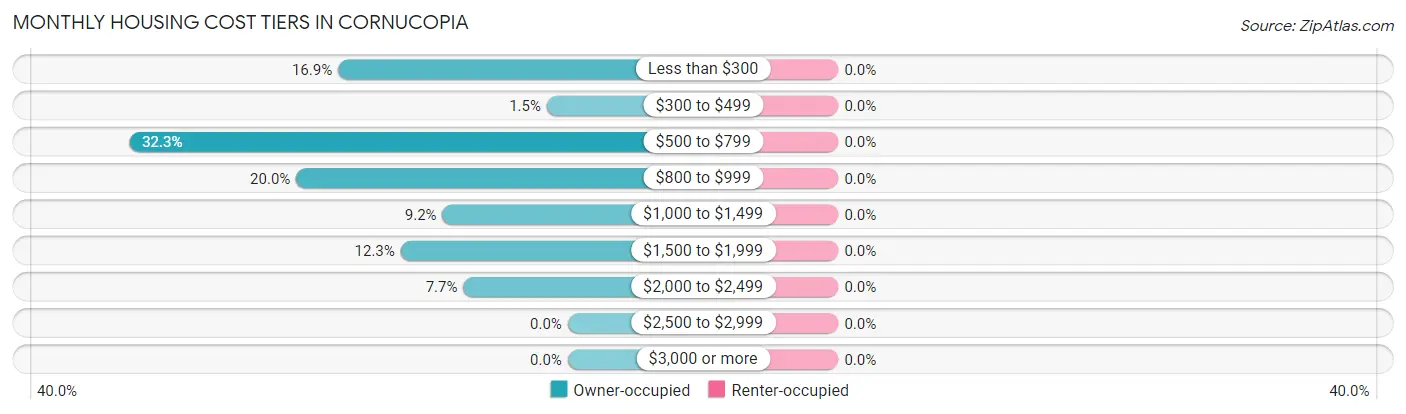
| Monthly Cost | Owner-occupied | Renter-occupied |
| Less than $300 | 11 (16.9%) | 0 (0.0%) |
| $300 to $499 | 1 (1.5%) | 0 (0.0%) |
| $500 to $799 | 21 (32.3%) | 0 (0.0%) |
| $800 to $999 | 13 (20.0%) | 0 (0.0%) |
| $1,000 to $1,499 | 6 (9.2%) | 0 (0.0%) |
| $1,500 to $1,999 | 8 (12.3%) | 0 (0.0%) |
| $2,000 to $2,499 | 5 (7.7%) | 0 (0.0%) |
| $2,500 to $2,999 | 0 (0.0%) | 0 (0.0%) |
| $3,000 or more | 0 (0.0%) | 0 (0.0%) |
| Total | 65 (100.0%) | 0 (0.0%) |
Physical Housing Characteristics in Cornucopia
Housing Structures in Cornucopia
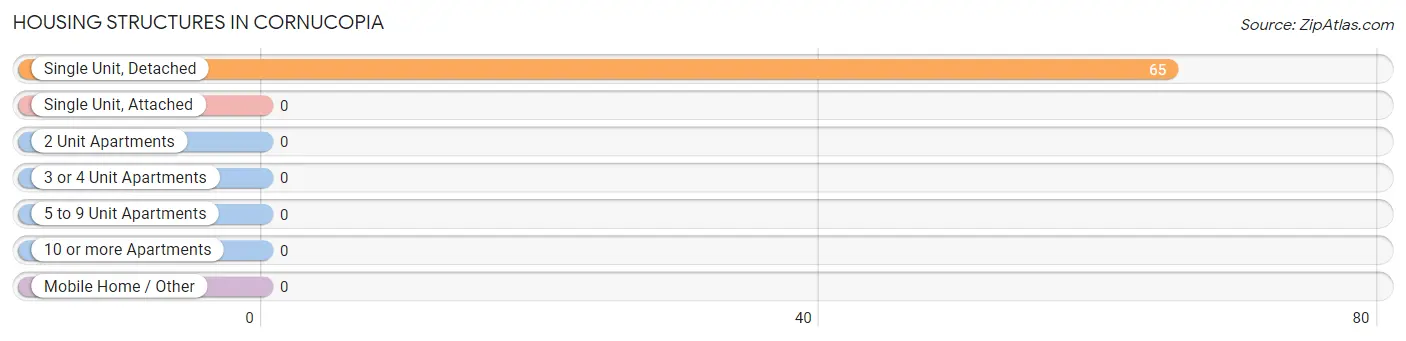
| Structure Type | # Housing Units | % Housing Units |
| Single Unit, Detached | 65 | 100.0% |
| Single Unit, Attached | 0 | 0.0% |
| 2 Unit Apartments | 0 | 0.0% |
| 3 or 4 Unit Apartments | 0 | 0.0% |
| 5 to 9 Unit Apartments | 0 | 0.0% |
| 10 or more Apartments | 0 | 0.0% |
| Mobile Home / Other | 0 | 0.0% |
| Total | 65 | 100.0% |
Housing Structures by Occupancy in Cornucopia
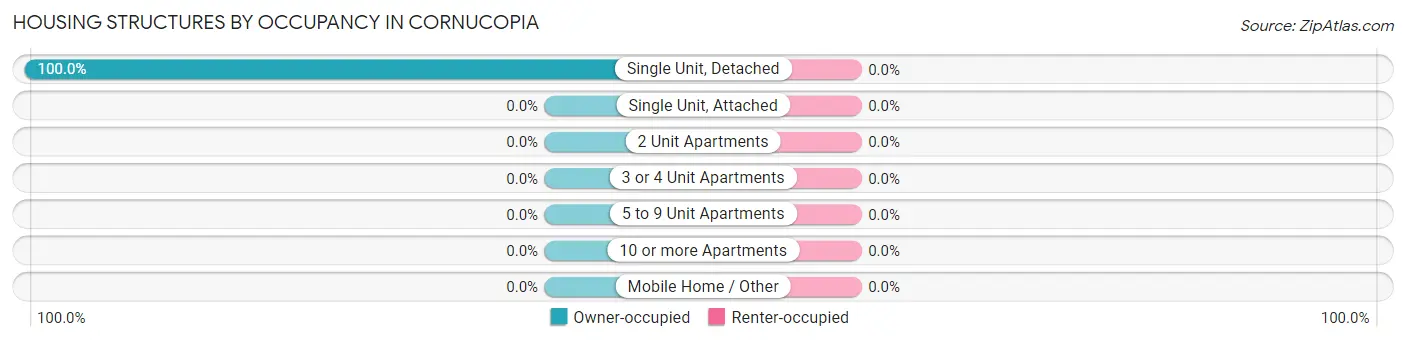
| Structure Type | Owner-occupied | Renter-occupied |
| Single Unit, Detached | 65 (100.0%) | 0 (0.0%) |
| Single Unit, Attached | 0 (0.0%) | 0 (0.0%) |
| 2 Unit Apartments | 0 (0.0%) | 0 (0.0%) |
| 3 or 4 Unit Apartments | 0 (0.0%) | 0 (0.0%) |
| 5 to 9 Unit Apartments | 0 (0.0%) | 0 (0.0%) |
| 10 or more Apartments | 0 (0.0%) | 0 (0.0%) |
| Mobile Home / Other | 0 (0.0%) | 0 (0.0%) |
| Total | 65 (100.0%) | 0 (0.0%) |
Housing Structures by Number of Rooms in Cornucopia
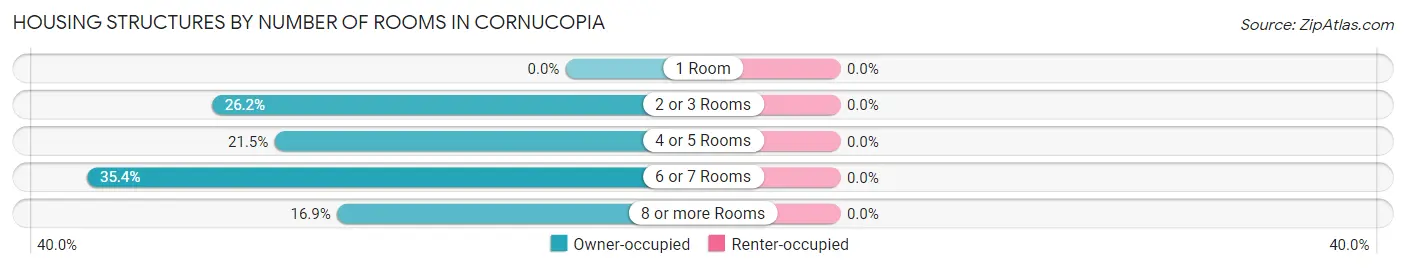
| Number of Rooms | Owner-occupied | Renter-occupied |
| 1 Room | 0 (0.0%) | 0 (0.0%) |
| 2 or 3 Rooms | 17 (26.2%) | 0 (0.0%) |
| 4 or 5 Rooms | 14 (21.5%) | 0 (0.0%) |
| 6 or 7 Rooms | 23 (35.4%) | 0 (0.0%) |
| 8 or more Rooms | 11 (16.9%) | 0 (0.0%) |
| Total | 65 (100.0%) | 0 (0.0%) |
Housing Structure by Heating Type in Cornucopia
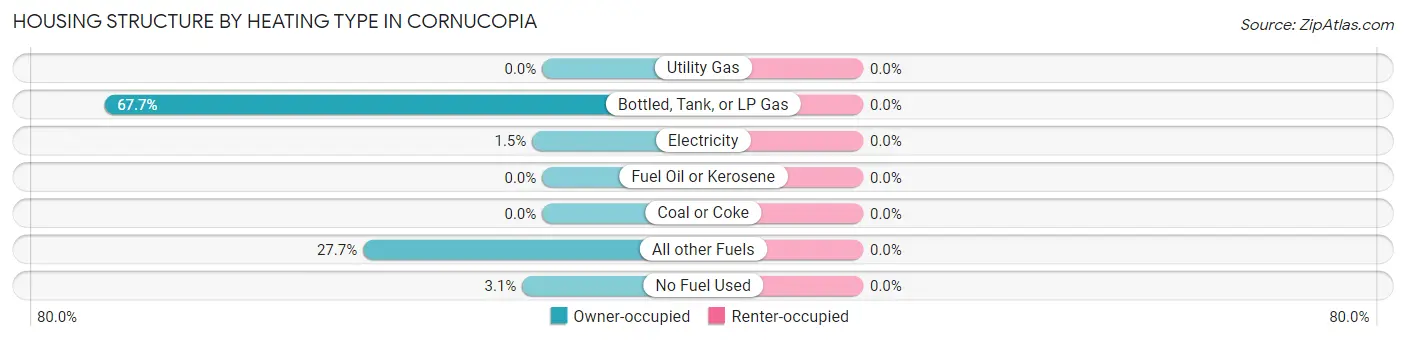
| Heating Type | Owner-occupied | Renter-occupied |
| Utility Gas | 0 (0.0%) | 0 (0.0%) |
| Bottled, Tank, or LP Gas | 44 (67.7%) | 0 (0.0%) |
| Electricity | 1 (1.5%) | 0 (0.0%) |
| Fuel Oil or Kerosene | 0 (0.0%) | 0 (0.0%) |
| Coal or Coke | 0 (0.0%) | 0 (0.0%) |
| All other Fuels | 18 (27.7%) | 0 (0.0%) |
| No Fuel Used | 2 (3.1%) | 0 (0.0%) |
| Total | 65 (100.0%) | 0 (0.0%) |
Household Vehicle Usage in Cornucopia
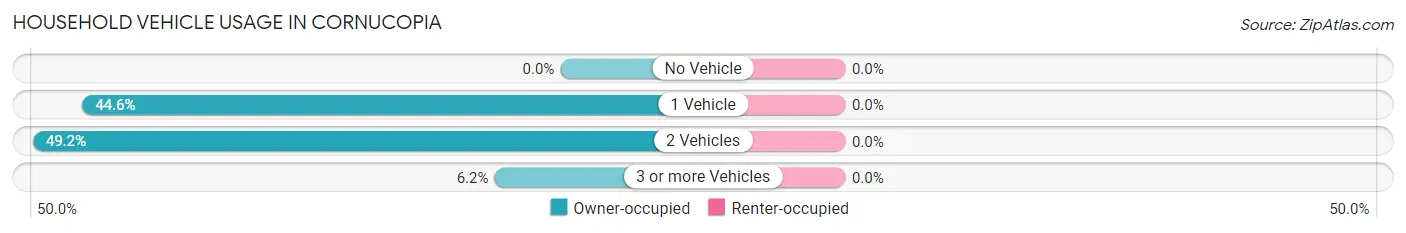
| Vehicles per Household | Owner-occupied | Renter-occupied |
| No Vehicle | 0 (0.0%) | 0 (0.0%) |
| 1 Vehicle | 29 (44.6%) | 0 (0.0%) |
| 2 Vehicles | 32 (49.2%) | 0 (0.0%) |
| 3 or more Vehicles | 4 (6.1%) | 0 (0.0%) |
| Total | 65 (100.0%) | 0 (0.0%) |
Real Estate & Mortgages in Cornucopia
Real Estate and Mortgage Overview in Cornucopia
| Characteristic | Without Mortgage | With Mortgage |
| Housing Units | 38 | 27 |
| Median Property Value | - | - |
| Median Household Income | $35,417 | $0 |
| Monthly Housing Costs | $639 | $0 |
| Real Estate Taxes | $3,455 | $0 |
Property Value by Mortgage Status in Cornucopia
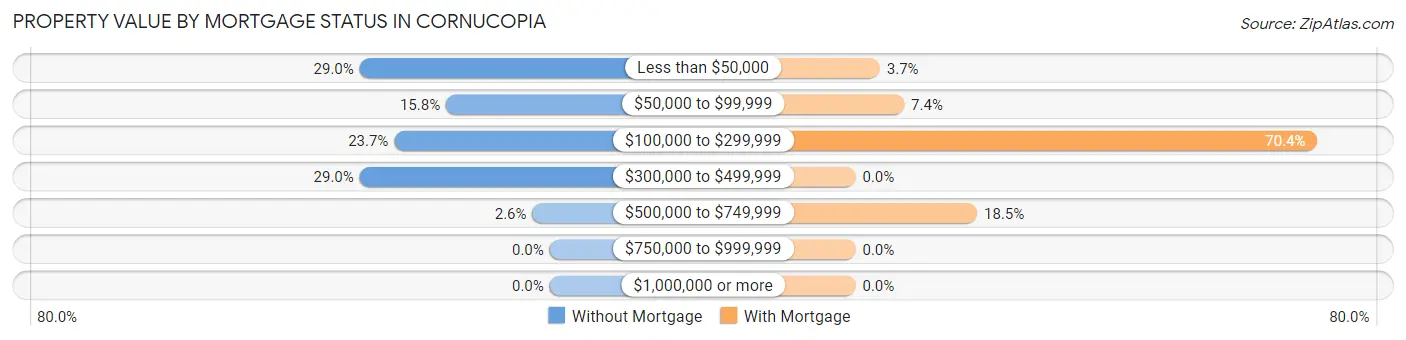
| Property Value | Without Mortgage | With Mortgage |
| Less than $50,000 | 11 (28.9%) | 1 (3.7%) |
| $50,000 to $99,999 | 6 (15.8%) | 2 (7.4%) |
| $100,000 to $299,999 | 9 (23.7%) | 19 (70.4%) |
| $300,000 to $499,999 | 11 (28.9%) | 0 (0.0%) |
| $500,000 to $749,999 | 1 (2.6%) | 5 (18.5%) |
| $750,000 to $999,999 | 0 (0.0%) | 0 (0.0%) |
| $1,000,000 or more | 0 (0.0%) | 0 (0.0%) |
| Total | 38 (100.0%) | 27 (100.0%) |
Household Income by Mortgage Status in Cornucopia
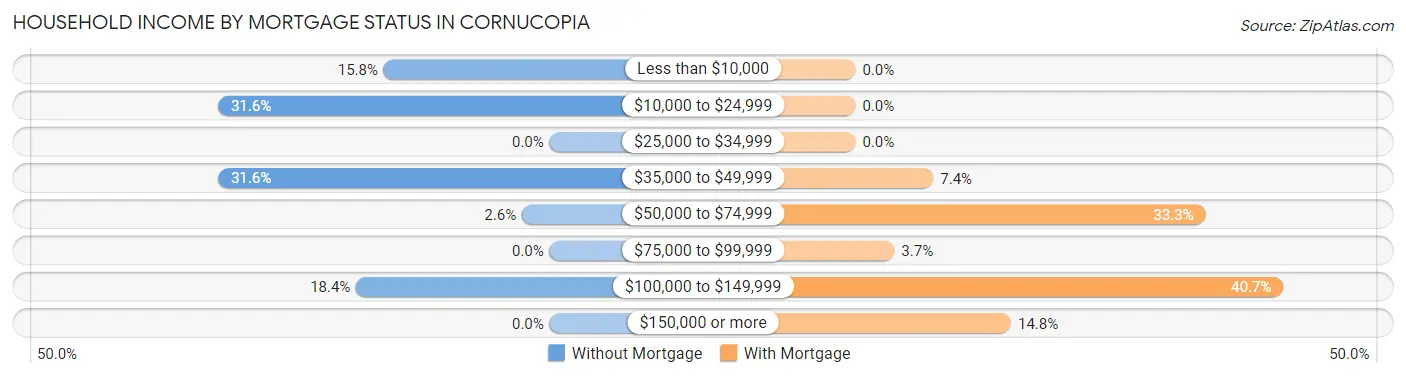
| Household Income | Without Mortgage | With Mortgage |
| Less than $10,000 | 6 (15.8%) | 0 (0.0%) |
| $10,000 to $24,999 | 12 (31.6%) | 0 (0.0%) |
| $25,000 to $34,999 | 0 (0.0%) | 0 (0.0%) |
| $35,000 to $49,999 | 12 (31.6%) | 2 (7.4%) |
| $50,000 to $74,999 | 1 (2.6%) | 9 (33.3%) |
| $75,000 to $99,999 | 0 (0.0%) | 1 (3.7%) |
| $100,000 to $149,999 | 7 (18.4%) | 11 (40.7%) |
| $150,000 or more | 0 (0.0%) | 4 (14.8%) |
| Total | 38 (100.0%) | 27 (100.0%) |
Property Value to Household Income Ratio in Cornucopia
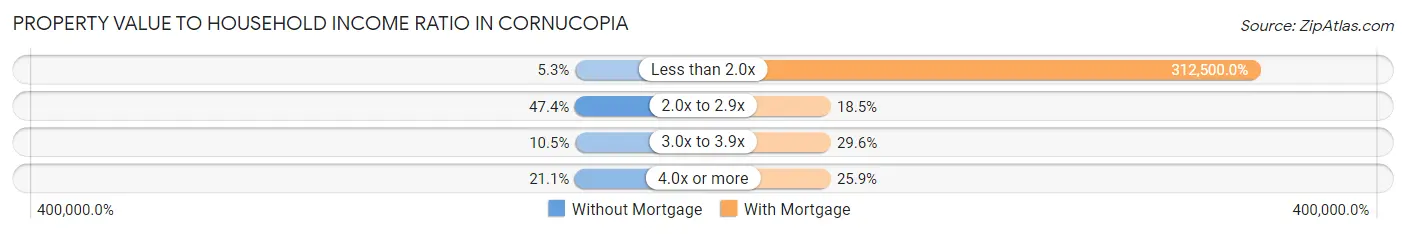
| Value-to-Income Ratio | Without Mortgage | With Mortgage |
| Less than 2.0x | 2 (5.3%) | 84,375 (312,500.0%) |
| 2.0x to 2.9x | 18 (47.4%) | 5 (18.5%) |
| 3.0x to 3.9x | 4 (10.5%) | 8 (29.6%) |
| 4.0x or more | 8 (21.0%) | 7 (25.9%) |
| Total | 38 (100.0%) | 27 (100.0%) |
Real Estate Taxes by Mortgage Status in Cornucopia
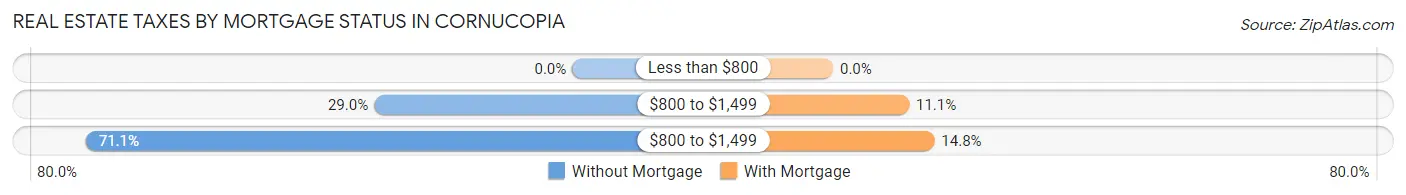
| Property Taxes | Without Mortgage | With Mortgage |
| Less than $800 | 0 (0.0%) | 0 (0.0%) |
| $800 to $1,499 | 11 (28.9%) | 3 (11.1%) |
| $800 to $1,499 | 27 (71.1%) | 4 (14.8%) |
| Total | 38 (100.0%) | 27 (100.0%) |
Health & Disability in Cornucopia
Health Insurance Coverage by Age in Cornucopia
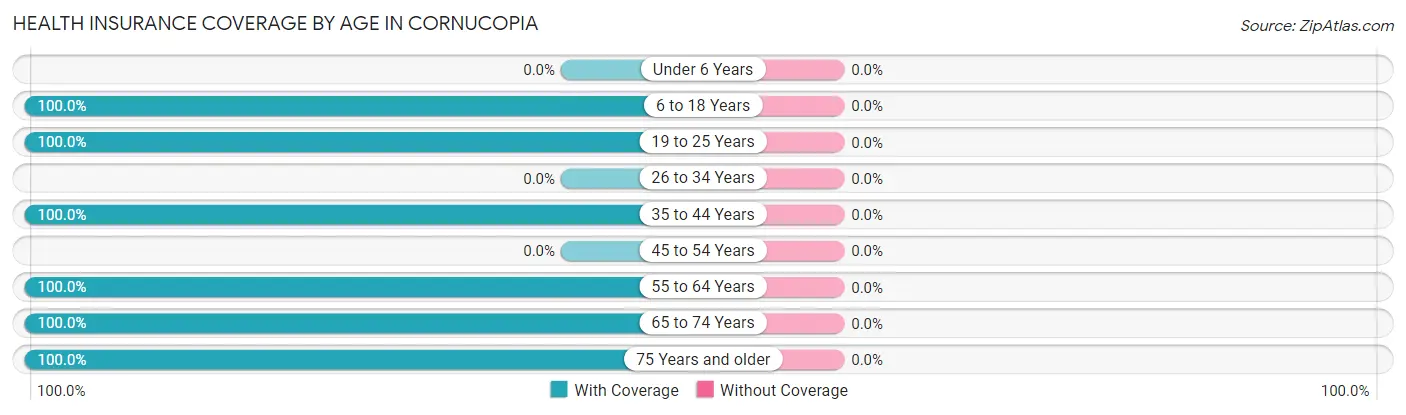
| Age Bracket | With Coverage | Without Coverage |
| Under 6 Years | 0 (0.0%) | 0 (0.0%) |
| 6 to 18 Years | 6 (100.0%) | 0 (0.0%) |
| 19 to 25 Years | 11 (100.0%) | 0 (0.0%) |
| 26 to 34 Years | 0 (0.0%) | 0 (0.0%) |
| 35 to 44 Years | 2 (100.0%) | 0 (0.0%) |
| 45 to 54 Years | 0 (0.0%) | 0 (0.0%) |
| 55 to 64 Years | 13 (100.0%) | 0 (0.0%) |
| 65 to 74 Years | 30 (100.0%) | 0 (0.0%) |
| 75 Years and older | 41 (100.0%) | 0 (0.0%) |
| Total | 103 (100.0%) | 0 (0.0%) |
Health Insurance Coverage by Citizenship Status in Cornucopia
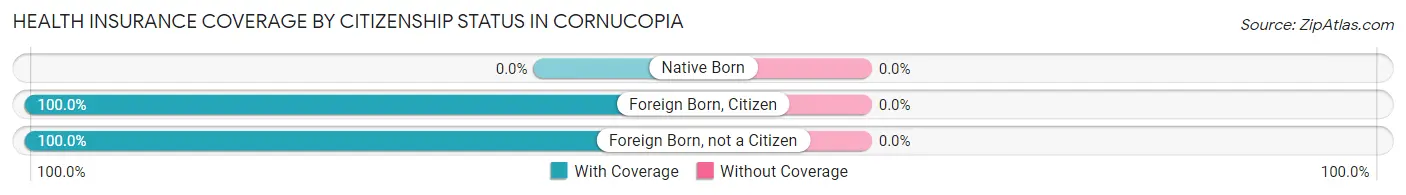
| Citizenship Status | With Coverage | Without Coverage |
| Native Born | 0 (0.0%) | 0 (0.0%) |
| Foreign Born, Citizen | 6 (100.0%) | 0 (0.0%) |
| Foreign Born, not a Citizen | 11 (100.0%) | 0 (0.0%) |
Health Insurance Coverage by Household Income in Cornucopia
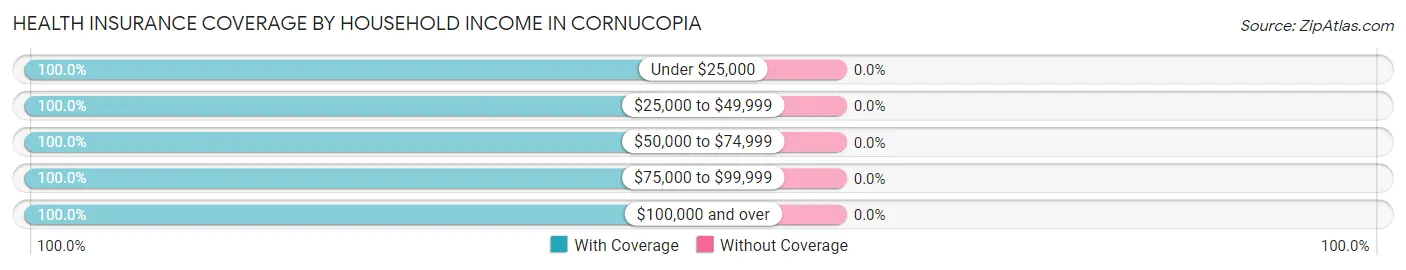
| Household Income | With Coverage | Without Coverage |
| Under $25,000 | 19 (100.0%) | 0 (0.0%) |
| $25,000 to $49,999 | 41 (100.0%) | 0 (0.0%) |
| $50,000 to $74,999 | 5 (100.0%) | 0 (0.0%) |
| $75,000 to $99,999 | 18 (100.0%) | 0 (0.0%) |
| $100,000 and over | 20 (100.0%) | 0 (0.0%) |
Public vs Private Health Insurance Coverage by Age in Cornucopia
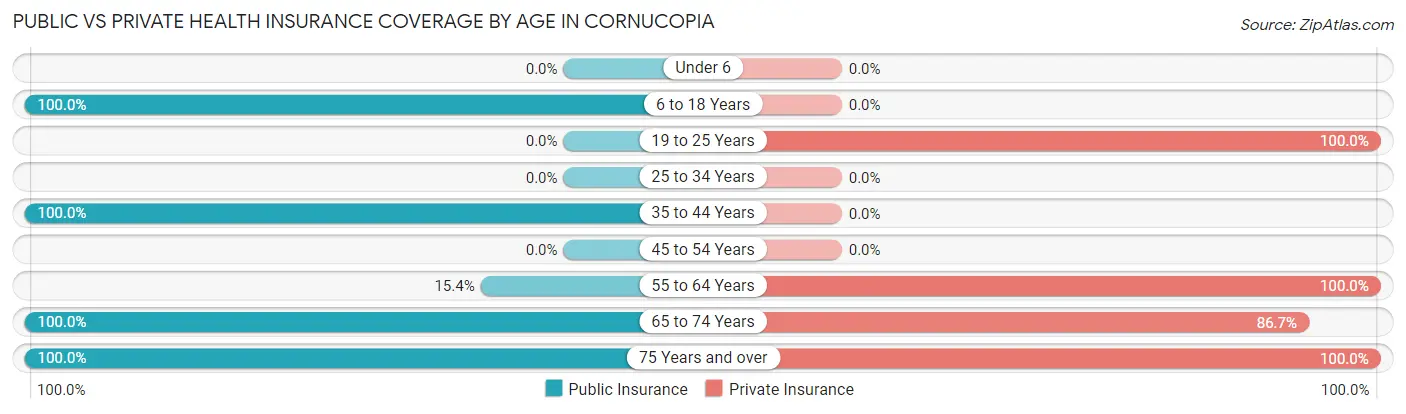
| Age Bracket | Public Insurance | Private Insurance |
| Under 6 | 0 (0.0%) | 0 (0.0%) |
| 6 to 18 Years | 6 (100.0%) | 0 (0.0%) |
| 19 to 25 Years | 0 (0.0%) | 11 (100.0%) |
| 25 to 34 Years | 0 (0.0%) | 0 (0.0%) |
| 35 to 44 Years | 2 (100.0%) | 0 (0.0%) |
| 45 to 54 Years | 0 (0.0%) | 0 (0.0%) |
| 55 to 64 Years | 2 (15.4%) | 13 (100.0%) |
| 65 to 74 Years | 30 (100.0%) | 26 (86.7%) |
| 75 Years and over | 41 (100.0%) | 41 (100.0%) |
| Total | 81 (78.6%) | 91 (88.3%) |
Disability Status by Sex by Age in Cornucopia
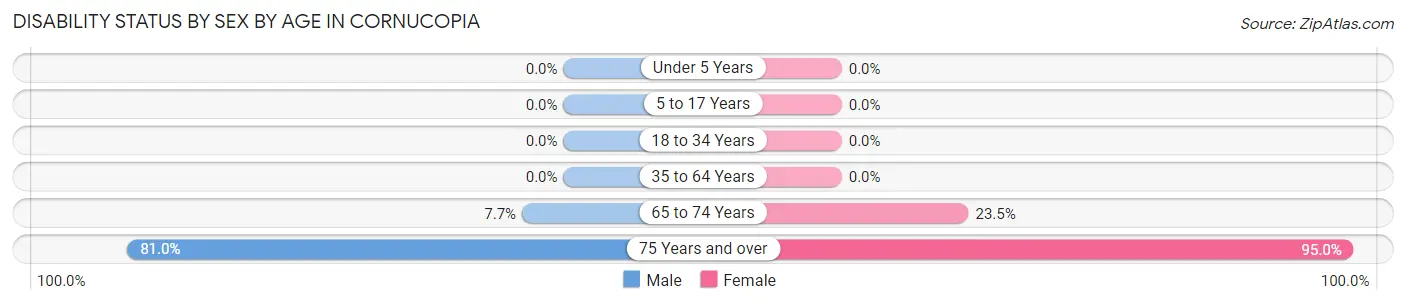
| Age Bracket | Male | Female |
| Under 5 Years | 0 (0.0%) | 0 (0.0%) |
| 5 to 17 Years | 0 (0.0%) | 0 (0.0%) |
| 18 to 34 Years | 0 (0.0%) | 0 (0.0%) |
| 35 to 64 Years | 0 (0.0%) | 0 (0.0%) |
| 65 to 74 Years | 1 (7.7%) | 4 (23.5%) |
| 75 Years and over | 17 (80.9%) | 19 (95.0%) |
Disability Class by Sex by Age in Cornucopia
Disability Class: Hearing Difficulty
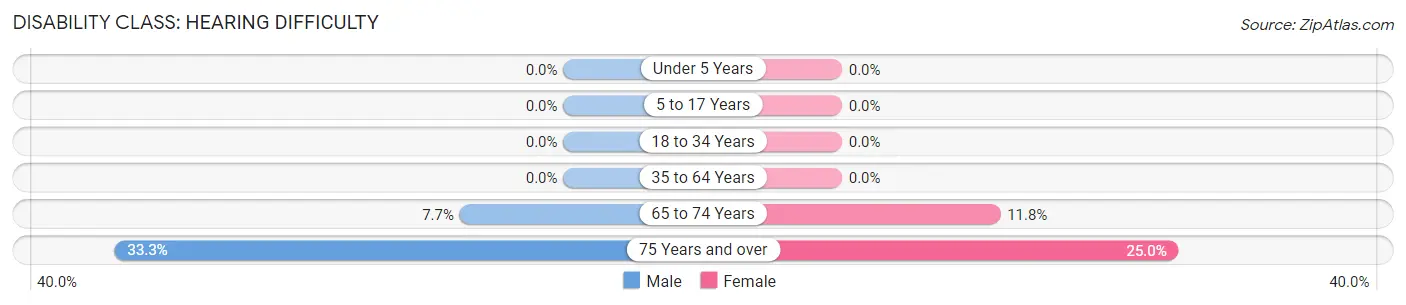
| Age Bracket | Male | Female |
| Under 5 Years | 0 (0.0%) | 0 (0.0%) |
| 5 to 17 Years | 0 (0.0%) | 0 (0.0%) |
| 18 to 34 Years | 0 (0.0%) | 0 (0.0%) |
| 35 to 64 Years | 0 (0.0%) | 0 (0.0%) |
| 65 to 74 Years | 1 (7.7%) | 2 (11.8%) |
| 75 Years and over | 7 (33.3%) | 5 (25.0%) |
Disability Class: Vision Difficulty
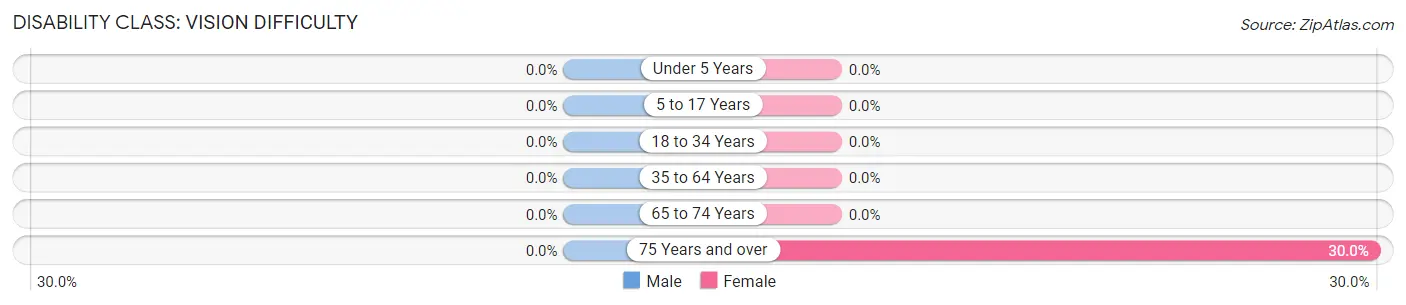
| Age Bracket | Male | Female |
| Under 5 Years | 0 (0.0%) | 0 (0.0%) |
| 5 to 17 Years | 0 (0.0%) | 0 (0.0%) |
| 18 to 34 Years | 0 (0.0%) | 0 (0.0%) |
| 35 to 64 Years | 0 (0.0%) | 0 (0.0%) |
| 65 to 74 Years | 0 (0.0%) | 0 (0.0%) |
| 75 Years and over | 0 (0.0%) | 6 (30.0%) |
Disability Class: Cognitive Difficulty

| Age Bracket | Male | Female |
| 5 to 17 Years | 0 (0.0%) | 0 (0.0%) |
| 18 to 34 Years | 0 (0.0%) | 0 (0.0%) |
| 35 to 64 Years | 0 (0.0%) | 0 (0.0%) |
| 65 to 74 Years | 0 (0.0%) | 0 (0.0%) |
| 75 Years and over | 10 (47.6%) | 6 (30.0%) |
Disability Class: Ambulatory Difficulty
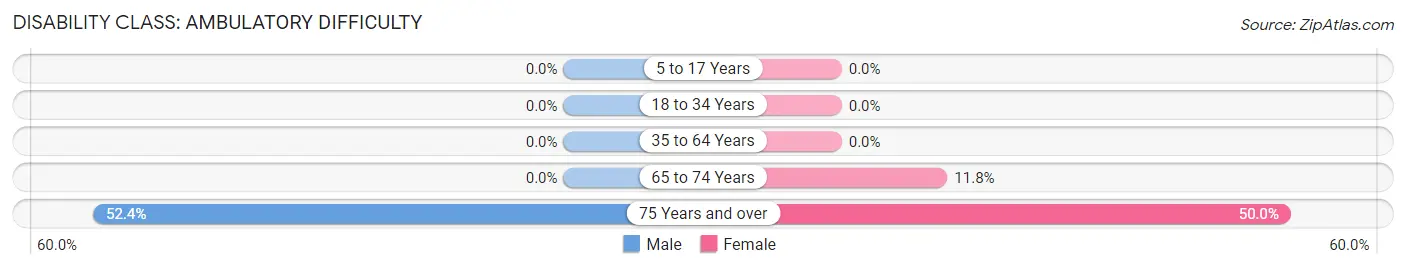
| Age Bracket | Male | Female |
| 5 to 17 Years | 0 (0.0%) | 0 (0.0%) |
| 18 to 34 Years | 0 (0.0%) | 0 (0.0%) |
| 35 to 64 Years | 0 (0.0%) | 0 (0.0%) |
| 65 to 74 Years | 0 (0.0%) | 2 (11.8%) |
| 75 Years and over | 11 (52.4%) | 10 (50.0%) |
Disability Class: Self-Care Difficulty
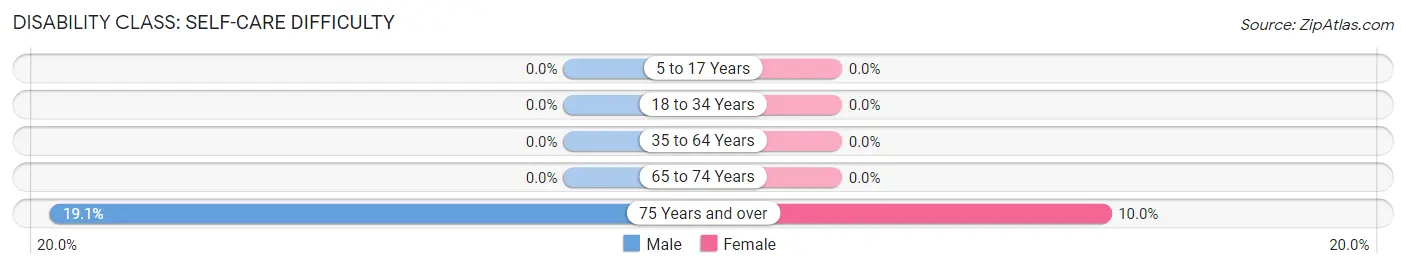
| Age Bracket | Male | Female |
| 5 to 17 Years | 0 (0.0%) | 0 (0.0%) |
| 18 to 34 Years | 0 (0.0%) | 0 (0.0%) |
| 35 to 64 Years | 0 (0.0%) | 0 (0.0%) |
| 65 to 74 Years | 0 (0.0%) | 0 (0.0%) |
| 75 Years and over | 4 (19.1%) | 2 (10.0%) |
Technology Access in Cornucopia
Computing Device Access in Cornucopia
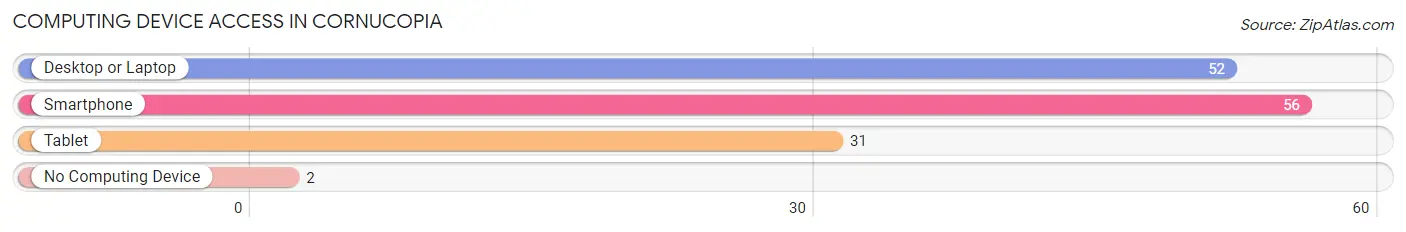
| Device Type | # Households | % Households |
| Desktop or Laptop | 52 | 80.0% |
| Smartphone | 56 | 86.2% |
| Tablet | 31 | 47.7% |
| No Computing Device | 2 | 3.1% |
| Total | 65 | 100.0% |
Internet Access in Cornucopia
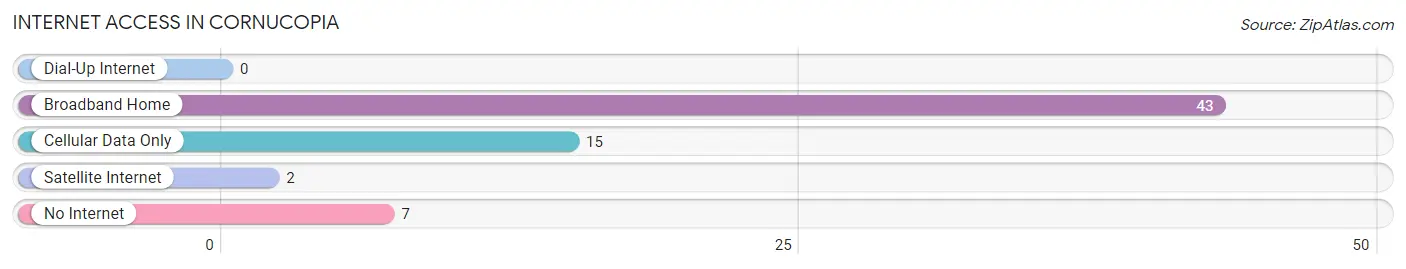
| Internet Type | # Households | % Households |
| Dial-Up Internet | 0 | 0.0% |
| Broadband Home | 43 | 66.1% |
| Cellular Data Only | 15 | 23.1% |
| Satellite Internet | 2 | 3.1% |
| No Internet | 7 | 10.8% |
| Total | 65 | 100.0% |
Cornucopia Summary
History
The area now known as Cornucopia, Wisconsin was first inhabited by the Ojibwe people, who were part of the Algonquin nation. The Ojibwe were a nomadic people who moved around the area, hunting and fishing. They were known for their skill in making birch bark canoes, which they used to travel the area’s many lakes and rivers.
The first European settlers arrived in the area in the late 1800s. They were mostly Scandinavian immigrants, who were drawn to the area by its abundance of natural resources. The settlers quickly began to clear the land and establish farms and logging operations.
The town of Cornucopia was founded in 1891 by a group of Norwegian immigrants. The town was named after the mythical “cornucopia”, a symbol of abundance and prosperity. The town quickly grew, and by the early 1900s it had become a bustling logging and fishing community.
The town’s economy was largely based on the timber industry, and the local sawmill was the largest employer in the area. The town also had a thriving fishing industry, and the local canneries were some of the largest in the state.
In the early 1900s, the town began to attract tourists, who were drawn to the area’s natural beauty and abundance of outdoor activities. The town was also known for its excellent fishing, and it quickly became a popular destination for anglers from all over the country.
Geography
Cornucopia is located in the northwest corner of Wisconsin, on the shores of Lake Superior. The town is situated on a peninsula, surrounded by the lake on three sides. The town is bordered by the towns of Port Wing to the north, Bayfield to the east, and Herbster to the south.
The town is located in a region of Wisconsin known as the “Northwoods”, which is characterized by its dense forests and abundant lakes and rivers. The area is known for its rugged beauty, and it is a popular destination for outdoor enthusiasts.
The town of Cornucopia is located on the western shore of Lake Superior, and it is surrounded by the Apostle Islands National Lakeshore. The area is known for its spectacular scenery, and it is a popular destination for kayakers, hikers, and campers.
Economy
The economy of Cornucopia is largely based on tourism and recreation. The town is a popular destination for outdoor enthusiasts, and it is known for its excellent fishing, hiking, and camping opportunities. The town also has a thriving arts and culture scene, and it is home to several galleries and museums.
The town is also home to several businesses, including a grocery store, a hardware store, and a few restaurants. The town also has a marina, which is a popular destination for boaters and fishermen.
Demographics
As of the 2010 census, the population of Cornucopia was 545. The town has a median age of 44.7, and the median household income is $41,250. The town is predominantly white, with 95.3% of the population identifying as such. The town also has a small Native American population, with 2.2% of the population identifying as Native American.
Common Questions
What is Per Capita Income in Cornucopia?
Per Capita income in Cornucopia is $36,438.
What is the Median Family Income in Cornucopia?
Median Family Income in Cornucopia is $83,125.
What is the Median Household income in Cornucopia?
Median Household Income in Cornucopia is $45,139.
What is Income or Wage Gap in Cornucopia?
Income or Wage Gap in Cornucopia is 5.4%.
Women in Cornucopia earn 94.6 cents for every dollar earned by a man.
What is Inequality or Gini Index in Cornucopia?
Inequality or Gini Index in Cornucopia is 0.42.
What is the Total Population of Cornucopia?
Total Population of Cornucopia is 103.
What is the Total Male Population of Cornucopia?
Total Male Population of Cornucopia is 57.
What is the Total Female Population of Cornucopia?
Total Female Population of Cornucopia is 46.
What is the Ratio of Males per 100 Females in Cornucopia?
There are 123.91 Males per 100 Females in Cornucopia.
What is the Ratio of Females per 100 Males in Cornucopia?
There are 80.70 Females per 100 Males in Cornucopia.
What is the Median Population Age in Cornucopia?
Median Population Age in Cornucopia is 71.7 Years.
What is the Average Family Size in Cornucopia
Average Family Size in Cornucopia is 2.1 People.
What is the Average Household Size in Cornucopia
Average Household Size in Cornucopia is 1.6 People.
How Large is the Labor Force in Cornucopia?
There are 32 People in the Labor Forcein in Cornucopia.
What is the Percentage of People in the Labor Force in Cornucopia?
32.3% of People are in the Labor Force in Cornucopia.