Hatfield, WI Map & Demographics
Hatfield Map
Hatfield Overview
$46,525
PER CAPITA INCOME
$65,833
AVG FAMILY INCOME
$60,795
AVG HOUSEHOLD INCOME
37.1%
WAGE / INCOME GAP [ % ]
62.9¢/ $1
WAGE / INCOME GAP [ $ ]
0.38
INEQUALITY / GINI INDEX
175
TOTAL POPULATION
63
MALE POPULATION
112
FEMALE POPULATION
56.25
MALES / 100 FEMALES
177.78
FEMALES / 100 MALES
70.6
MEDIAN AGE
4.6
AVG FAMILY SIZE
2.6
AVG HOUSEHOLD SIZE
67
LABOR FORCE [ PEOPLE ]
38.7%
PERCENT IN LABOR FORCE
3.0%
UNEMPLOYMENT RATE
Income in Hatfield
Income Overview in Hatfield
Per Capita Income in Hatfield is $46,525, while median incomes of families and households are $65,833 and $60,795 respectively.
| Characteristic | Number | Measure |
| Per Capita Income | 175 | $46,525 |
| Median Family Income | 28 | $65,833 |
| Mean Family Income | 28 | $98,868 |
| Median Household Income | 67 | $60,795 |
| Mean Household Income | 67 | $70,673 |
| Income Deficit | 28 | $0 |
| Wage / Income Gap (%) | 175 | 37.07% |
| Wage / Income Gap ($) | 175 | 62.93¢ per $1 |
| Gini / Inequality Index | 175 | 0.38 |
Earnings by Sex in Hatfield
Average Earnings in Hatfield are $35,156, $46,875 for men and $29,500 for women, a difference of 37.1%.
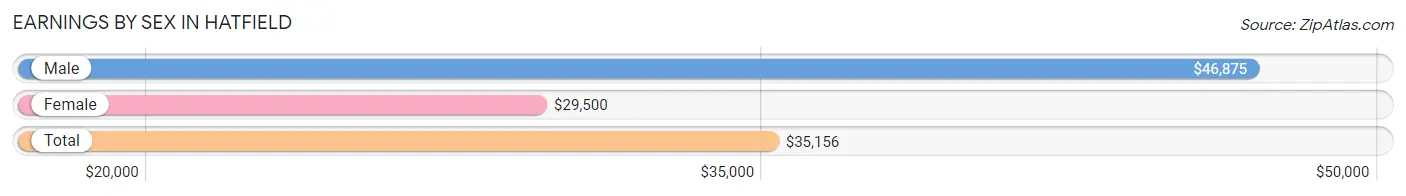
| Sex | Number | Average Earnings |
| Male | 37 (53.6%) | $46,875 |
| Female | 32 (46.4%) | $29,500 |
| Total | 69 (100.0%) | $35,156 |
Earnings by Sex by Income Bracket in Hatfield
The most common earnings brackets in Hatfield are $55,000 to $64,999 for men (13 | 35.1%) and $22,500 to $24,999 for women (9 | 28.1%).
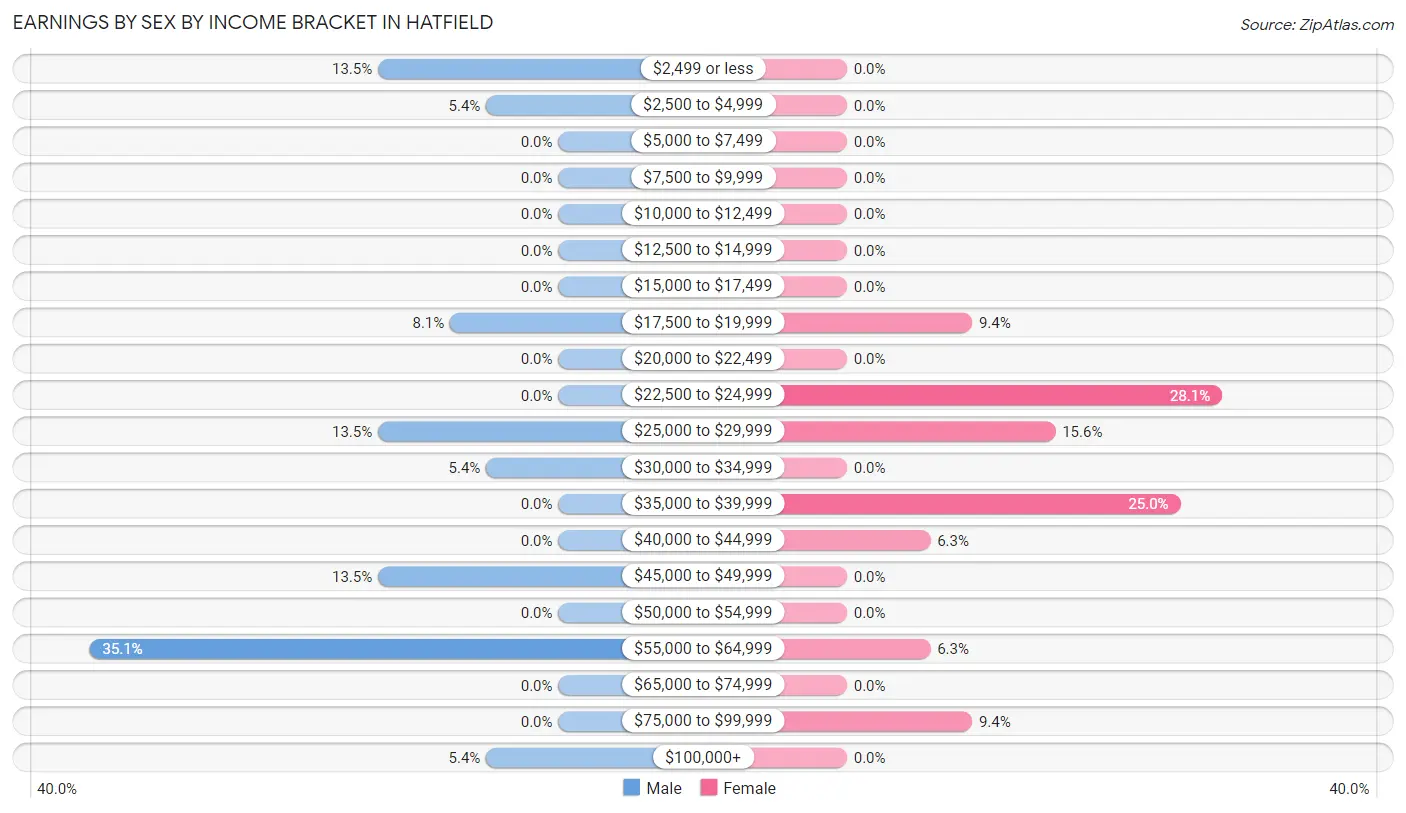
| Income | Male | Female |
| $2,499 or less | 5 (13.5%) | 0 (0.0%) |
| $2,500 to $4,999 | 2 (5.4%) | 0 (0.0%) |
| $5,000 to $7,499 | 0 (0.0%) | 0 (0.0%) |
| $7,500 to $9,999 | 0 (0.0%) | 0 (0.0%) |
| $10,000 to $12,499 | 0 (0.0%) | 0 (0.0%) |
| $12,500 to $14,999 | 0 (0.0%) | 0 (0.0%) |
| $15,000 to $17,499 | 0 (0.0%) | 0 (0.0%) |
| $17,500 to $19,999 | 3 (8.1%) | 3 (9.4%) |
| $20,000 to $22,499 | 0 (0.0%) | 0 (0.0%) |
| $22,500 to $24,999 | 0 (0.0%) | 9 (28.1%) |
| $25,000 to $29,999 | 5 (13.5%) | 5 (15.6%) |
| $30,000 to $34,999 | 2 (5.4%) | 0 (0.0%) |
| $35,000 to $39,999 | 0 (0.0%) | 8 (25.0%) |
| $40,000 to $44,999 | 0 (0.0%) | 2 (6.2%) |
| $45,000 to $49,999 | 5 (13.5%) | 0 (0.0%) |
| $50,000 to $54,999 | 0 (0.0%) | 0 (0.0%) |
| $55,000 to $64,999 | 13 (35.1%) | 2 (6.2%) |
| $65,000 to $74,999 | 0 (0.0%) | 0 (0.0%) |
| $75,000 to $99,999 | 0 (0.0%) | 3 (9.4%) |
| $100,000+ | 2 (5.4%) | 0 (0.0%) |
| Total | 37 (100.0%) | 32 (100.0%) |
Earnings by Sex by Educational Attainment in Hatfield
Average earnings in Hatfield are $46,875 for men and $29,500 for women, a difference of 37.1%. Men with an educational attainment of college or associate's degree enjoy the highest average annual earnings of $48,750, while those with college or associate's degree education earn the least with $48,750. Women with an educational attainment of college or associate's degree earn the most with the average annual earnings of $40,625, while those with high school diploma education have the smallest earnings of $24,375.
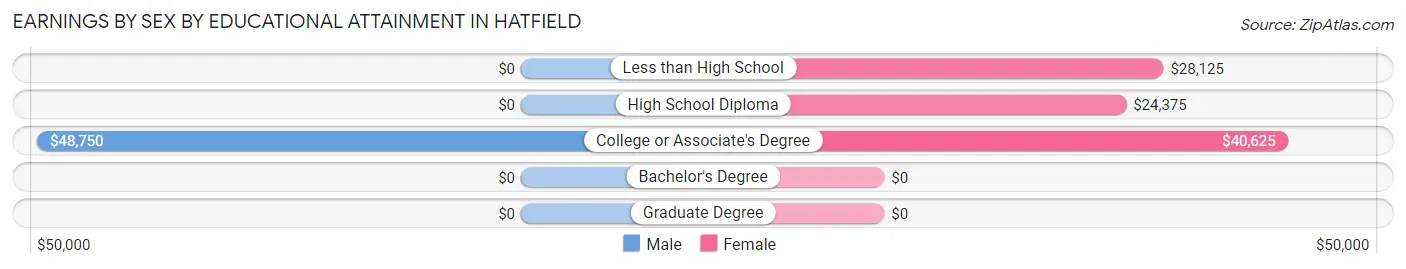
| Educational Attainment | Male Income | Female Income |
| Less than High School | - | - |
| High School Diploma | - | - |
| College or Associate's Degree | $48,750 | $40,625 |
| Bachelor's Degree | - | - |
| Graduate Degree | - | - |
| Total | $46,875 | $29,500 |
Family Income in Hatfield
Family Income Brackets in Hatfield
According to the Hatfield family income data, there are 9 families falling into the $50,000 to $74,999 income range, which is the most common income bracket and makes up 32.1% of all families.
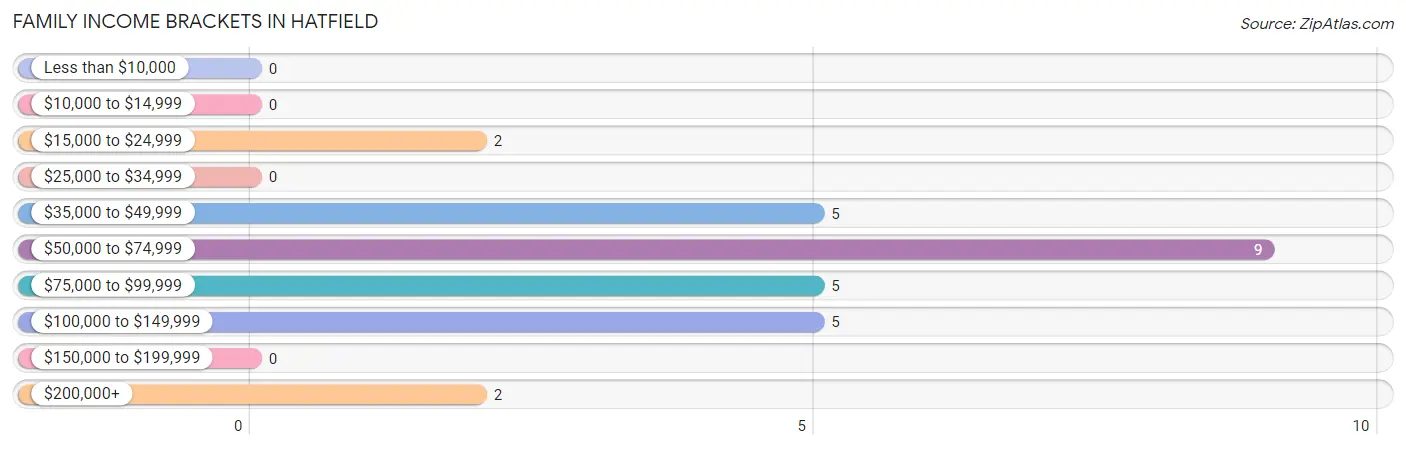
| Income Bracket | # Families | % Families |
| Less than $10,000 | 0 | 0.0% |
| $10,000 to $14,999 | 0 | 0.0% |
| $15,000 to $24,999 | 2 | 7.1% |
| $25,000 to $34,999 | 0 | 0.0% |
| $35,000 to $49,999 | 5 | 17.9% |
| $50,000 to $74,999 | 9 | 32.1% |
| $75,000 to $99,999 | 5 | 17.9% |
| $100,000 to $149,999 | 5 | 17.9% |
| $150,000 to $199,999 | 0 | 0.0% |
| $200,000+ | 2 | 7.1% |
Family Income by Famaliy Size in Hatfield
2-person families (19 | 67.9%) account for the highest median family income in Hatfield with $67,083 per family, while 2-person families (19 | 67.9%) have the highest median income of $33,542 per family member.
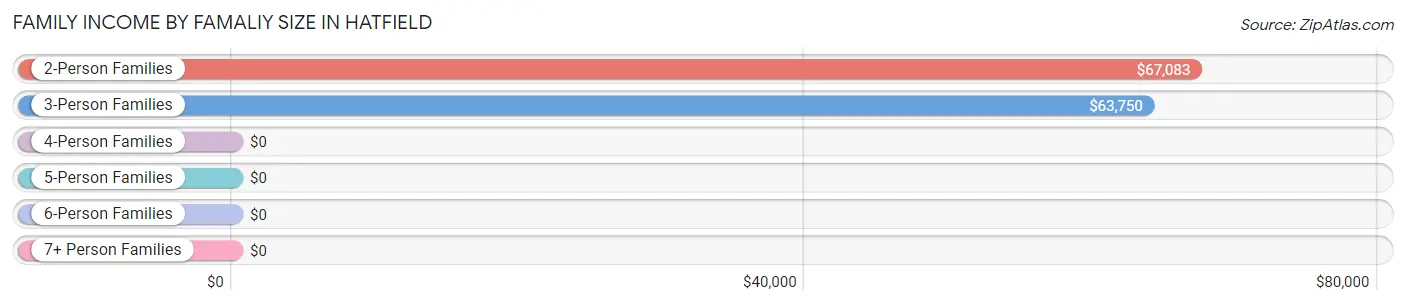
| Income Bracket | # Families | Median Income |
| 2-Person Families | 19 (67.9%) | $67,083 |
| 3-Person Families | 9 (32.1%) | $63,750 |
| 4-Person Families | 0 (0.0%) | $0 |
| 5-Person Families | 0 (0.0%) | $0 |
| 6-Person Families | 0 (0.0%) | $0 |
| 7+ Person Families | 0 (0.0%) | $0 |
| Total | 28 (100.0%) | $65,833 |
Family Income by Number of Earners in Hatfield
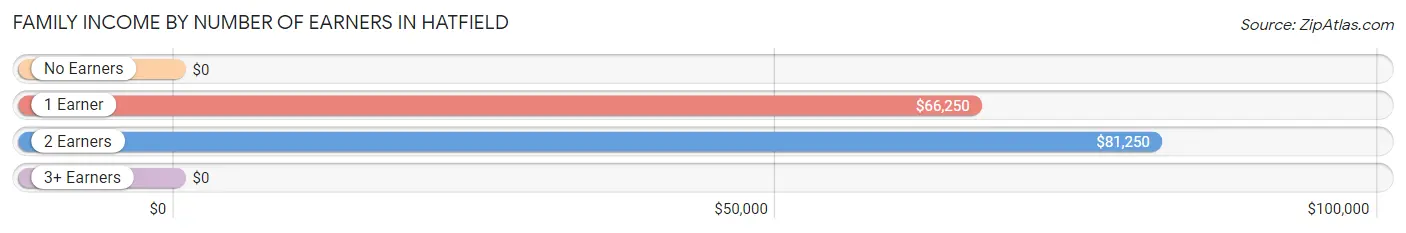
| Number of Earners | # Families | Median Income |
| No Earners | 5 (17.9%) | $0 |
| 1 Earner | 7 (25.0%) | $66,250 |
| 2 Earners | 16 (57.1%) | $81,250 |
| 3+ Earners | 0 (0.0%) | $0 |
| Total | 28 (100.0%) | $65,833 |
Household Income in Hatfield
Household Income Brackets in Hatfield
With 29 households falling in the category, the $50,000 to $74,999 income range is the most frequent in Hatfield, accounting for 43.3% of all households.
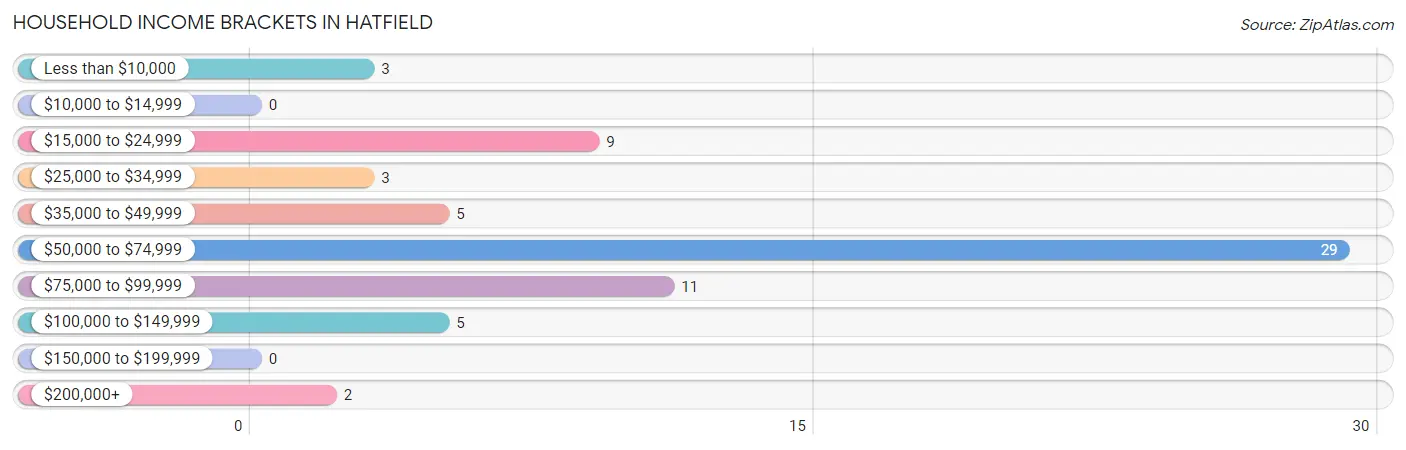
| Income Bracket | # Households | % Households |
| Less than $10,000 | 3 | 4.5% |
| $10,000 to $14,999 | 0 | 0.0% |
| $15,000 to $24,999 | 9 | 13.4% |
| $25,000 to $34,999 | 3 | 4.5% |
| $35,000 to $49,999 | 5 | 7.5% |
| $50,000 to $74,999 | 29 | 43.3% |
| $75,000 to $99,999 | 11 | 16.4% |
| $100,000 to $149,999 | 5 | 7.5% |
| $150,000 to $199,999 | 0 | 0.0% |
| $200,000+ | 2 | 3.0% |
Household Income by Householder Age in Hatfield
The median household income in Hatfield is $60,795, with the highest median household income of $61,705 found in the 45 to 64 years age bracket for the primary householder. A total of 37 households (55.2%) fall into this category.
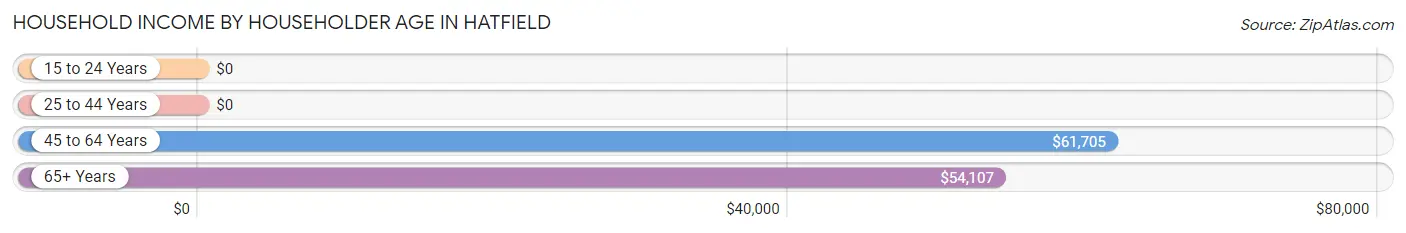
| Income Bracket | # Households | Median Income |
| 15 to 24 Years | 0 (0.0%) | $0 |
| 25 to 44 Years | 3 (4.5%) | $0 |
| 45 to 64 Years | 37 (55.2%) | $61,705 |
| 65+ Years | 27 (40.3%) | $54,107 |
| Total | 67 (100.0%) | $60,795 |
Poverty in Hatfield
Income Below Poverty by Sex and Age in Hatfield
With 12.7% poverty level for males and 2.7% for females among the residents of Hatfield, 16 and 17 year old males and 75 year old and over females are the most vulnerable to poverty, with 3 males (100.0%) and 3 females (60.0%) in their respective age groups living below the poverty level.
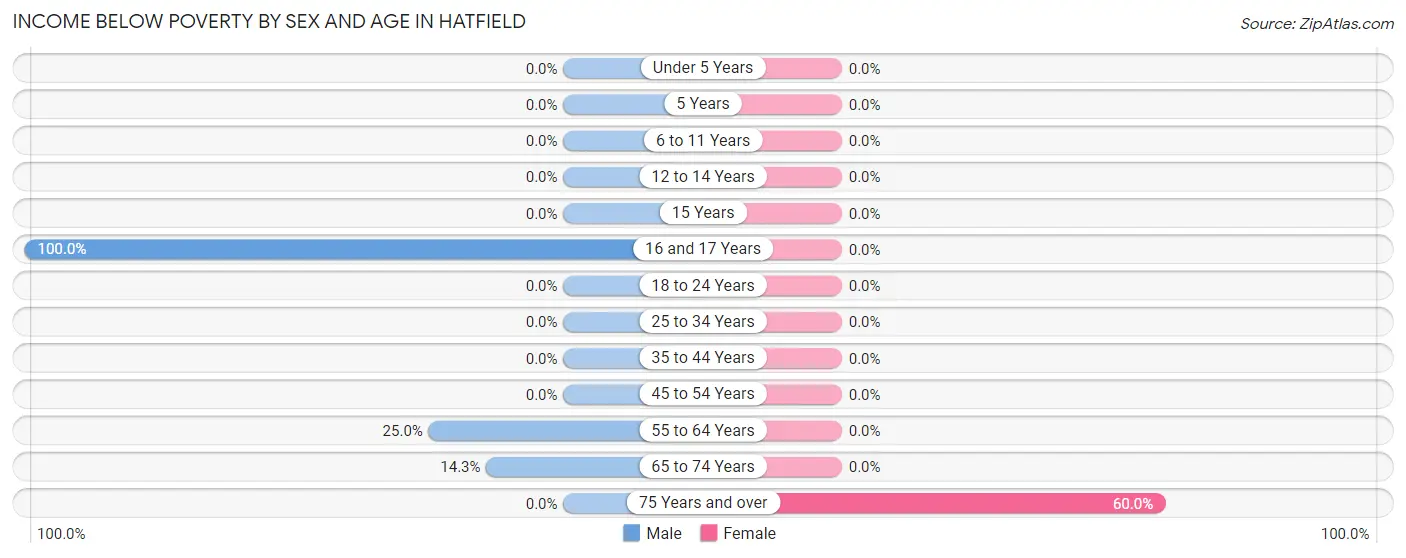
| Age Bracket | Male | Female |
| Under 5 Years | 0 (0.0%) | 0 (0.0%) |
| 5 Years | 0 (0.0%) | 0 (0.0%) |
| 6 to 11 Years | 0 (0.0%) | 0 (0.0%) |
| 12 to 14 Years | 0 (0.0%) | 0 (0.0%) |
| 15 Years | 0 (0.0%) | 0 (0.0%) |
| 16 and 17 Years | 3 (100.0%) | 0 (0.0%) |
| 18 to 24 Years | 0 (0.0%) | 0 (0.0%) |
| 25 to 34 Years | 0 (0.0%) | 0 (0.0%) |
| 35 to 44 Years | 0 (0.0%) | 0 (0.0%) |
| 45 to 54 Years | 0 (0.0%) | 0 (0.0%) |
| 55 to 64 Years | 3 (25.0%) | 0 (0.0%) |
| 65 to 74 Years | 2 (14.3%) | 0 (0.0%) |
| 75 Years and over | 0 (0.0%) | 3 (60.0%) |
| Total | 8 (12.7%) | 3 (2.7%) |
Income Above Poverty by Sex and Age in Hatfield
According to the poverty statistics in Hatfield, males aged 25 to 34 years and females aged 12 to 14 years are the age groups that are most secure financially, with 100.0% of males and 100.0% of females in these age groups living above the poverty line.
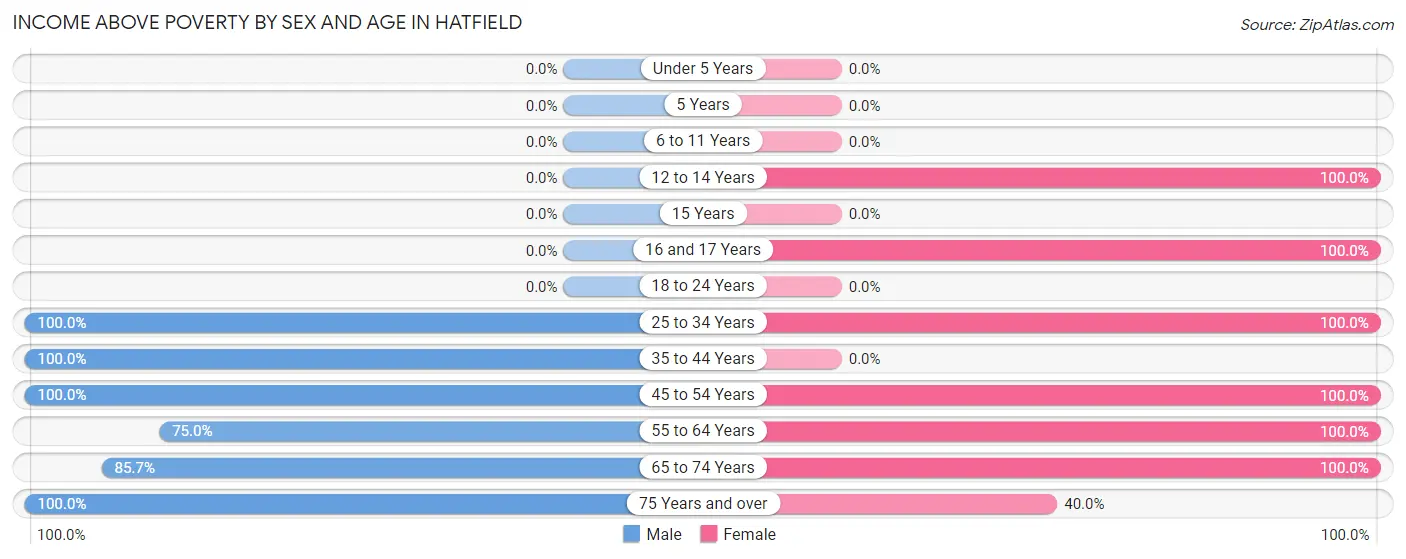
| Age Bracket | Male | Female |
| Under 5 Years | 0 (0.0%) | 0 (0.0%) |
| 5 Years | 0 (0.0%) | 0 (0.0%) |
| 6 to 11 Years | 0 (0.0%) | 0 (0.0%) |
| 12 to 14 Years | 0 (0.0%) | 2 (100.0%) |
| 15 Years | 0 (0.0%) | 0 (0.0%) |
| 16 and 17 Years | 0 (0.0%) | 4 (100.0%) |
| 18 to 24 Years | 0 (0.0%) | 0 (0.0%) |
| 25 to 34 Years | 5 (100.0%) | 2 (100.0%) |
| 35 to 44 Years | 8 (100.0%) | 0 (0.0%) |
| 45 to 54 Years | 13 (100.0%) | 10 (100.0%) |
| 55 to 64 Years | 9 (75.0%) | 16 (100.0%) |
| 65 to 74 Years | 12 (85.7%) | 73 (100.0%) |
| 75 Years and over | 8 (100.0%) | 2 (40.0%) |
| Total | 55 (87.3%) | 109 (97.3%) |
Income Below Poverty Among Married-Couple Families in Hatfield
The poverty statistics for married-couple families in Hatfield show that 8.0% or 2 of the total 25 families live below the poverty line. Families with no children have the highest poverty rate of 9.1%, comprising of 2 families. On the other hand, families with 1 or 2 children have the lowest poverty rate of 0.0%, which includes 0 families.
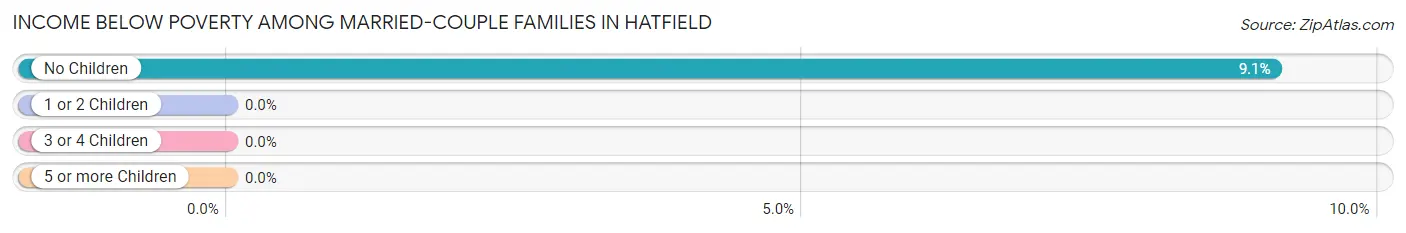
| Children | Above Poverty | Below Poverty |
| No Children | 20 (90.9%) | 2 (9.1%) |
| 1 or 2 Children | 3 (100.0%) | 0 (0.0%) |
| 3 or 4 Children | 0 (0.0%) | 0 (0.0%) |
| 5 or more Children | 0 (0.0%) | 0 (0.0%) |
| Total | 23 (92.0%) | 2 (8.0%) |
Income Below Poverty Among Single-Parent Households in Hatfield
| Children | Single Father | Single Mother |
| No Children | 0 (0.0%) | 0 (0.0%) |
| 1 or 2 Children | 0 (0.0%) | 0 (0.0%) |
| 3 or 4 Children | 0 (0.0%) | 0 (0.0%) |
| 5 or more Children | 0 (0.0%) | 0 (0.0%) |
| Total | 0 (0.0%) | 0 (0.0%) |
Income Below Poverty Among Married-Couple vs Single-Parent Households in Hatfield
| Children | Married-Couple Families | Single-Parent Households |
| No Children | 2 (9.1%) | 0 (0.0%) |
| 1 or 2 Children | 0 (0.0%) | 0 (0.0%) |
| 3 or 4 Children | 0 (0.0%) | 0 (0.0%) |
| 5 or more Children | 0 (0.0%) | 0 (0.0%) |
| Total | 2 (8.0%) | 0 (0.0%) |
Race in Hatfield
The most populous races in Hatfield are White / Caucasian (173 | 98.9%), and Native / Alaskan (2 | 1.1%).
| Race | # Population | % Population |
| Asian | 0 | 0.0% |
| Black / African American | 0 | 0.0% |
| Hawaiian / Pacific | 0 | 0.0% |
| Hispanic or Latino | 0 | 0.0% |
| Native / Alaskan | 2 | 1.1% |
| White / Caucasian | 173 | 98.9% |
| Two or more Races | 0 | 0.0% |
| Some other Race | 0 | 0.0% |
| Total | 175 | 100.0% |
Ancestry in Hatfield
The most populous ancestries reported in Hatfield are German (97 | 55.4%), Irish (71 | 40.6%), Norwegian (23 | 13.1%), Polish (18 | 10.3%), and Czech (16 | 9.1%), together accounting for 128.6% of all Hatfield residents.
| Ancestry | # Population | % Population |
| American | 3 | 1.7% |
| Czech | 16 | 9.1% |
| Dutch | 2 | 1.1% |
| German | 97 | 55.4% |
| Irish | 71 | 40.6% |
| Italian | 10 | 5.7% |
| Norwegian | 23 | 13.1% |
| Polish | 18 | 10.3% |
| Scottish | 2 | 1.1% |
| Swedish | 5 | 2.9% | View All 10 Rows |
Immigrants in Hatfield

| Immigration Origin | # Population | % Population | View All 0 Rows |
Sex and Age in Hatfield
Sex and Age in Hatfield
The most populous age groups in Hatfield are 70 to 74 Years (13 | 20.6%) for men and 70 to 74 Years (66 | 58.9%) for women.
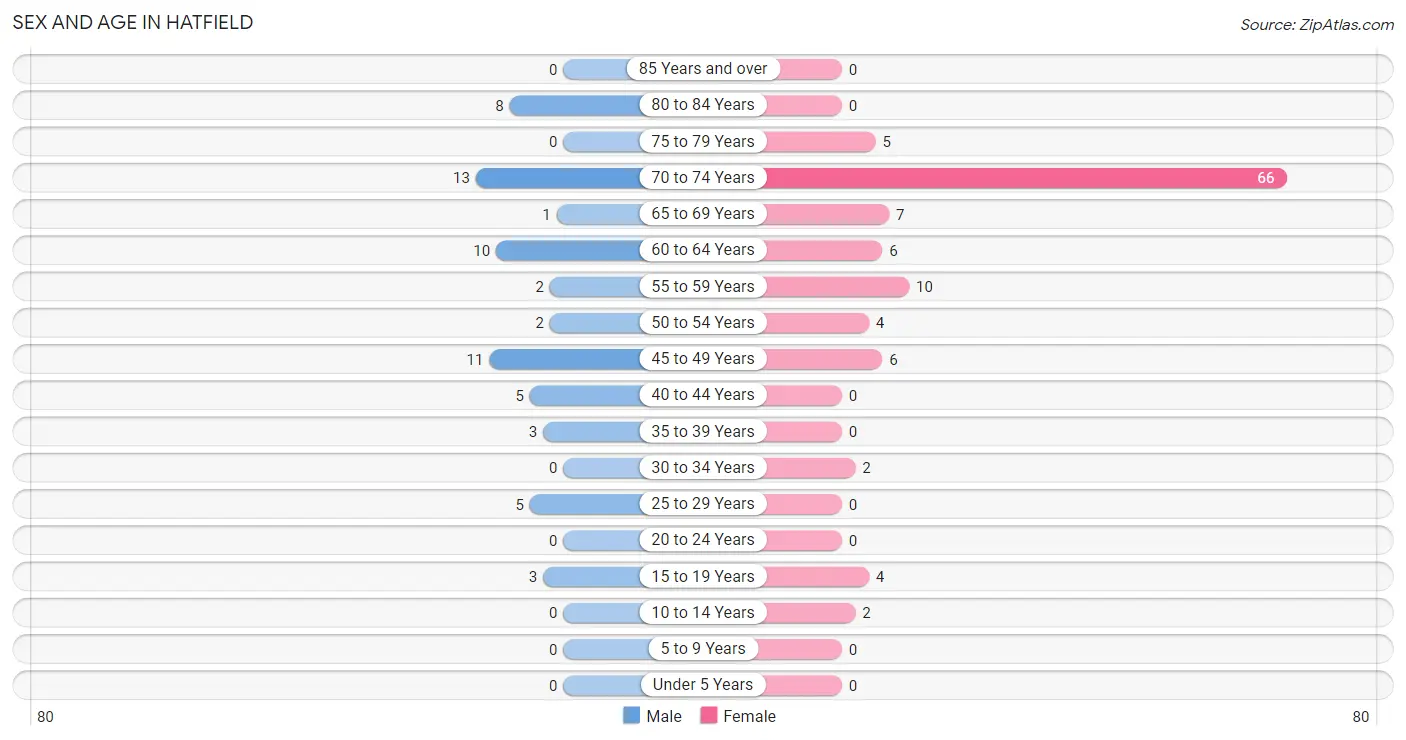
| Age Bracket | Male | Female |
| Under 5 Years | 0 (0.0%) | 0 (0.0%) |
| 5 to 9 Years | 0 (0.0%) | 0 (0.0%) |
| 10 to 14 Years | 0 (0.0%) | 2 (1.8%) |
| 15 to 19 Years | 3 (4.8%) | 4 (3.6%) |
| 20 to 24 Years | 0 (0.0%) | 0 (0.0%) |
| 25 to 29 Years | 5 (7.9%) | 0 (0.0%) |
| 30 to 34 Years | 0 (0.0%) | 2 (1.8%) |
| 35 to 39 Years | 3 (4.8%) | 0 (0.0%) |
| 40 to 44 Years | 5 (7.9%) | 0 (0.0%) |
| 45 to 49 Years | 11 (17.5%) | 6 (5.4%) |
| 50 to 54 Years | 2 (3.2%) | 4 (3.6%) |
| 55 to 59 Years | 2 (3.2%) | 10 (8.9%) |
| 60 to 64 Years | 10 (15.9%) | 6 (5.4%) |
| 65 to 69 Years | 1 (1.6%) | 7 (6.2%) |
| 70 to 74 Years | 13 (20.6%) | 66 (58.9%) |
| 75 to 79 Years | 0 (0.0%) | 5 (4.5%) |
| 80 to 84 Years | 8 (12.7%) | 0 (0.0%) |
| 85 Years and over | 0 (0.0%) | 0 (0.0%) |
| Total | 63 (100.0%) | 112 (100.0%) |
Families and Households in Hatfield
Median Family Size in Hatfield
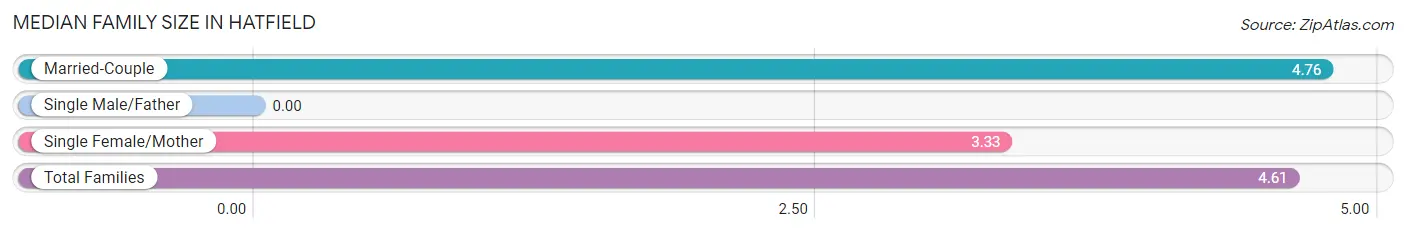
| Family Type | # Families | Family Size |
| Married-Couple | 25 (89.3%) | 4.76 |
| Single Male/Father | 0 (0.0%) | - |
| Single Female/Mother | 3 (10.7%) | 3.33 |
| Total Families | 28 (100.0%) | 4.61 |
Median Household Size in Hatfield
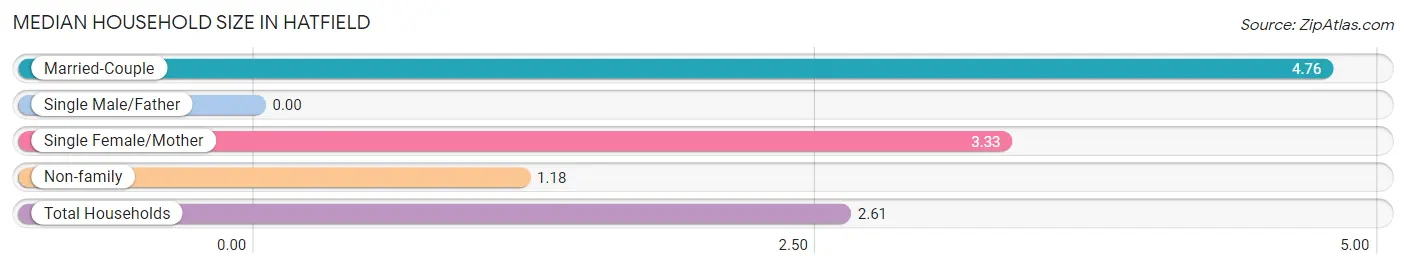
| Household Type | # Households | Household Size |
| Married-Couple | 25 (37.3%) | 4.76 |
| Single Male/Father | 0 (0.0%) | - |
| Single Female/Mother | 3 (4.5%) | 3.33 |
| Non-family | 39 (58.2%) | 1.18 |
| Total Households | 67 (100.0%) | 2.61 |
Household Size by Marriage Status in Hatfield
Out of a total of 67 households in Hatfield, 28 (41.8%) are family households, while 39 (58.2%) are nonfamily households. The most numerous type of family households are 2-person households, comprising 19, and the most common type of nonfamily households are 1-person households, comprising 35.
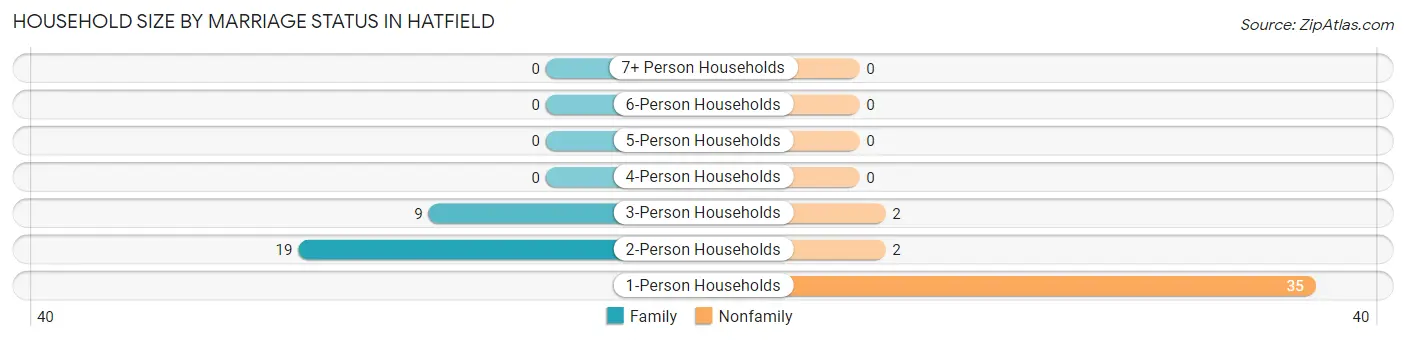
| Household Size | Family Households | Nonfamily Households |
| 1-Person Households | - | 35 (52.2%) |
| 2-Person Households | 19 (28.4%) | 2 (3.0%) |
| 3-Person Households | 9 (13.4%) | 2 (3.0%) |
| 4-Person Households | 0 (0.0%) | 0 (0.0%) |
| 5-Person Households | 0 (0.0%) | 0 (0.0%) |
| 6-Person Households | 0 (0.0%) | 0 (0.0%) |
| 7+ Person Households | 0 (0.0%) | 0 (0.0%) |
| Total | 28 (41.8%) | 39 (58.2%) |
Female Fertility in Hatfield
Fertility by Age in Hatfield
| Age Bracket | Women with Births | Births / 1,000 Women |
| 15 to 19 years | 0 (0.0%) | 0.0 |
| 20 to 34 years | 0 (0.0%) | 0.0 |
| 35 to 50 years | 0 (0.0%) | 0.0 |
| Total | 0 (0.0%) | 0.0 |
Fertility by Age by Marriage Status in Hatfield
| Age Bracket | Married | Unmarried |
| 15 to 19 years | 0 (0.0%) | 0 (0.0%) |
| 20 to 34 years | 0 (0.0%) | 0 (0.0%) |
| 35 to 50 years | 0 (0.0%) | 0 (0.0%) |
| Total | 0 (0.0%) | 0 (0.0%) |
Fertility by Education in Hatfield
| Educational Attainment | Women with Births | Births / 1,000 Women |
| Less than High School | 0 (0.0%) | 0.0 |
| High School Diploma | 0 (0.0%) | 0.0 |
| College or Associate's Degree | 0 (0.0%) | 0.0 |
| Bachelor's Degree | 0 (0.0%) | 0.0 |
| Graduate Degree | 0 (0.0%) | 0.0 |
| Total | 0 (0.0%) | 0.0 |
Fertility by Education by Marriage Status in Hatfield
| Educational Attainment | Married | Unmarried |
| Less than High School | 0 (0.0%) | 0 (0.0%) |
| High School Diploma | 0 (0.0%) | 0 (0.0%) |
| College or Associate's Degree | 0 (0.0%) | 0 (0.0%) |
| Bachelor's Degree | 0 (0.0%) | 0 (0.0%) |
| Graduate Degree | 0 (0.0%) | 0 (0.0%) |
| Total | 0 (0.0%) | 0 (0.0%) |
Employment Characteristics in Hatfield
Employment by Class of Employer in Hatfield
Among the 65 employed individuals in Hatfield, private company employees (28 | 43.1%), local government employees (17 | 26.2%), and self-employed (not incorporated) (11 | 16.9%) make up the most common classes of employment.
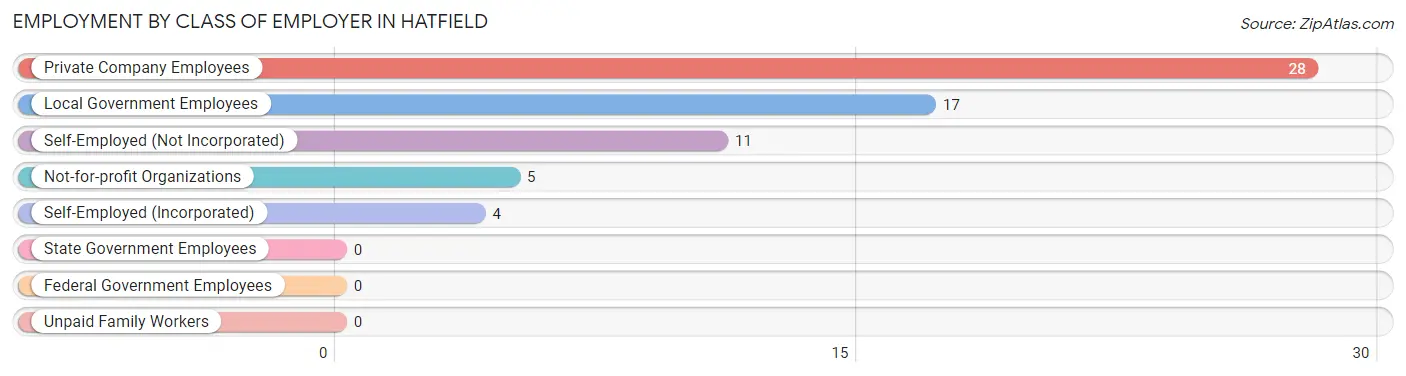
| Employer Class | # Employees | % Employees |
| Private Company Employees | 28 | 43.1% |
| Self-Employed (Incorporated) | 4 | 6.1% |
| Self-Employed (Not Incorporated) | 11 | 16.9% |
| Not-for-profit Organizations | 5 | 7.7% |
| Local Government Employees | 17 | 26.2% |
| State Government Employees | 0 | 0.0% |
| Federal Government Employees | 0 | 0.0% |
| Unpaid Family Workers | 0 | 0.0% |
| Total | 65 | 100.0% |
Employment Status by Age in Hatfield
According to the labor force statistics for Hatfield, out of the total population over 16 years of age (173), 38.7% or 67 individuals are in the labor force, with 3.0% or 2 of them unemployed. The age group with the highest labor force participation rate is 25 to 29 years, with 100.0% or 5 individuals in the labor force. Within the labor force, the 45 to 54 years age range has the highest percentage of unemployed individuals, with 8.7% or 2 of them being unemployed.
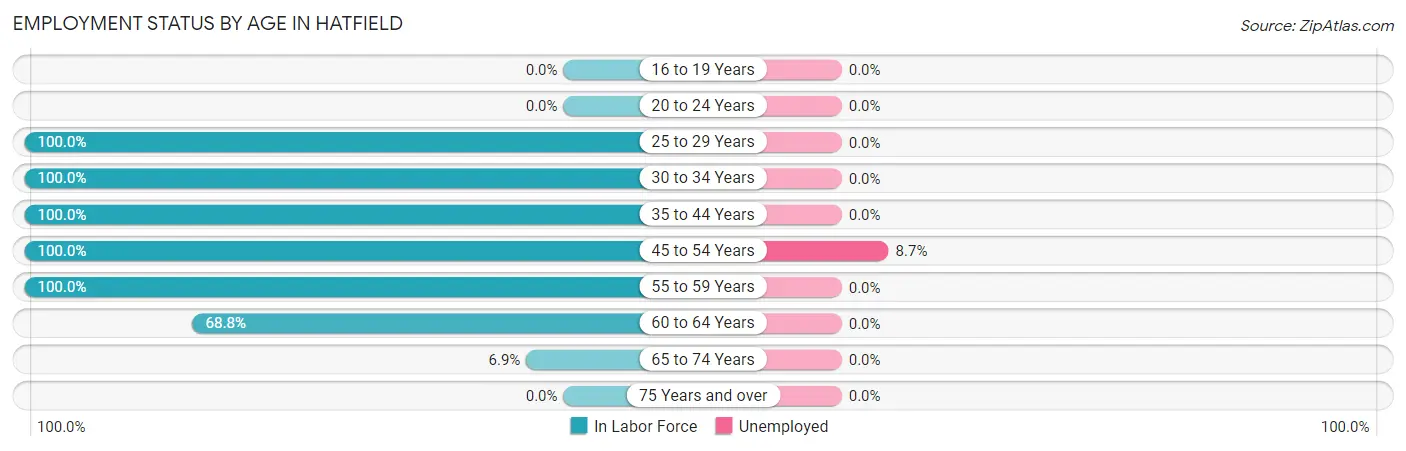
| Age Bracket | In Labor Force | Unemployed |
| 16 to 19 Years | 0 (0.0%) | 0 (0.0%) |
| 20 to 24 Years | 0 (0.0%) | 0 (0.0%) |
| 25 to 29 Years | 5 (100.0%) | 0 (0.0%) |
| 30 to 34 Years | 2 (100.0%) | 0 (0.0%) |
| 35 to 44 Years | 8 (100.0%) | 0 (0.0%) |
| 45 to 54 Years | 23 (100.0%) | 2 (8.7%) |
| 55 to 59 Years | 12 (100.0%) | 0 (0.0%) |
| 60 to 64 Years | 11 (68.8%) | 0 (0.0%) |
| 65 to 74 Years | 6 (6.9%) | 0 (0.0%) |
| 75 Years and over | 0 (0.0%) | 0 (0.0%) |
| Total | 67 (38.7%) | 2 (3.0%) |
Employment Status by Educational Attainment in Hatfield
According to labor force statistics for Hatfield, 92.4% of individuals (61) out of the total population between 25 and 64 years of age (66) are in the labor force, with 3.3% or 2 of them being unemployed. The group with the highest labor force participation rate are those with the educational attainment of less than high school, with 100.0% or 7 individuals in the labor force. Within the labor force, individuals with high school diploma education have the highest percentage of unemployment, with 5.6% or 2 of them being unemployed.
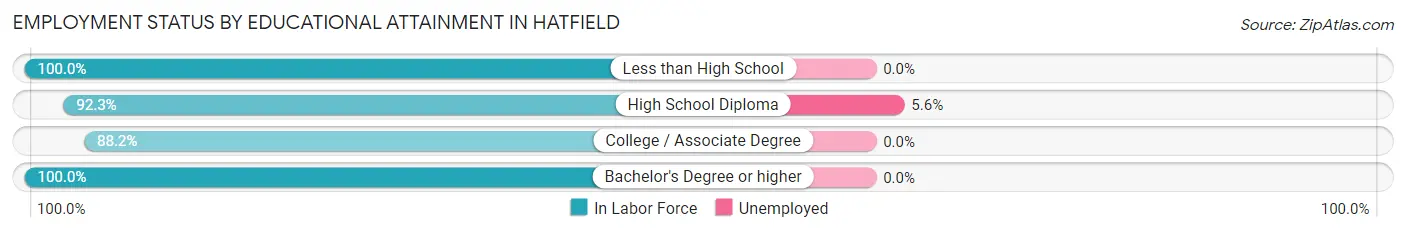
| Educational Attainment | In Labor Force | Unemployed |
| Less than High School | 7 (100.0%) | 0 (0.0%) |
| High School Diploma | 36 (92.3%) | 2 (5.6%) |
| College / Associate Degree | 15 (88.2%) | 0 (0.0%) |
| Bachelor's Degree or higher | 3 (100.0%) | 0 (0.0%) |
| Total | 61 (92.4%) | 2 (3.3%) |
Employment Occupations by Sex in Hatfield
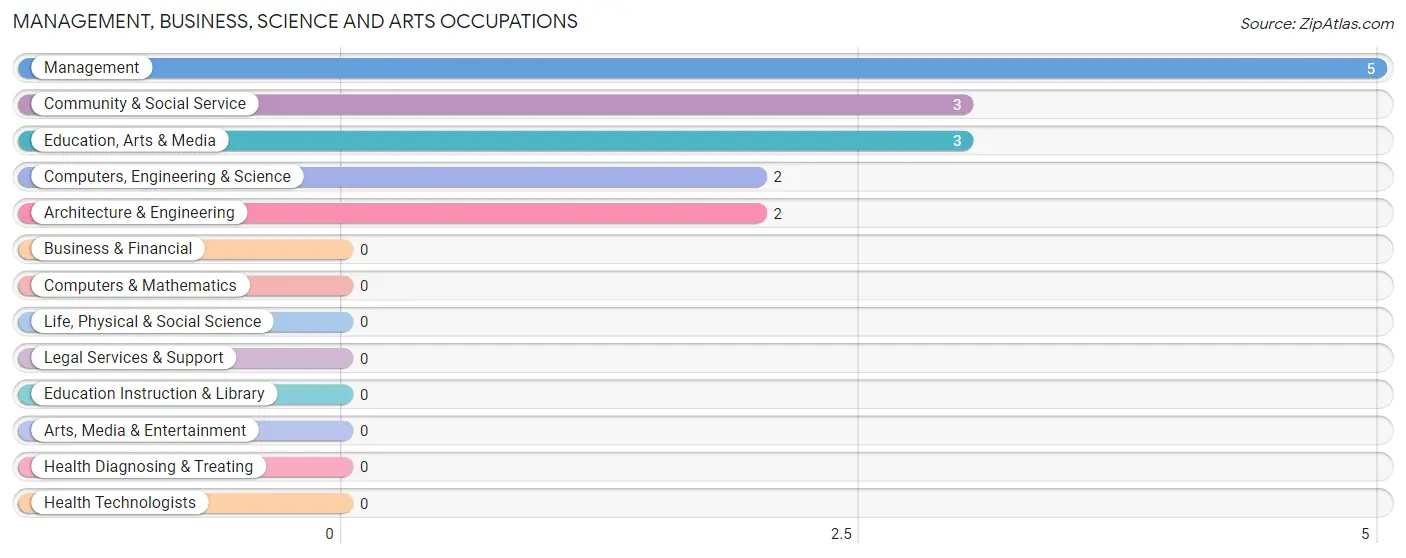
Management, Business, Science and Arts Occupations
The most common Management, Business, Science and Arts occupations in Hatfield are Management (5 | 7.7%), Community & Social Service (3 | 4.6%), Education, Arts & Media (3 | 4.6%), Computers, Engineering & Science (2 | 3.1%), and Architecture & Engineering (2 | 3.1%).
Management, Business, Science and Arts Occupations by Sex
Within the Management, Business, Science and Arts occupations in Hatfield, the most male-oriented occupations are Computers, Engineering & Science (100.0%), Architecture & Engineering (100.0%), and Management (60.0%), while the most female-oriented occupations are Community & Social Service (100.0%), Education, Arts & Media (100.0%), and Management (40.0%).
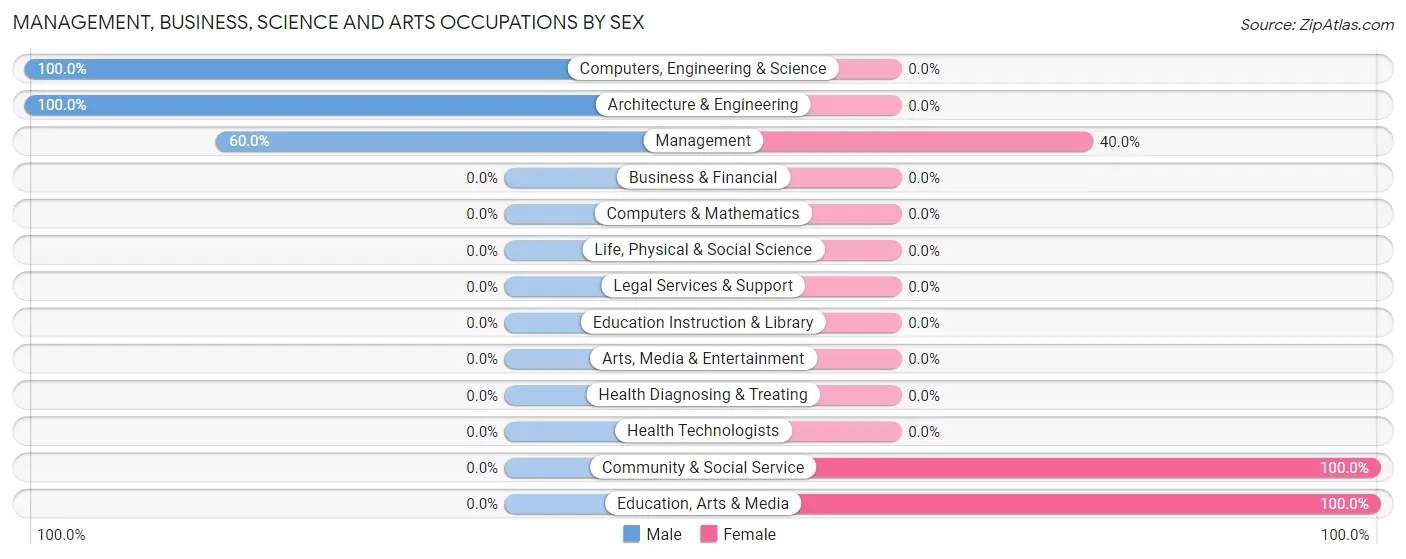
| Occupation | Male | Female |
| Management | 3 (60.0%) | 2 (40.0%) |
| Business & Financial | 0 (0.0%) | 0 (0.0%) |
| Computers, Engineering & Science | 2 (100.0%) | 0 (0.0%) |
| Computers & Mathematics | 0 (0.0%) | 0 (0.0%) |
| Architecture & Engineering | 2 (100.0%) | 0 (0.0%) |
| Life, Physical & Social Science | 0 (0.0%) | 0 (0.0%) |
| Community & Social Service | 0 (0.0%) | 3 (100.0%) |
| Education, Arts & Media | 0 (0.0%) | 3 (100.0%) |
| Legal Services & Support | 0 (0.0%) | 0 (0.0%) |
| Education Instruction & Library | 0 (0.0%) | 0 (0.0%) |
| Arts, Media & Entertainment | 0 (0.0%) | 0 (0.0%) |
| Health Diagnosing & Treating | 0 (0.0%) | 0 (0.0%) |
| Health Technologists | 0 (0.0%) | 0 (0.0%) |
| Total (Category) | 5 (50.0%) | 5 (50.0%) |
| Total (Overall) | 33 (50.8%) | 32 (49.2%) |
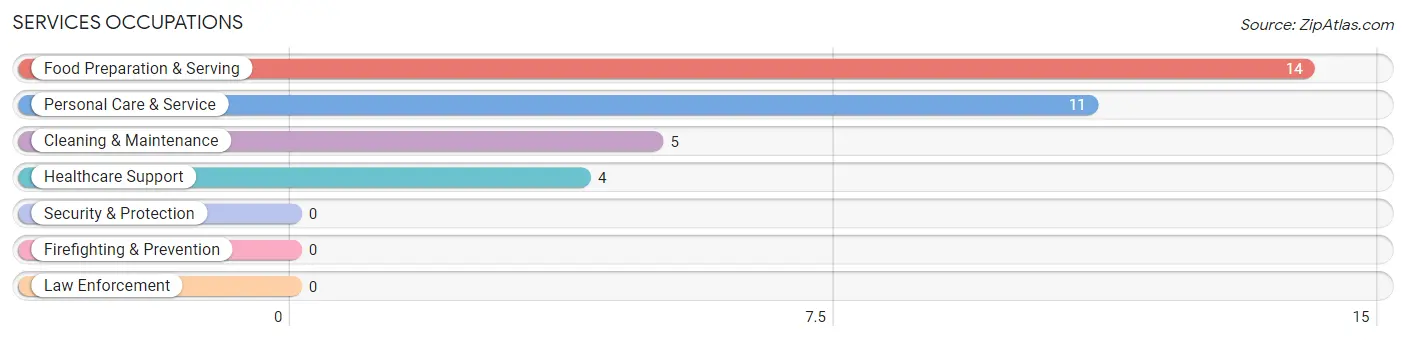
Services Occupations
The most common Services occupations in Hatfield are Food Preparation & Serving (14 | 21.5%), Personal Care & Service (11 | 16.9%), Cleaning & Maintenance (5 | 7.7%), and Healthcare Support (4 | 6.1%).
Services Occupations by Sex
Within the Services occupations in Hatfield, the most male-oriented occupations are Cleaning & Maintenance (100.0%), Personal Care & Service (100.0%), and Food Preparation & Serving (35.7%), while the most female-oriented occupations are Healthcare Support (100.0%), and Food Preparation & Serving (64.3%).
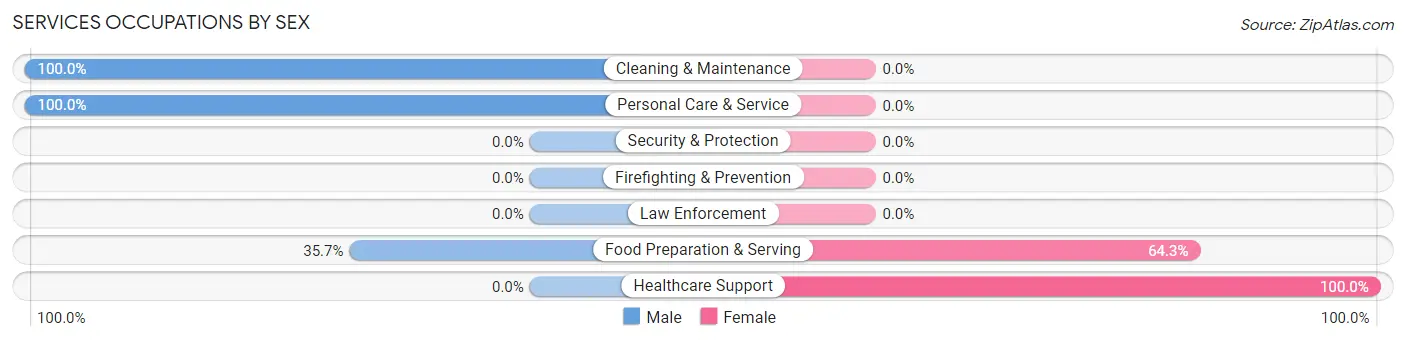
| Occupation | Male | Female |
| Healthcare Support | 0 (0.0%) | 4 (100.0%) |
| Security & Protection | 0 (0.0%) | 0 (0.0%) |
| Firefighting & Prevention | 0 (0.0%) | 0 (0.0%) |
| Law Enforcement | 0 (0.0%) | 0 (0.0%) |
| Food Preparation & Serving | 5 (35.7%) | 9 (64.3%) |
| Cleaning & Maintenance | 5 (100.0%) | 0 (0.0%) |
| Personal Care & Service | 11 (100.0%) | 0 (0.0%) |
| Total (Category) | 21 (61.8%) | 13 (38.2%) |
| Total (Overall) | 33 (50.8%) | 32 (49.2%) |
Sales and Office Occupations
The most common Sales and Office occupations in Hatfield are , and Office & Administration (14 | 21.5%).
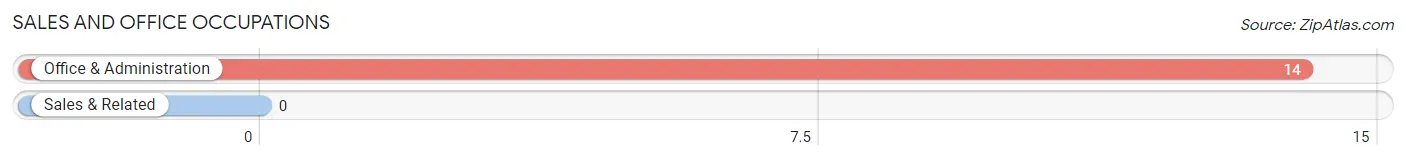
Sales and Office Occupations by Sex
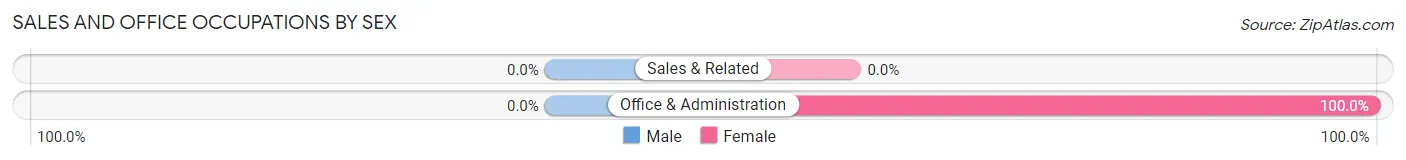
| Occupation | Male | Female |
| Sales & Related | 0 (0.0%) | 0 (0.0%) |
| Office & Administration | 0 (0.0%) | 14 (100.0%) |
| Total (Category) | 0 (0.0%) | 14 (100.0%) |
| Total (Overall) | 33 (50.8%) | 32 (49.2%) |
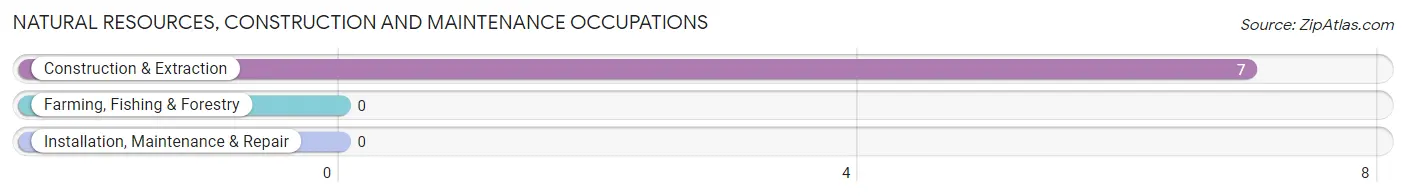
Natural Resources, Construction and Maintenance Occupations
The most common Natural Resources, Construction and Maintenance occupations in Hatfield are , and Construction & Extraction (7 | 10.8%).
Natural Resources, Construction and Maintenance Occupations by Sex
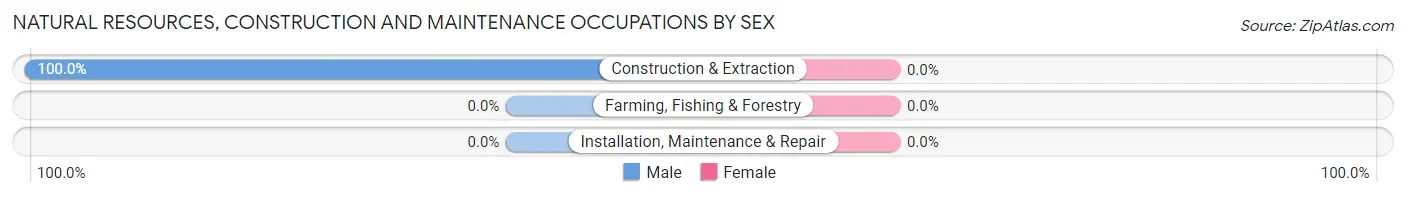
| Occupation | Male | Female |
| Farming, Fishing & Forestry | 0 (0.0%) | 0 (0.0%) |
| Construction & Extraction | 7 (100.0%) | 0 (0.0%) |
| Installation, Maintenance & Repair | 0 (0.0%) | 0 (0.0%) |
| Total (Category) | 7 (100.0%) | 0 (0.0%) |
| Total (Overall) | 33 (50.8%) | 32 (49.2%) |
Production, Transportation and Moving Occupations
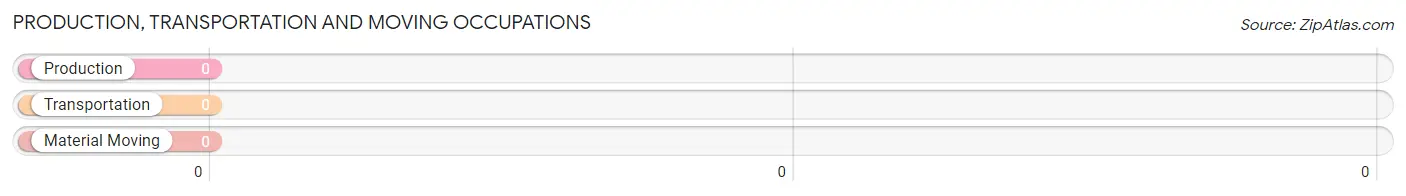
Production, Transportation and Moving Occupations by Sex
| Occupation | Male | Female |
| Production | 0 (0.0%) | 0 (0.0%) |
| Transportation | 0 (0.0%) | 0 (0.0%) |
| Material Moving | 0 (0.0%) | 0 (0.0%) |
| Total (Category) | 0 (0.0%) | 0 (0.0%) |
| Total (Overall) | 33 (50.8%) | 32 (49.2%) |
Employment Industries by Sex in Hatfield
Employment Industries in Hatfield
The major employment industries in Hatfield include Arts, Entertainment & Recreation (16 | 24.6%), Health Care & Social Assistance (15 | 23.1%), Construction (12 | 18.5%), Finance & Insurance (6 | 9.2%), and Transportation & Warehousing (3 | 4.6%).
Employment Industries by Sex in Hatfield
The Hatfield industries that see more men than women are Manufacturing (100.0%), Administrative & Support (100.0%), and Arts, Entertainment & Recreation (100.0%), whereas the industries that tend to have a higher number of women are Transportation & Warehousing (100.0%), Finance & Insurance (100.0%), and Educational Services (100.0%).
| Industry | Male | Female |
| Agriculture, Fishing & Hunting | 0 (0.0%) | 0 (0.0%) |
| Mining, Quarrying, & Extraction | 0 (0.0%) | 0 (0.0%) |
| Construction | 10 (83.3%) | 2 (16.7%) |
| Manufacturing | 2 (100.0%) | 0 (0.0%) |
| Wholesale Trade | 0 (0.0%) | 0 (0.0%) |
| Retail Trade | 0 (0.0%) | 0 (0.0%) |
| Transportation & Warehousing | 0 (0.0%) | 3 (100.0%) |
| Utilities | 0 (0.0%) | 0 (0.0%) |
| Information | 0 (0.0%) | 0 (0.0%) |
| Finance & Insurance | 0 (0.0%) | 6 (100.0%) |
| Real Estate, Rental & Leasing | 0 (0.0%) | 0 (0.0%) |
| Professional & Scientific | 0 (0.0%) | 0 (0.0%) |
| Enterprise Management | 0 (0.0%) | 0 (0.0%) |
| Administrative & Support | 2 (100.0%) | 0 (0.0%) |
| Educational Services | 0 (0.0%) | 3 (100.0%) |
| Health Care & Social Assistance | 3 (20.0%) | 12 (80.0%) |
| Arts, Entertainment & Recreation | 16 (100.0%) | 0 (0.0%) |
| Accommodation & Food Services | 0 (0.0%) | 0 (0.0%) |
| Public Administration | 0 (0.0%) | 3 (100.0%) |
| Total | 33 (50.8%) | 32 (49.2%) |
Education in Hatfield
School Enrollment in Hatfield
The most common levels of schooling among the 9 students in Hatfield are high school (7 | 77.8%), and middle school (2 | 22.2%).
| School Level | # Students | % Students |
| Nursery / Preschool | 0 | 0.0% |
| Kindergarten | 0 | 0.0% |
| Elementary School | 0 | 0.0% |
| Middle School | 2 | 22.2% |
| High School | 7 | 77.8% |
| College / Undergraduate | 0 | 0.0% |
| Graduate / Professional | 0 | 0.0% |
| Total | 9 | 100.0% |
School Enrollment by Age by Funding Source in Hatfield
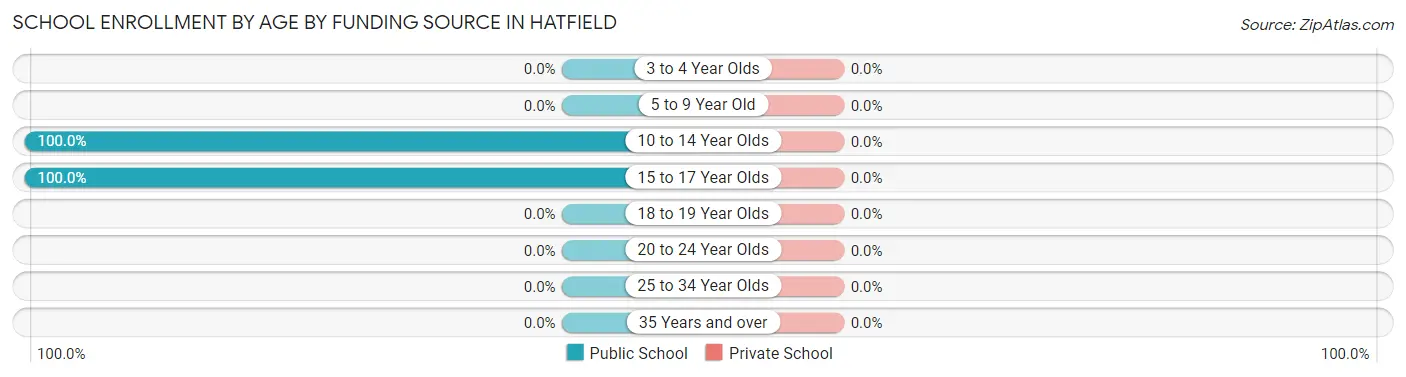
| Age Bracket | Public School | Private School |
| 3 to 4 Year Olds | 0 (0.0%) | 0 (0.0%) |
| 5 to 9 Year Old | 0 (0.0%) | 0 (0.0%) |
| 10 to 14 Year Olds | 2 (100.0%) | 0 (0.0%) |
| 15 to 17 Year Olds | 7 (100.0%) | 0 (0.0%) |
| 18 to 19 Year Olds | 0 (0.0%) | 0 (0.0%) |
| 20 to 24 Year Olds | 0 (0.0%) | 0 (0.0%) |
| 25 to 34 Year Olds | 0 (0.0%) | 0 (0.0%) |
| 35 Years and over | 0 (0.0%) | 0 (0.0%) |
| Total | 9 (100.0%) | 0 (0.0%) |
Educational Attainment by Field of Study in Hatfield
Education (59 | 85.5%), science & technology (4 | 5.8%), business (3 | 4.3%), and arts & humanities (3 | 4.3%) are the most common fields of study among 69 individuals in Hatfield who have obtained a bachelor's degree or higher.
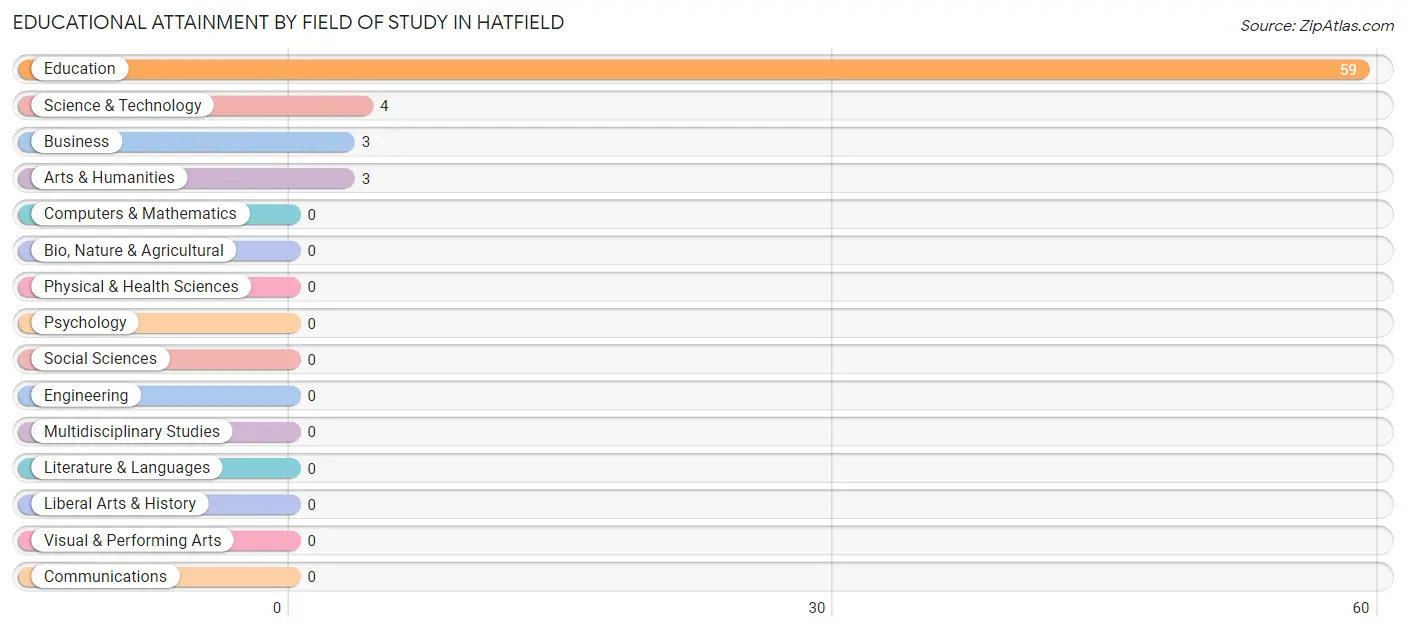
| Field of Study | # Graduates | % Graduates |
| Computers & Mathematics | 0 | 0.0% |
| Bio, Nature & Agricultural | 0 | 0.0% |
| Physical & Health Sciences | 0 | 0.0% |
| Psychology | 0 | 0.0% |
| Social Sciences | 0 | 0.0% |
| Engineering | 0 | 0.0% |
| Multidisciplinary Studies | 0 | 0.0% |
| Science & Technology | 4 | 5.8% |
| Business | 3 | 4.3% |
| Education | 59 | 85.5% |
| Literature & Languages | 0 | 0.0% |
| Liberal Arts & History | 0 | 0.0% |
| Visual & Performing Arts | 0 | 0.0% |
| Communications | 0 | 0.0% |
| Arts & Humanities | 3 | 4.3% |
| Total | 69 | 100.0% |
Transportation & Commute in Hatfield
Vehicle Availability by Sex in Hatfield
The most prevalent vehicle ownership categories in Hatfield are males with 2 vehicles (17, accounting for 51.5%) and females with 2 vehicles (20, making up 53.1%).
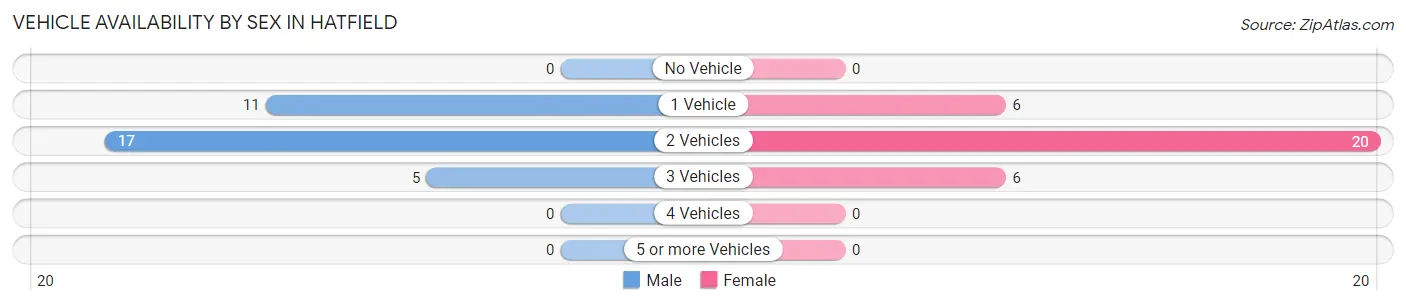
| Vehicles Available | Male | Female |
| No Vehicle | 0 (0.0%) | 0 (0.0%) |
| 1 Vehicle | 11 (33.3%) | 6 (18.8%) |
| 2 Vehicles | 17 (51.5%) | 20 (62.5%) |
| 3 Vehicles | 5 (15.1%) | 6 (18.8%) |
| 4 Vehicles | 0 (0.0%) | 0 (0.0%) |
| 5 or more Vehicles | 0 (0.0%) | 0 (0.0%) |
| Total | 33 (100.0%) | 32 (100.0%) |
Commute Time in Hatfield
The most frequently occuring commute durations in Hatfield are 15 to 19 minutes (32 commuters, 53.3%), 5 to 9 minutes (11 commuters, 18.3%), and 60 to 89 minutes (7 commuters, 11.7%).
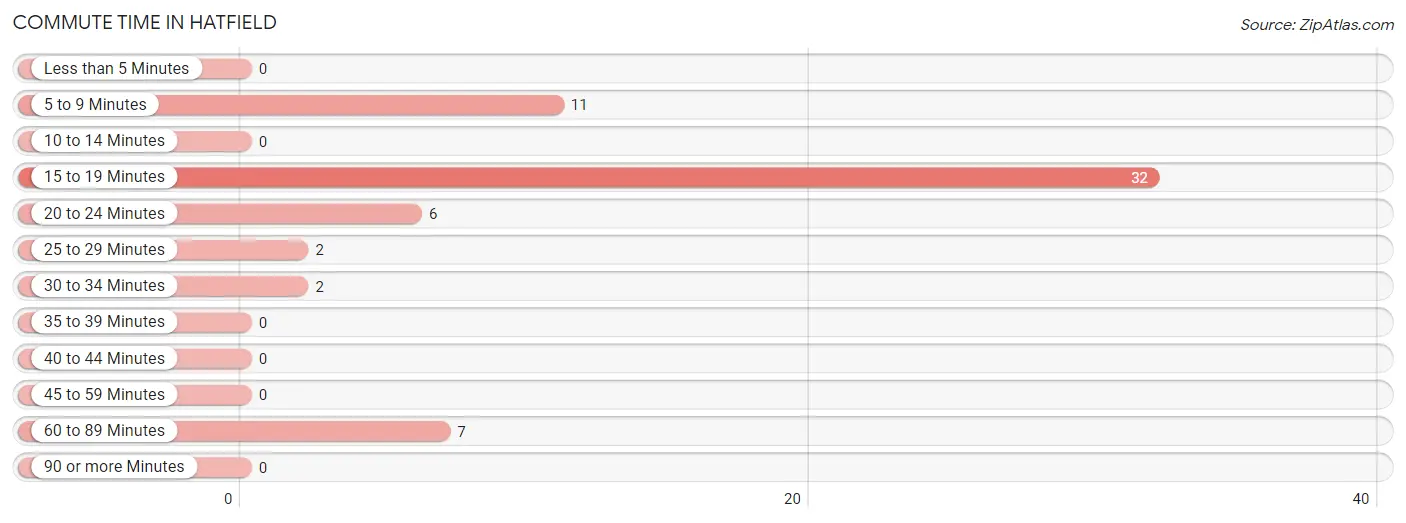
| Commute Time | # Commuters | % Commuters |
| Less than 5 Minutes | 0 | 0.0% |
| 5 to 9 Minutes | 11 | 18.3% |
| 10 to 14 Minutes | 0 | 0.0% |
| 15 to 19 Minutes | 32 | 53.3% |
| 20 to 24 Minutes | 6 | 10.0% |
| 25 to 29 Minutes | 2 | 3.3% |
| 30 to 34 Minutes | 2 | 3.3% |
| 35 to 39 Minutes | 0 | 0.0% |
| 40 to 44 Minutes | 0 | 0.0% |
| 45 to 59 Minutes | 0 | 0.0% |
| 60 to 89 Minutes | 7 | 11.7% |
| 90 or more Minutes | 0 | 0.0% |
Commute Time by Sex in Hatfield
The most common commute times in Hatfield are 15 to 19 minutes (19 commuters, 61.3%) for males and 15 to 19 minutes (13 commuters, 44.8%) for females.
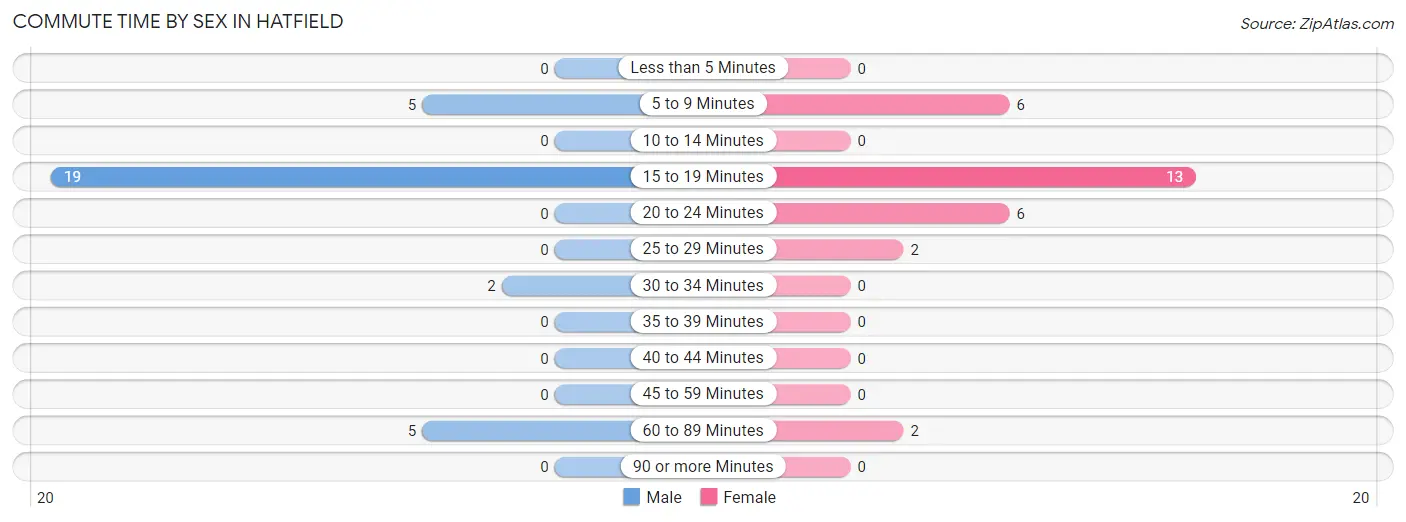
| Commute Time | Male | Female |
| Less than 5 Minutes | 0 (0.0%) | 0 (0.0%) |
| 5 to 9 Minutes | 5 (16.1%) | 6 (20.7%) |
| 10 to 14 Minutes | 0 (0.0%) | 0 (0.0%) |
| 15 to 19 Minutes | 19 (61.3%) | 13 (44.8%) |
| 20 to 24 Minutes | 0 (0.0%) | 6 (20.7%) |
| 25 to 29 Minutes | 0 (0.0%) | 2 (6.9%) |
| 30 to 34 Minutes | 2 (6.5%) | 0 (0.0%) |
| 35 to 39 Minutes | 0 (0.0%) | 0 (0.0%) |
| 40 to 44 Minutes | 0 (0.0%) | 0 (0.0%) |
| 45 to 59 Minutes | 0 (0.0%) | 0 (0.0%) |
| 60 to 89 Minutes | 5 (16.1%) | 2 (6.9%) |
| 90 or more Minutes | 0 (0.0%) | 0 (0.0%) |
Time of Departure to Work by Sex in Hatfield
The most frequent times of departure to work in Hatfield are 12:00 PM to 3:59 PM (14, 45.2%) for males and 8:00 AM to 8:29 AM (6, 20.7%) for females.
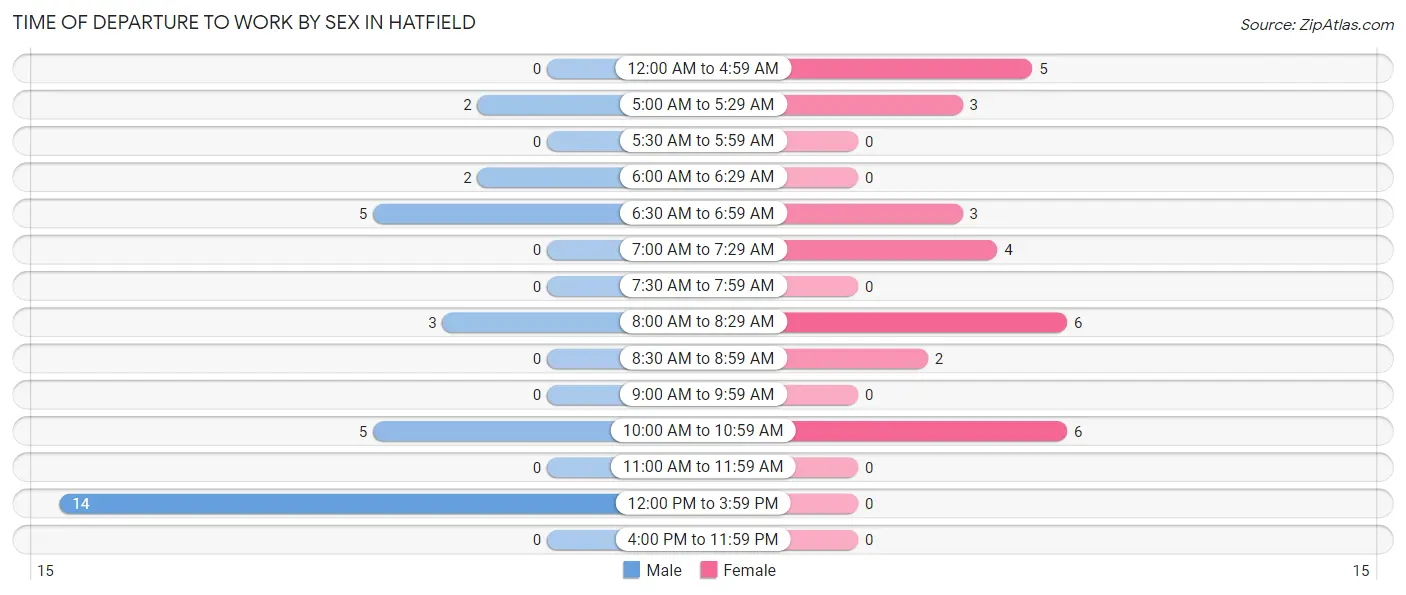
| Time of Departure | Male | Female |
| 12:00 AM to 4:59 AM | 0 (0.0%) | 5 (17.2%) |
| 5:00 AM to 5:29 AM | 2 (6.5%) | 3 (10.3%) |
| 5:30 AM to 5:59 AM | 0 (0.0%) | 0 (0.0%) |
| 6:00 AM to 6:29 AM | 2 (6.5%) | 0 (0.0%) |
| 6:30 AM to 6:59 AM | 5 (16.1%) | 3 (10.3%) |
| 7:00 AM to 7:29 AM | 0 (0.0%) | 4 (13.8%) |
| 7:30 AM to 7:59 AM | 0 (0.0%) | 0 (0.0%) |
| 8:00 AM to 8:29 AM | 3 (9.7%) | 6 (20.7%) |
| 8:30 AM to 8:59 AM | 0 (0.0%) | 2 (6.9%) |
| 9:00 AM to 9:59 AM | 0 (0.0%) | 0 (0.0%) |
| 10:00 AM to 10:59 AM | 5 (16.1%) | 6 (20.7%) |
| 11:00 AM to 11:59 AM | 0 (0.0%) | 0 (0.0%) |
| 12:00 PM to 3:59 PM | 14 (45.2%) | 0 (0.0%) |
| 4:00 PM to 11:59 PM | 0 (0.0%) | 0 (0.0%) |
| Total | 31 (100.0%) | 29 (100.0%) |
Housing Occupancy in Hatfield
Occupancy by Ownership in Hatfield
Of the total 67 dwellings in Hatfield, owner-occupied units account for 60 (89.5%), while renter-occupied units make up 7 (10.4%).
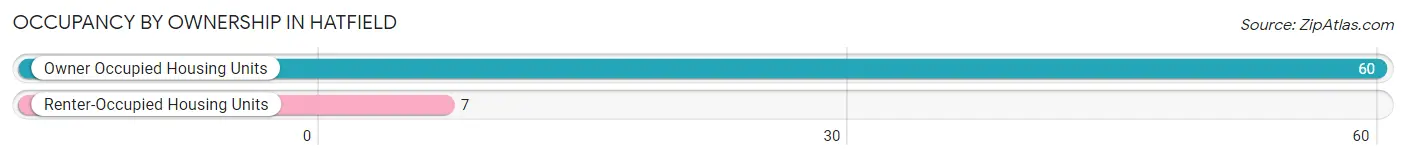
| Occupancy | # Housing Units | % Housing Units |
| Owner Occupied Housing Units | 60 | 89.5% |
| Renter-Occupied Housing Units | 7 | 10.4% |
| Total Occupied Housing Units | 67 | 100.0% |
Occupancy by Household Size in Hatfield
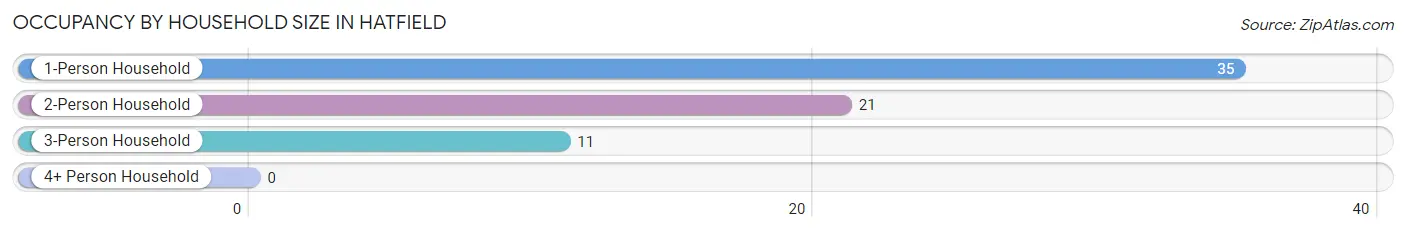
| Household Size | # Housing Units | % Housing Units |
| 1-Person Household | 35 | 52.2% |
| 2-Person Household | 21 | 31.3% |
| 3-Person Household | 11 | 16.4% |
| 4+ Person Household | 0 | 0.0% |
| Total Housing Units | 67 | 100.0% |
Occupancy by Ownership by Household Size in Hatfield
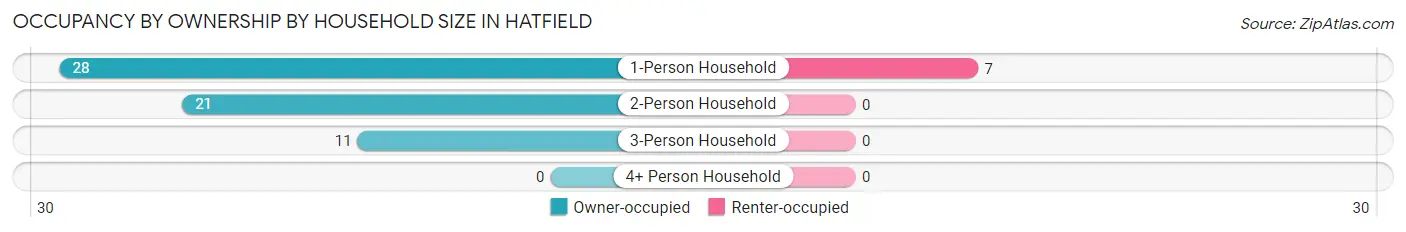
| Household Size | Owner-occupied | Renter-occupied |
| 1-Person Household | 28 (80.0%) | 7 (20.0%) |
| 2-Person Household | 21 (100.0%) | 0 (0.0%) |
| 3-Person Household | 11 (100.0%) | 0 (0.0%) |
| 4+ Person Household | 0 (0.0%) | 0 (0.0%) |
| Total Housing Units | 60 (89.5%) | 7 (10.4%) |
Occupancy by Educational Attainment in Hatfield
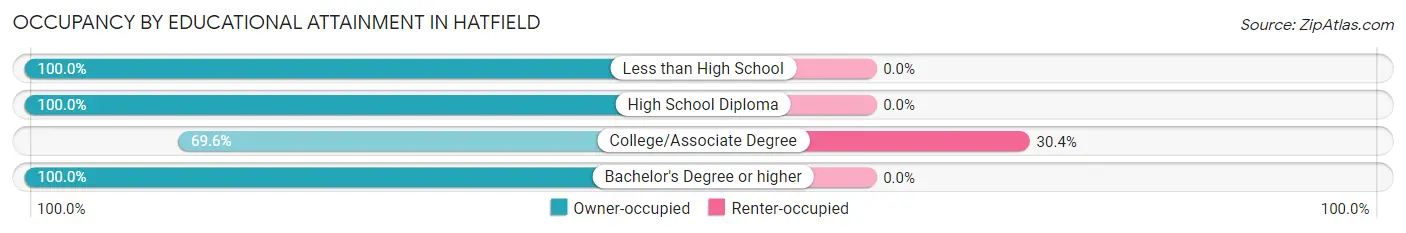
| Household Size | Owner-occupied | Renter-occupied |
| Less than High School | 3 (100.0%) | 0 (0.0%) |
| High School Diploma | 31 (100.0%) | 0 (0.0%) |
| College/Associate Degree | 16 (69.6%) | 7 (30.4%) |
| Bachelor's Degree or higher | 10 (100.0%) | 0 (0.0%) |
Occupancy by Age of Householder in Hatfield
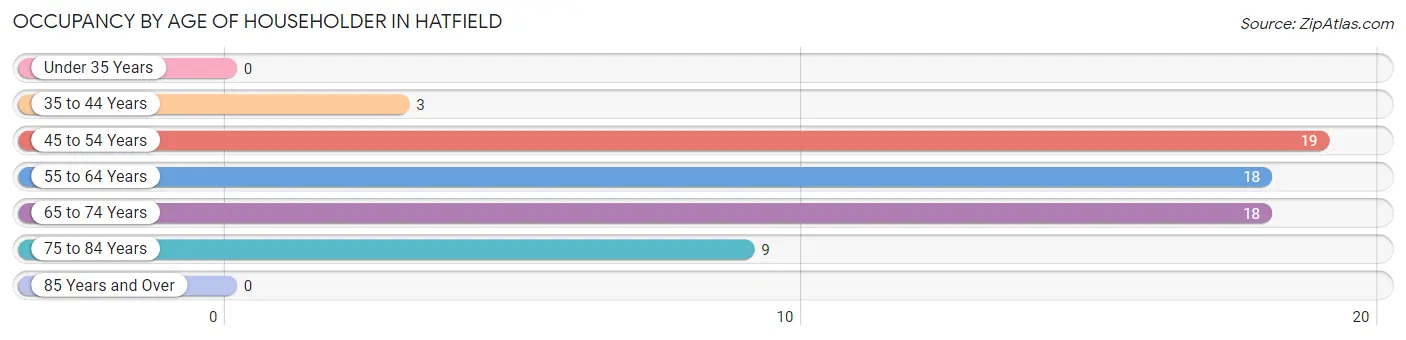
| Age Bracket | # Households | % Households |
| Under 35 Years | 0 | 0.0% |
| 35 to 44 Years | 3 | 4.5% |
| 45 to 54 Years | 19 | 28.4% |
| 55 to 64 Years | 18 | 26.9% |
| 65 to 74 Years | 18 | 26.9% |
| 75 to 84 Years | 9 | 13.4% |
| 85 Years and Over | 0 | 0.0% |
| Total | 67 | 100.0% |
Housing Finances in Hatfield
Median Income by Occupancy in Hatfield
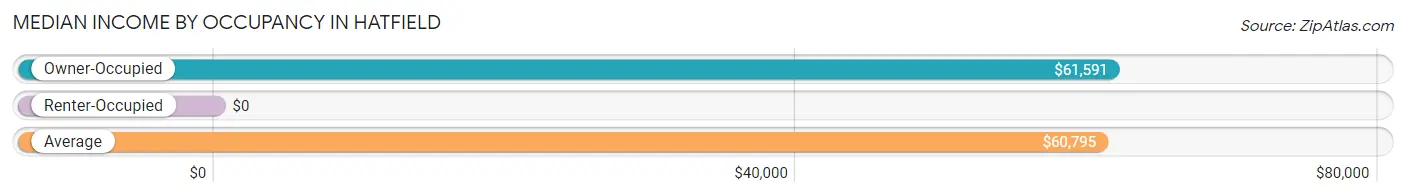
| Occupancy Type | # Households | Median Income |
| Owner-Occupied | 60 (89.5%) | $61,591 |
| Renter-Occupied | 7 (10.4%) | $0 |
| Average | 67 (100.0%) | $60,795 |
Occupancy by Householder Income Bracket in Hatfield
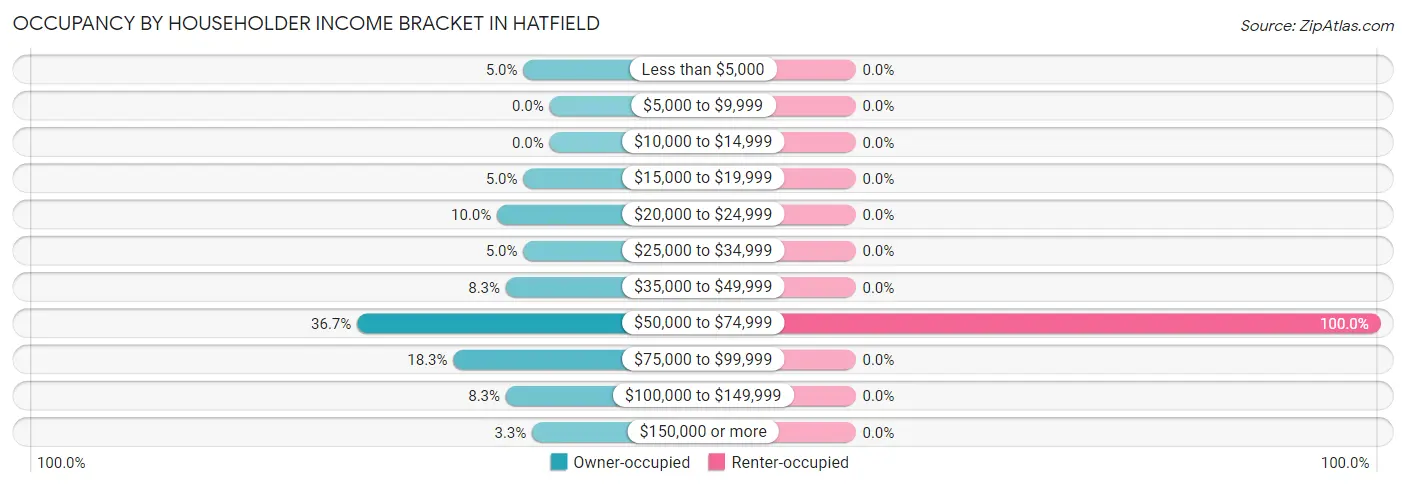
| Income Bracket | Owner-occupied | Renter-occupied |
| Less than $5,000 | 3 (5.0%) | 0 (0.0%) |
| $5,000 to $9,999 | 0 (0.0%) | 0 (0.0%) |
| $10,000 to $14,999 | 0 (0.0%) | 0 (0.0%) |
| $15,000 to $19,999 | 3 (5.0%) | 0 (0.0%) |
| $20,000 to $24,999 | 6 (10.0%) | 0 (0.0%) |
| $25,000 to $34,999 | 3 (5.0%) | 0 (0.0%) |
| $35,000 to $49,999 | 5 (8.3%) | 0 (0.0%) |
| $50,000 to $74,999 | 22 (36.7%) | 7 (100.0%) |
| $75,000 to $99,999 | 11 (18.3%) | 0 (0.0%) |
| $100,000 to $149,999 | 5 (8.3%) | 0 (0.0%) |
| $150,000 or more | 2 (3.3%) | 0 (0.0%) |
| Total | 60 (100.0%) | 7 (100.0%) |
Monthly Housing Cost Tiers in Hatfield
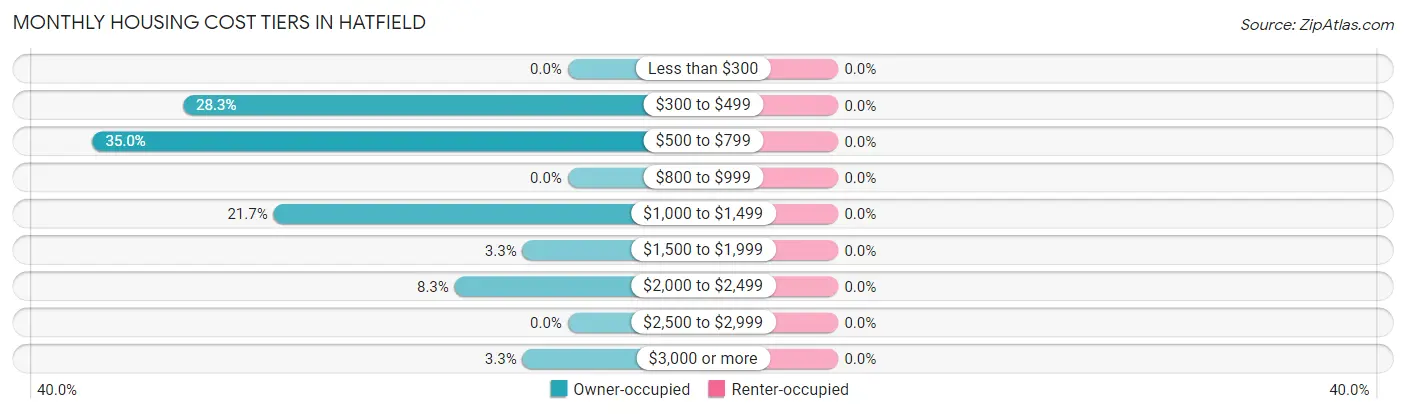
| Monthly Cost | Owner-occupied | Renter-occupied |
| Less than $300 | 0 (0.0%) | 0 (0.0%) |
| $300 to $499 | 17 (28.3%) | 0 (0.0%) |
| $500 to $799 | 21 (35.0%) | 0 (0.0%) |
| $800 to $999 | 0 (0.0%) | 0 (0.0%) |
| $1,000 to $1,499 | 13 (21.7%) | 0 (0.0%) |
| $1,500 to $1,999 | 2 (3.3%) | 0 (0.0%) |
| $2,000 to $2,499 | 5 (8.3%) | 0 (0.0%) |
| $2,500 to $2,999 | 0 (0.0%) | 0 (0.0%) |
| $3,000 or more | 2 (3.3%) | 0 (0.0%) |
| Total | 60 (100.0%) | 7 (100.0%) |
Physical Housing Characteristics in Hatfield
Housing Structures in Hatfield
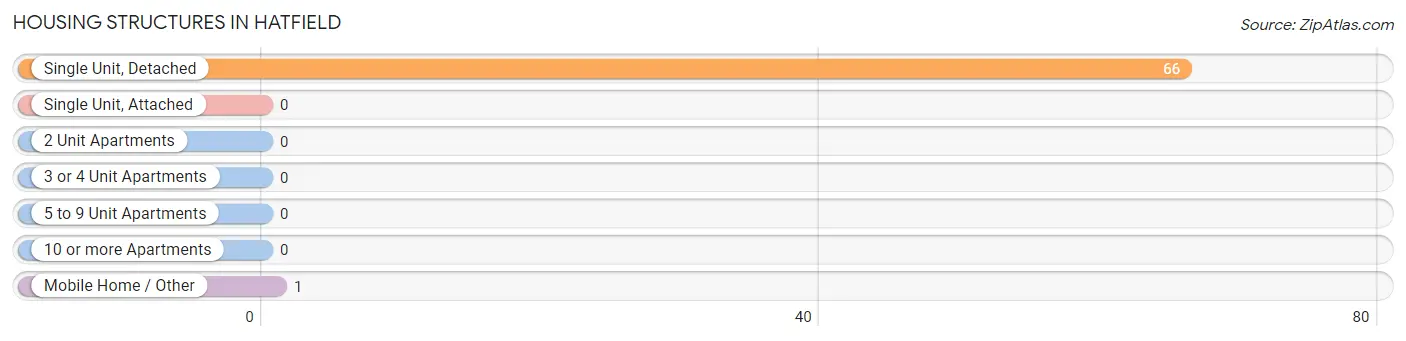
| Structure Type | # Housing Units | % Housing Units |
| Single Unit, Detached | 66 | 98.5% |
| Single Unit, Attached | 0 | 0.0% |
| 2 Unit Apartments | 0 | 0.0% |
| 3 or 4 Unit Apartments | 0 | 0.0% |
| 5 to 9 Unit Apartments | 0 | 0.0% |
| 10 or more Apartments | 0 | 0.0% |
| Mobile Home / Other | 1 | 1.5% |
| Total | 67 | 100.0% |
Housing Structures by Occupancy in Hatfield
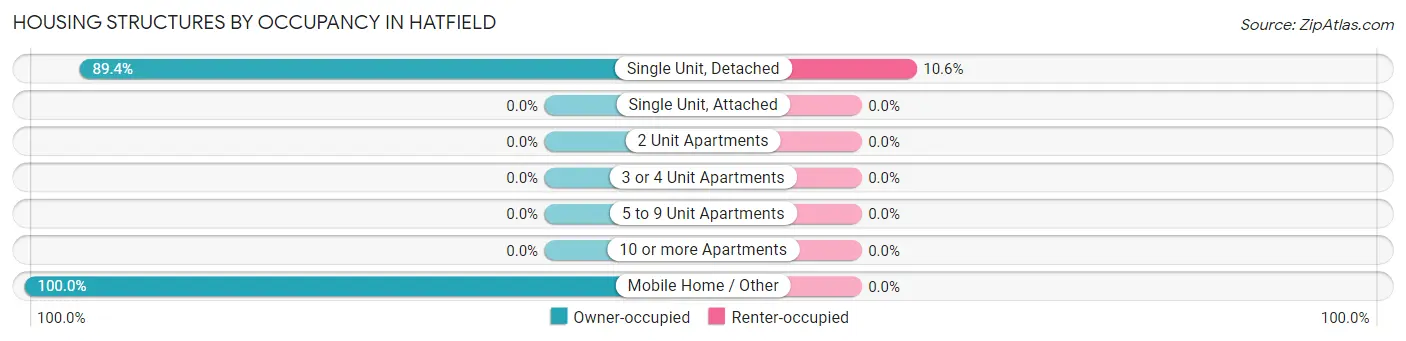
| Structure Type | Owner-occupied | Renter-occupied |
| Single Unit, Detached | 59 (89.4%) | 7 (10.6%) |
| Single Unit, Attached | 0 (0.0%) | 0 (0.0%) |
| 2 Unit Apartments | 0 (0.0%) | 0 (0.0%) |
| 3 or 4 Unit Apartments | 0 (0.0%) | 0 (0.0%) |
| 5 to 9 Unit Apartments | 0 (0.0%) | 0 (0.0%) |
| 10 or more Apartments | 0 (0.0%) | 0 (0.0%) |
| Mobile Home / Other | 1 (100.0%) | 0 (0.0%) |
| Total | 60 (89.5%) | 7 (10.4%) |
Housing Structures by Number of Rooms in Hatfield
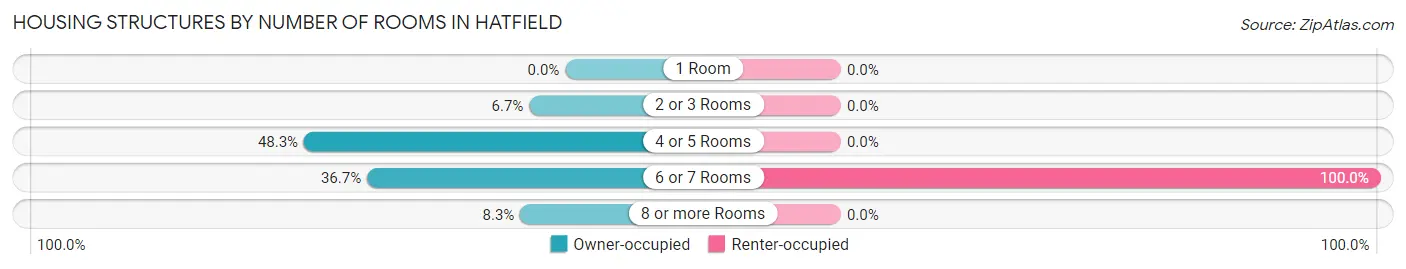
| Number of Rooms | Owner-occupied | Renter-occupied |
| 1 Room | 0 (0.0%) | 0 (0.0%) |
| 2 or 3 Rooms | 4 (6.7%) | 0 (0.0%) |
| 4 or 5 Rooms | 29 (48.3%) | 0 (0.0%) |
| 6 or 7 Rooms | 22 (36.7%) | 7 (100.0%) |
| 8 or more Rooms | 5 (8.3%) | 0 (0.0%) |
| Total | 60 (100.0%) | 7 (100.0%) |
Housing Structure by Heating Type in Hatfield
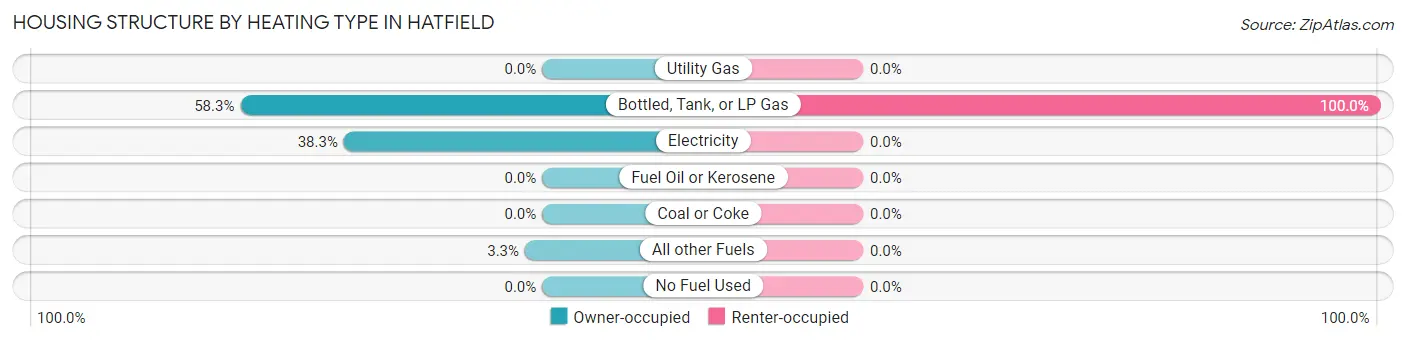
| Heating Type | Owner-occupied | Renter-occupied |
| Utility Gas | 0 (0.0%) | 0 (0.0%) |
| Bottled, Tank, or LP Gas | 35 (58.3%) | 7 (100.0%) |
| Electricity | 23 (38.3%) | 0 (0.0%) |
| Fuel Oil or Kerosene | 0 (0.0%) | 0 (0.0%) |
| Coal or Coke | 0 (0.0%) | 0 (0.0%) |
| All other Fuels | 2 (3.3%) | 0 (0.0%) |
| No Fuel Used | 0 (0.0%) | 0 (0.0%) |
| Total | 60 (100.0%) | 7 (100.0%) |
Household Vehicle Usage in Hatfield
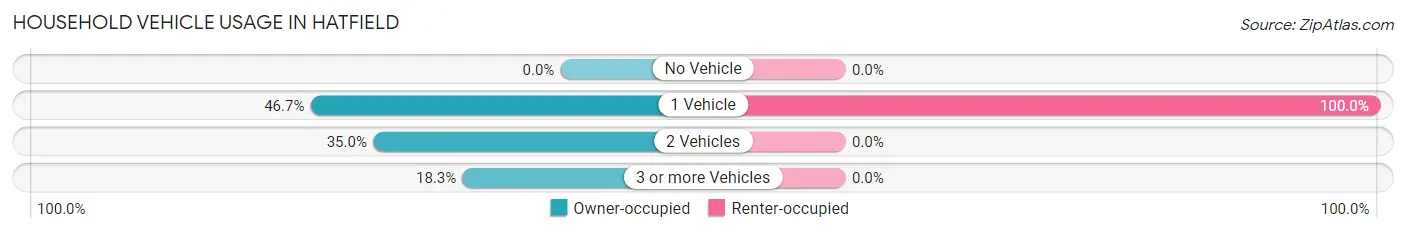
| Vehicles per Household | Owner-occupied | Renter-occupied |
| No Vehicle | 0 (0.0%) | 0 (0.0%) |
| 1 Vehicle | 28 (46.7%) | 7 (100.0%) |
| 2 Vehicles | 21 (35.0%) | 0 (0.0%) |
| 3 or more Vehicles | 11 (18.3%) | 0 (0.0%) |
| Total | 60 (100.0%) | 7 (100.0%) |
Real Estate & Mortgages in Hatfield
Real Estate and Mortgage Overview in Hatfield
| Characteristic | Without Mortgage | With Mortgage |
| Housing Units | 37 | 23 |
| Median Property Value | $204,200 | $187,500 |
| Median Household Income | $60,795 | $0 |
| Monthly Housing Costs | $613 | $2 |
| Real Estate Taxes | - | - |
Property Value by Mortgage Status in Hatfield
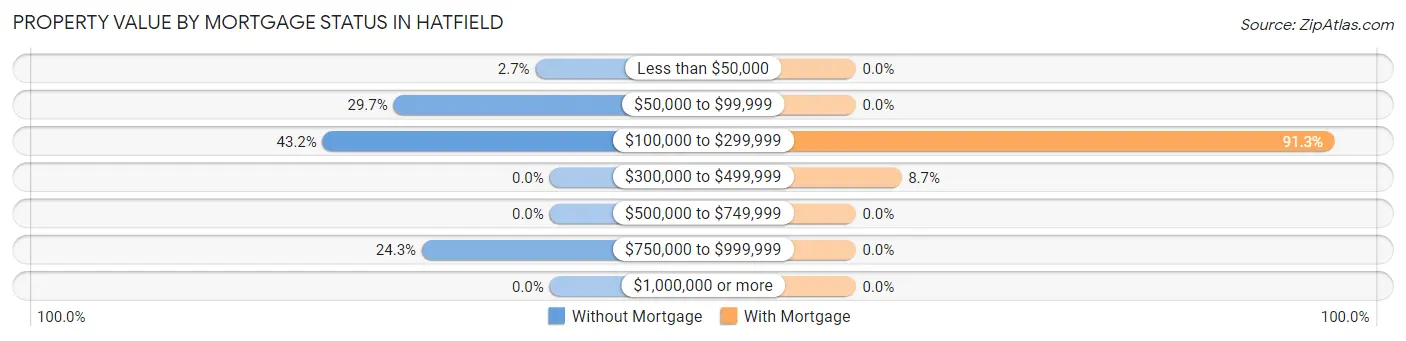
| Property Value | Without Mortgage | With Mortgage |
| Less than $50,000 | 1 (2.7%) | 0 (0.0%) |
| $50,000 to $99,999 | 11 (29.7%) | 0 (0.0%) |
| $100,000 to $299,999 | 16 (43.2%) | 21 (91.3%) |
| $300,000 to $499,999 | 0 (0.0%) | 2 (8.7%) |
| $500,000 to $749,999 | 0 (0.0%) | 0 (0.0%) |
| $750,000 to $999,999 | 9 (24.3%) | 0 (0.0%) |
| $1,000,000 or more | 0 (0.0%) | 0 (0.0%) |
| Total | 37 (100.0%) | 23 (100.0%) |
Household Income by Mortgage Status in Hatfield
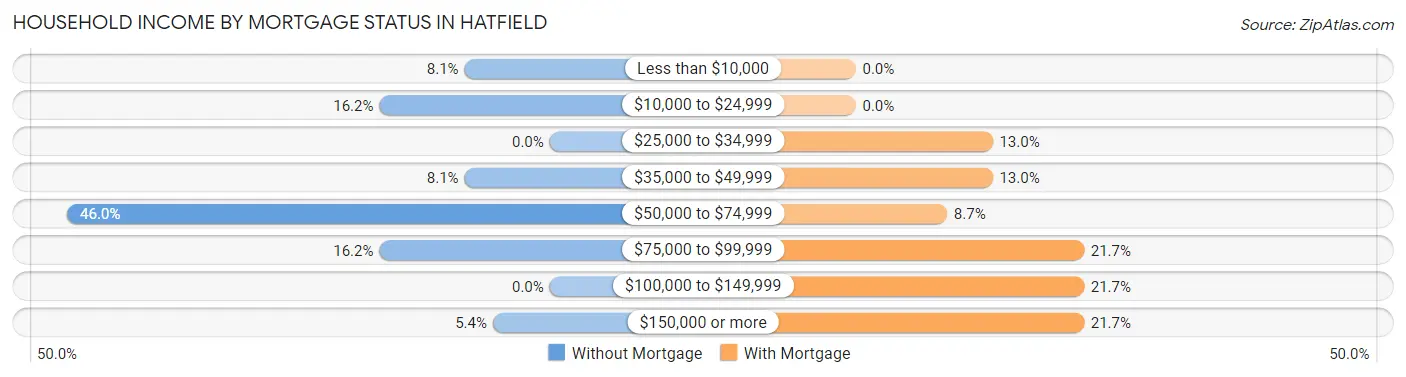
| Household Income | Without Mortgage | With Mortgage |
| Less than $10,000 | 3 (8.1%) | 0 (0.0%) |
| $10,000 to $24,999 | 6 (16.2%) | 0 (0.0%) |
| $25,000 to $34,999 | 0 (0.0%) | 3 (13.0%) |
| $35,000 to $49,999 | 3 (8.1%) | 3 (13.0%) |
| $50,000 to $74,999 | 17 (46.0%) | 2 (8.7%) |
| $75,000 to $99,999 | 6 (16.2%) | 5 (21.7%) |
| $100,000 to $149,999 | 0 (0.0%) | 5 (21.7%) |
| $150,000 or more | 2 (5.4%) | 5 (21.7%) |
| Total | 37 (100.0%) | 23 (100.0%) |
Property Value to Household Income Ratio in Hatfield
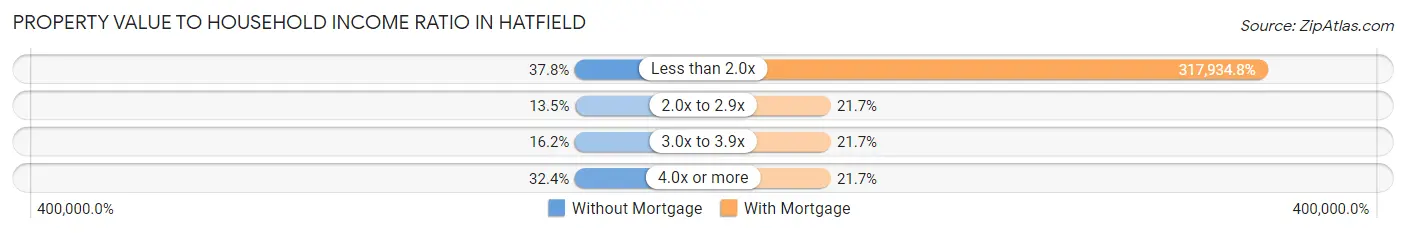
| Value-to-Income Ratio | Without Mortgage | With Mortgage |
| Less than 2.0x | 14 (37.8%) | 73,125 (317,934.8%) |
| 2.0x to 2.9x | 5 (13.5%) | 5 (21.7%) |
| 3.0x to 3.9x | 6 (16.2%) | 5 (21.7%) |
| 4.0x or more | 12 (32.4%) | 5 (21.7%) |
| Total | 37 (100.0%) | 23 (100.0%) |
Real Estate Taxes by Mortgage Status in Hatfield
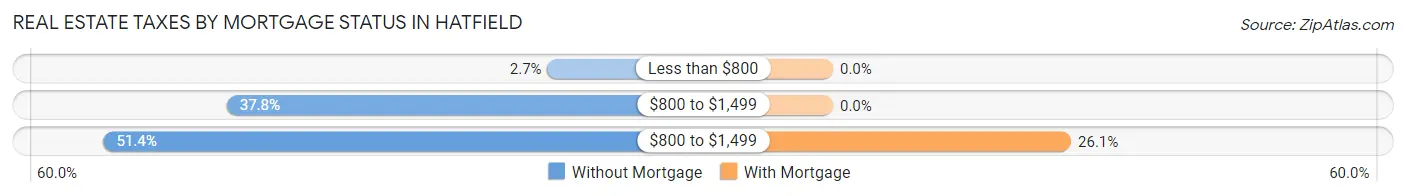
| Property Taxes | Without Mortgage | With Mortgage |
| Less than $800 | 1 (2.7%) | 0 (0.0%) |
| $800 to $1,499 | 14 (37.8%) | 0 (0.0%) |
| $800 to $1,499 | 19 (51.3%) | 6 (26.1%) |
| Total | 37 (100.0%) | 23 (100.0%) |
Health & Disability in Hatfield
Health Insurance Coverage by Age in Hatfield
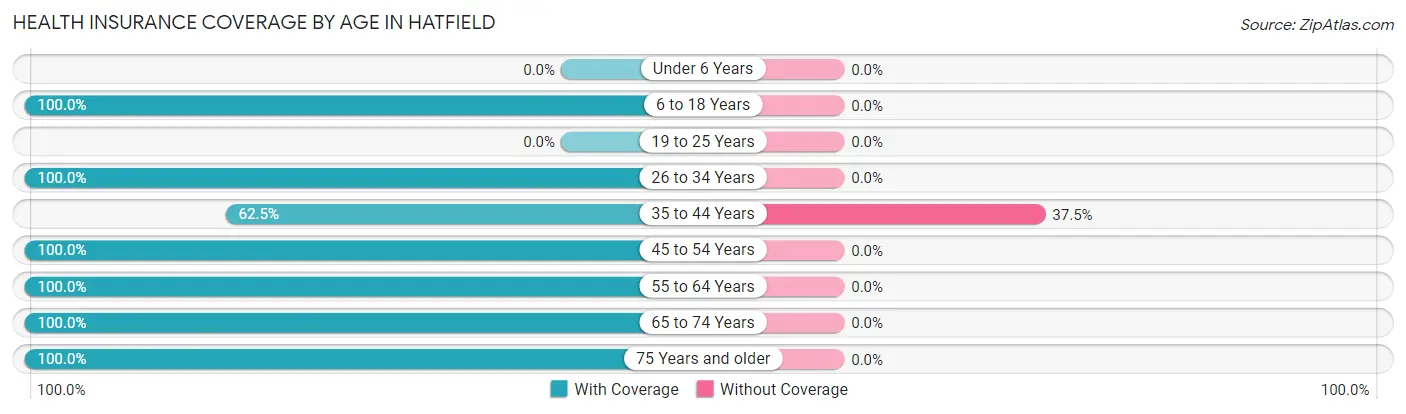
| Age Bracket | With Coverage | Without Coverage |
| Under 6 Years | 0 (0.0%) | 0 (0.0%) |
| 6 to 18 Years | 9 (100.0%) | 0 (0.0%) |
| 19 to 25 Years | 0 (0.0%) | 0 (0.0%) |
| 26 to 34 Years | 7 (100.0%) | 0 (0.0%) |
| 35 to 44 Years | 5 (62.5%) | 3 (37.5%) |
| 45 to 54 Years | 23 (100.0%) | 0 (0.0%) |
| 55 to 64 Years | 28 (100.0%) | 0 (0.0%) |
| 65 to 74 Years | 87 (100.0%) | 0 (0.0%) |
| 75 Years and older | 13 (100.0%) | 0 (0.0%) |
| Total | 172 (98.3%) | 3 (1.7%) |
Health Insurance Coverage by Citizenship Status in Hatfield
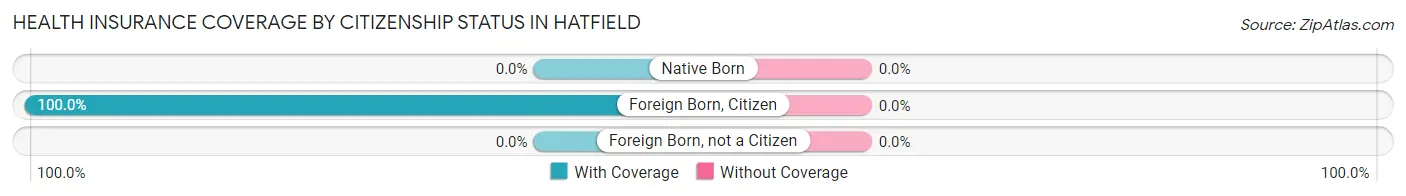
| Citizenship Status | With Coverage | Without Coverage |
| Native Born | 0 (0.0%) | 0 (0.0%) |
| Foreign Born, Citizen | 9 (100.0%) | 0 (0.0%) |
| Foreign Born, not a Citizen | 0 (0.0%) | 0 (0.0%) |
Health Insurance Coverage by Household Income in Hatfield
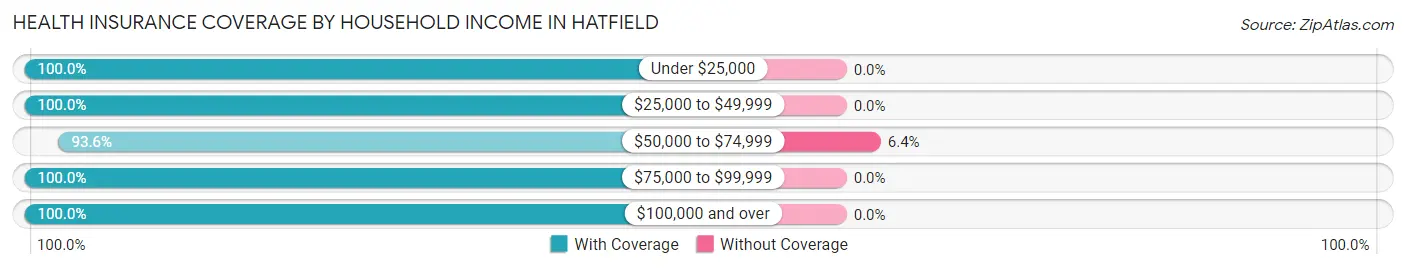
| Household Income | With Coverage | Without Coverage |
| Under $25,000 | 15 (100.0%) | 0 (0.0%) |
| $25,000 to $49,999 | 14 (100.0%) | 0 (0.0%) |
| $50,000 to $74,999 | 44 (93.6%) | 3 (6.4%) |
| $75,000 to $99,999 | 84 (100.0%) | 0 (0.0%) |
| $100,000 and over | 15 (100.0%) | 0 (0.0%) |
Public vs Private Health Insurance Coverage by Age in Hatfield
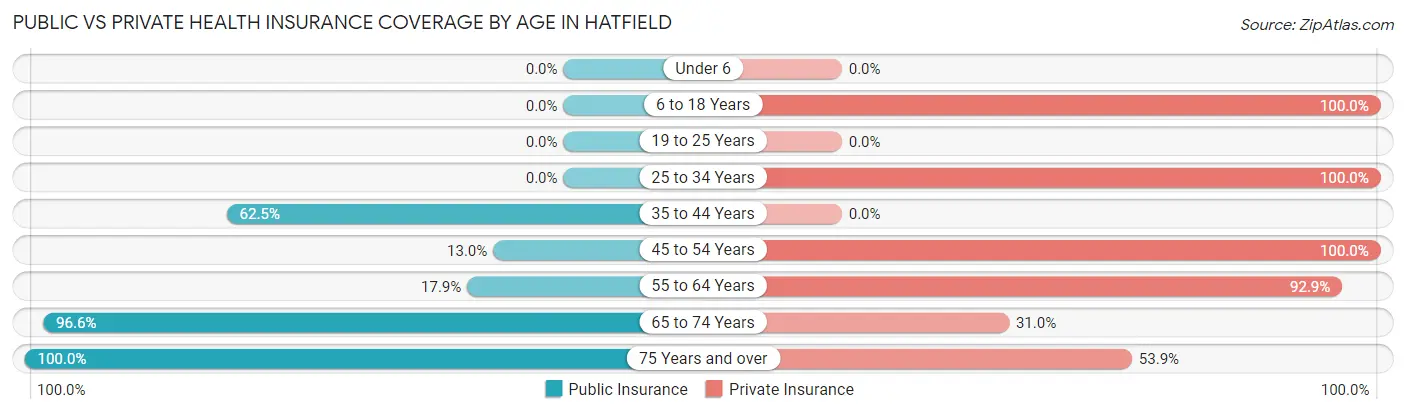
| Age Bracket | Public Insurance | Private Insurance |
| Under 6 | 0 (0.0%) | 0 (0.0%) |
| 6 to 18 Years | 0 (0.0%) | 9 (100.0%) |
| 19 to 25 Years | 0 (0.0%) | 0 (0.0%) |
| 25 to 34 Years | 0 (0.0%) | 7 (100.0%) |
| 35 to 44 Years | 5 (62.5%) | 0 (0.0%) |
| 45 to 54 Years | 3 (13.0%) | 23 (100.0%) |
| 55 to 64 Years | 5 (17.9%) | 26 (92.9%) |
| 65 to 74 Years | 84 (96.6%) | 27 (31.0%) |
| 75 Years and over | 13 (100.0%) | 7 (53.8%) |
| Total | 110 (62.9%) | 99 (56.6%) |
Disability Status by Sex by Age in Hatfield
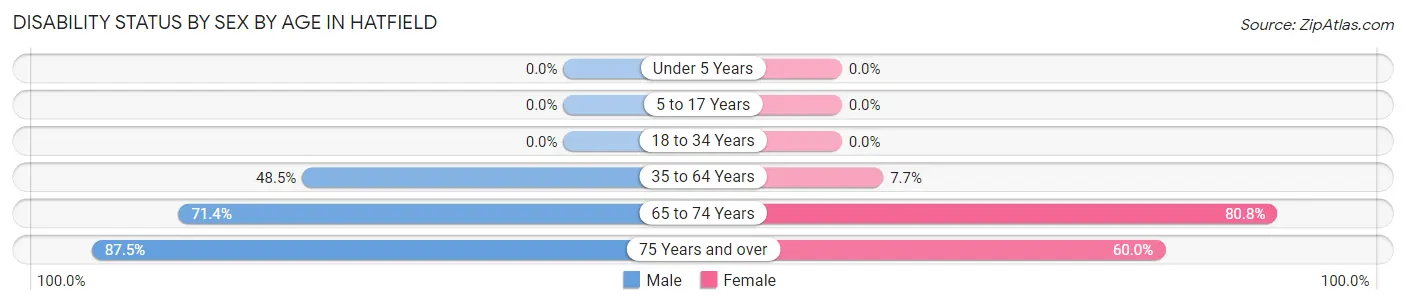
| Age Bracket | Male | Female |
| Under 5 Years | 0 (0.0%) | 0 (0.0%) |
| 5 to 17 Years | 0 (0.0%) | 0 (0.0%) |
| 18 to 34 Years | 0 (0.0%) | 0 (0.0%) |
| 35 to 64 Years | 16 (48.5%) | 2 (7.7%) |
| 65 to 74 Years | 10 (71.4%) | 59 (80.8%) |
| 75 Years and over | 7 (87.5%) | 3 (60.0%) |
Disability Class by Sex by Age in Hatfield
Disability Class: Hearing Difficulty
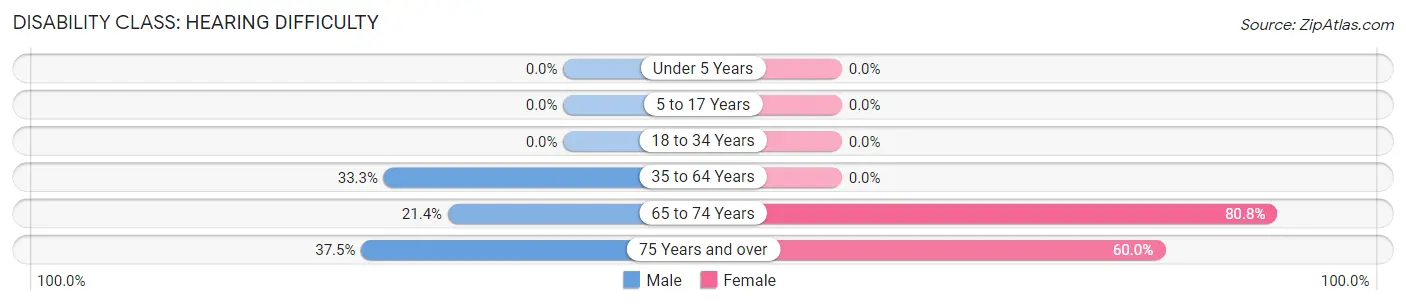
| Age Bracket | Male | Female |
| Under 5 Years | 0 (0.0%) | 0 (0.0%) |
| 5 to 17 Years | 0 (0.0%) | 0 (0.0%) |
| 18 to 34 Years | 0 (0.0%) | 0 (0.0%) |
| 35 to 64 Years | 11 (33.3%) | 0 (0.0%) |
| 65 to 74 Years | 3 (21.4%) | 59 (80.8%) |
| 75 Years and over | 3 (37.5%) | 3 (60.0%) |
Disability Class: Vision Difficulty
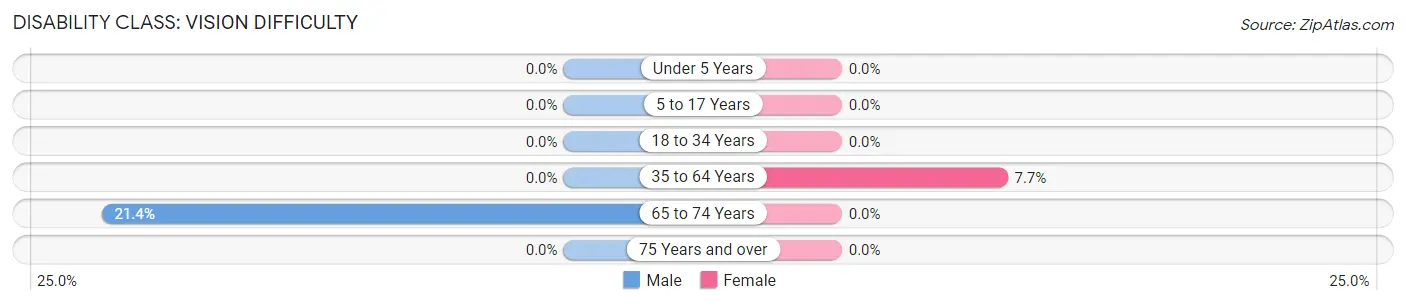
| Age Bracket | Male | Female |
| Under 5 Years | 0 (0.0%) | 0 (0.0%) |
| 5 to 17 Years | 0 (0.0%) | 0 (0.0%) |
| 18 to 34 Years | 0 (0.0%) | 0 (0.0%) |
| 35 to 64 Years | 0 (0.0%) | 2 (7.7%) |
| 65 to 74 Years | 3 (21.4%) | 0 (0.0%) |
| 75 Years and over | 0 (0.0%) | 0 (0.0%) |
Disability Class: Cognitive Difficulty
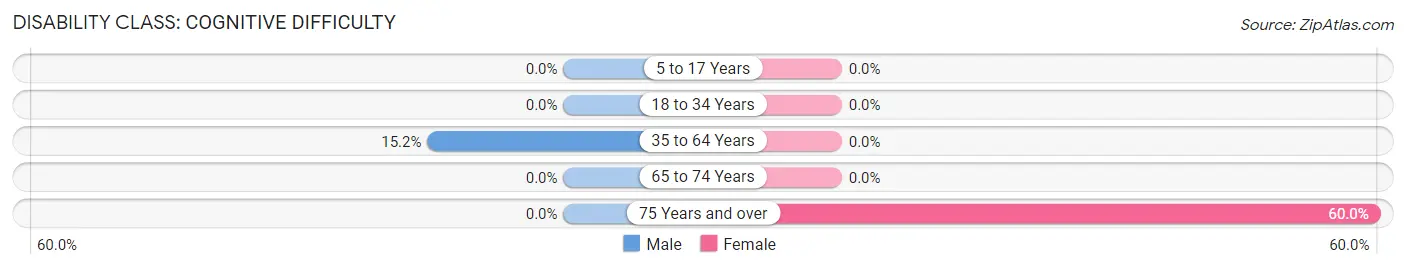
| Age Bracket | Male | Female |
| 5 to 17 Years | 0 (0.0%) | 0 (0.0%) |
| 18 to 34 Years | 0 (0.0%) | 0 (0.0%) |
| 35 to 64 Years | 5 (15.1%) | 0 (0.0%) |
| 65 to 74 Years | 0 (0.0%) | 0 (0.0%) |
| 75 Years and over | 0 (0.0%) | 3 (60.0%) |
Disability Class: Ambulatory Difficulty
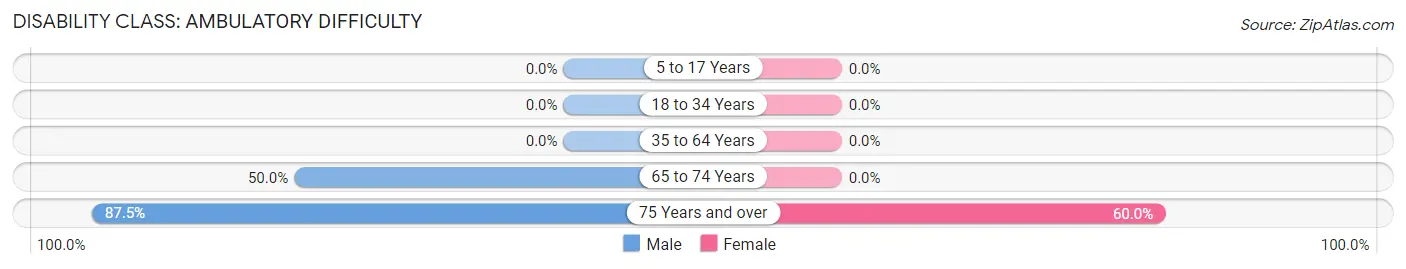
| Age Bracket | Male | Female |
| 5 to 17 Years | 0 (0.0%) | 0 (0.0%) |
| 18 to 34 Years | 0 (0.0%) | 0 (0.0%) |
| 35 to 64 Years | 0 (0.0%) | 0 (0.0%) |
| 65 to 74 Years | 7 (50.0%) | 0 (0.0%) |
| 75 Years and over | 7 (87.5%) | 3 (60.0%) |
Disability Class: Self-Care Difficulty
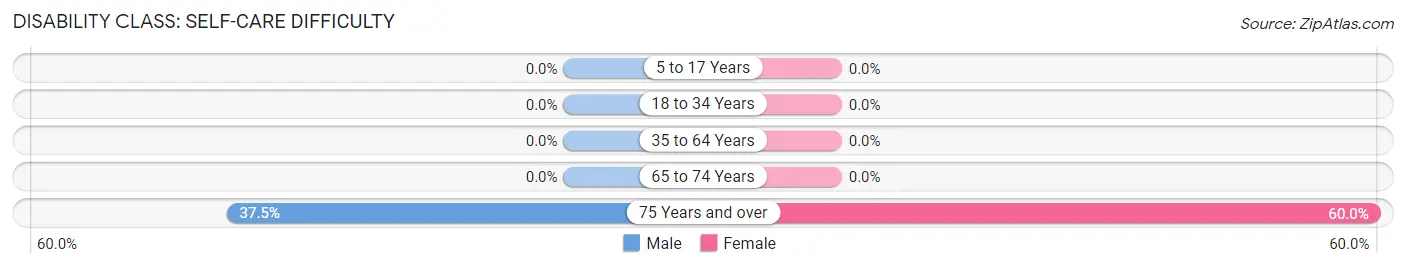
| Age Bracket | Male | Female |
| 5 to 17 Years | 0 (0.0%) | 0 (0.0%) |
| 18 to 34 Years | 0 (0.0%) | 0 (0.0%) |
| 35 to 64 Years | 0 (0.0%) | 0 (0.0%) |
| 65 to 74 Years | 0 (0.0%) | 0 (0.0%) |
| 75 Years and over | 3 (37.5%) | 3 (60.0%) |
Technology Access in Hatfield
Computing Device Access in Hatfield
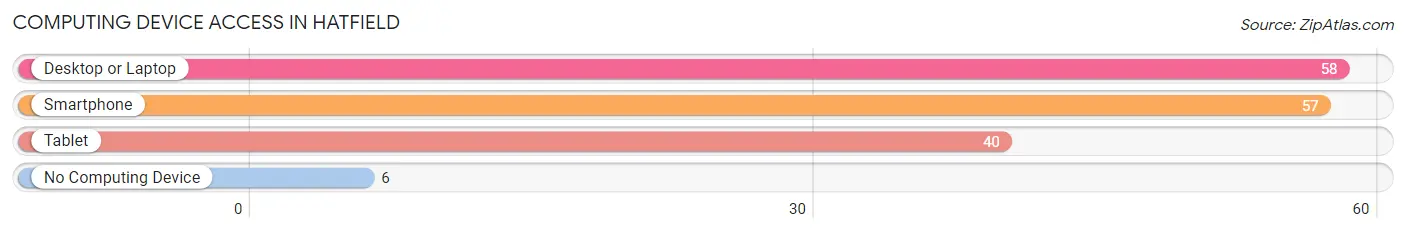
| Device Type | # Households | % Households |
| Desktop or Laptop | 58 | 86.6% |
| Smartphone | 57 | 85.1% |
| Tablet | 40 | 59.7% |
| No Computing Device | 6 | 9.0% |
| Total | 67 | 100.0% |
Internet Access in Hatfield
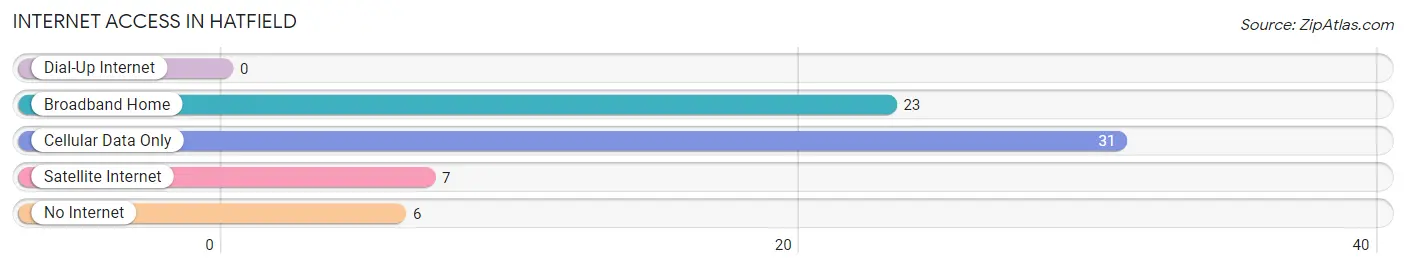
| Internet Type | # Households | % Households |
| Dial-Up Internet | 0 | 0.0% |
| Broadband Home | 23 | 34.3% |
| Cellular Data Only | 31 | 46.3% |
| Satellite Internet | 7 | 10.4% |
| No Internet | 6 | 9.0% |
| Total | 67 | 100.0% |
Hatfield Summary
Hatfield, Wisconsin is a small town located in Oconto County, Wisconsin. It is situated on the banks of the Oconto River, and is home to a population of just over 500 people. The town was founded in 1876, and has a rich history of logging, farming, and small business.
Geography
Hatfield is located in the northern part of Oconto County, Wisconsin. It is situated on the banks of the Oconto River, and is surrounded by rolling hills and forests. The town is located approximately 30 miles north of Green Bay, and is accessible by US Highway 41. The town is also located near the Nicolet National Forest, which provides a variety of recreational activities.
Economy
Hatfield’s economy is largely based on small businesses and agriculture. The town is home to a variety of small businesses, including a grocery store, a hardware store, a restaurant, and a gas station. The town also has a number of farms, which produce a variety of crops, including corn, soybeans, and hay. In addition, the town is home to a number of logging companies, which provide employment for many of the town’s residents.
Demographics
As of the 2010 census, Hatfield had a population of 517 people. The town is predominantly white, with 94.7% of the population identifying as such. The town also has a small Hispanic population, with 4.3% of the population identifying as Hispanic or Latino. The median household income in Hatfield is $41,250, and the median age is 44.
Conclusion
Hatfield, Wisconsin is a small town located in Oconto County, Wisconsin. It is situated on the banks of the Oconto River, and is home to a population of just over 500 people. The town was founded in 1876, and has a rich history of logging, farming, and small business. The town’s economy is largely based on small businesses and agriculture, and the town is predominantly white. Hatfield is a small, rural town with a rich history and a bright future.
Common Questions
What is Per Capita Income in Hatfield?
Per Capita income in Hatfield is $46,525.
What is the Median Family Income in Hatfield?
Median Family Income in Hatfield is $65,833.
What is the Median Household income in Hatfield?
Median Household Income in Hatfield is $60,795.
What is Income or Wage Gap in Hatfield?
Income or Wage Gap in Hatfield is 37.1%.
Women in Hatfield earn 62.9 cents for every dollar earned by a man.
What is Inequality or Gini Index in Hatfield?
Inequality or Gini Index in Hatfield is 0.38.
What is the Total Population of Hatfield?
Total Population of Hatfield is 175.
What is the Total Male Population of Hatfield?
Total Male Population of Hatfield is 63.
What is the Total Female Population of Hatfield?
Total Female Population of Hatfield is 112.
What is the Ratio of Males per 100 Females in Hatfield?
There are 56.25 Males per 100 Females in Hatfield.
What is the Ratio of Females per 100 Males in Hatfield?
There are 177.78 Females per 100 Males in Hatfield.
What is the Median Population Age in Hatfield?
Median Population Age in Hatfield is 70.6 Years.
What is the Average Family Size in Hatfield
Average Family Size in Hatfield is 4.6 People.
What is the Average Household Size in Hatfield
Average Household Size in Hatfield is 2.6 People.
How Large is the Labor Force in Hatfield?
There are 67 People in the Labor Forcein in Hatfield.
What is the Percentage of People in the Labor Force in Hatfield?
38.7% of People are in the Labor Force in Hatfield.
What is the Unemployment Rate in Hatfield?
Unemployment Rate in Hatfield is 3.0%.