Zip Codes with the Highest Percentage of Population with a Degree in Computers and Mathematics in Seattle, WA

RELATED REPORTS & OPTIONS

Computers and Mathematics
Population
Families and Households
Female Fertility
Female Fertility (Unmarried)
Race (Community Size)
Race (Percentage)
Ancestry (Community Size)
AfghanAfricanAlaska NativeAlaskan AthabascanAlbanianAleutAmericanApacheArabArgentineanArmenianAssyrian / Chaldean / SyriacAustralianAustrianBahamianBangladeshiBarbadianBasqueBelgianBelizeanBhutaneseBlackfeetBolivianBrazilianBritishBritish West IndianBulgarianBurmeseCajunCambodianCanadianCape VerdeanCarpatho RusynCelticCentral AmericanCentral American IndianCherokeeCheyenneChickasawChileanChineseChippewaChoctawColombianColvilleComancheCosta RicanCreeCreekCroatianCrowCubanCypriotCzechCzechoslovakianDanishDelawareDominicanDutchEastern EuropeanEcuadorianEgyptianEnglishEstonianEthiopianEuropeanFijianFilipinoFinnishFrenchFrench American IndianFrench CanadianGermanGerman RussianGhanaianGreekGuamanian / ChamorroGuatemalanGuyaneseHaitianHonduranHopiHungarianIcelanderIndian (Asian)IndonesianInupiatIranianIraqiIrishIroquoisIsraeliItalianJamaicanJapaneseJordanianKenyanKoreanLaotianLatvianLebaneseLithuanianLuxembourgerMacedonianMalaysianMalteseMarshalleseMexicanMexican American IndianMongolianMoroccanNative HawaiianNavajoNepaleseNew ZealanderNicaraguanNigerianNorthern EuropeanNorwegianOkinawanOsagePakistaniPalestinianPanamanianParaguayanPennsylvania GermanPeruvianPolishPortuguesePotawatomiPuebloPuerto RicanPuget Sound SalishRomanianRussianSalvadoranSamoanScandinavianScotch-IrishScottishSeminoleSenegaleseSerbianShoshoneSiouxSlavicSlovakSloveneSomaliSouth AfricanSouth AmericanSouth American IndianSpaniardSpanishSpanish AmericanSri LankanSubsaharan AfricanSudaneseSwedishSwissSyrianThaiTlingit-HaidaTonganTrinidadian and TobagonianTsimshianTurkishUgandanUkrainianUruguayanUteVenezuelanVietnameseWelshWest IndianYakamaYaquiYugoslavianYup'ik
Ancestry (Percentage)
AfghanAfricanAlaska NativeAlaskan AthabascanAlbanianAleutAmericanApacheArabArgentineanArmenianAssyrian / Chaldean / SyriacAustralianAustrianBahamianBangladeshiBarbadianBasqueBelgianBelizeanBhutaneseBlackfeetBolivianBrazilianBritishBritish West IndianBulgarianBurmeseCajunCambodianCanadianCape VerdeanCarpatho RusynCelticCentral AmericanCentral American IndianCherokeeCheyenneChickasawChileanChineseChippewaChoctawColombianColvilleComancheCosta RicanCreeCreekCroatianCrowCubanCypriotCzechCzechoslovakianDanishDelawareDominicanDutchEastern EuropeanEcuadorianEgyptianEnglishEstonianEthiopianEuropeanFijianFilipinoFinnishFrenchFrench American IndianFrench CanadianGermanGerman RussianGhanaianGreekGuamanian / ChamorroGuatemalanGuyaneseHaitianHonduranHopiHungarianIcelanderIndian (Asian)IndonesianInupiatIranianIraqiIrishIroquoisIsraeliItalianJamaicanJapaneseJordanianKenyanKoreanLaotianLatvianLebaneseLithuanianLuxembourgerMacedonianMalaysianMalteseMarshalleseMexicanMexican American IndianMongolianMoroccanNative HawaiianNavajoNepaleseNew ZealanderNicaraguanNigerianNorthern EuropeanNorwegianOkinawanOsagePakistaniPalestinianPanamanianParaguayanPennsylvania GermanPeruvianPolishPortuguesePotawatomiPuebloPuerto RicanPuget Sound SalishRomanianRussianSalvadoranSamoanScandinavianScotch-IrishScottishSeminoleSenegaleseSerbianShoshoneSiouxSlavicSlovakSloveneSomaliSouth AfricanSouth AmericanSouth American IndianSpaniardSpanishSpanish AmericanSri LankanSubsaharan AfricanSudaneseSwedishSwissSyrianThaiTlingit-HaidaTonganTrinidadian and TobagonianTsimshianTurkishUgandanUkrainianUruguayanUteVenezuelanVietnameseWelshWest IndianYakamaYaquiYugoslavianYup'ik
Immigrant Origin (Total)
AfghanistanAfricaAlbaniaArgentinaArmeniaAsiaAustraliaAustriaBangladeshBelarusBelgiumBelizeBoliviaBosnia and HerzegovinaBrazilBulgariaBurma / MyanmarCambodiaCameroonCanadaCaribbeanCentral AmericaChileChinaColombiaCongoCosta RicaCroatiaCubaCzechoslovakiaDenmarkDominican RepublicEastern AfricaEastern AsiaEastern EuropeEcuadorEgyptEl SalvadorEnglandEritreaEthiopiaEuropeFijiFranceGermanyGhanaGreeceGuatemalaHaitiHondurasHong KongHungaryIndiaIndonesiaIranIraqIrelandIsraelItalyJamaicaJapanJordanKazakhstanKenyaKoreaKuwaitLaosLatin AmericaLatviaLebanonLiberiaLithuaniaMalaysiaMexicoMicronesiaMiddle AfricaMoldovaMoroccoNepalNetherlandsNicaraguaNigeriaNorth MacedoniaNorthern AfricaNorthern EuropeNorwayOceaniaPakistanPanamaPeruPhilippinesPolandPortugalRomaniaRussiaSaudi ArabiaScotlandSenegalSerbiaSierra LeoneSingaporeSomaliaSouth AfricaSouth AmericaSouth Central AsiaSouth Eastern AsiaSouthern EuropeSpainSri LankaSudanSwedenSwitzerlandSyriaTaiwanThailandTrinidad and TobagoTurkeyUgandaUkraineUzbekistanVenezuelaVietnamWestern AfricaWestern AsiaWestern EuropeYemenZaireZimbabwe
Immigrant Origin (Percentage)
AfghanistanAfricaAlbaniaArgentinaArmeniaAsiaAustraliaAustriaBangladeshBelarusBelgiumBelizeBoliviaBosnia and HerzegovinaBrazilBulgariaBurma / MyanmarCambodiaCameroonCanadaCaribbeanCentral AmericaChileChinaColombiaCongoCosta RicaCroatiaCubaCzechoslovakiaDenmarkDominican RepublicEastern AfricaEastern AsiaEastern EuropeEcuadorEgyptEl SalvadorEnglandEritreaEthiopiaEuropeFijiFranceGermanyGhanaGreeceGuatemalaHaitiHondurasHong KongHungaryIndiaIndonesiaIranIraqIrelandIsraelItalyJamaicaJapanJordanKazakhstanKenyaKoreaKuwaitLaosLatin AmericaLatviaLebanonLiberiaLithuaniaMalaysiaMexicoMicronesiaMiddle AfricaMoldovaMoroccoNepalNetherlandsNicaraguaNigeriaNorth MacedoniaNorthern AfricaNorthern EuropeNorwayOceaniaPakistanPanamaPeruPhilippinesPolandPortugalRomaniaRussiaSaudi ArabiaScotlandSenegalSerbiaSierra LeoneSingaporeSomaliaSouth AfricaSouth AmericaSouth Central AsiaSouth Eastern AsiaSouthern EuropeSpainSri LankaSudanSwedenSwitzerlandSyriaTaiwanThailandTrinidad and TobagoTurkeyUgandaUkraineUzbekistanVenezuelaVietnamWestern AfricaWestern AsiaWestern EuropeYemenZaireZimbabwe
Income
Income (Families)
Income (Households)
Poverty
Poverty (Families)
Unemployment
Employment Occupations
Employment Industries
Employer Class
Commute Time
Commute Means
School Enrollment
Education by Degree Field
Occupancy
Finances
Physical Characteristics
Seattle
Compare Zip Codes
Comparison Subject

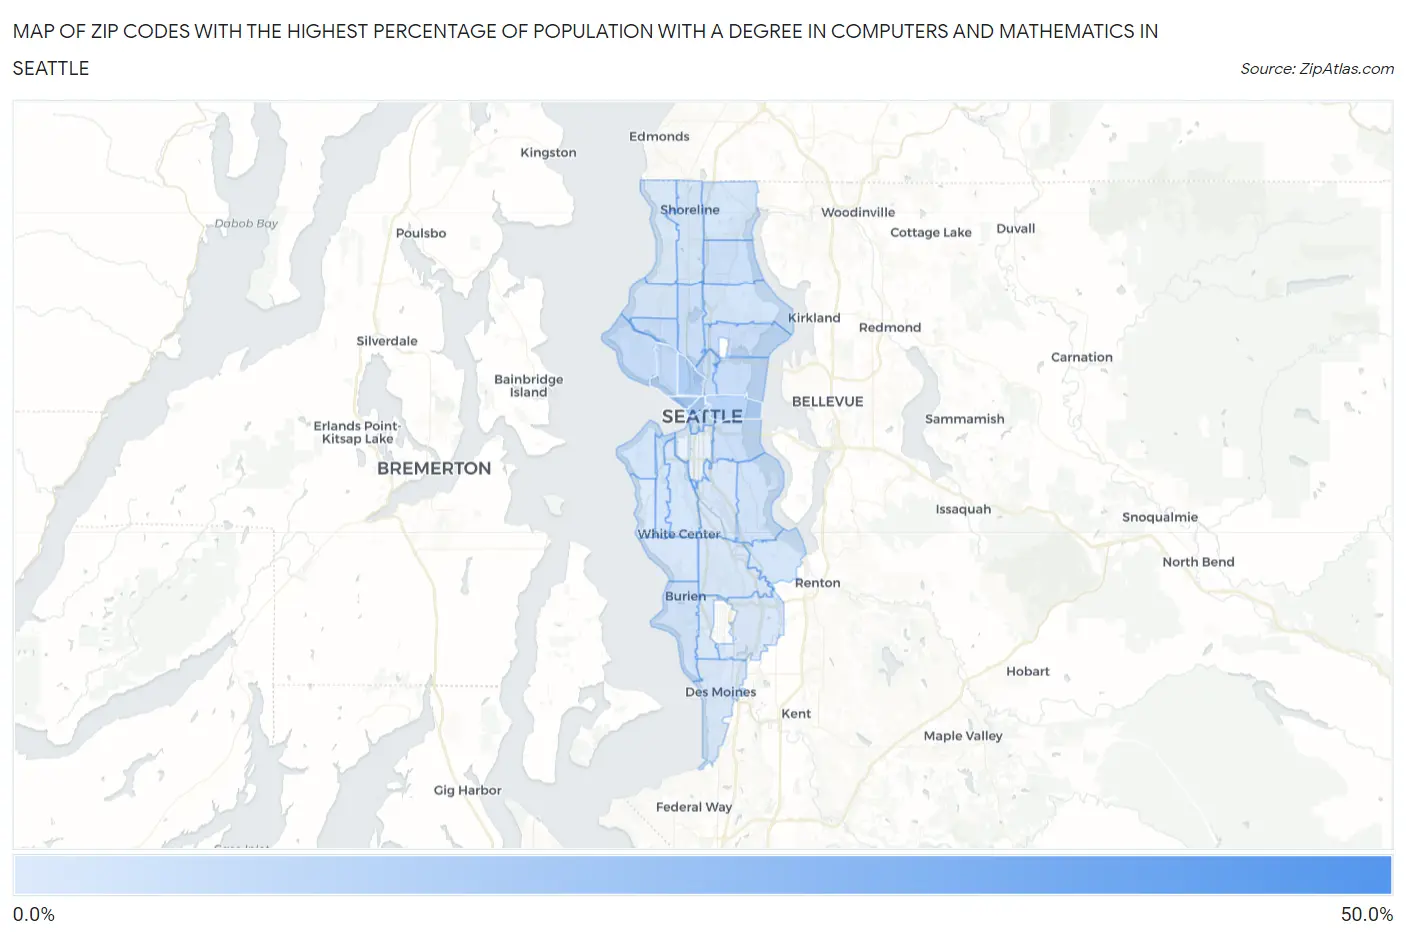
Map of Zip Codes with the Highest Percentage of Population with a Degree in Computers and Mathematics in Seattle

0.0%
50.0%
Zip Codes with the Highest Percentage of Population with a Degree in Computers and Mathematics in Seattle Map

Zip Codes with the Highest Percentage of Population with a Degree in Computers and Mathematics in Seattle, WA

Zip Code % Graduates vs State vs National
1.9816446.8%7.0%(+39.8)#64.9%(+41.9)#100
2.9812117.4%7.0%(+10.4)#154.9%(+12.5)#596
3.9810117.3%7.0%(+10.4)#164.9%(+12.4)#604
4.9810915.3%7.0%(+8.33)#194.9%(+10.4)#763
5.9812212.6%7.0%(+5.65)#384.9%(+7.72)#1,108
6.9811910.7%7.0%(+3.75)#464.9%(+5.82)#1,527
7.981999.3%7.0%(+2.34)#624.9%(+4.41)#2,061
8.981049.3%7.0%(+2.31)#634.9%(+4.38)#2,084
9.981129.0%7.0%(+2.03)#674.9%(+4.10)#2,256
10.981078.8%7.0%(+1.83)#714.9%(+3.90)#2,375
11.981028.5%7.0%(+1.56)#784.9%(+3.63)#2,527
12.981058.2%7.0%(+1.27)#854.9%(+3.34)#2,719
13.981258.0%7.0%(+1.03)#884.9%(+3.10)#2,907
14.981038.0%7.0%(+1.00)#904.9%(+3.07)#2,931
15.981447.7%7.0%(+0.738)#924.9%(+2.81)#3,134
16.981186.9%7.0%(-0.069)#1094.9%(+2.00)#3,958
17.981666.7%7.0%(-0.259)#1144.9%(+1.81)#4,197
18.981266.4%7.0%(-0.589)#1254.9%(+1.48)#4,655
19.981156.2%7.0%(-0.732)#1334.9%(+1.34)#4,883
20.981166.0%7.0%(-0.912)#1434.9%(+1.16)#5,213
21.981175.9%7.0%(-1.02)#1464.9%(+1.04)#5,403
22.981065.9%7.0%(-1.09)#1494.9%(+0.977)#5,546
23.981335.8%7.0%(-1.18)#1504.9%(+0.891)#5,699
24.981555.8%7.0%(-1.20)#1524.9%(+0.863)#5,762
25.981785.4%7.0%(-1.56)#1624.9%(+0.511)#6,491
26.981465.1%7.0%(-1.82)#1724.9%(+0.252)#7,099
27.981685.0%7.0%(-1.98)#1804.9%(+0.092)#7,486
28.981084.9%7.0%(-2.04)#1844.9%(+0.031)#7,629
29.981884.7%7.0%(-2.27)#2024.9%(-0.204)#8,297
30.981984.3%7.0%(-2.63)#2264.9%(-0.564)#9,434
31.981774.2%7.0%(-2.78)#2334.9%(-0.717)#9,909
32.981484.1%7.0%(-2.87)#2374.9%(-0.801)#10,157
33.981364.0%7.0%(-2.96)#2464.9%(-0.895)#10,472

Common Questions

What are the Top 10 Zip Codes with the Highest Percentage of Population with a Degree in Computers and Mathematics in Seattle, WA?
Top 10 Zip Codes with the Highest Percentage of Population with a Degree in Computers and Mathematics in Seattle, WA are:
#1
46.8%
#2
17.4%
#3
17.3%
#4
15.3%
#5
12.6%
#6
10.7%
#7
9.3%
#8
9.3%
#9
9.0%
#10
8.8%
What zip code has the Highest Percentage of Population with a Degree in Computers and Mathematics in Seattle, WA?
98164 has the Highest Percentage of Population with a Degree in Computers and Mathematics in Seattle, WA with 46.8%.
What is the Percentage of Population with a Degree in Computers and Mathematics in Seattle, WA?
Percentage of Population with a Degree in Computers and Mathematics in Seattle is 8.8%.
What is the Percentage of Population with a Degree in Computers and Mathematics in Washington?
Percentage of Population with a Degree in Computers and Mathematics in Washington is 7.0%.
What is the Percentage of Population with a Degree in Computers and Mathematics in the United States?
Percentage of Population with a Degree in Computers and Mathematics in the United States is 4.9%.