Zip Codes with the Highest Percentage of Population with a Degree in Bio, Nature & Agricultural in Seattle, WA
RELATED REPORTS & OPTIONS
Bio, Nature & Agricultural
Seattle
Compare Zip Codes
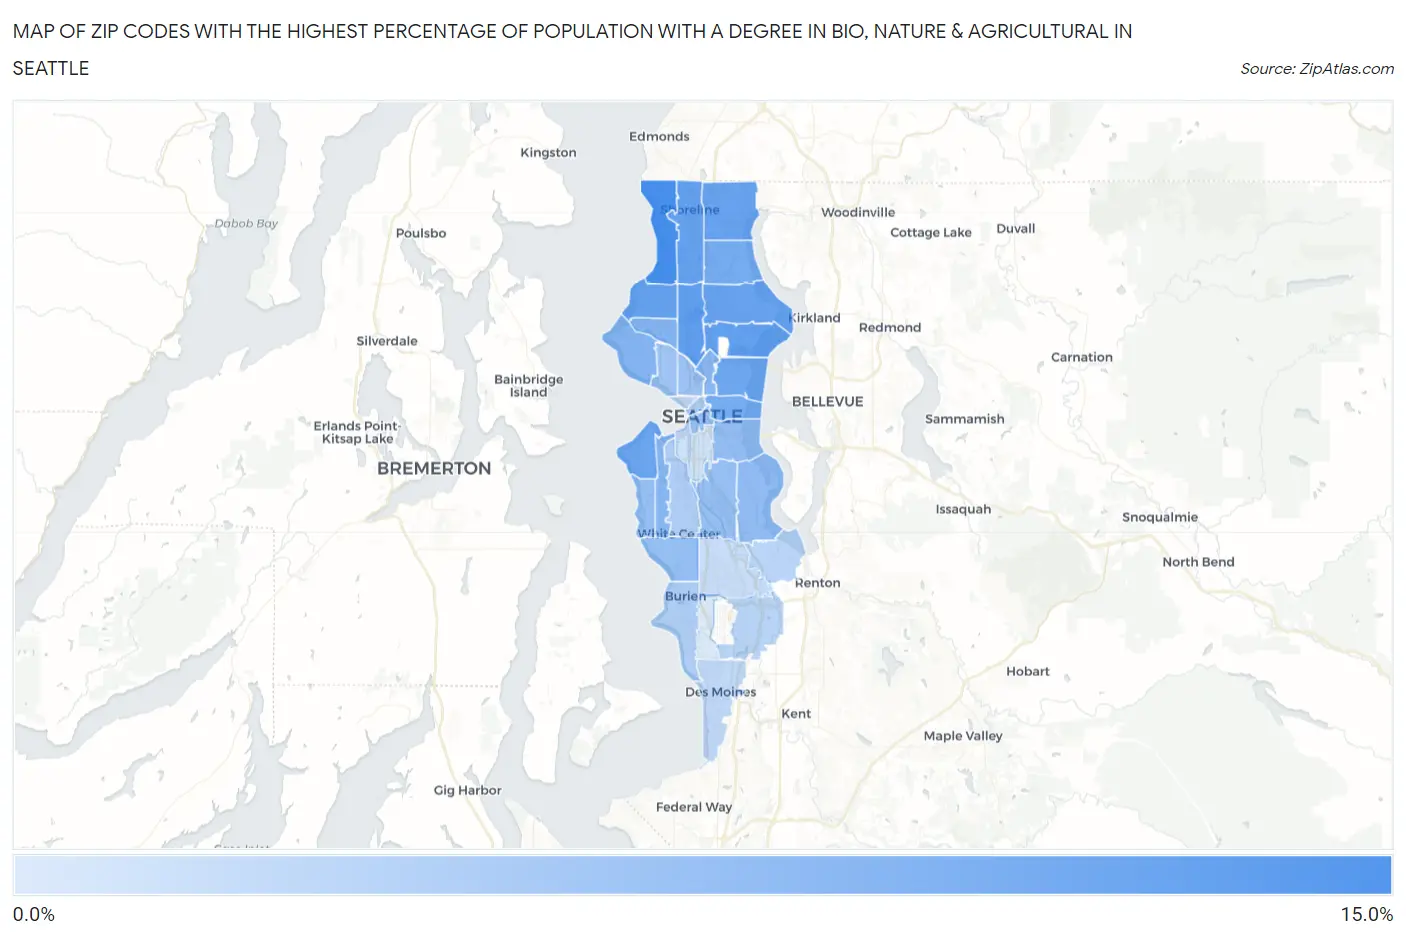
Map of Zip Codes with the Highest Percentage of Population with a Degree in Bio, Nature & Agricultural in Seattle
2.6%
11.1%
Zip Codes with the Highest Percentage of Population with a Degree in Bio, Nature & Agricultural in Seattle, WA
| Zip Code | % Graduates | vs State | vs National | |
| 1. | 98177 | 11.1% | 7.2%(+3.91)#147 | 6.4%(+4.76)#6,917 |
| 2. | 98103 | 9.6% | 7.2%(+2.41)#186 | 6.4%(+3.26)#8,598 |
| 3. | 98105 | 9.5% | 7.2%(+2.29)#195 | 6.4%(+3.14)#8,778 |
| 4. | 98117 | 9.4% | 7.2%(+2.21)#196 | 6.4%(+3.06)#8,882 |
| 5. | 98133 | 9.4% | 7.2%(+2.16)#200 | 6.4%(+3.02)#8,960 |
| 6. | 98115 | 9.3% | 7.2%(+2.09)#202 | 6.4%(+2.94)#9,072 |
| 7. | 98155 | 9.2% | 7.2%(+1.98)#208 | 6.4%(+2.83)#9,225 |
| 8. | 98116 | 8.9% | 7.2%(+1.70)#215 | 6.4%(+2.56)#9,686 |
| 9. | 98112 | 8.8% | 7.2%(+1.57)#218 | 6.4%(+2.43)#9,875 |
| 10. | 98122 | 8.4% | 7.2%(+1.23)#231 | 6.4%(+2.08)#10,416 |
| 11. | 98125 | 8.4% | 7.2%(+1.23)#232 | 6.4%(+2.08)#10,421 |
| 12. | 98107 | 7.6% | 7.2%(+0.417)#261 | 6.4%(+1.27)#11,946 |
| 13. | 98199 | 7.5% | 7.2%(+0.331)#264 | 6.4%(+1.19)#12,108 |
| 14. | 98126 | 7.4% | 7.2%(+0.151)#275 | 6.4%(+1.01)#12,505 |
| 15. | 98102 | 7.3% | 7.2%(+0.064)#279 | 6.4%(+0.918)#12,720 |
| 16. | 98118 | 6.9% | 7.2%(-0.289)#295 | 6.4%(+0.565)#13,531 |
| 17. | 98144 | 6.8% | 7.2%(-0.428)#306 | 6.4%(+0.426)#13,869 |
| 18. | 98108 | 6.6% | 7.2%(-0.560)#314 | 6.4%(+0.294)#14,227 |
| 19. | 98136 | 6.6% | 7.2%(-0.578)#318 | 6.4%(+0.275)#14,276 |
| 20. | 98146 | 6.6% | 7.2%(-0.595)#321 | 6.4%(+0.259)#14,326 |
| 21. | 98104 | 6.4% | 7.2%(-0.767)#332 | 6.4%(+0.087)#14,764 |
| 22. | 98109 | 6.3% | 7.2%(-0.868)#341 | 6.4%(-0.014)#15,018 |
| 23. | 98119 | 6.0% | 7.2%(-1.24)#358 | 6.4%(-0.388)#16,015 |
| 24. | 98101 | 5.3% | 7.2%(-1.87)#397 | 6.4%(-1.02)#17,793 |
| 25. | 98106 | 5.2% | 7.2%(-1.99)#404 | 6.4%(-1.13)#18,141 |
| 26. | 98166 | 5.2% | 7.2%(-1.99)#405 | 6.4%(-1.14)#18,163 |
| 27. | 98188 | 4.5% | 7.2%(-2.70)#435 | 6.4%(-1.84)#20,248 |
| 28. | 98178 | 4.5% | 7.2%(-2.73)#437 | 6.4%(-1.88)#20,327 |
| 29. | 98198 | 4.2% | 7.2%(-3.04)#448 | 6.4%(-2.19)#21,239 |
| 30. | 98121 | 4.2% | 7.2%(-3.05)#449 | 6.4%(-2.20)#21,276 |
| 31. | 98168 | 3.8% | 7.2%(-3.43)#458 | 6.4%(-2.58)#22,194 |
| 32. | 98134 | 3.3% | 7.2%(-3.86)#474 | 6.4%(-3.01)#23,155 |
| 33. | 98148 | 2.6% | 7.2%(-4.58)#491 | 6.4%(-3.73)#24,508 |
1
Common Questions
What are the Top 10 Zip Codes with the Highest Percentage of Population with a Degree in Bio, Nature & Agricultural in Seattle, WA?
Top 10 Zip Codes with the Highest Percentage of Population with a Degree in Bio, Nature & Agricultural in Seattle, WA are:
What zip code has the Highest Percentage of Population with a Degree in Bio, Nature & Agricultural in Seattle, WA?
98177 has the Highest Percentage of Population with a Degree in Bio, Nature & Agricultural in Seattle, WA with 11.1%.
What is the Percentage of Population with a Degree in Bio, Nature & Agricultural in Seattle, WA?
Percentage of Population with a Degree in Bio, Nature & Agricultural in Seattle is 7.9%.
What is the Percentage of Population with a Degree in Bio, Nature & Agricultural in Washington?
Percentage of Population with a Degree in Bio, Nature & Agricultural in Washington is 7.2%.
What is the Percentage of Population with a Degree in Bio, Nature & Agricultural in the United States?
Percentage of Population with a Degree in Bio, Nature & Agricultural in the United States is 6.4%.