Zip Codes with the Highest Percentage of Population Employed in Arts, Media & Entertainment in Seattle, WA

RELATED REPORTS & OPTIONS

Arts, Media & Entertainment
Population
Families and Households
Female Fertility
Female Fertility (Unmarried)
Race (Community Size)
Race (Percentage)
Ancestry (Community Size)
AfghanAfricanAlaska NativeAlaskan AthabascanAlbanianAleutAmericanApacheArabArgentineanArmenianAssyrian / Chaldean / SyriacAustralianAustrianBahamianBangladeshiBarbadianBasqueBelgianBelizeanBhutaneseBlackfeetBolivianBrazilianBritishBritish West IndianBulgarianBurmeseCajunCambodianCanadianCape VerdeanCarpatho RusynCelticCentral AmericanCentral American IndianCherokeeCheyenneChickasawChileanChineseChippewaChoctawColombianColvilleComancheCosta RicanCreeCreekCroatianCrowCubanCypriotCzechCzechoslovakianDanishDelawareDominicanDutchEastern EuropeanEcuadorianEgyptianEnglishEstonianEthiopianEuropeanFijianFilipinoFinnishFrenchFrench American IndianFrench CanadianGermanGerman RussianGhanaianGreekGuamanian / ChamorroGuatemalanGuyaneseHaitianHonduranHopiHungarianIcelanderIndian (Asian)IndonesianInupiatIranianIraqiIrishIroquoisIsraeliItalianJamaicanJapaneseJordanianKenyanKoreanLaotianLatvianLebaneseLithuanianLuxembourgerMacedonianMalaysianMalteseMarshalleseMexicanMexican American IndianMongolianMoroccanNative HawaiianNavajoNepaleseNew ZealanderNicaraguanNigerianNorthern EuropeanNorwegianOkinawanOsagePakistaniPalestinianPanamanianParaguayanPennsylvania GermanPeruvianPolishPortuguesePotawatomiPuebloPuerto RicanPuget Sound SalishRomanianRussianSalvadoranSamoanScandinavianScotch-IrishScottishSeminoleSenegaleseSerbianShoshoneSiouxSlavicSlovakSloveneSomaliSouth AfricanSouth AmericanSouth American IndianSpaniardSpanishSpanish AmericanSri LankanSubsaharan AfricanSudaneseSwedishSwissSyrianThaiTlingit-HaidaTonganTrinidadian and TobagonianTsimshianTurkishUgandanUkrainianUruguayanUteVenezuelanVietnameseWelshWest IndianYakamaYaquiYugoslavianYup'ik
Ancestry (Percentage)
AfghanAfricanAlaska NativeAlaskan AthabascanAlbanianAleutAmericanApacheArabArgentineanArmenianAssyrian / Chaldean / SyriacAustralianAustrianBahamianBangladeshiBarbadianBasqueBelgianBelizeanBhutaneseBlackfeetBolivianBrazilianBritishBritish West IndianBulgarianBurmeseCajunCambodianCanadianCape VerdeanCarpatho RusynCelticCentral AmericanCentral American IndianCherokeeCheyenneChickasawChileanChineseChippewaChoctawColombianColvilleComancheCosta RicanCreeCreekCroatianCrowCubanCypriotCzechCzechoslovakianDanishDelawareDominicanDutchEastern EuropeanEcuadorianEgyptianEnglishEstonianEthiopianEuropeanFijianFilipinoFinnishFrenchFrench American IndianFrench CanadianGermanGerman RussianGhanaianGreekGuamanian / ChamorroGuatemalanGuyaneseHaitianHonduranHopiHungarianIcelanderIndian (Asian)IndonesianInupiatIranianIraqiIrishIroquoisIsraeliItalianJamaicanJapaneseJordanianKenyanKoreanLaotianLatvianLebaneseLithuanianLuxembourgerMacedonianMalaysianMalteseMarshalleseMexicanMexican American IndianMongolianMoroccanNative HawaiianNavajoNepaleseNew ZealanderNicaraguanNigerianNorthern EuropeanNorwegianOkinawanOsagePakistaniPalestinianPanamanianParaguayanPennsylvania GermanPeruvianPolishPortuguesePotawatomiPuebloPuerto RicanPuget Sound SalishRomanianRussianSalvadoranSamoanScandinavianScotch-IrishScottishSeminoleSenegaleseSerbianShoshoneSiouxSlavicSlovakSloveneSomaliSouth AfricanSouth AmericanSouth American IndianSpaniardSpanishSpanish AmericanSri LankanSubsaharan AfricanSudaneseSwedishSwissSyrianThaiTlingit-HaidaTonganTrinidadian and TobagonianTsimshianTurkishUgandanUkrainianUruguayanUteVenezuelanVietnameseWelshWest IndianYakamaYaquiYugoslavianYup'ik
Immigrant Origin (Total)
AfghanistanAfricaAlbaniaArgentinaArmeniaAsiaAustraliaAustriaBangladeshBelarusBelgiumBelizeBoliviaBosnia and HerzegovinaBrazilBulgariaBurma / MyanmarCambodiaCameroonCanadaCaribbeanCentral AmericaChileChinaColombiaCongoCosta RicaCroatiaCubaCzechoslovakiaDenmarkDominican RepublicEastern AfricaEastern AsiaEastern EuropeEcuadorEgyptEl SalvadorEnglandEritreaEthiopiaEuropeFijiFranceGermanyGhanaGreeceGuatemalaHaitiHondurasHong KongHungaryIndiaIndonesiaIranIraqIrelandIsraelItalyJamaicaJapanJordanKazakhstanKenyaKoreaKuwaitLaosLatin AmericaLatviaLebanonLiberiaLithuaniaMalaysiaMexicoMicronesiaMiddle AfricaMoldovaMoroccoNepalNetherlandsNicaraguaNigeriaNorth MacedoniaNorthern AfricaNorthern EuropeNorwayOceaniaPakistanPanamaPeruPhilippinesPolandPortugalRomaniaRussiaSaudi ArabiaScotlandSenegalSerbiaSierra LeoneSingaporeSomaliaSouth AfricaSouth AmericaSouth Central AsiaSouth Eastern AsiaSouthern EuropeSpainSri LankaSudanSwedenSwitzerlandSyriaTaiwanThailandTrinidad and TobagoTurkeyUgandaUkraineUzbekistanVenezuelaVietnamWestern AfricaWestern AsiaWestern EuropeYemenZaireZimbabwe
Immigrant Origin (Percentage)
AfghanistanAfricaAlbaniaArgentinaArmeniaAsiaAustraliaAustriaBangladeshBelarusBelgiumBelizeBoliviaBosnia and HerzegovinaBrazilBulgariaBurma / MyanmarCambodiaCameroonCanadaCaribbeanCentral AmericaChileChinaColombiaCongoCosta RicaCroatiaCubaCzechoslovakiaDenmarkDominican RepublicEastern AfricaEastern AsiaEastern EuropeEcuadorEgyptEl SalvadorEnglandEritreaEthiopiaEuropeFijiFranceGermanyGhanaGreeceGuatemalaHaitiHondurasHong KongHungaryIndiaIndonesiaIranIraqIrelandIsraelItalyJamaicaJapanJordanKazakhstanKenyaKoreaKuwaitLaosLatin AmericaLatviaLebanonLiberiaLithuaniaMalaysiaMexicoMicronesiaMiddle AfricaMoldovaMoroccoNepalNetherlandsNicaraguaNigeriaNorth MacedoniaNorthern AfricaNorthern EuropeNorwayOceaniaPakistanPanamaPeruPhilippinesPolandPortugalRomaniaRussiaSaudi ArabiaScotlandSenegalSerbiaSierra LeoneSingaporeSomaliaSouth AfricaSouth AmericaSouth Central AsiaSouth Eastern AsiaSouthern EuropeSpainSri LankaSudanSwedenSwitzerlandSyriaTaiwanThailandTrinidad and TobagoTurkeyUgandaUkraineUzbekistanVenezuelaVietnamWestern AfricaWestern AsiaWestern EuropeYemenZaireZimbabwe
Income
Income (Families)
Income (Households)
Poverty
Poverty (Families)
Unemployment
Employment Occupations
Employment Industries
Employer Class
Commute Time
Commute Means
School Enrollment
Education by Degree Field
Occupancy
Finances
Physical Characteristics
Seattle
Compare Zip Codes
Comparison Subject

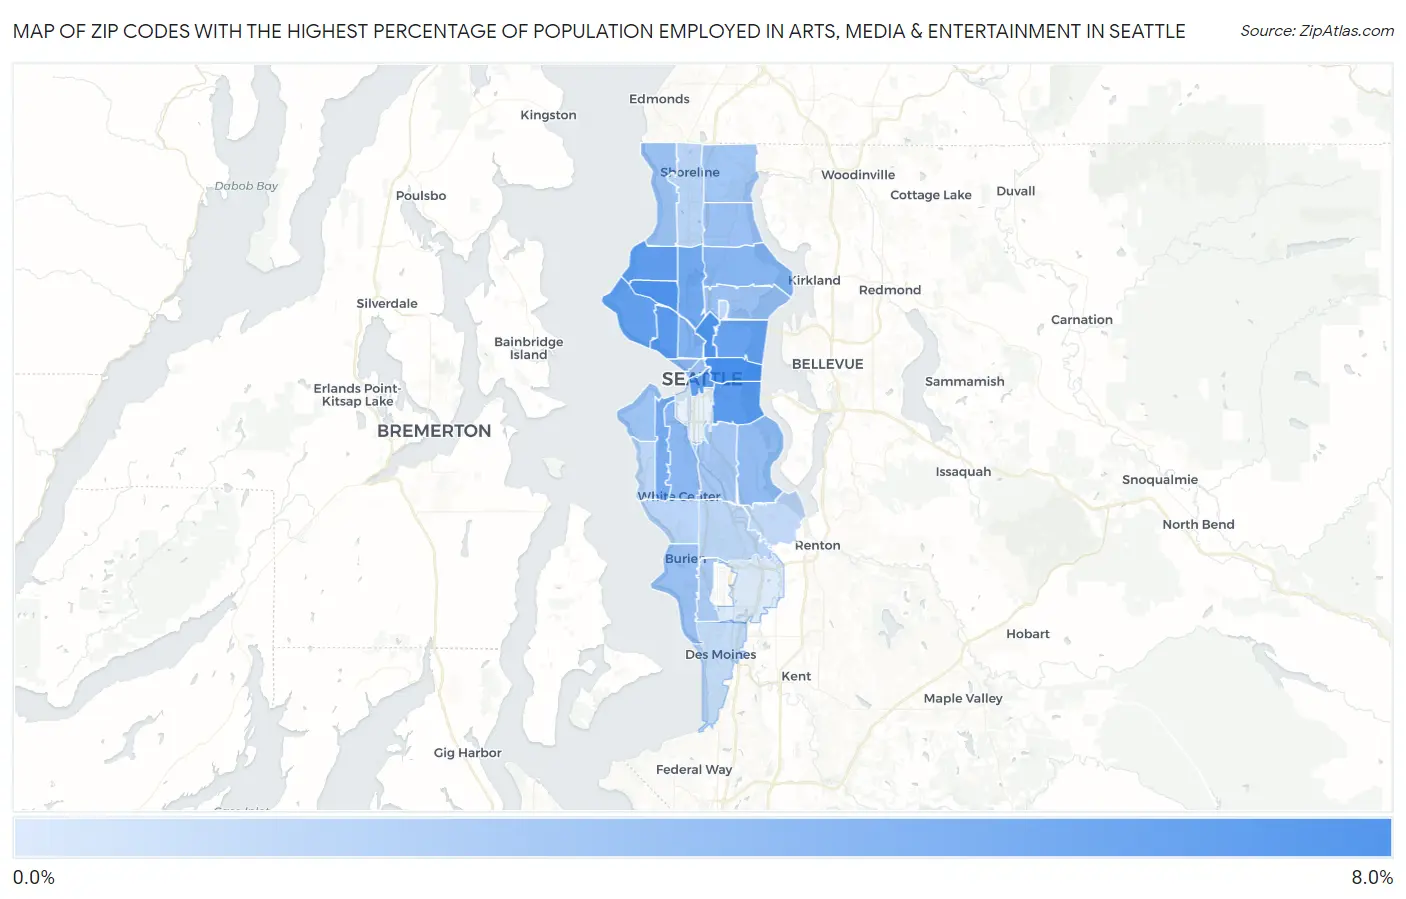
Map of Zip Codes with the Highest Percentage of Population Employed in Arts, Media & Entertainment in Seattle

0.0%
8.0%
Zip Codes with the Highest Percentage of Population Employed in Arts, Media & Entertainment in Seattle Map

Zip Codes with the Highest Percentage of Population Employed in Arts, Media & Entertainment in Seattle, WA

Zip Code % Employed vs State vs National
1.981226.4%2.1%(+4.37)#192.1%(+4.39)#889
2.981076.2%2.1%(+4.07)#222.1%(+4.09)#986
3.981026.1%2.1%(+3.98)#232.1%(+4.00)#1,016
4.981195.6%2.1%(+3.55)#272.1%(+3.57)#1,184
5.981445.6%2.1%(+3.52)#282.1%(+3.55)#1,193
6.981045.5%2.1%(+3.42)#302.1%(+3.44)#1,249
7.981175.5%2.1%(+3.40)#312.1%(+3.42)#1,257
8.981995.4%2.1%(+3.32)#332.1%(+3.34)#1,303
9.981125.2%2.1%(+3.08)#352.1%(+3.10)#1,419
10.981034.7%2.1%(+2.63)#392.1%(+2.66)#1,682
11.981264.6%2.1%(+2.49)#402.1%(+2.51)#1,797
12.981094.2%2.1%(+2.15)#462.1%(+2.18)#2,108
13.981153.9%2.1%(+1.83)#522.1%(+1.85)#2,478
14.981063.7%2.1%(+1.67)#582.1%(+1.69)#2,694
15.981213.7%2.1%(+1.67)#592.1%(+1.69)#2,695
16.981183.5%2.1%(+1.46)#642.1%(+1.48)#3,016
17.981253.2%2.1%(+1.11)#762.1%(+1.13)#3,623
18.981053.2%2.1%(+1.10)#772.1%(+1.12)#3,652
19.981773.2%2.1%(+1.10)#782.1%(+1.12)#3,666
20.981013.2%2.1%(+1.07)#812.1%(+1.09)#3,733
21.981663.1%2.1%(+1.02)#872.1%(+1.04)#3,851
22.981163.0%2.1%(+0.929)#912.1%(+0.951)#4,046
23.981552.9%2.1%(+0.781)#1012.1%(+0.803)#4,441
24.981082.8%2.1%(+0.694)#1052.1%(+0.716)#4,675
25.981482.5%2.1%(+0.425)#1222.1%(+0.447)#5,528
26.981332.0%2.1%(-0.076)#1862.1%(-0.054)#7,790
27.981462.0%2.1%(-0.100)#1902.1%(-0.078)#7,903
28.981361.9%2.1%(-0.138)#1952.1%(-0.116)#8,106
29.981681.9%2.1%(-0.158)#2002.1%(-0.136)#8,229
30.981951.9%2.1%(-0.222)#2062.1%(-0.200)#8,607
31.981781.8%2.1%(-0.296)#2152.1%(-0.274)#9,049
32.981981.5%2.1%(-0.551)#2492.1%(-0.529)#10,767
33.981880.71%2.1%(-1.37)#3682.1%(-1.35)#17,153

Common Questions

What are the Top 10 Zip Codes with the Highest Percentage of Population Employed in Arts, Media & Entertainment in Seattle, WA?
Top 10 Zip Codes with the Highest Percentage of Population Employed in Arts, Media & Entertainment in Seattle, WA are:
#1
6.4%
#2
6.2%
#3
6.1%
#4
5.6%
#5
5.6%
#6
5.5%
#7
5.5%
#8
5.4%
#9
5.2%
#10
4.7%
What zip code has the Highest Percentage of Population Employed in Arts, Media & Entertainment in Seattle, WA?
98122 has the Highest Percentage of Population Employed in Arts, Media & Entertainment in Seattle, WA with 6.4%.
What is the Percentage of Population Employed in Arts, Media & Entertainment in Seattle, WA?
Percentage of Population Employed in Arts, Media & Entertainment in Seattle is 4.4%.
What is the Percentage of Population Employed in Arts, Media & Entertainment in Washington?
Percentage of Population Employed in Arts, Media & Entertainment in Washington is 2.1%.
What is the Percentage of Population Employed in Arts, Media & Entertainment in the United States?
Percentage of Population Employed in Arts, Media & Entertainment in the United States is 2.1%.