Zip Codes with the Highest Percentage of Households Without a Vehicle in Seattle, WA
RELATED REPORTS & OPTIONS
Households without a Cars
Seattle
Compare Zip Codes
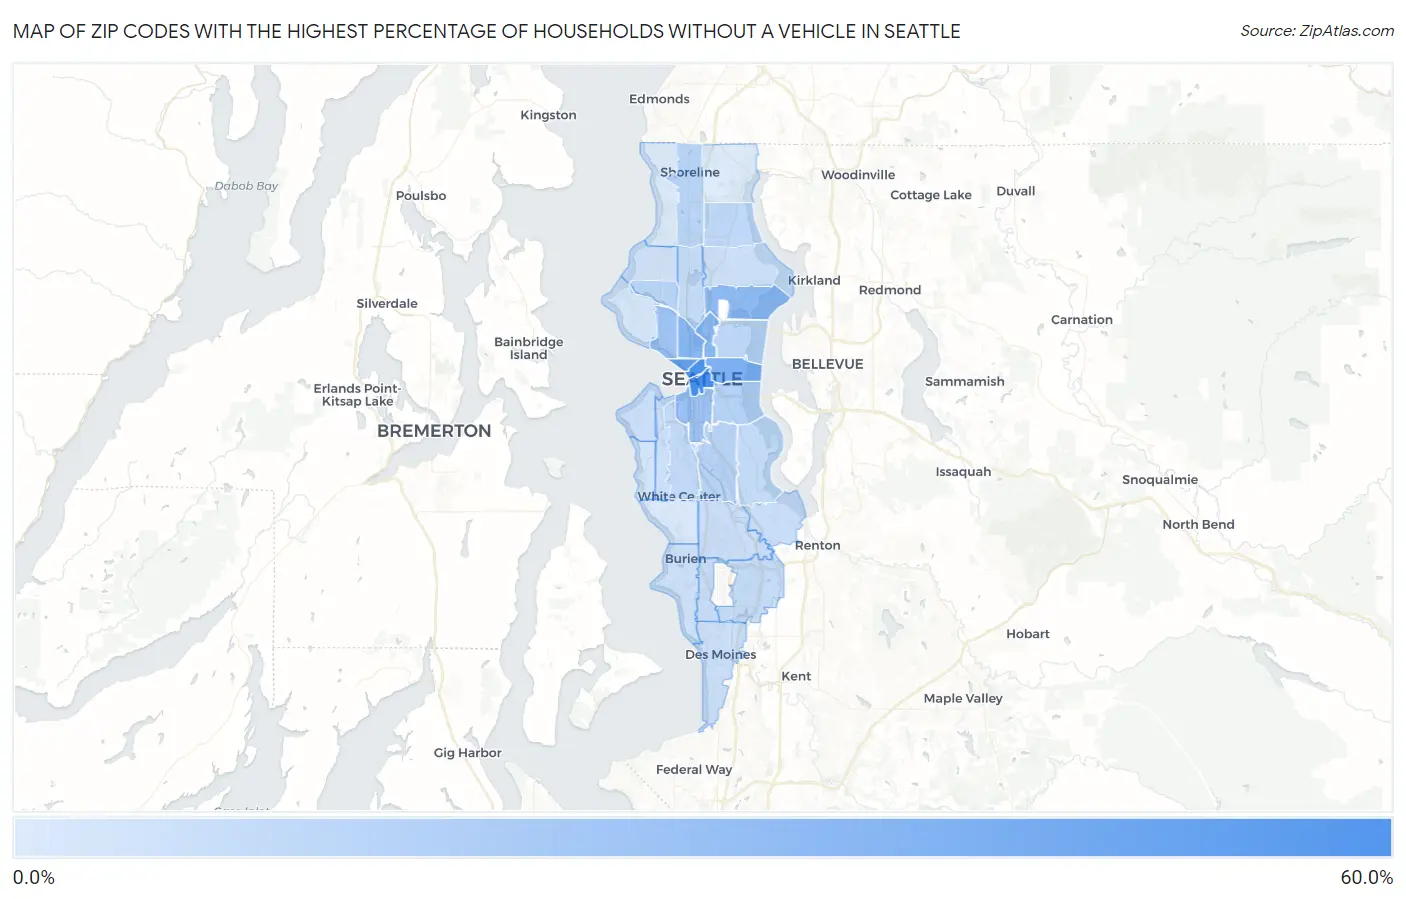
Map of Zip Codes with the Highest Percentage of Households Without a Vehicle in Seattle
3.2%
55.1%
Zip Codes with the Highest Percentage of Households Without a Vehicle in Seattle, WA
| Zip Code | Housholds Without a Car | vs State | vs National | |
| 1. | 98104 | 55.1% | 6.9%(+48.2)#2 | 8.3%(+46.8)#307 |
| 2. | 98101 | 51.6% | 6.9%(+44.7)#3 | 8.3%(+43.3)#332 |
| 3. | 98121 | 42.5% | 6.9%(+35.6)#4 | 8.3%(+34.2)#467 |
| 4. | 98122 | 34.1% | 6.9%(+27.2)#6 | 8.3%(+25.8)#656 |
| 5. | 98109 | 30.0% | 6.9%(+23.1)#8 | 8.3%(+21.7)#796 |
| 6. | 98102 | 29.2% | 6.9%(+22.3)#9 | 8.3%(+20.9)#833 |
| 7. | 98164 | 28.6% | 6.9%(+21.7)#10 | 8.3%(+20.3)#867 |
| 8. | 98105 | 27.9% | 6.9%(+21.0)#11 | 8.3%(+19.6)#891 |
| 9. | 98134 | 24.1% | 6.9%(+17.2)#12 | 8.3%(+15.8)#1,132 |
| 10. | 98119 | 21.4% | 6.9%(+14.5)#14 | 8.3%(+13.1)#1,346 |
| 11. | 98144 | 15.0% | 6.9%(+8.10)#23 | 8.3%(+6.70)#2,383 |
| 12. | 98108 | 14.2% | 6.9%(+7.30)#25 | 8.3%(+5.90)#2,626 |
| 13. | 98133 | 13.4% | 6.9%(+6.50)#28 | 8.3%(+5.10)#2,912 |
| 14. | 98107 | 13.3% | 6.9%(+6.40)#29 | 8.3%(+5.00)#2,963 |
| 15. | 98112 | 12.6% | 6.9%(+5.70)#37 | 8.3%(+4.30)#3,276 |
| 16. | 98125 | 12.0% | 6.9%(+5.10)#42 | 8.3%(+3.70)#3,545 |
| 17. | 98106 | 11.6% | 6.9%(+4.70)#43 | 8.3%(+3.30)#3,763 |
| 18. | 98118 | 10.7% | 6.9%(+3.80)#50 | 8.3%(+2.40)#4,300 |
| 19. | 98188 | 10.0% | 6.9%(+3.10)#57 | 8.3%(+1.70)#4,855 |
| 20. | 98103 | 9.7% | 6.9%(+2.80)#61 | 8.3%(+1.40)#5,096 |
| 21. | 98148 | 9.4% | 6.9%(+2.50)#69 | 8.3%(+1.10)#5,364 |
| 22. | 98178 | 9.1% | 6.9%(+2.20)#71 | 8.3%(+0.800)#5,627 |
| 23. | 98168 | 8.6% | 6.9%(+1.70)#76 | 8.3%(+0.300)#6,172 |
| 24. | 98116 | 8.5% | 6.9%(+1.60)#78 | 8.3%(+0.200)#6,316 |
| 25. | 98126 | 8.1% | 6.9%(+1.20)#88 | 8.3%(-0.200)#6,803 |
| 26. | 98115 | 8.0% | 6.9%(+1.10)#90 | 8.3%(-0.300)#6,897 |
| 27. | 98198 | 7.5% | 6.9%(+0.600)#104 | 8.3%(-0.800)#7,688 |
| 28. | 98166 | 6.9% | 6.9%(=0.000)#125 | 8.3%(-1.40)#8,718 |
| 29. | 98117 | 6.5% | 6.9%(-0.400)#136 | 8.3%(-1.80)#9,372 |
| 30. | 98136 | 5.8% | 6.9%(-1.10)#162 | 8.3%(-2.50)#10,932 |
| 31. | 98199 | 5.3% | 6.9%(-1.60)#189 | 8.3%(-3.00)#12,113 |
| 32. | 98146 | 4.7% | 6.9%(-2.20)#212 | 8.3%(-3.60)#13,662 |
| 33. | 98155 | 3.4% | 6.9%(-3.50)#290 | 8.3%(-4.90)#17,626 |
| 34. | 98177 | 3.2% | 6.9%(-3.70)#316 | 8.3%(-5.10)#18,381 |
1
Common Questions
What are the Top 10 Zip Codes with the Highest Percentage of Households Without a Vehicle in Seattle, WA?
Top 10 Zip Codes with the Highest Percentage of Households Without a Vehicle in Seattle, WA are:
What zip code has the Highest Percentage of Households Without a Vehicle in Seattle, WA?
98104 has the Highest Percentage of Households Without a Vehicle in Seattle, WA with 55.1%.
What is the Percentage of Households Without a Vehicle in Seattle, WA?
Percentage of Households Without a Vehicle in Seattle is 18.9%.
What is the Percentage of Households Without a Vehicle in Washington?
Percentage of Households Without a Vehicle in Washington is 6.9%.
What is the Percentage of Households Without a Vehicle in the United States?
Percentage of Households Without a Vehicle in the United States is 8.3%.