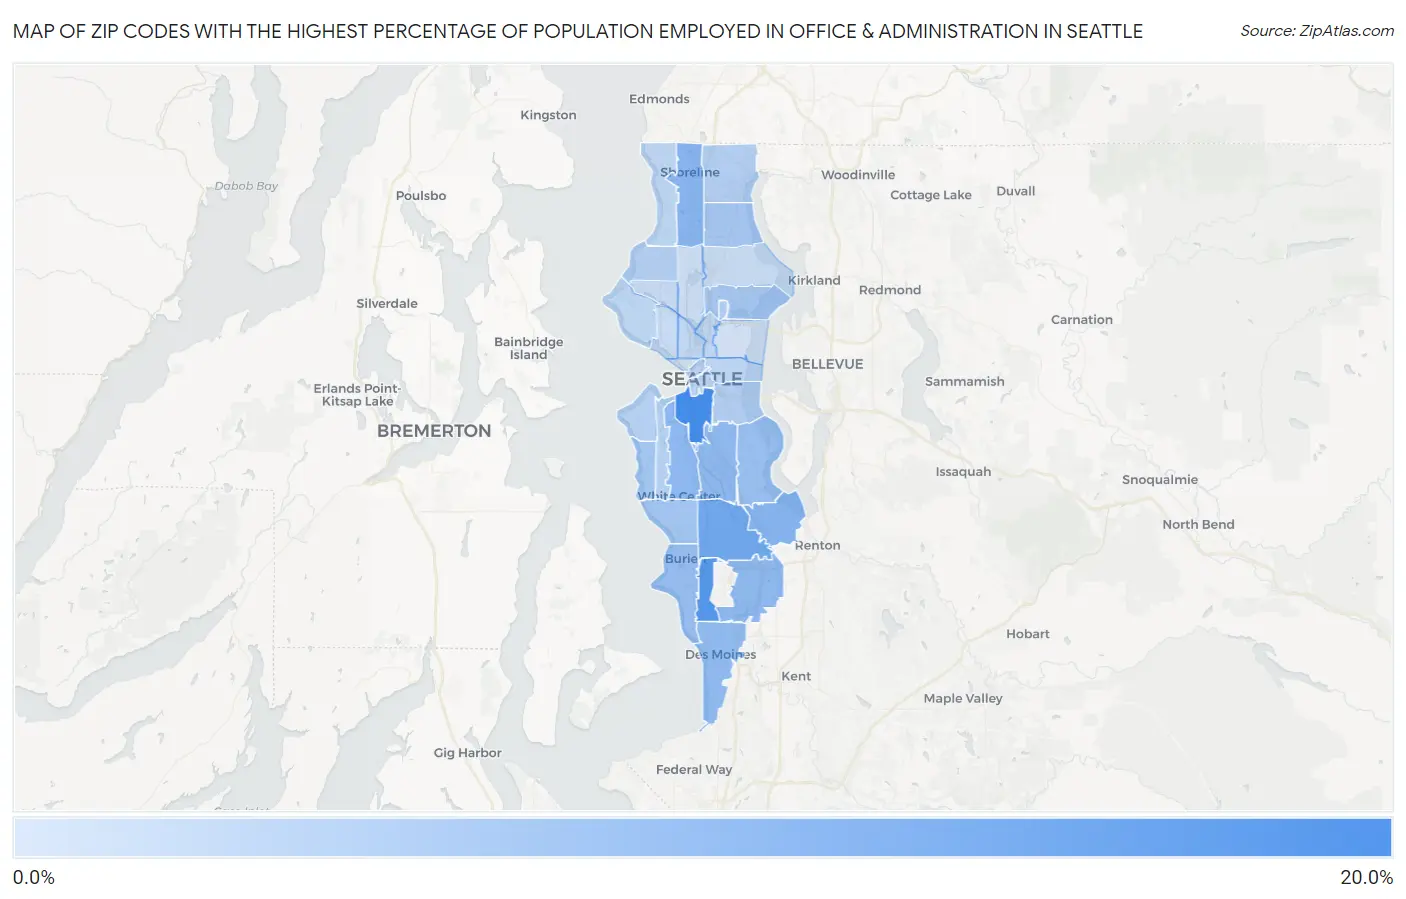
Zip Codes with the Highest Percentage of Population Employed in Office & Administration in Seattle, WA
RELATED REPORTS & OPTIONS
Office & Administration
Seattle
Compare Zip Codes
Map of Zip Codes with the Highest Percentage of Population Employed in Office & Administration in Seattle
4.5%
16.2%

Zip Codes with the Highest Percentage of Population Employed in Office & Administration in Seattle, WA
| Zip Code | % Employed | vs State | vs National | |
| 1. | 98134 | 16.2% | 9.8%(+6.43)#50 | 10.9%(+5.37)#3,385 |
| 2. | 98148 | 15.0% | 9.8%(+5.17)#62 | 10.9%(+4.11)#4,590 |
| 3. | 98168 | 12.4% | 9.8%(+2.64)#130 | 10.9%(+1.58)#9,465 |
| 4. | 98178 | 10.9% | 9.8%(+1.11)#197 | 10.9%(+0.051)#14,149 |
| 5. | 98133 | 10.6% | 9.8%(+0.796)#219 | 10.9%(-0.266)#15,166 |
| 6. | 98106 | 10.2% | 9.8%(+0.411)#245 | 10.9%(-0.651)#16,462 |
| 7. | 98188 | 10.2% | 9.8%(+0.357)#251 | 10.9%(-0.705)#16,637 |
| 8. | 98108 | 10.1% | 9.8%(+0.349)#252 | 10.9%(-0.713)#16,666 |
| 9. | 98198 | 9.8% | 9.8%(-0.044)#273 | 10.9%(-1.11)#17,903 |
| 10. | 98166 | 9.7% | 9.8%(-0.137)#284 | 10.9%(-1.20)#18,226 |
| 11. | 98118 | 9.3% | 9.8%(-0.534)#308 | 10.9%(-1.60)#19,499 |
| 12. | 98146 | 8.5% | 9.8%(-1.27)#352 | 10.9%(-2.34)#21,641 |
| 13. | 98136 | 8.5% | 9.8%(-1.32)#354 | 10.9%(-2.38)#21,759 |
| 14. | 98125 | 8.3% | 9.8%(-1.45)#367 | 10.9%(-2.51)#22,091 |
| 15. | 98105 | 8.3% | 9.8%(-1.51)#371 | 10.9%(-2.57)#22,250 |
| 16. | 98155 | 7.3% | 9.8%(-2.50)#408 | 10.9%(-3.56)#24,625 |
| 17. | 98195 | 7.3% | 9.8%(-2.52)#410 | 10.9%(-3.58)#24,657 |
| 18. | 98144 | 7.3% | 9.8%(-2.54)#413 | 10.9%(-3.60)#24,705 |
| 19. | 98117 | 7.2% | 9.8%(-2.57)#417 | 10.9%(-3.63)#24,764 |
| 20. | 98116 | 7.1% | 9.8%(-2.74)#423 | 10.9%(-3.81)#25,117 |
| 21. | 98126 | 7.0% | 9.8%(-2.77)#425 | 10.9%(-3.83)#25,169 |
| 22. | 98101 | 6.8% | 9.8%(-3.00)#432 | 10.9%(-4.06)#25,569 |
| 23. | 98104 | 6.5% | 9.8%(-3.33)#447 | 10.9%(-4.39)#26,151 |
| 24. | 98177 | 6.5% | 9.8%(-3.33)#448 | 10.9%(-4.39)#26,158 |
| 25. | 98199 | 6.4% | 9.8%(-3.38)#451 | 10.9%(-4.44)#26,243 |
| 26. | 98102 | 6.3% | 9.8%(-3.50)#457 | 10.9%(-4.56)#26,422 |
| 27. | 98122 | 6.2% | 9.8%(-3.62)#464 | 10.9%(-4.68)#26,589 |
| 28. | 98109 | 6.2% | 9.8%(-3.63)#465 | 10.9%(-4.69)#26,605 |
| 29. | 98107 | 5.9% | 9.8%(-3.91)#474 | 10.9%(-4.97)#27,009 |
| 30. | 98119 | 5.7% | 9.8%(-4.04)#478 | 10.9%(-5.11)#27,205 |
| 31. | 98164 | 5.6% | 9.8%(-4.21)#483 | 10.9%(-5.27)#27,423 |
| 32. | 98115 | 5.5% | 9.8%(-4.32)#485 | 10.9%(-5.38)#27,575 |
| 33. | 98103 | 5.3% | 9.8%(-4.53)#489 | 10.9%(-5.59)#27,824 |
| 34. | 98112 | 4.6% | 9.8%(-5.22)#501 | 10.9%(-6.28)#28,502 |
| 35. | 98121 | 4.5% | 9.8%(-5.31)#502 | 10.9%(-6.37)#28,585 |
1
Common Questions
What are the Top 10 Zip Codes with the Highest Percentage of Population Employed in Office & Administration in Seattle, WA?
Top 10 Zip Codes with the Highest Percentage of Population Employed in Office & Administration in Seattle, WA are:
What zip code has the Highest Percentage of Population Employed in Office & Administration in Seattle, WA?
98134 has the Highest Percentage of Population Employed in Office & Administration in Seattle, WA with 16.2%.
What is the Percentage of Population Employed in Office & Administration in Seattle, WA?
Percentage of Population Employed in Office & Administration in Seattle is 7.1%.
What is the Percentage of Population Employed in Office & Administration in Washington?
Percentage of Population Employed in Office & Administration in Washington is 9.8%.
What is the Percentage of Population Employed in Office & Administration in the United States?
Percentage of Population Employed in Office & Administration in the United States is 10.9%.