Zip Codes with the Youngest Female Population in Seattle, WA

RELATED REPORTS & OPTIONS

Youngest Population | Female
Population
Families and Households
Female Fertility
Female Fertility (Unmarried)
Race (Community Size)
Race (Percentage)
Ancestry (Community Size)
AfghanAfricanAlaska NativeAlaskan AthabascanAlbanianAleutAmericanApacheArabArgentineanArmenianAssyrian / Chaldean / SyriacAustralianAustrianBahamianBangladeshiBarbadianBasqueBelgianBelizeanBhutaneseBlackfeetBolivianBrazilianBritishBritish West IndianBulgarianBurmeseCajunCambodianCanadianCape VerdeanCarpatho RusynCelticCentral AmericanCentral American IndianCherokeeCheyenneChickasawChileanChineseChippewaChoctawColombianColvilleComancheCosta RicanCreeCreekCroatianCrowCubanCypriotCzechCzechoslovakianDanishDelawareDominicanDutchEastern EuropeanEcuadorianEgyptianEnglishEstonianEthiopianEuropeanFijianFilipinoFinnishFrenchFrench American IndianFrench CanadianGermanGerman RussianGhanaianGreekGuamanian / ChamorroGuatemalanGuyaneseHaitianHonduranHopiHungarianIcelanderIndian (Asian)IndonesianInupiatIranianIraqiIrishIroquoisIsraeliItalianJamaicanJapaneseJordanianKenyanKoreanLaotianLatvianLebaneseLithuanianLuxembourgerMacedonianMalaysianMalteseMarshalleseMexicanMexican American IndianMongolianMoroccanNative HawaiianNavajoNepaleseNew ZealanderNicaraguanNigerianNorthern EuropeanNorwegianOkinawanOsagePakistaniPalestinianPanamanianParaguayanPennsylvania GermanPeruvianPolishPortuguesePotawatomiPuebloPuerto RicanPuget Sound SalishRomanianRussianSalvadoranSamoanScandinavianScotch-IrishScottishSeminoleSenegaleseSerbianShoshoneSiouxSlavicSlovakSloveneSomaliSouth AfricanSouth AmericanSouth American IndianSpaniardSpanishSpanish AmericanSri LankanSubsaharan AfricanSudaneseSwedishSwissSyrianThaiTlingit-HaidaTonganTrinidadian and TobagonianTsimshianTurkishUgandanUkrainianUruguayanUteVenezuelanVietnameseWelshWest IndianYakamaYaquiYugoslavianYup'ik
Ancestry (Percentage)
AfghanAfricanAlaska NativeAlaskan AthabascanAlbanianAleutAmericanApacheArabArgentineanArmenianAssyrian / Chaldean / SyriacAustralianAustrianBahamianBangladeshiBarbadianBasqueBelgianBelizeanBhutaneseBlackfeetBolivianBrazilianBritishBritish West IndianBulgarianBurmeseCajunCambodianCanadianCape VerdeanCarpatho RusynCelticCentral AmericanCentral American IndianCherokeeCheyenneChickasawChileanChineseChippewaChoctawColombianColvilleComancheCosta RicanCreeCreekCroatianCrowCubanCypriotCzechCzechoslovakianDanishDelawareDominicanDutchEastern EuropeanEcuadorianEgyptianEnglishEstonianEthiopianEuropeanFijianFilipinoFinnishFrenchFrench American IndianFrench CanadianGermanGerman RussianGhanaianGreekGuamanian / ChamorroGuatemalanGuyaneseHaitianHonduranHopiHungarianIcelanderIndian (Asian)IndonesianInupiatIranianIraqiIrishIroquoisIsraeliItalianJamaicanJapaneseJordanianKenyanKoreanLaotianLatvianLebaneseLithuanianLuxembourgerMacedonianMalaysianMalteseMarshalleseMexicanMexican American IndianMongolianMoroccanNative HawaiianNavajoNepaleseNew ZealanderNicaraguanNigerianNorthern EuropeanNorwegianOkinawanOsagePakistaniPalestinianPanamanianParaguayanPennsylvania GermanPeruvianPolishPortuguesePotawatomiPuebloPuerto RicanPuget Sound SalishRomanianRussianSalvadoranSamoanScandinavianScotch-IrishScottishSeminoleSenegaleseSerbianShoshoneSiouxSlavicSlovakSloveneSomaliSouth AfricanSouth AmericanSouth American IndianSpaniardSpanishSpanish AmericanSri LankanSubsaharan AfricanSudaneseSwedishSwissSyrianThaiTlingit-HaidaTonganTrinidadian and TobagonianTsimshianTurkishUgandanUkrainianUruguayanUteVenezuelanVietnameseWelshWest IndianYakamaYaquiYugoslavianYup'ik
Immigrant Origin (Total)
AfghanistanAfricaAlbaniaArgentinaArmeniaAsiaAustraliaAustriaBangladeshBelarusBelgiumBelizeBoliviaBosnia and HerzegovinaBrazilBulgariaBurma / MyanmarCambodiaCameroonCanadaCaribbeanCentral AmericaChileChinaColombiaCongoCosta RicaCroatiaCubaCzechoslovakiaDenmarkDominican RepublicEastern AfricaEastern AsiaEastern EuropeEcuadorEgyptEl SalvadorEnglandEritreaEthiopiaEuropeFijiFranceGermanyGhanaGreeceGuatemalaHaitiHondurasHong KongHungaryIndiaIndonesiaIranIraqIrelandIsraelItalyJamaicaJapanJordanKazakhstanKenyaKoreaKuwaitLaosLatin AmericaLatviaLebanonLiberiaLithuaniaMalaysiaMexicoMicronesiaMiddle AfricaMoldovaMoroccoNepalNetherlandsNicaraguaNigeriaNorth MacedoniaNorthern AfricaNorthern EuropeNorwayOceaniaPakistanPanamaPeruPhilippinesPolandPortugalRomaniaRussiaSaudi ArabiaScotlandSenegalSerbiaSierra LeoneSingaporeSomaliaSouth AfricaSouth AmericaSouth Central AsiaSouth Eastern AsiaSouthern EuropeSpainSri LankaSudanSwedenSwitzerlandSyriaTaiwanThailandTrinidad and TobagoTurkeyUgandaUkraineUzbekistanVenezuelaVietnamWestern AfricaWestern AsiaWestern EuropeYemenZaireZimbabwe
Immigrant Origin (Percentage)
AfghanistanAfricaAlbaniaArgentinaArmeniaAsiaAustraliaAustriaBangladeshBelarusBelgiumBelizeBoliviaBosnia and HerzegovinaBrazilBulgariaBurma / MyanmarCambodiaCameroonCanadaCaribbeanCentral AmericaChileChinaColombiaCongoCosta RicaCroatiaCubaCzechoslovakiaDenmarkDominican RepublicEastern AfricaEastern AsiaEastern EuropeEcuadorEgyptEl SalvadorEnglandEritreaEthiopiaEuropeFijiFranceGermanyGhanaGreeceGuatemalaHaitiHondurasHong KongHungaryIndiaIndonesiaIranIraqIrelandIsraelItalyJamaicaJapanJordanKazakhstanKenyaKoreaKuwaitLaosLatin AmericaLatviaLebanonLiberiaLithuaniaMalaysiaMexicoMicronesiaMiddle AfricaMoldovaMoroccoNepalNetherlandsNicaraguaNigeriaNorth MacedoniaNorthern AfricaNorthern EuropeNorwayOceaniaPakistanPanamaPeruPhilippinesPolandPortugalRomaniaRussiaSaudi ArabiaScotlandSenegalSerbiaSierra LeoneSingaporeSomaliaSouth AfricaSouth AmericaSouth Central AsiaSouth Eastern AsiaSouthern EuropeSpainSri LankaSudanSwedenSwitzerlandSyriaTaiwanThailandTrinidad and TobagoTurkeyUgandaUkraineUzbekistanVenezuelaVietnamWestern AfricaWestern AsiaWestern EuropeYemenZaireZimbabwe
Income
Income (Families)
Income (Households)
Poverty
Poverty (Families)
Unemployment
Employment Occupations
Employment Industries
Employer Class
Commute Time
Commute Means
School Enrollment
Education by Degree Field
Occupancy
Finances
Physical Characteristics
Seattle
Compare Zip Codes
Comparison Subject

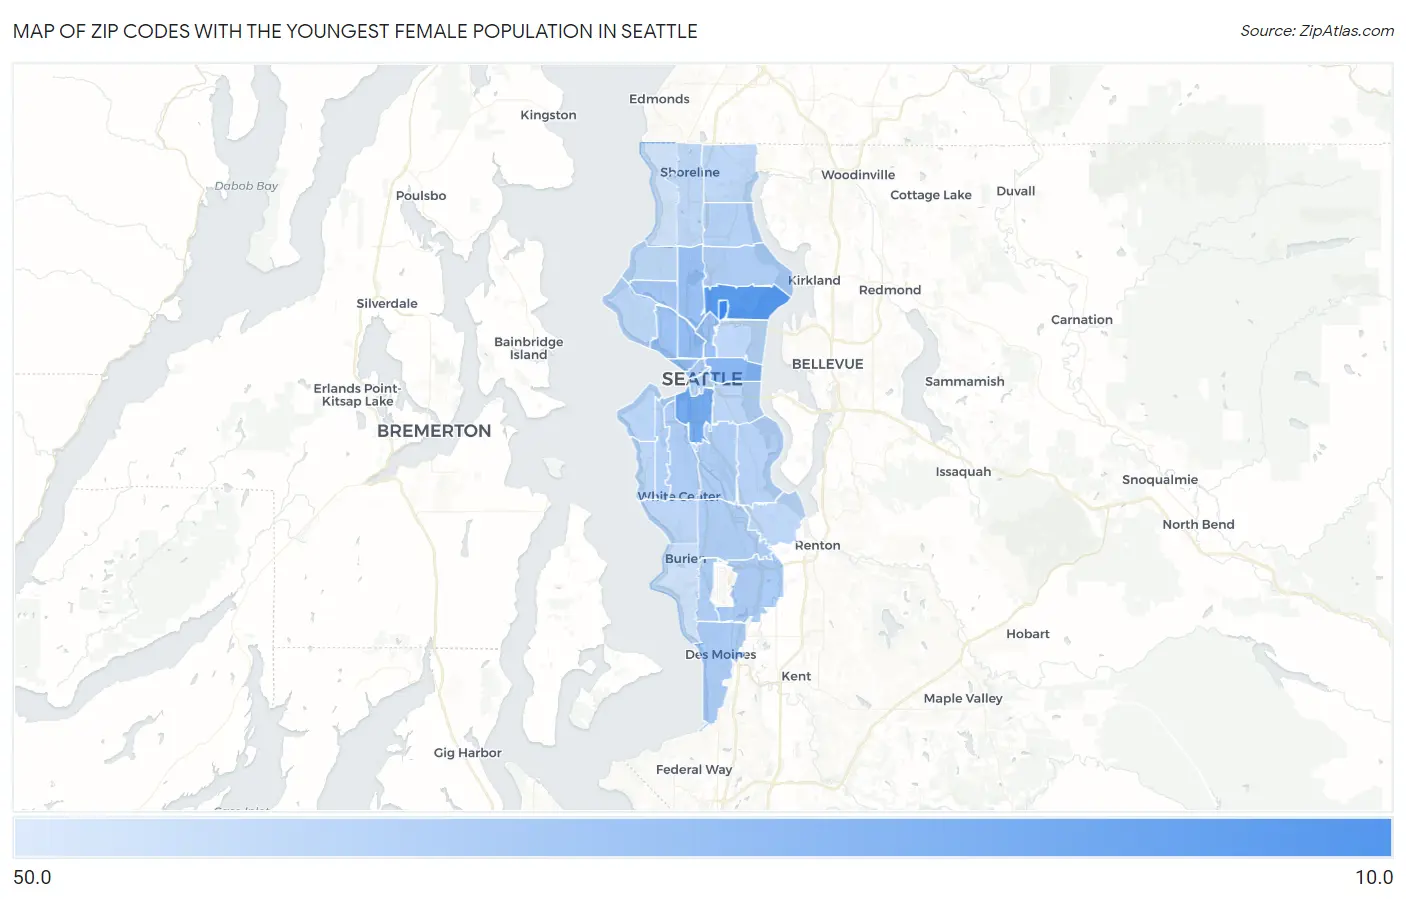
Map of Zip Codes with the Youngest Female Population in Seattle

50.0
0.0
Zip Codes with the Youngest Female Population in Seattle Map

Zip Codes with the Youngest Female Population in Seattle, WA

Zip Code Median Age vs State vs National
1.9819519.239.0(-19.8)#339.7(-20.5)#283
2.9810522.939.0(-16.1)#1939.7(-16.8)#835
3.9813426.839.0(-12.2)#3239.7(-12.9)#1,312
4.9812230.139.0(-8.90)#5239.7(-9.60)#2,126
5.9810931.839.0(-7.20)#6239.7(-7.90)#2,839
6.9812132.339.0(-6.70)#6939.7(-7.40)#3,114
7.9810332.939.0(-6.10)#7839.7(-6.80)#3,481
8.9810233.439.0(-5.60)#8539.7(-6.30)#3,815
9.9811934.139.0(-4.90)#9739.7(-5.60)#4,372
10.9810735.239.0(-3.80)#11539.7(-4.50)#5,275
11.9818836.639.0(-2.40)#14339.7(-3.10)#6,793
12.9819836.739.0(-2.30)#15039.7(-3.00)#6,891
13.9810136.839.0(-2.20)#15139.7(-2.90)#7,028
14.9811537.039.0(-2.00)#15339.7(-2.70)#7,224
15.9810637.039.0(-2.00)#15439.7(-2.70)#7,251
16.9816837.339.0(-1.70)#16339.7(-2.40)#7,552
17.9814837.539.0(-1.50)#16939.7(-2.20)#7,841
18.9810837.639.0(-1.40)#17139.7(-2.10)#7,958
19.9812638.139.0(-0.900)#18439.7(-1.60)#8,644
20.9816438.639.0(-0.400)#20139.7(-1.10)#9,450
21.9812538.739.0(-0.300)#20239.7(-1.000)#9,464
22.9811839.139.0(+0.100)#21639.7(-0.600)#10,074
23.9810439.439.0(+0.400)#22639.7(-0.300)#10,554
24.9811639.639.0(+0.600)#23339.7(-0.100)#10,833
25.9814440.139.0(+1.10)#25339.7(+0.400)#11,584
26.9814640.539.0(+1.50)#26739.7(+0.800)#12,195
27.9811740.739.0(+1.70)#27539.7(+1.000)#12,523
28.9819940.739.0(+1.70)#27939.7(+1.000)#12,549
29.9813640.839.0(+1.80)#28939.7(+1.10)#12,704
30.9815541.139.0(+2.10)#30039.7(+1.40)#13,176
31.9813341.239.0(+2.20)#30639.7(+1.50)#13,314
32.9817841.439.0(+2.40)#31239.7(+1.70)#13,640
33.9811241.639.0(+2.60)#31839.7(+1.90)#13,999
34.9816644.839.0(+5.80)#36339.7(+5.10)#18,772
35.9817745.339.0(+6.30)#37039.7(+5.60)#19,411

Common Questions

What are the Top 10 Zip Codes with the Youngest Female Population in Seattle, WA?
Top 10 Zip Codes with the Youngest Female Population in Seattle, WA are:
#1
19.2
#2
22.9
#3
26.8
#4
30.1
#5
31.8
#6
32.3
#7
32.9
#8
33.4
#9
34.1
#10
35.2
What zip code has the Youngest Female Population in Seattle, WA?
98195 has the Youngest Female Population in Seattle, WA with 19.2.
What is the Median Female Age in Seattle, WA?
Median Female Age in Seattle is 35.6.
What is the Median Female Age in Washington?
Median Female Age in Washington is 39.0.
What is the Median Female Age in the United States?
Median Female Age in the United States is 39.7.