Zip Codes with the Highest Percentage of Population with a Degree in Literature and Languages in Seattle, WA

RELATED REPORTS & OPTIONS

Literature and Languages
Population
Families and Households
Female Fertility
Female Fertility (Unmarried)
Race (Community Size)
Race (Percentage)
Ancestry (Community Size)
AfghanAfricanAlaska NativeAlaskan AthabascanAlbanianAleutAmericanApacheArabArgentineanArmenianAssyrian / Chaldean / SyriacAustralianAustrianBahamianBangladeshiBarbadianBasqueBelgianBelizeanBhutaneseBlackfeetBolivianBrazilianBritishBritish West IndianBulgarianBurmeseCajunCambodianCanadianCape VerdeanCarpatho RusynCelticCentral AmericanCentral American IndianCherokeeCheyenneChickasawChileanChineseChippewaChoctawColombianColvilleComancheCosta RicanCreeCreekCroatianCrowCubanCypriotCzechCzechoslovakianDanishDelawareDominicanDutchEastern EuropeanEcuadorianEgyptianEnglishEstonianEthiopianEuropeanFijianFilipinoFinnishFrenchFrench American IndianFrench CanadianGermanGerman RussianGhanaianGreekGuamanian / ChamorroGuatemalanGuyaneseHaitianHonduranHopiHungarianIcelanderIndian (Asian)IndonesianInupiatIranianIraqiIrishIroquoisIsraeliItalianJamaicanJapaneseJordanianKenyanKoreanLaotianLatvianLebaneseLithuanianLuxembourgerMacedonianMalaysianMalteseMarshalleseMexicanMexican American IndianMongolianMoroccanNative HawaiianNavajoNepaleseNew ZealanderNicaraguanNigerianNorthern EuropeanNorwegianOkinawanOsagePakistaniPalestinianPanamanianParaguayanPennsylvania GermanPeruvianPolishPortuguesePotawatomiPuebloPuerto RicanPuget Sound SalishRomanianRussianSalvadoranSamoanScandinavianScotch-IrishScottishSeminoleSenegaleseSerbianShoshoneSiouxSlavicSlovakSloveneSomaliSouth AfricanSouth AmericanSouth American IndianSpaniardSpanishSpanish AmericanSri LankanSubsaharan AfricanSudaneseSwedishSwissSyrianThaiTlingit-HaidaTonganTrinidadian and TobagonianTsimshianTurkishUgandanUkrainianUruguayanUteVenezuelanVietnameseWelshWest IndianYakamaYaquiYugoslavianYup'ik
Ancestry (Percentage)
AfghanAfricanAlaska NativeAlaskan AthabascanAlbanianAleutAmericanApacheArabArgentineanArmenianAssyrian / Chaldean / SyriacAustralianAustrianBahamianBangladeshiBarbadianBasqueBelgianBelizeanBhutaneseBlackfeetBolivianBrazilianBritishBritish West IndianBulgarianBurmeseCajunCambodianCanadianCape VerdeanCarpatho RusynCelticCentral AmericanCentral American IndianCherokeeCheyenneChickasawChileanChineseChippewaChoctawColombianColvilleComancheCosta RicanCreeCreekCroatianCrowCubanCypriotCzechCzechoslovakianDanishDelawareDominicanDutchEastern EuropeanEcuadorianEgyptianEnglishEstonianEthiopianEuropeanFijianFilipinoFinnishFrenchFrench American IndianFrench CanadianGermanGerman RussianGhanaianGreekGuamanian / ChamorroGuatemalanGuyaneseHaitianHonduranHopiHungarianIcelanderIndian (Asian)IndonesianInupiatIranianIraqiIrishIroquoisIsraeliItalianJamaicanJapaneseJordanianKenyanKoreanLaotianLatvianLebaneseLithuanianLuxembourgerMacedonianMalaysianMalteseMarshalleseMexicanMexican American IndianMongolianMoroccanNative HawaiianNavajoNepaleseNew ZealanderNicaraguanNigerianNorthern EuropeanNorwegianOkinawanOsagePakistaniPalestinianPanamanianParaguayanPennsylvania GermanPeruvianPolishPortuguesePotawatomiPuebloPuerto RicanPuget Sound SalishRomanianRussianSalvadoranSamoanScandinavianScotch-IrishScottishSeminoleSenegaleseSerbianShoshoneSiouxSlavicSlovakSloveneSomaliSouth AfricanSouth AmericanSouth American IndianSpaniardSpanishSpanish AmericanSri LankanSubsaharan AfricanSudaneseSwedishSwissSyrianThaiTlingit-HaidaTonganTrinidadian and TobagonianTsimshianTurkishUgandanUkrainianUruguayanUteVenezuelanVietnameseWelshWest IndianYakamaYaquiYugoslavianYup'ik
Immigrant Origin (Total)
AfghanistanAfricaAlbaniaArgentinaArmeniaAsiaAustraliaAustriaBangladeshBelarusBelgiumBelizeBoliviaBosnia and HerzegovinaBrazilBulgariaBurma / MyanmarCambodiaCameroonCanadaCaribbeanCentral AmericaChileChinaColombiaCongoCosta RicaCroatiaCubaCzechoslovakiaDenmarkDominican RepublicEastern AfricaEastern AsiaEastern EuropeEcuadorEgyptEl SalvadorEnglandEritreaEthiopiaEuropeFijiFranceGermanyGhanaGreeceGuatemalaHaitiHondurasHong KongHungaryIndiaIndonesiaIranIraqIrelandIsraelItalyJamaicaJapanJordanKazakhstanKenyaKoreaKuwaitLaosLatin AmericaLatviaLebanonLiberiaLithuaniaMalaysiaMexicoMicronesiaMiddle AfricaMoldovaMoroccoNepalNetherlandsNicaraguaNigeriaNorth MacedoniaNorthern AfricaNorthern EuropeNorwayOceaniaPakistanPanamaPeruPhilippinesPolandPortugalRomaniaRussiaSaudi ArabiaScotlandSenegalSerbiaSierra LeoneSingaporeSomaliaSouth AfricaSouth AmericaSouth Central AsiaSouth Eastern AsiaSouthern EuropeSpainSri LankaSudanSwedenSwitzerlandSyriaTaiwanThailandTrinidad and TobagoTurkeyUgandaUkraineUzbekistanVenezuelaVietnamWestern AfricaWestern AsiaWestern EuropeYemenZaireZimbabwe
Immigrant Origin (Percentage)
AfghanistanAfricaAlbaniaArgentinaArmeniaAsiaAustraliaAustriaBangladeshBelarusBelgiumBelizeBoliviaBosnia and HerzegovinaBrazilBulgariaBurma / MyanmarCambodiaCameroonCanadaCaribbeanCentral AmericaChileChinaColombiaCongoCosta RicaCroatiaCubaCzechoslovakiaDenmarkDominican RepublicEastern AfricaEastern AsiaEastern EuropeEcuadorEgyptEl SalvadorEnglandEritreaEthiopiaEuropeFijiFranceGermanyGhanaGreeceGuatemalaHaitiHondurasHong KongHungaryIndiaIndonesiaIranIraqIrelandIsraelItalyJamaicaJapanJordanKazakhstanKenyaKoreaKuwaitLaosLatin AmericaLatviaLebanonLiberiaLithuaniaMalaysiaMexicoMicronesiaMiddle AfricaMoldovaMoroccoNepalNetherlandsNicaraguaNigeriaNorth MacedoniaNorthern AfricaNorthern EuropeNorwayOceaniaPakistanPanamaPeruPhilippinesPolandPortugalRomaniaRussiaSaudi ArabiaScotlandSenegalSerbiaSierra LeoneSingaporeSomaliaSouth AfricaSouth AmericaSouth Central AsiaSouth Eastern AsiaSouthern EuropeSpainSri LankaSudanSwedenSwitzerlandSyriaTaiwanThailandTrinidad and TobagoTurkeyUgandaUkraineUzbekistanVenezuelaVietnamWestern AfricaWestern AsiaWestern EuropeYemenZaireZimbabwe
Income
Income (Families)
Income (Households)
Poverty
Poverty (Families)
Unemployment
Employment Occupations
Employment Industries
Employer Class
Commute Time
Commute Means
School Enrollment
Education by Degree Field
Occupancy
Finances
Physical Characteristics
Seattle
Compare Zip Codes
Comparison Subject

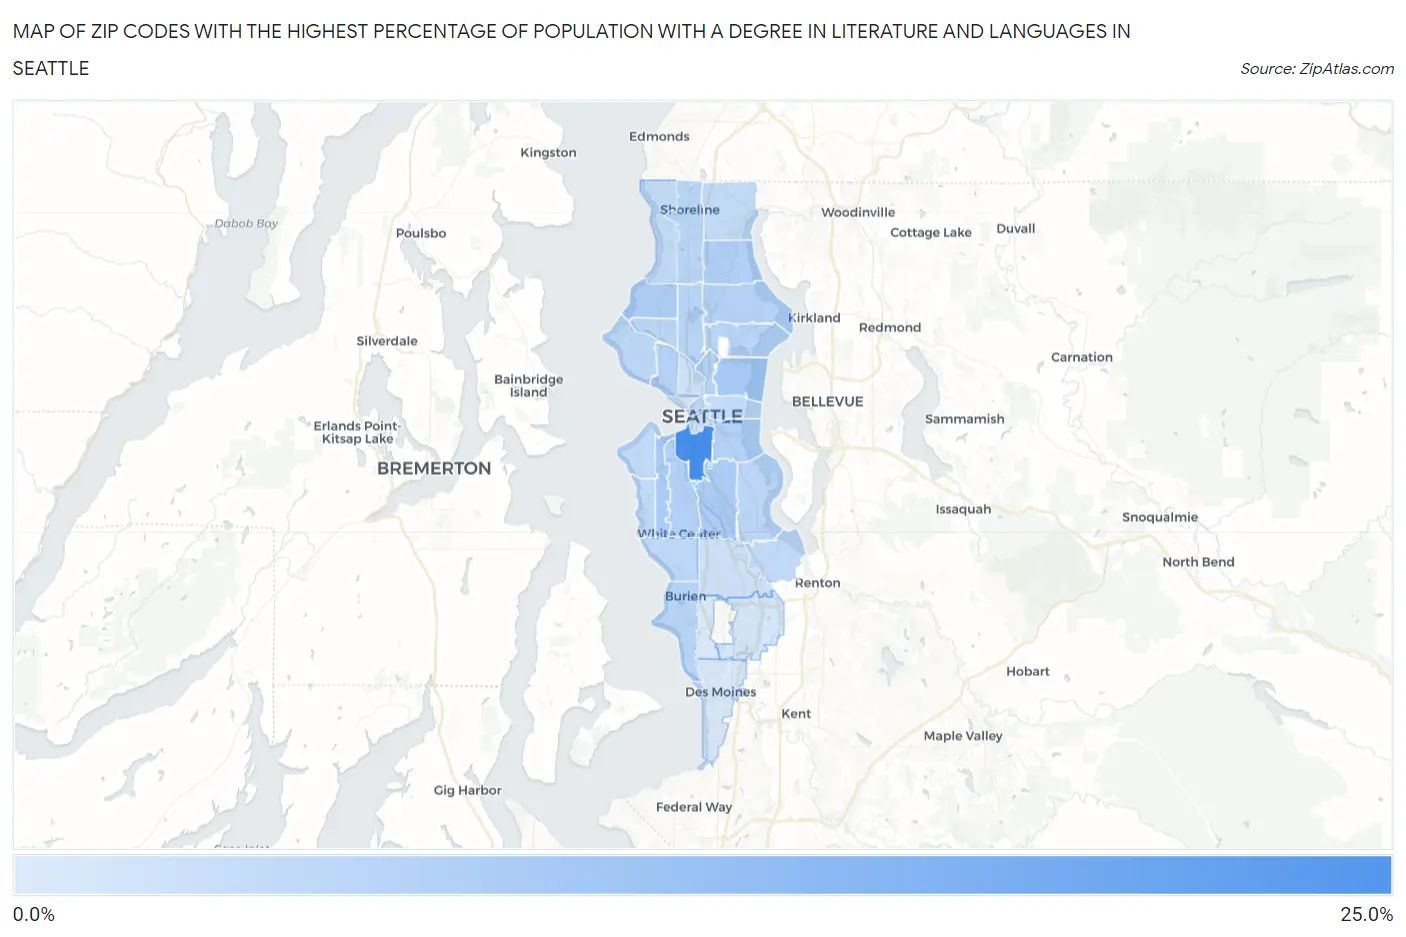
Map of Zip Codes with the Highest Percentage of Population with a Degree in Literature and Languages in Seattle

0.0%
25.0%
Zip Codes with the Highest Percentage of Population with a Degree in Literature and Languages in Seattle Map

Zip Codes with the Highest Percentage of Population with a Degree in Literature and Languages in Seattle, WA

Zip Code % Graduates vs State vs National
1.9813420.8%5.3%(+15.5)#64.4%(+16.4)#447
2.981129.2%5.3%(+3.95)#444.4%(+4.83)#2,187
3.981268.9%5.3%(+3.59)#524.4%(+4.46)#2,391
4.981088.7%5.3%(+3.42)#544.4%(+4.29)#2,475
5.981178.4%5.3%(+3.15)#574.4%(+4.02)#2,658
6.981258.3%5.3%(+3.04)#604.4%(+3.91)#2,744
7.981068.0%5.3%(+2.76)#624.4%(+3.63)#2,953
8.981448.0%5.3%(+2.73)#644.4%(+3.60)#2,970
9.981027.8%5.3%(+2.51)#704.4%(+3.39)#3,162
10.981157.8%5.3%(+2.49)#724.4%(+3.36)#3,185
11.981197.4%5.3%(+2.17)#844.4%(+3.04)#3,498
12.981057.3%5.3%(+2.06)#884.4%(+2.93)#3,612
13.981667.3%5.3%(+2.00)#894.4%(+2.87)#3,676
14.981037.3%5.3%(+1.98)#914.4%(+2.85)#3,691
15.981077.1%5.3%(+1.79)#994.4%(+2.66)#3,924
16.981187.0%5.3%(+1.67)#1044.4%(+2.55)#4,042
17.981336.9%5.3%(+1.64)#1064.4%(+2.51)#4,081
18.981996.9%5.3%(+1.60)#1074.4%(+2.47)#4,133
19.981466.8%5.3%(+1.52)#1094.4%(+2.40)#4,231
20.981786.6%5.3%(+1.31)#1184.4%(+2.18)#4,513
21.981366.4%5.3%(+1.16)#1254.4%(+2.03)#4,730
22.981166.4%5.3%(+1.14)#1274.4%(+2.01)#4,757
23.981226.3%5.3%(+1.00)#1314.4%(+1.88)#4,948
24.981016.3%5.3%(+0.977)#1324.4%(+1.85)#4,990
25.981556.2%5.3%(+0.965)#1364.4%(+1.84)#5,029
26.981776.1%5.3%(+0.781)#1454.4%(+1.65)#5,320
27.981045.3%5.3%(-0.015)#1884.4%(+0.858)#6,791
28.981095.1%5.3%(-0.226)#1974.4%(+0.648)#7,216
29.981685.0%5.3%(-0.251)#1984.4%(+0.622)#7,280
30.981884.4%5.3%(-0.901)#2404.4%(-0.027)#9,051
31.981983.8%5.3%(-1.44)#2704.4%(-0.565)#10,694
32.981483.6%5.3%(-1.70)#2914.4%(-0.822)#11,544
33.981213.5%5.3%(-1.76)#2964.4%(-0.890)#11,787

Common Questions

What are the Top 10 Zip Codes with the Highest Percentage of Population with a Degree in Literature and Languages in Seattle, WA?
Top 10 Zip Codes with the Highest Percentage of Population with a Degree in Literature and Languages in Seattle, WA are:
#1
20.8%
#2
9.2%
#3
8.9%
#4
8.7%
#5
8.4%
#6
8.3%
#7
8.0%
#8
8.0%
#9
7.8%
#10
7.8%
What zip code has the Highest Percentage of Population with a Degree in Literature and Languages in Seattle, WA?
98134 has the Highest Percentage of Population with a Degree in Literature and Languages in Seattle, WA with 20.8%.
What is the Percentage of Population with a Degree in Literature and Languages in Seattle, WA?
Percentage of Population with a Degree in Literature and Languages in Seattle is 7.2%.
What is the Percentage of Population with a Degree in Literature and Languages in Washington?
Percentage of Population with a Degree in Literature and Languages in Washington is 5.3%.
What is the Percentage of Population with a Degree in Literature and Languages in the United States?
Percentage of Population with a Degree in Literature and Languages in the United States is 4.4%.