Zip Codes with the Highest Percentage of Population with a Degree in Psychology in Seattle, WA
RELATED REPORTS & OPTIONS
Psychology
Seattle
Compare Zip Codes
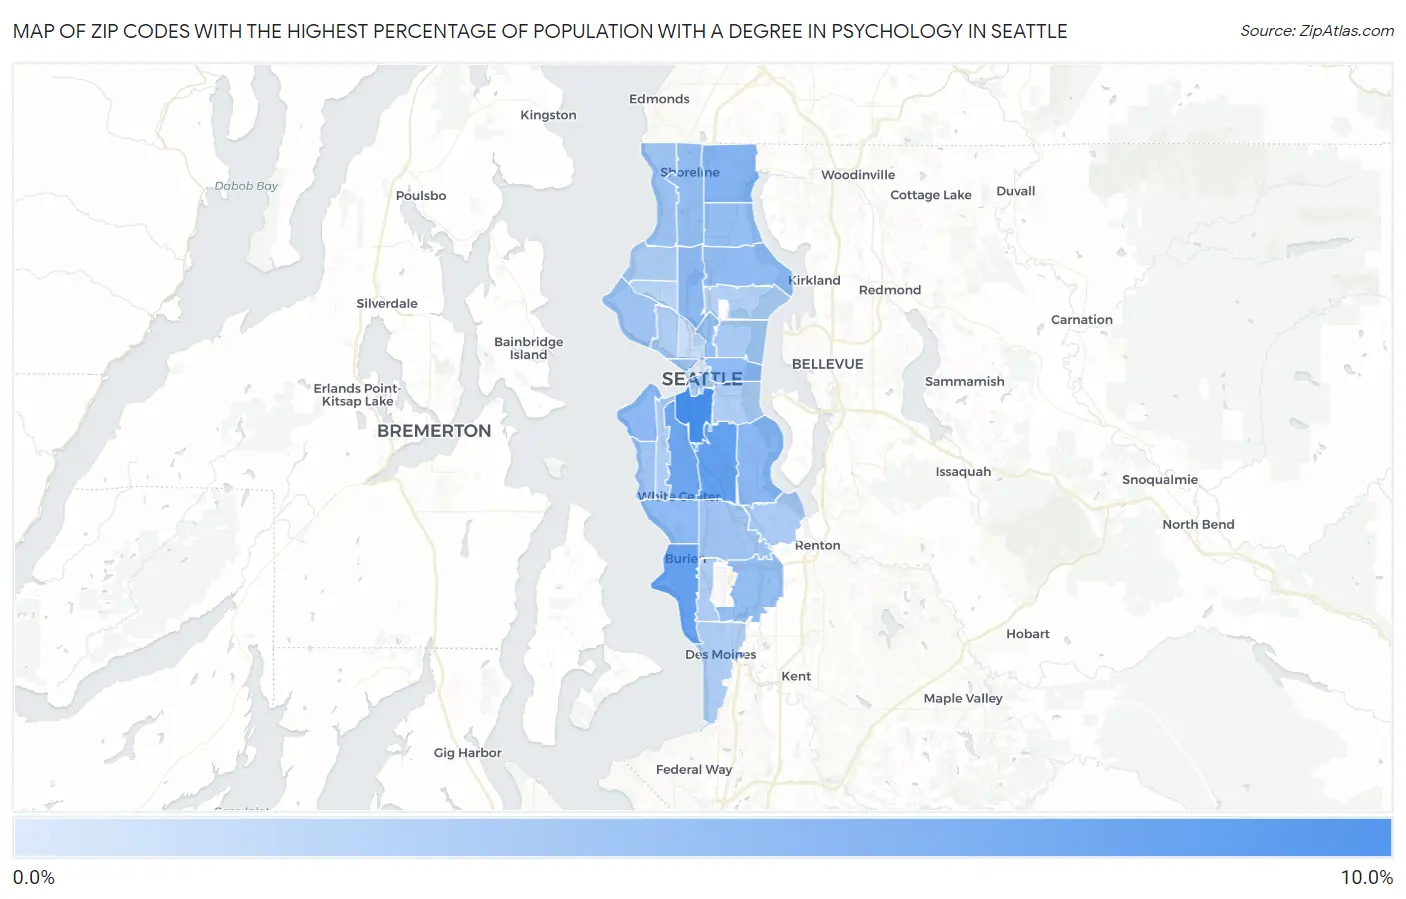
Map of Zip Codes with the Highest Percentage of Population with a Degree in Psychology in Seattle
1.5%
8.9%
Zip Codes with the Highest Percentage of Population with a Degree in Psychology in Seattle, WA
| Zip Code | % Graduates | vs State | vs National | |
| 1. | 98134 | 8.9% | 4.9%(+4.07)#57 | 5.1%(+3.87)#3,206 |
| 2. | 98108 | 7.5% | 4.9%(+2.68)#92 | 5.1%(+2.49)#4,749 |
| 3. | 98166 | 7.3% | 4.9%(+2.45)#99 | 5.1%(+2.25)#5,118 |
| 4. | 98106 | 6.9% | 4.9%(+2.08)#112 | 5.1%(+1.88)#5,760 |
| 5. | 98155 | 5.9% | 4.9%(+1.02)#165 | 5.1%(+0.827)#8,337 |
| 6. | 98118 | 5.5% | 4.9%(+0.678)#192 | 5.1%(+0.483)#9,406 |
| 7. | 98103 | 5.4% | 4.9%(+0.510)#207 | 5.1%(+0.315)#9,951 |
| 8. | 98116 | 5.3% | 4.9%(+0.481)#210 | 5.1%(+0.286)#10,038 |
| 9. | 98146 | 5.3% | 4.9%(+0.444)#214 | 5.1%(+0.249)#10,151 |
| 10. | 98122 | 5.3% | 4.9%(+0.400)#220 | 5.1%(+0.205)#10,333 |
| 11. | 98115 | 5.2% | 4.9%(+0.339)#226 | 5.1%(+0.144)#10,561 |
| 12. | 98133 | 5.1% | 4.9%(+0.272)#233 | 5.1%(+0.077)#10,808 |
| 13. | 98188 | 5.0% | 4.9%(+0.142)#245 | 5.1%(-0.053)#11,290 |
| 14. | 98102 | 5.0% | 4.9%(+0.134)#246 | 5.1%(-0.061)#11,315 |
| 15. | 98125 | 4.9% | 4.9%(+0.048)#250 | 5.1%(-0.147)#11,623 |
| 16. | 98136 | 4.5% | 4.9%(-0.311)#270 | 5.1%(-0.506)#12,955 |
| 17. | 98177 | 4.5% | 4.9%(-0.387)#275 | 5.1%(-0.582)#13,235 |
| 18. | 98168 | 4.4% | 4.9%(-0.421)#277 | 5.1%(-0.616)#13,355 |
| 19. | 98199 | 4.4% | 4.9%(-0.458)#279 | 5.1%(-0.653)#13,482 |
| 20. | 98121 | 4.3% | 4.9%(-0.594)#294 | 5.1%(-0.789)#13,993 |
| 21. | 98104 | 4.2% | 4.9%(-0.608)#295 | 5.1%(-0.803)#14,044 |
| 22. | 98112 | 4.1% | 4.9%(-0.801)#309 | 5.1%(-0.996)#14,730 |
| 23. | 98178 | 4.0% | 4.9%(-0.890)#317 | 5.1%(-1.08)#15,050 |
| 24. | 98117 | 3.8% | 4.9%(-1.07)#333 | 5.1%(-1.27)#15,683 |
| 25. | 98119 | 3.7% | 4.9%(-1.14)#337 | 5.1%(-1.34)#15,906 |
| 26. | 98144 | 3.7% | 4.9%(-1.16)#340 | 5.1%(-1.35)#15,968 |
| 27. | 98126 | 3.7% | 4.9%(-1.18)#343 | 5.1%(-1.38)#16,051 |
| 28. | 98148 | 3.6% | 4.9%(-1.22)#346 | 5.1%(-1.41)#16,187 |
| 29. | 98198 | 3.6% | 4.9%(-1.23)#348 | 5.1%(-1.43)#16,238 |
| 30. | 98105 | 3.5% | 4.9%(-1.36)#358 | 5.1%(-1.56)#16,713 |
| 31. | 98107 | 3.1% | 4.9%(-1.71)#373 | 5.1%(-1.90)#17,803 |
| 32. | 98109 | 2.5% | 4.9%(-2.39)#407 | 5.1%(-2.59)#19,700 |
| 33. | 98101 | 1.5% | 4.9%(-3.39)#428 | 5.1%(-3.58)#21,871 |
1
Common Questions
What are the Top 10 Zip Codes with the Highest Percentage of Population with a Degree in Psychology in Seattle, WA?
Top 10 Zip Codes with the Highest Percentage of Population with a Degree in Psychology in Seattle, WA are:
What zip code has the Highest Percentage of Population with a Degree in Psychology in Seattle, WA?
98134 has the Highest Percentage of Population with a Degree in Psychology in Seattle, WA with 8.9%.
What is the Percentage of Population with a Degree in Psychology in Seattle, WA?
Percentage of Population with a Degree in Psychology in Seattle is 4.5%.
What is the Percentage of Population with a Degree in Psychology in Washington?
Percentage of Population with a Degree in Psychology in Washington is 4.9%.
What is the Percentage of Population with a Degree in Psychology in the United States?
Percentage of Population with a Degree in Psychology in the United States is 5.1%.