Zip Codes with the Highest Percentage of Population Employed in Transportation & Warehousing in Seattle, WA
RELATED REPORTS & OPTIONS
Transportation & Warehousing
Seattle
Compare Zip Codes
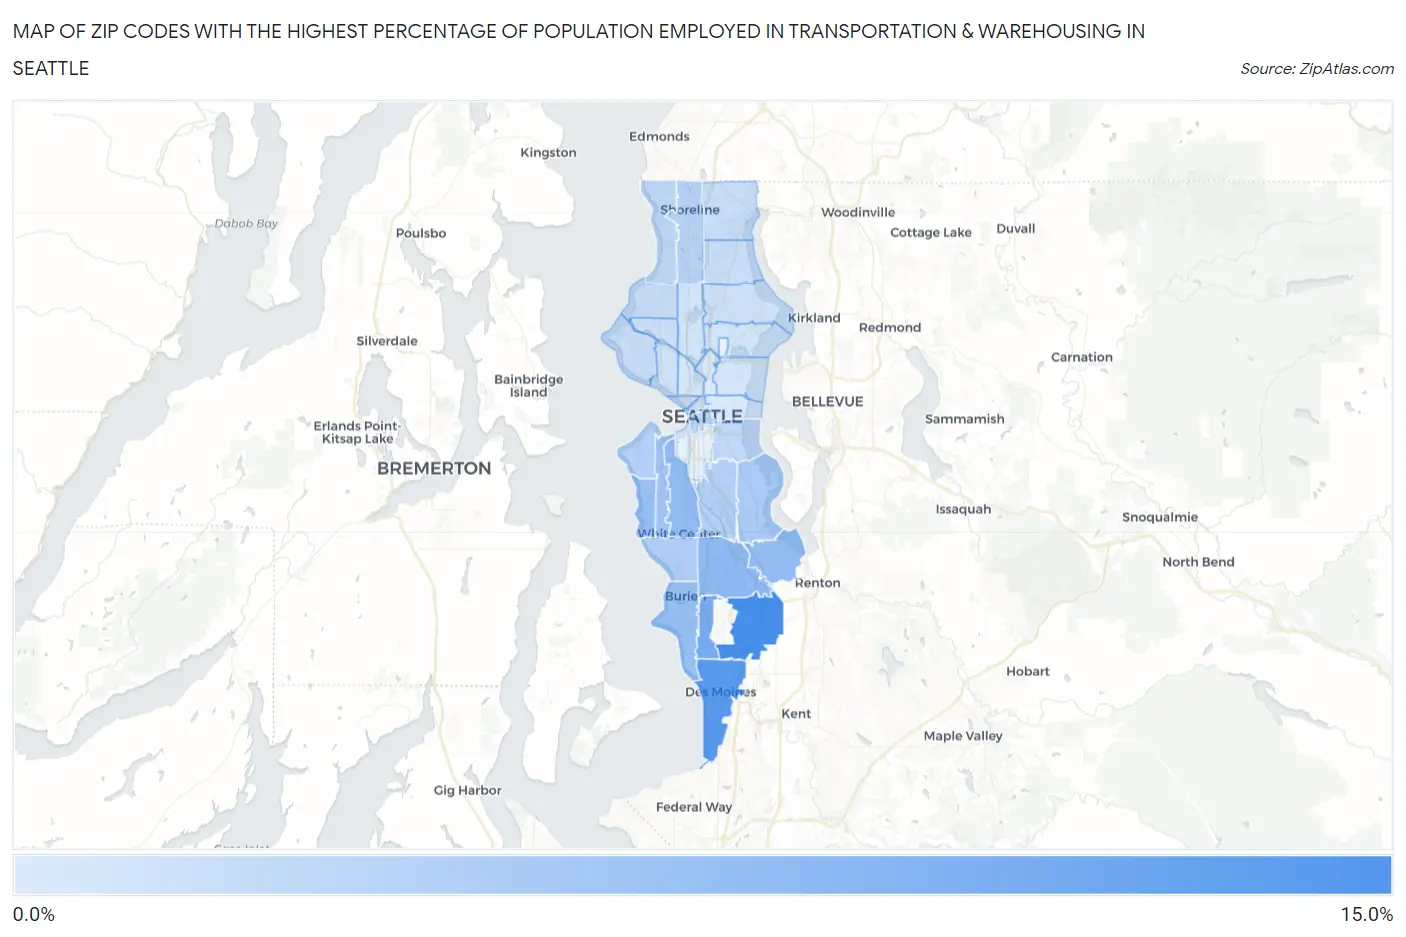
Map of Zip Codes with the Highest Percentage of Population Employed in Transportation & Warehousing in Seattle
1.3%
14.6%
Zip Codes with the Highest Percentage of Population Employed in Transportation & Warehousing in Seattle, WA
| Zip Code | % Employed | vs State | vs National | |
| 1. | 98188 | 14.6% | 4.9%(+9.72)#24 | 4.9%(+9.68)#1,137 |
| 2. | 98198 | 13.1% | 4.9%(+8.18)#29 | 4.9%(+8.15)#1,514 |
| 3. | 98148 | 10.2% | 4.9%(+5.33)#50 | 4.9%(+5.30)#2,731 |
| 4. | 98168 | 8.0% | 4.9%(+3.08)#89 | 4.9%(+3.05)#4,908 |
| 5. | 98106 | 7.8% | 4.9%(+2.89)#95 | 4.9%(+2.86)#5,180 |
| 6. | 98178 | 7.7% | 4.9%(+2.74)#99 | 4.9%(+2.70)#5,394 |
| 7. | 98166 | 7.3% | 4.9%(+2.42)#103 | 4.9%(+2.39)#5,945 |
| 8. | 98136 | 7.3% | 4.9%(+2.38)#106 | 4.9%(+2.35)#6,016 |
| 9. | 98126 | 6.5% | 4.9%(+1.62)#135 | 4.9%(+1.59)#7,498 |
| 10. | 98118 | 5.7% | 4.9%(+0.761)#176 | 4.9%(+0.729)#9,734 |
| 11. | 98146 | 5.2% | 4.9%(+0.284)#205 | 4.9%(+0.252)#11,246 |
| 12. | 98108 | 4.8% | 4.9%(-0.094)#225 | 4.9%(-0.126)#12,550 |
| 13. | 98116 | 4.8% | 4.9%(-0.114)#226 | 4.9%(-0.146)#12,649 |
| 14. | 98133 | 4.4% | 4.9%(-0.495)#246 | 4.9%(-0.527)#14,077 |
| 15. | 98104 | 4.1% | 4.9%(-0.828)#272 | 4.9%(-0.860)#15,536 |
| 16. | 98177 | 4.0% | 4.9%(-0.960)#286 | 4.9%(-0.992)#16,109 |
| 17. | 98144 | 3.6% | 4.9%(-1.29)#308 | 4.9%(-1.32)#17,549 |
| 18. | 98199 | 3.2% | 4.9%(-1.75)#345 | 4.9%(-1.78)#19,517 |
| 19. | 98117 | 3.1% | 4.9%(-1.79)#347 | 4.9%(-1.82)#19,665 |
| 20. | 98125 | 3.1% | 4.9%(-1.85)#352 | 4.9%(-1.89)#20,001 |
| 21. | 98121 | 3.0% | 4.9%(-1.88)#354 | 4.9%(-1.91)#20,090 |
| 22. | 98155 | 3.0% | 4.9%(-1.88)#355 | 4.9%(-1.91)#20,100 |
| 23. | 98101 | 2.7% | 4.9%(-2.25)#386 | 4.9%(-2.28)#21,716 |
| 24. | 98107 | 2.7% | 4.9%(-2.26)#388 | 4.9%(-2.29)#21,743 |
| 25. | 98119 | 2.4% | 4.9%(-2.49)#415 | 4.9%(-2.52)#22,724 |
| 26. | 98115 | 2.4% | 4.9%(-2.50)#418 | 4.9%(-2.54)#22,781 |
| 27. | 98103 | 2.2% | 4.9%(-2.75)#437 | 4.9%(-2.78)#23,693 |
| 28. | 98105 | 2.1% | 4.9%(-2.86)#442 | 4.9%(-2.89)#24,090 |
| 29. | 98112 | 2.0% | 4.9%(-2.87)#444 | 4.9%(-2.90)#24,138 |
| 30. | 98109 | 2.0% | 4.9%(-2.94)#448 | 4.9%(-2.97)#24,335 |
| 31. | 98122 | 1.5% | 4.9%(-3.41)#468 | 4.9%(-3.45)#25,833 |
| 32. | 98102 | 1.3% | 4.9%(-3.58)#474 | 4.9%(-3.61)#26,296 |
1
Common Questions
What are the Top 10 Zip Codes with the Highest Percentage of Population Employed in Transportation & Warehousing in Seattle, WA?
Top 10 Zip Codes with the Highest Percentage of Population Employed in Transportation & Warehousing in Seattle, WA are:
What zip code has the Highest Percentage of Population Employed in Transportation & Warehousing in Seattle, WA?
98188 has the Highest Percentage of Population Employed in Transportation & Warehousing in Seattle, WA with 14.6%.
What is the Percentage of Population Employed in Transportation & Warehousing in Seattle, WA?
Percentage of Population Employed in Transportation & Warehousing in Seattle is 3.3%.
What is the Percentage of Population Employed in Transportation & Warehousing in Washington?
Percentage of Population Employed in Transportation & Warehousing in Washington is 4.9%.
What is the Percentage of Population Employed in Transportation & Warehousing in the United States?
Percentage of Population Employed in Transportation & Warehousing in the United States is 4.9%.