Zip Codes with the Highest Percentage of Population Employed in Life, Physical & Social Science in Seattle, WA
RELATED REPORTS & OPTIONS
Life, Physical & Social Science
Seattle
Compare Zip Codes
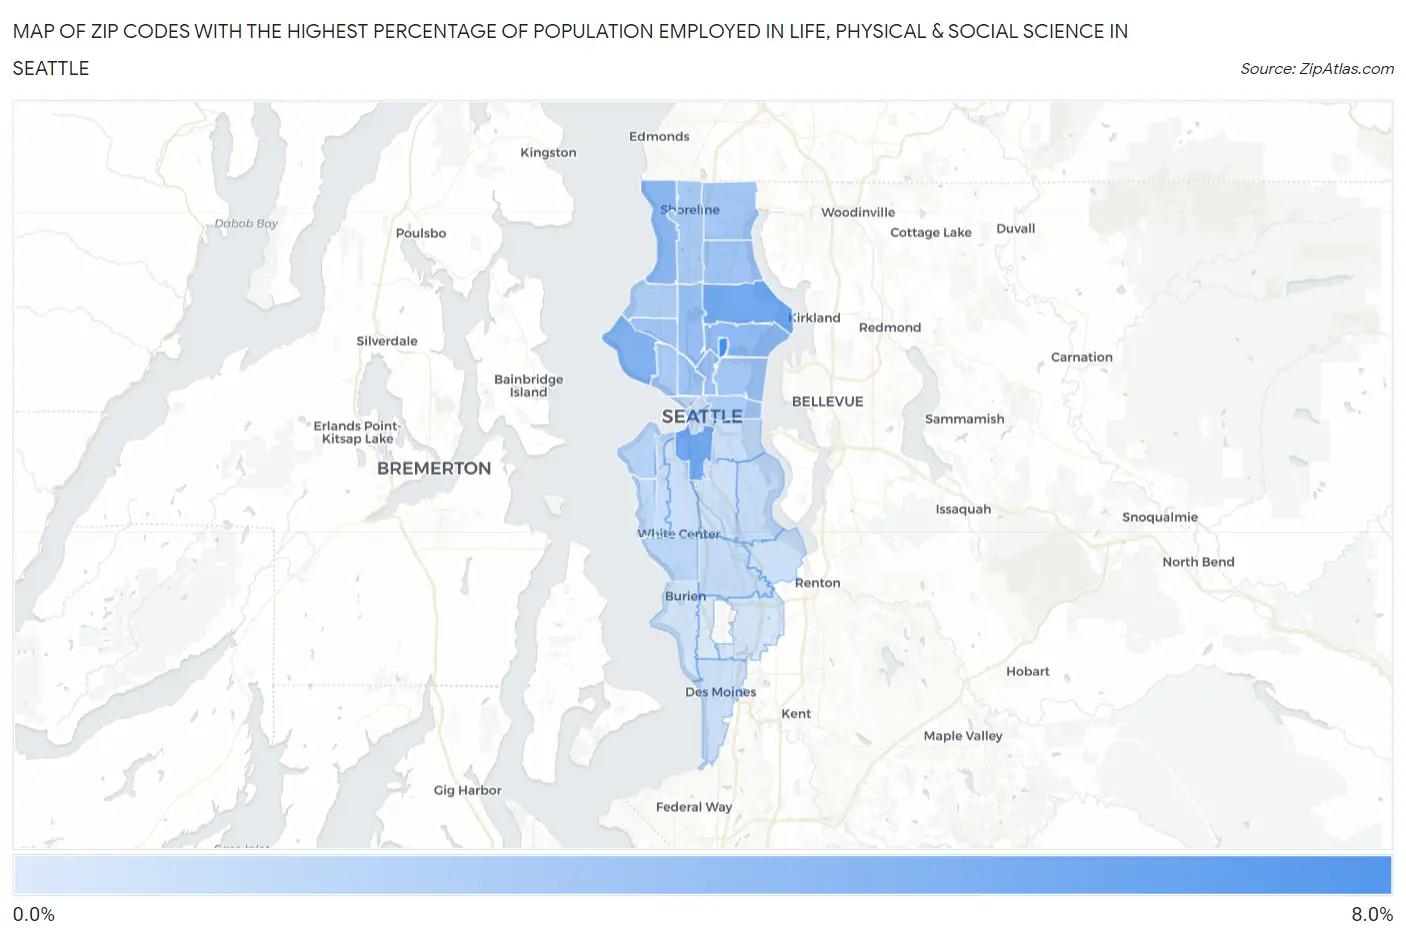
Map of Zip Codes with the Highest Percentage of Population Employed in Life, Physical & Social Science in Seattle
0.16%
7.8%
Zip Codes with the Highest Percentage of Population Employed in Life, Physical & Social Science in Seattle, WA
| Zip Code | % Employed | vs State | vs National | |
| 1. | 98195 | 7.8% | 1.3%(+6.47)#18 | 1.1%(+6.69)#341 |
| 2. | 98134 | 5.6% | 1.3%(+4.32)#22 | 1.1%(+4.54)#606 |
| 3. | 98115 | 5.5% | 1.3%(+4.18)#25 | 1.1%(+4.40)#629 |
| 4. | 98199 | 4.6% | 1.3%(+3.33)#31 | 1.1%(+3.55)#870 |
| 5. | 98177 | 4.2% | 1.3%(+2.84)#35 | 1.1%(+3.06)#1,073 |
| 6. | 98105 | 4.0% | 1.3%(+2.69)#38 | 1.1%(+2.91)#1,149 |
| 7. | 98103 | 3.6% | 1.3%(+2.26)#46 | 1.1%(+2.48)#1,384 |
| 8. | 98102 | 3.4% | 1.3%(+2.05)#56 | 1.1%(+2.27)#1,528 |
| 9. | 98125 | 3.2% | 1.3%(+1.93)#57 | 1.1%(+2.15)#1,629 |
| 10. | 98109 | 3.2% | 1.3%(+1.90)#58 | 1.1%(+2.12)#1,662 |
| 11. | 98107 | 3.1% | 1.3%(+1.78)#61 | 1.1%(+2.00)#1,771 |
| 12. | 98112 | 3.0% | 1.3%(+1.67)#64 | 1.1%(+1.89)#1,901 |
| 13. | 98155 | 3.0% | 1.3%(+1.67)#65 | 1.1%(+1.89)#1,905 |
| 14. | 98133 | 2.7% | 1.3%(+1.43)#75 | 1.1%(+1.65)#2,194 |
| 15. | 98119 | 2.7% | 1.3%(+1.40)#76 | 1.1%(+1.62)#2,239 |
| 16. | 98122 | 2.5% | 1.3%(+1.23)#85 | 1.1%(+1.45)#2,505 |
| 17. | 98117 | 2.4% | 1.3%(+1.11)#89 | 1.1%(+1.33)#2,723 |
| 18. | 98116 | 2.0% | 1.3%(+0.709)#103 | 1.1%(+0.929)#3,630 |
| 19. | 98146 | 1.8% | 1.3%(+0.446)#121 | 1.1%(+0.666)#4,483 |
| 20. | 98136 | 1.7% | 1.3%(+0.343)#130 | 1.1%(+0.563)#4,926 |
| 21. | 98121 | 1.6% | 1.3%(+0.306)#136 | 1.1%(+0.526)#5,083 |
| 22. | 98118 | 1.4% | 1.3%(+0.043)#175 | 1.1%(+0.263)#6,453 |
| 23. | 98168 | 1.3% | 1.3%(+0.033)#177 | 1.1%(+0.253)#6,503 |
| 24. | 98104 | 1.3% | 1.3%(-0.028)#188 | 1.1%(+0.192)#6,910 |
| 25. | 98126 | 1.2% | 1.3%(-0.097)#195 | 1.1%(+0.123)#7,391 |
| 26. | 98144 | 1.0% | 1.3%(-0.275)#213 | 1.1%(-0.055)#8,745 |
| 27. | 98106 | 1.00% | 1.3%(-0.314)#222 | 1.1%(-0.094)#9,069 |
| 28. | 98198 | 0.89% | 1.3%(-0.425)#241 | 1.1%(-0.204)#10,087 |
| 29. | 98178 | 0.89% | 1.3%(-0.425)#242 | 1.1%(-0.205)#10,092 |
| 30. | 98108 | 0.88% | 1.3%(-0.433)#244 | 1.1%(-0.213)#10,165 |
| 31. | 98101 | 0.68% | 1.3%(-0.633)#293 | 1.1%(-0.413)#12,309 |
| 32. | 98166 | 0.60% | 1.3%(-0.712)#320 | 1.1%(-0.492)#13,309 |
| 33. | 98188 | 0.48% | 1.3%(-0.833)#345 | 1.1%(-0.613)#14,796 |
| 34. | 98148 | 0.16% | 1.3%(-1.15)#387 | 1.1%(-0.927)#18,557 |
1
Common Questions
What are the Top 10 Zip Codes with the Highest Percentage of Population Employed in Life, Physical & Social Science in Seattle, WA?
Top 10 Zip Codes with the Highest Percentage of Population Employed in Life, Physical & Social Science in Seattle, WA are:
What zip code has the Highest Percentage of Population Employed in Life, Physical & Social Science in Seattle, WA?
98195 has the Highest Percentage of Population Employed in Life, Physical & Social Science in Seattle, WA with 7.8%.
What is the Percentage of Population Employed in Life, Physical & Social Science in Seattle, WA?
Percentage of Population Employed in Life, Physical & Social Science in Seattle is 2.7%.
What is the Percentage of Population Employed in Life, Physical & Social Science in Washington?
Percentage of Population Employed in Life, Physical & Social Science in Washington is 1.3%.
What is the Percentage of Population Employed in Life, Physical & Social Science in the United States?
Percentage of Population Employed in Life, Physical & Social Science in the United States is 1.1%.