Zip Codes with the Highest Percentage of Population with a Degree in Visual and Performing Arts in Seattle, WA
RELATED REPORTS & OPTIONS
Visual and Performing Arts
Seattle
Compare Zip Codes
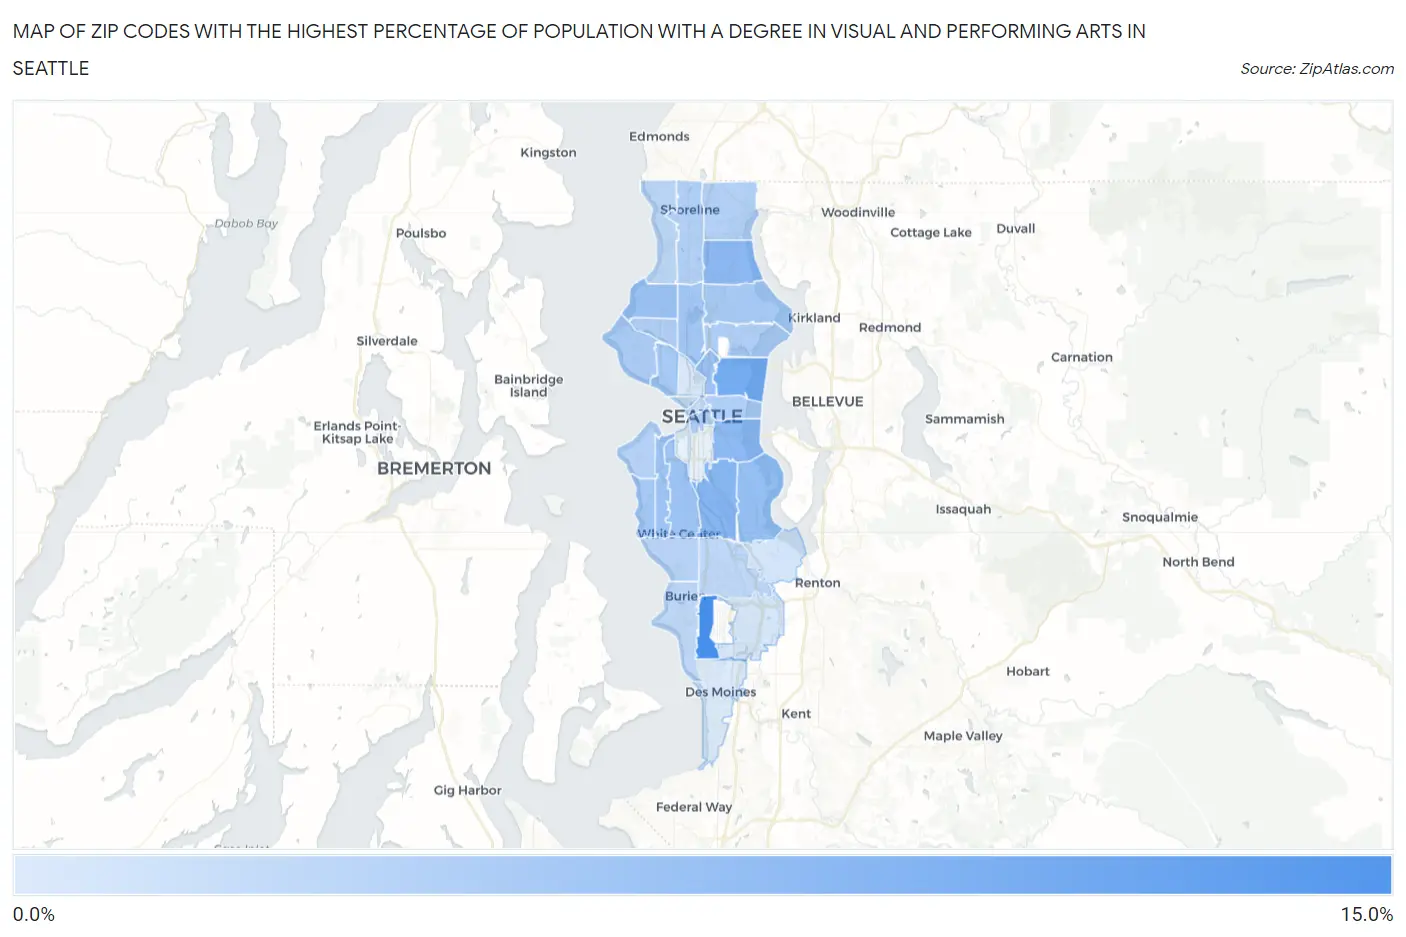
Map of Zip Codes with the Highest Percentage of Population with a Degree in Visual and Performing Arts in Seattle
3.7%
12.9%
Zip Codes with the Highest Percentage of Population with a Degree in Visual and Performing Arts in Seattle, WA
| Zip Code | % Graduates | vs State | vs National | |
| 1. | 98148 | 12.9% | 4.6%(+8.32)#26 | 4.3%(+8.68)#1,117 |
| 2. | 98112 | 10.0% | 4.6%(+5.34)#39 | 4.3%(+5.71)#1,854 |
| 3. | 98108 | 8.9% | 4.6%(+4.26)#55 | 4.3%(+4.63)#2,315 |
| 4. | 98125 | 8.7% | 4.6%(+4.04)#56 | 4.3%(+4.40)#2,443 |
| 5. | 98144 | 8.5% | 4.6%(+3.88)#58 | 4.3%(+4.24)#2,530 |
| 6. | 98118 | 8.1% | 4.6%(+3.45)#67 | 4.3%(+3.82)#2,797 |
| 7. | 98117 | 7.7% | 4.6%(+3.05)#77 | 4.3%(+3.42)#3,091 |
| 8. | 98102 | 7.7% | 4.6%(+3.04)#78 | 4.3%(+3.41)#3,099 |
| 9. | 98126 | 7.4% | 4.6%(+2.82)#82 | 4.3%(+3.19)#3,261 |
| 10. | 98106 | 7.4% | 4.6%(+2.78)#83 | 4.3%(+3.15)#3,297 |
| 11. | 98103 | 7.2% | 4.6%(+2.62)#85 | 4.3%(+2.99)#3,436 |
| 12. | 98136 | 7.0% | 4.6%(+2.42)#92 | 4.3%(+2.78)#3,630 |
| 13. | 98119 | 6.9% | 4.6%(+2.30)#96 | 4.3%(+2.66)#3,742 |
| 14. | 98115 | 6.9% | 4.6%(+2.25)#98 | 4.3%(+2.61)#3,796 |
| 15. | 98199 | 6.6% | 4.6%(+2.02)#101 | 4.3%(+2.38)#4,076 |
| 16. | 98107 | 6.5% | 4.6%(+1.91)#104 | 4.3%(+2.27)#4,192 |
| 17. | 98104 | 6.5% | 4.6%(+1.90)#105 | 4.3%(+2.26)#4,205 |
| 18. | 98105 | 6.3% | 4.6%(+1.72)#111 | 4.3%(+2.08)#4,430 |
| 19. | 98122 | 6.3% | 4.6%(+1.67)#114 | 4.3%(+2.03)#4,486 |
| 20. | 98133 | 6.2% | 4.6%(+1.58)#116 | 4.3%(+1.94)#4,600 |
| 21. | 98155 | 6.2% | 4.6%(+1.55)#117 | 4.3%(+1.92)#4,648 |
| 22. | 98116 | 6.0% | 4.6%(+1.39)#121 | 4.3%(+1.76)#4,873 |
| 23. | 98146 | 6.0% | 4.6%(+1.35)#122 | 4.3%(+1.72)#4,918 |
| 24. | 98177 | 5.6% | 4.6%(+1.01)#139 | 4.3%(+1.37)#5,454 |
| 25. | 98168 | 5.5% | 4.6%(+0.887)#154 | 4.3%(+1.25)#5,667 |
| 26. | 98166 | 5.5% | 4.6%(+0.858)#157 | 4.3%(+1.23)#5,723 |
| 27. | 98121 | 5.2% | 4.6%(+0.581)#165 | 4.3%(+0.948)#6,235 |
| 28. | 98101 | 4.9% | 4.6%(+0.241)#185 | 4.3%(+0.608)#6,948 |
| 29. | 98178 | 4.2% | 4.6%(-0.384)#225 | 4.3%(-0.017)#8,523 |
| 30. | 98188 | 4.1% | 4.6%(-0.526)#236 | 4.3%(-0.159)#8,960 |
| 31. | 98109 | 4.0% | 4.6%(-0.578)#241 | 4.3%(-0.211)#9,115 |
| 32. | 98198 | 3.7% | 4.6%(-0.890)#256 | 4.3%(-0.523)#10,060 |
1
Common Questions
What are the Top 10 Zip Codes with the Highest Percentage of Population with a Degree in Visual and Performing Arts in Seattle, WA?
Top 10 Zip Codes with the Highest Percentage of Population with a Degree in Visual and Performing Arts in Seattle, WA are:
What zip code has the Highest Percentage of Population with a Degree in Visual and Performing Arts in Seattle, WA?
98148 has the Highest Percentage of Population with a Degree in Visual and Performing Arts in Seattle, WA with 12.9%.
What is the Percentage of Population with a Degree in Visual and Performing Arts in Seattle, WA?
Percentage of Population with a Degree in Visual and Performing Arts in Seattle is 7.0%.
What is the Percentage of Population with a Degree in Visual and Performing Arts in Washington?
Percentage of Population with a Degree in Visual and Performing Arts in Washington is 4.6%.
What is the Percentage of Population with a Degree in Visual and Performing Arts in the United States?
Percentage of Population with a Degree in Visual and Performing Arts in the United States is 4.3%.