Zip Codes with the Highest Percentage of Population Employed in Community & Social Service in Seattle, WA
RELATED REPORTS & OPTIONS
Community & Social Service
Seattle
Compare Zip Codes
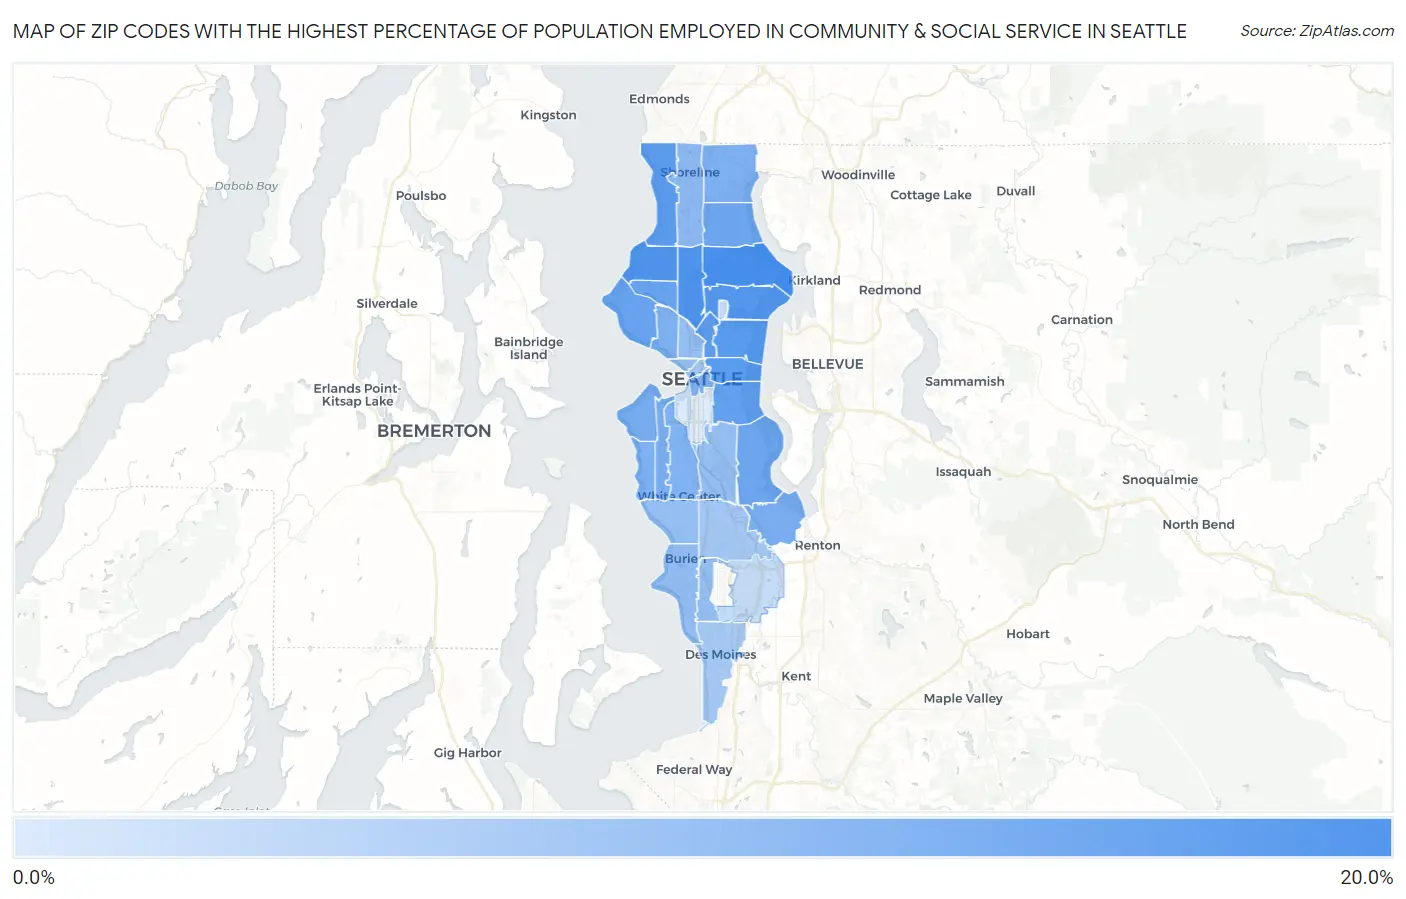
Map of Zip Codes with the Highest Percentage of Population Employed in Community & Social Service in Seattle
3.0%
19.1%
Zip Codes with the Highest Percentage of Population Employed in Community & Social Service in Seattle, WA
| Zip Code | % Employed | vs State | vs National | |
| 1. | 98115 | 19.1% | 10.7%(+8.33)#36 | 11.2%(+7.84)#2,377 |
| 2. | 98117 | 18.0% | 10.7%(+7.27)#46 | 11.2%(+6.78)#2,818 |
| 3. | 98103 | 18.0% | 10.7%(+7.25)#47 | 11.2%(+6.76)#2,827 |
| 4. | 98105 | 17.6% | 10.7%(+6.87)#51 | 11.2%(+6.37)#3,023 |
| 5. | 98122 | 17.3% | 10.7%(+6.57)#53 | 11.2%(+6.07)#3,196 |
| 6. | 98112 | 17.3% | 10.7%(+6.55)#55 | 11.2%(+6.05)#3,206 |
| 7. | 98102 | 16.4% | 10.7%(+5.67)#67 | 11.2%(+5.17)#3,774 |
| 8. | 98177 | 16.4% | 10.7%(+5.65)#69 | 11.2%(+5.16)#3,788 |
| 9. | 98144 | 15.8% | 10.7%(+5.12)#76 | 11.2%(+4.62)#4,201 |
| 10. | 98107 | 15.2% | 10.7%(+4.48)#92 | 11.2%(+3.98)#4,793 |
| 11. | 98199 | 15.0% | 10.7%(+4.30)#95 | 11.2%(+3.81)#4,943 |
| 12. | 98125 | 14.7% | 10.7%(+3.99)#100 | 11.2%(+3.49)#5,260 |
| 13. | 98118 | 14.6% | 10.7%(+3.85)#103 | 11.2%(+3.35)#5,408 |
| 14. | 98116 | 13.5% | 10.7%(+2.82)#128 | 11.2%(+2.32)#6,696 |
| 15. | 98178 | 13.4% | 10.7%(+2.72)#135 | 11.2%(+2.22)#6,855 |
| 16. | 98126 | 13.3% | 10.7%(+2.60)#143 | 11.2%(+2.10)#7,043 |
| 17. | 98104 | 13.0% | 10.7%(+2.27)#156 | 11.2%(+1.77)#7,584 |
| 18. | 98155 | 12.9% | 10.7%(+2.21)#160 | 11.2%(+1.71)#7,688 |
| 19. | 98136 | 12.9% | 10.7%(+2.18)#162 | 11.2%(+1.68)#7,741 |
| 20. | 98119 | 12.8% | 10.7%(+2.12)#165 | 11.2%(+1.63)#7,824 |
| 21. | 98106 | 12.6% | 10.7%(+1.91)#176 | 11.2%(+1.41)#8,199 |
| 22. | 98133 | 11.4% | 10.7%(+0.717)#220 | 11.2%(+0.220)#10,588 |
| 23. | 98166 | 10.5% | 10.7%(-0.214)#262 | 11.2%(-0.710)#12,862 |
| 24. | 98108 | 10.5% | 10.7%(-0.247)#264 | 11.2%(-0.743)#12,940 |
| 25. | 98146 | 10.5% | 10.7%(-0.255)#266 | 11.2%(-0.751)#12,963 |
| 26. | 98148 | 10.4% | 10.7%(-0.275)#268 | 11.2%(-0.772)#13,007 |
| 27. | 98109 | 10.2% | 10.7%(-0.471)#276 | 11.2%(-0.967)#13,495 |
| 28. | 98121 | 10.1% | 10.7%(-0.584)#282 | 11.2%(-1.08)#13,784 |
| 29. | 98168 | 8.9% | 10.7%(-1.78)#355 | 11.2%(-2.27)#16,980 |
| 30. | 98164 | 8.6% | 10.7%(-2.09)#362 | 11.2%(-2.58)#17,814 |
| 31. | 98101 | 8.6% | 10.7%(-2.17)#369 | 11.2%(-2.66)#18,029 |
| 32. | 98198 | 8.5% | 10.7%(-2.21)#372 | 11.2%(-2.71)#18,161 |
| 33. | 98195 | 5.8% | 10.7%(-4.96)#477 | 11.2%(-5.46)#24,875 |
| 34. | 98188 | 5.3% | 10.7%(-5.43)#490 | 11.2%(-5.92)#25,724 |
| 35. | 98134 | 3.0% | 10.7%(-7.74)#531 | 11.2%(-8.23)#28,574 |
1
Common Questions
What are the Top 10 Zip Codes with the Highest Percentage of Population Employed in Community & Social Service in Seattle, WA?
Top 10 Zip Codes with the Highest Percentage of Population Employed in Community & Social Service in Seattle, WA are:
What zip code has the Highest Percentage of Population Employed in Community & Social Service in Seattle, WA?
98115 has the Highest Percentage of Population Employed in Community & Social Service in Seattle, WA with 19.1%.
What is the Percentage of Population Employed in Community & Social Service in Seattle, WA?
Percentage of Population Employed in Community & Social Service in Seattle is 15.0%.
What is the Percentage of Population Employed in Community & Social Service in Washington?
Percentage of Population Employed in Community & Social Service in Washington is 10.7%.
What is the Percentage of Population Employed in Community & Social Service in the United States?
Percentage of Population Employed in Community & Social Service in the United States is 11.2%.