Zip Codes with the Highest Percentage of Population Employed in Computer & Mathematics in Henderson, NV
RELATED REPORTS & OPTIONS
Computer & Mathematics
Henderson
Compare Zip Codes
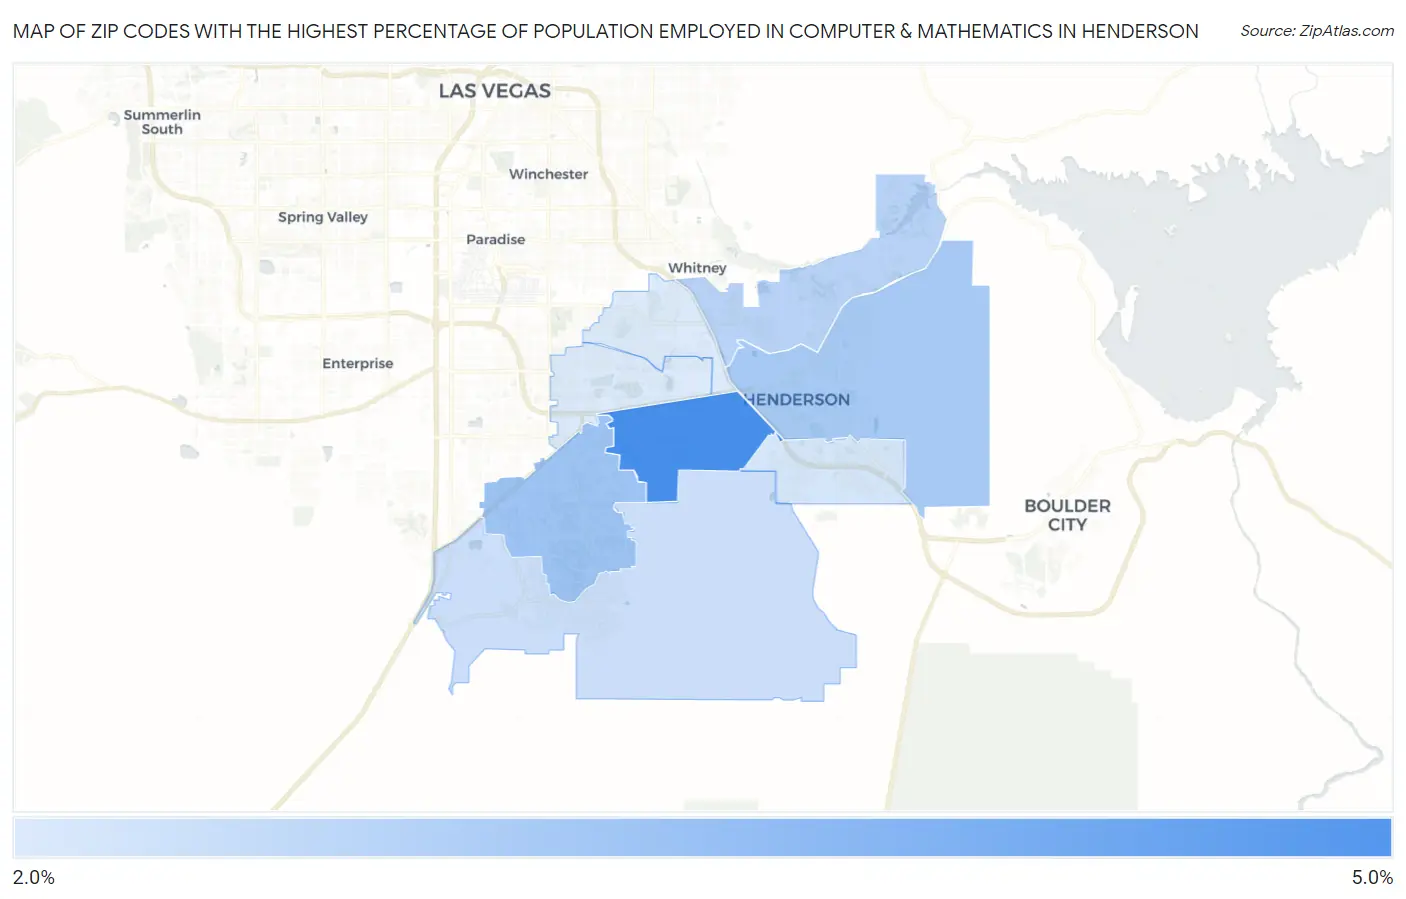
Map of Zip Codes with the Highest Percentage of Population Employed in Computer & Mathematics in Henderson
2.2%
4.4%
Zip Codes with the Highest Percentage of Population Employed in Computer & Mathematics in Henderson, NV
| Zip Code | % Employed | vs State | vs National | |
| 1. | 89012 | 4.4% | 2.3%(+2.03)#9 | 3.5%(+0.835)#4,330 |
| 2. | 89052 | 3.1% | 2.3%(+0.761)#33 | 3.5%(-0.435)#7,438 |
| 3. | 89015 | 3.0% | 2.3%(+0.630)#36 | 3.5%(-0.565)#7,891 |
| 4. | 89011 | 2.7% | 2.3%(+0.408)#39 | 3.5%(-0.787)#8,682 |
| 5. | 89044 | 2.5% | 2.3%(+0.136)#46 | 3.5%(-1.06)#9,784 |
| 6. | 89002 | 2.3% | 2.3%(-0.032)#52 | 3.5%(-1.23)#10,467 |
| 7. | 89014 | 2.2% | 2.3%(-0.115)#56 | 3.5%(-1.31)#10,827 |
| 8. | 89074 | 2.2% | 2.3%(-0.125)#57 | 3.5%(-1.32)#10,866 |
1
Common Questions
What are the Top 5 Zip Codes with the Highest Percentage of Population Employed in Computer & Mathematics in Henderson, NV?
Top 5 Zip Codes with the Highest Percentage of Population Employed in Computer & Mathematics in Henderson, NV are:
What zip code has the Highest Percentage of Population Employed in Computer & Mathematics in Henderson, NV?
89012 has the Highest Percentage of Population Employed in Computer & Mathematics in Henderson, NV with 4.4%.
What is the Percentage of Population Employed in Computer & Mathematics in Henderson, NV?
Percentage of Population Employed in Computer & Mathematics in Henderson is 2.8%.
What is the Percentage of Population Employed in Computer & Mathematics in Nevada?
Percentage of Population Employed in Computer & Mathematics in Nevada is 2.3%.
What is the Percentage of Population Employed in Computer & Mathematics in the United States?
Percentage of Population Employed in Computer & Mathematics in the United States is 3.5%.