Zip Codes with the Most Immigrants from South America in Hobbs, NM
RELATED REPORTS & OPTIONS
South America
Hobbs
Compare Zip Codes
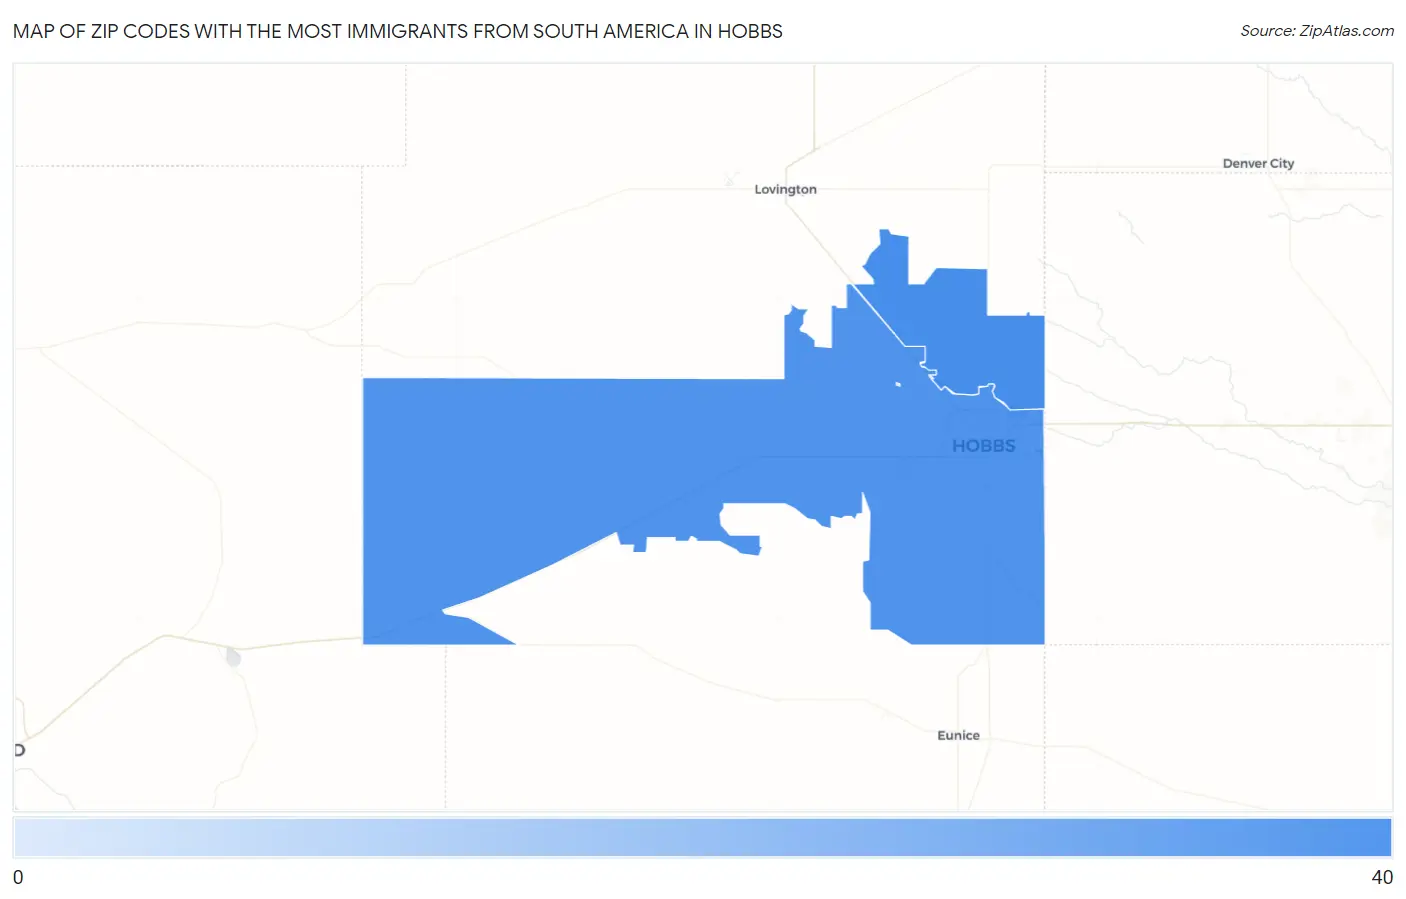
Map of Zip Codes with the Most Immigrants from South America in Hobbs
30
36
Zip Codes with the Most Immigrants from South America in Hobbs, NM
| Zip Code | South America | vs State | vs National | |
| 1. | 88242 | 36 | 5,242(0.69%)#36 | 3,636,375(0.00%)#7,568 |
| 2. | 88240 | 30 | 5,242(0.57%)#41 | 3,636,375(0.00%)#7,952 |
1
Common Questions
What are the Top Zip Codes with the Most Immigrants from South America in Hobbs, NM?
Top Zip Codes with the Most Immigrants from South America in Hobbs, NM are:
What zip code has the Most Immigrants from South America in Hobbs, NM?
88242 has the Most Immigrants from South America in Hobbs, NM with 36.
What is the Total Immigrants from South America in Hobbs, NM?
Total Immigrants from South America in Hobbs is 55.
What is the Total Immigrants from South America in New Mexico?
Total Immigrants from South America in New Mexico is 5,242.
What is the Total Immigrants from South America in the United States?
Total Immigrants from South America in the United States is 3,636,375.