Leshara, NE Map & Demographics
Leshara Map
Leshara Overview
$42,878
PER CAPITA INCOME
$107,857
AVG FAMILY INCOME
$76,875
AVG HOUSEHOLD INCOME
52.6%
WAGE / INCOME GAP [ % ]
47.4¢/ $1
WAGE / INCOME GAP [ $ ]
0.30
INEQUALITY / GINI INDEX
148
TOTAL POPULATION
93
MALE POPULATION
55
FEMALE POPULATION
169.09
MALES / 100 FEMALES
59.14
FEMALES / 100 MALES
50.8
MEDIAN AGE
2.1
AVG FAMILY SIZE
1.8
AVG HOUSEHOLD SIZE
121
LABOR FORCE [ PEOPLE ]
84.6%
PERCENT IN LABOR FORCE
Leshara Area Codes
Income in Leshara
Income Overview in Leshara
Per Capita Income in Leshara is $42,878, while median incomes of families and households are $107,857 and $76,875 respectively.
| Characteristic | Number | Measure |
| Per Capita Income | 148 | $42,878 |
| Median Family Income | 54 | $107,857 |
| Mean Family Income | 54 | $102,269 |
| Median Household Income | 81 | $76,875 |
| Mean Household Income | 81 | $82,973 |
| Income Deficit | 54 | $0 |
| Wage / Income Gap (%) | 148 | 52.60% |
| Wage / Income Gap ($) | 148 | 47.40¢ per $1 |
| Gini / Inequality Index | 148 | 0.30 |
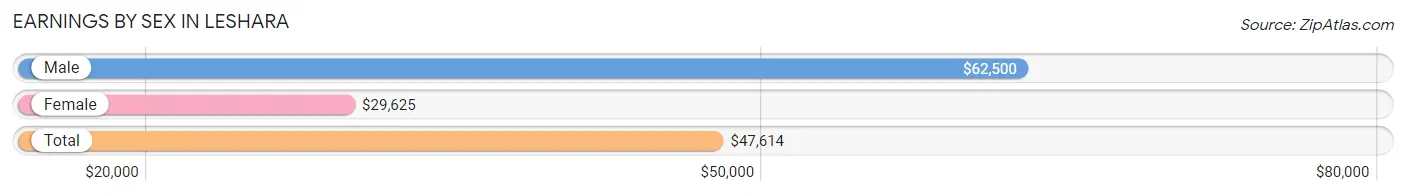
Earnings by Sex in Leshara
Average Earnings in Leshara are $47,614, $62,500 for men and $29,625 for women, a difference of 52.6%.
| Sex | Number | Average Earnings |
| Male | 76 (59.8%) | $62,500 |
| Female | 51 (40.2%) | $29,625 |
| Total | 127 (100.0%) | $47,614 |
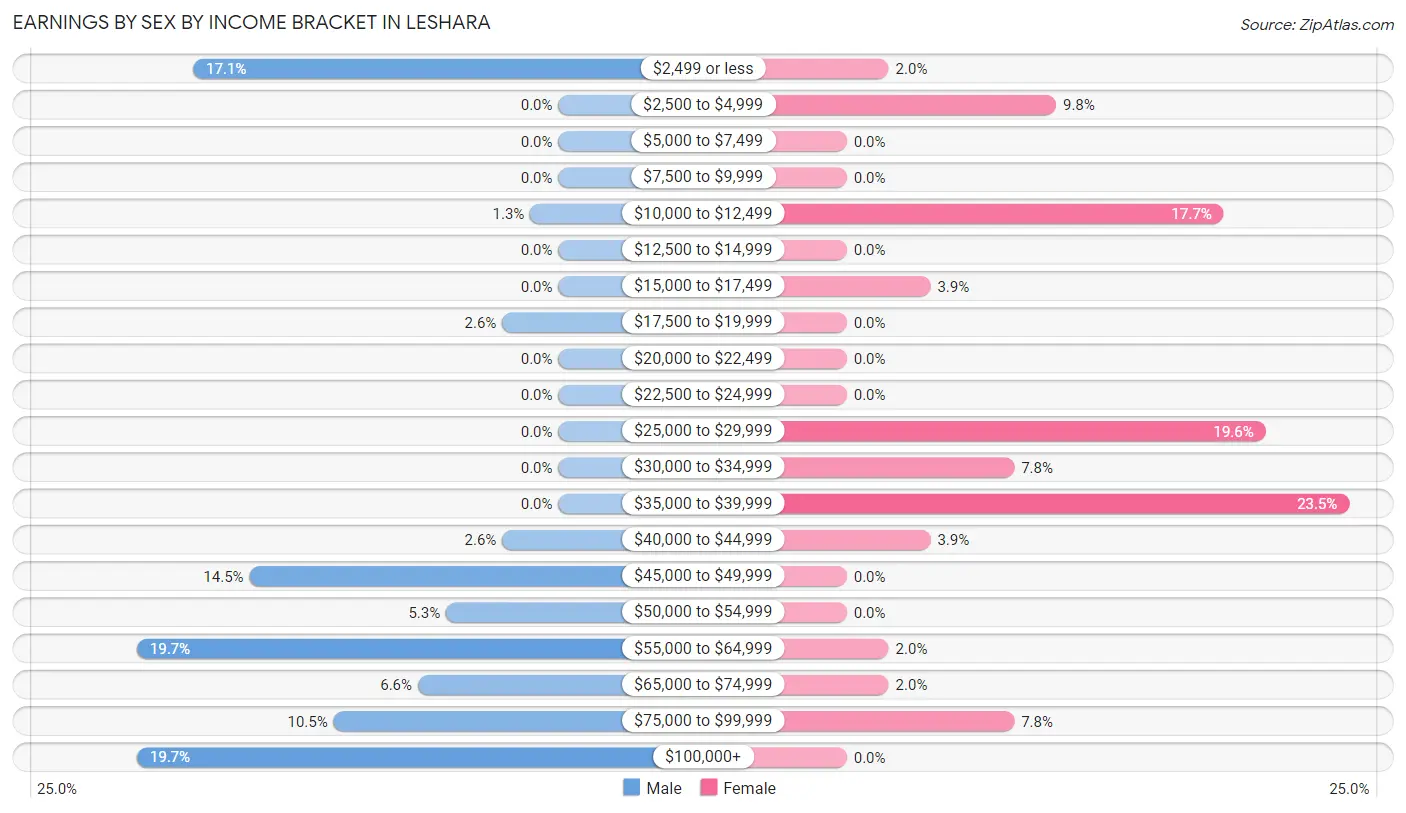
Earnings by Sex by Income Bracket in Leshara
The most common earnings brackets in Leshara are $55,000 to $64,999 for men (15 | 19.7%) and $35,000 to $39,999 for women (12 | 23.5%).
| Income | Male | Female |
| $2,499 or less | 13 (17.1%) | 1 (2.0%) |
| $2,500 to $4,999 | 0 (0.0%) | 5 (9.8%) |
| $5,000 to $7,499 | 0 (0.0%) | 0 (0.0%) |
| $7,500 to $9,999 | 0 (0.0%) | 0 (0.0%) |
| $10,000 to $12,499 | 1 (1.3%) | 9 (17.6%) |
| $12,500 to $14,999 | 0 (0.0%) | 0 (0.0%) |
| $15,000 to $17,499 | 0 (0.0%) | 2 (3.9%) |
| $17,500 to $19,999 | 2 (2.6%) | 0 (0.0%) |
| $20,000 to $22,499 | 0 (0.0%) | 0 (0.0%) |
| $22,500 to $24,999 | 0 (0.0%) | 0 (0.0%) |
| $25,000 to $29,999 | 0 (0.0%) | 10 (19.6%) |
| $30,000 to $34,999 | 0 (0.0%) | 4 (7.8%) |
| $35,000 to $39,999 | 0 (0.0%) | 12 (23.5%) |
| $40,000 to $44,999 | 2 (2.6%) | 2 (3.9%) |
| $45,000 to $49,999 | 11 (14.5%) | 0 (0.0%) |
| $50,000 to $54,999 | 4 (5.3%) | 0 (0.0%) |
| $55,000 to $64,999 | 15 (19.7%) | 1 (2.0%) |
| $65,000 to $74,999 | 5 (6.6%) | 1 (2.0%) |
| $75,000 to $99,999 | 8 (10.5%) | 4 (7.8%) |
| $100,000+ | 15 (19.7%) | 0 (0.0%) |
| Total | 76 (100.0%) | 51 (100.0%) |
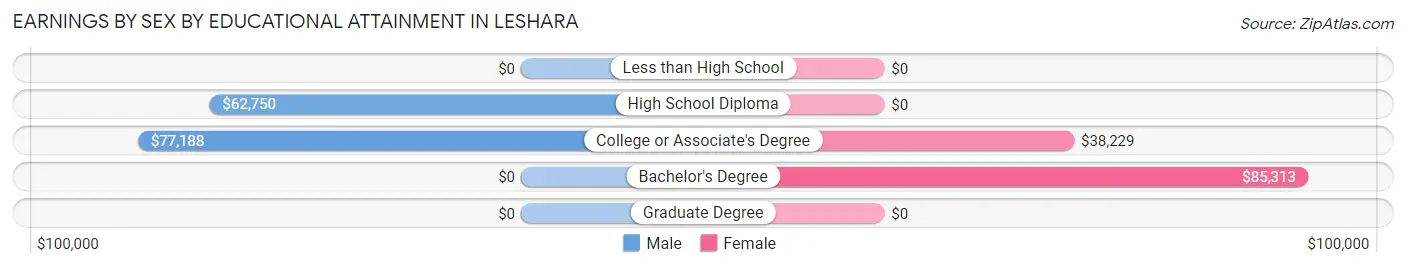
Earnings by Sex by Educational Attainment in Leshara
Average earnings in Leshara are $64,125 for men and $30,313 for women, a difference of 52.7%. Men with an educational attainment of college or associate's degree enjoy the highest average annual earnings of $77,188, while those with high school diploma education earn the least with $62,750. Women with an educational attainment of bachelor's degree earn the most with the average annual earnings of $85,313, while those with college or associate's degree education have the smallest earnings of $38,229.
| Educational Attainment | Male Income | Female Income |
| Less than High School | - | - |
| High School Diploma | $62,750 | $0 |
| College or Associate's Degree | $77,188 | $38,229 |
| Bachelor's Degree | - | - |
| Graduate Degree | - | - |
| Total | $64,125 | $30,313 |
Family Income in Leshara
Family Income Brackets in Leshara
According to the Leshara family income data, there are 28 families falling into the $100,000 to $149,999 income range, which is the most common income bracket and makes up 51.8% of all families.
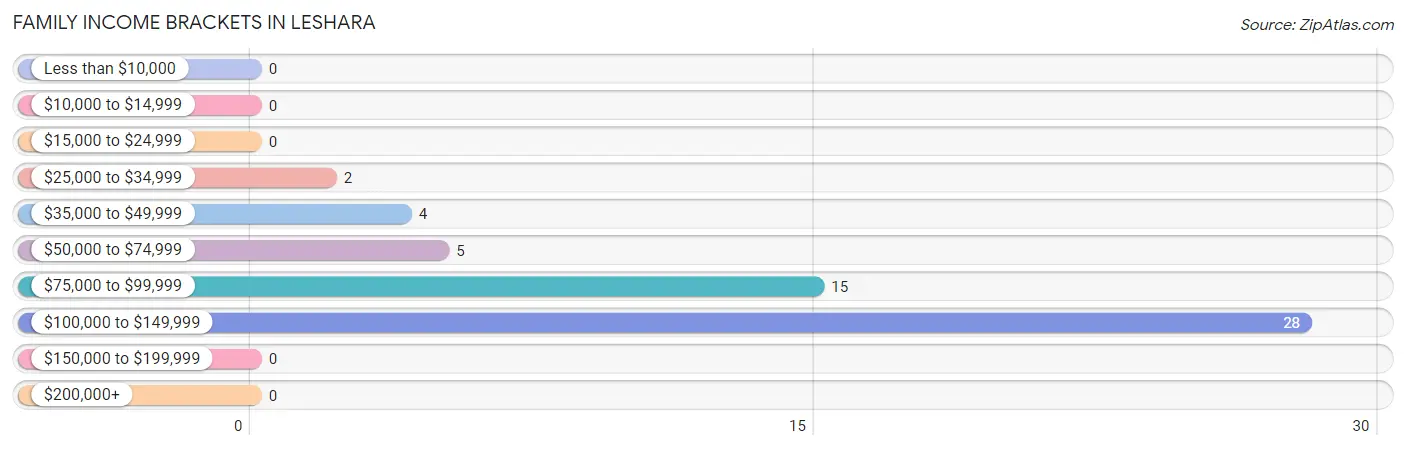
| Income Bracket | # Families | % Families |
| Less than $10,000 | 0 | 0.0% |
| $10,000 to $14,999 | 0 | 0.0% |
| $15,000 to $24,999 | 0 | 0.0% |
| $25,000 to $34,999 | 2 | 3.7% |
| $35,000 to $49,999 | 4 | 7.4% |
| $50,000 to $74,999 | 5 | 9.3% |
| $75,000 to $99,999 | 15 | 27.8% |
| $100,000 to $149,999 | 28 | 51.9% |
| $150,000 to $199,999 | 0 | 0.0% |
| $200,000+ | 0 | 0.0% |
Family Income by Famaliy Size in Leshara
2-person families (35 | 64.8%) account for the highest median family income in Leshara with $90,625 per family, while 2-person families (35 | 64.8%) have the highest median income of $45,312 per family member.
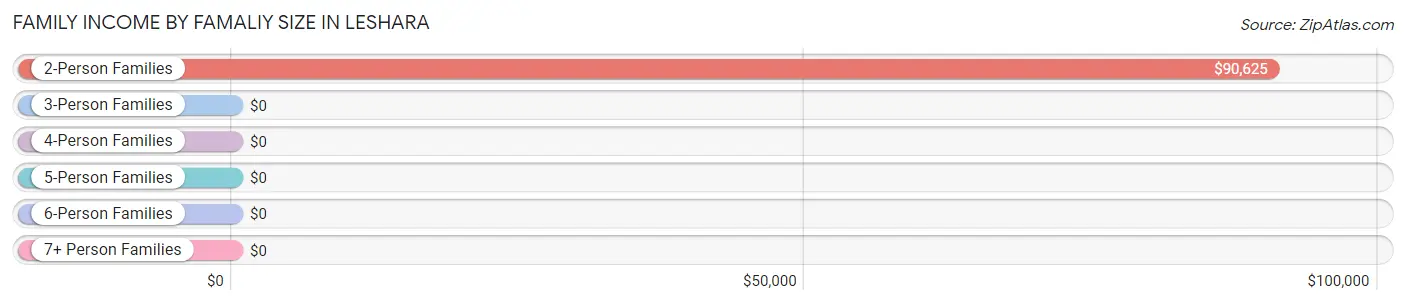
| Income Bracket | # Families | Median Income |
| 2-Person Families | 35 (64.8%) | $90,625 |
| 3-Person Families | 15 (27.8%) | $0 |
| 4-Person Families | 4 (7.4%) | $0 |
| 5-Person Families | 0 (0.0%) | $0 |
| 6-Person Families | 0 (0.0%) | $0 |
| 7+ Person Families | 0 (0.0%) | $0 |
| Total | 54 (100.0%) | $107,857 |
Family Income by Number of Earners in Leshara
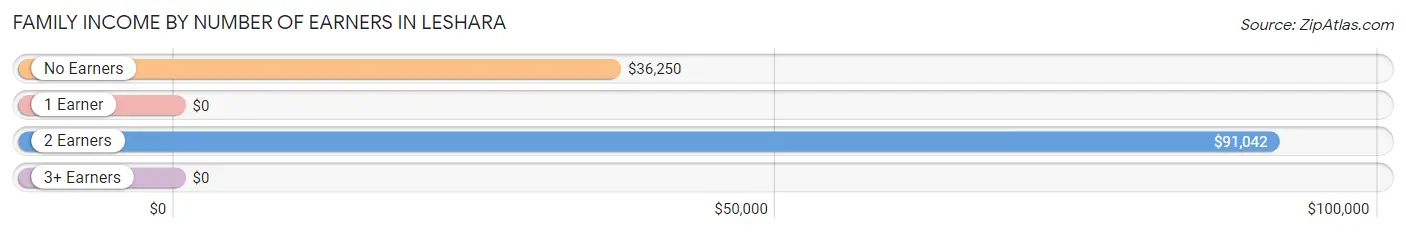
| Number of Earners | # Families | Median Income |
| No Earners | 3 (5.6%) | $36,250 |
| 1 Earner | 3 (5.6%) | $0 |
| 2 Earners | 33 (61.1%) | $91,042 |
| 3+ Earners | 15 (27.8%) | $0 |
| Total | 54 (100.0%) | $107,857 |
Household Income in Leshara
Household Income Brackets in Leshara
With 32 households falling in the category, the $100,000 to $149,999 income range is the most frequent in Leshara, accounting for 39.5% of all households.
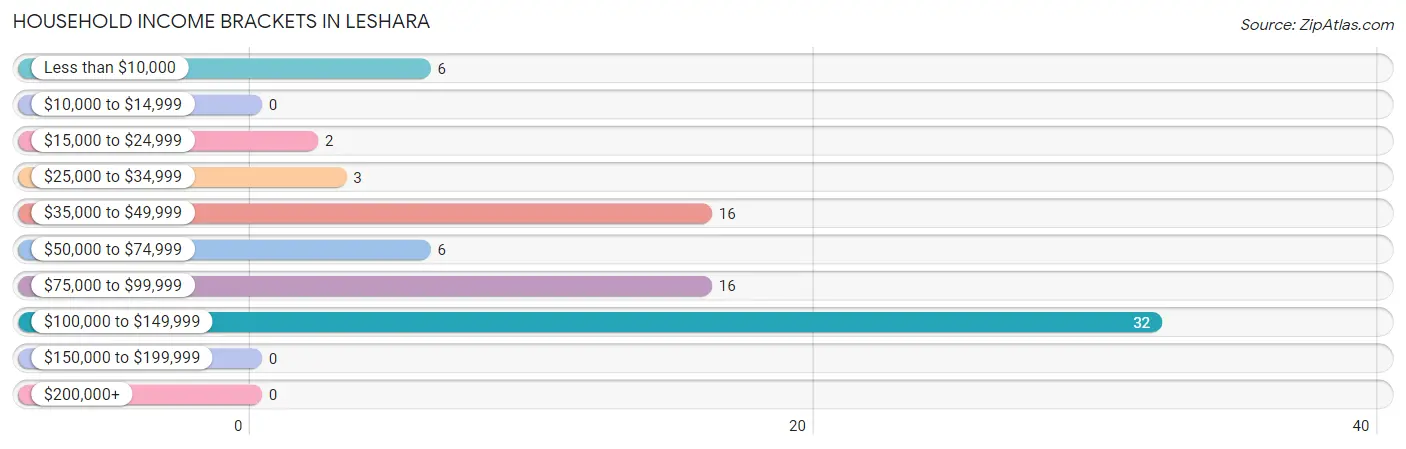
| Income Bracket | # Households | % Households |
| Less than $10,000 | 6 | 7.4% |
| $10,000 to $14,999 | 0 | 0.0% |
| $15,000 to $24,999 | 2 | 2.5% |
| $25,000 to $34,999 | 3 | 3.7% |
| $35,000 to $49,999 | 16 | 19.8% |
| $50,000 to $74,999 | 6 | 7.4% |
| $75,000 to $99,999 | 16 | 19.8% |
| $100,000 to $149,999 | 32 | 39.5% |
| $150,000 to $199,999 | 0 | 0.0% |
| $200,000+ | 0 | 0.0% |
Household Income by Householder Age in Leshara
The median household income in Leshara is $76,875, with the highest median household income of $91,250 found in the 45 to 64 years age bracket for the primary householder. A total of 48 households (59.3%) fall into this category. Meanwhile, the 15 to 24 years age bracket for the primary householder has the lowest median household income of $0, with 4 households (4.9%) in this group.
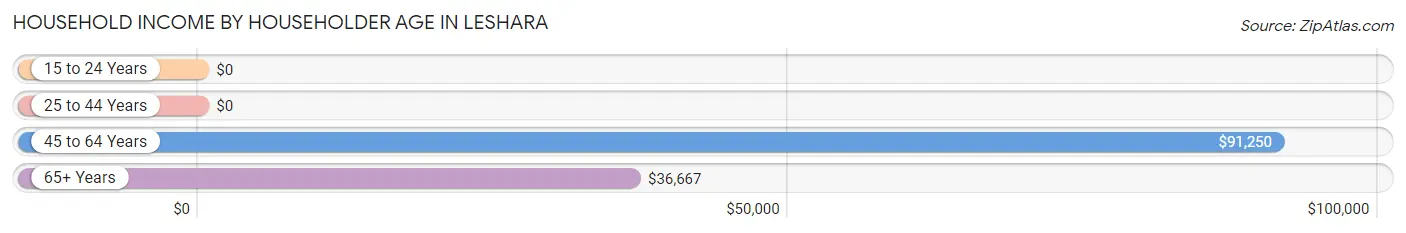
| Income Bracket | # Households | Median Income |
| 15 to 24 Years | 4 (4.9%) | $0 |
| 25 to 44 Years | 23 (28.4%) | $0 |
| 45 to 64 Years | 48 (59.3%) | $91,250 |
| 65+ Years | 6 (7.4%) | $36,667 |
| Total | 81 (100.0%) | $76,875 |
Poverty in Leshara
Income Below Poverty by Sex and Age in Leshara
With 7.5% poverty level for males and 9.1% for females among the residents of Leshara, 55 to 64 year old males and 35 to 44 year old females are the most vulnerable to poverty, with 7 males (18.9%) and 5 females (35.7%) in their respective age groups living below the poverty level.
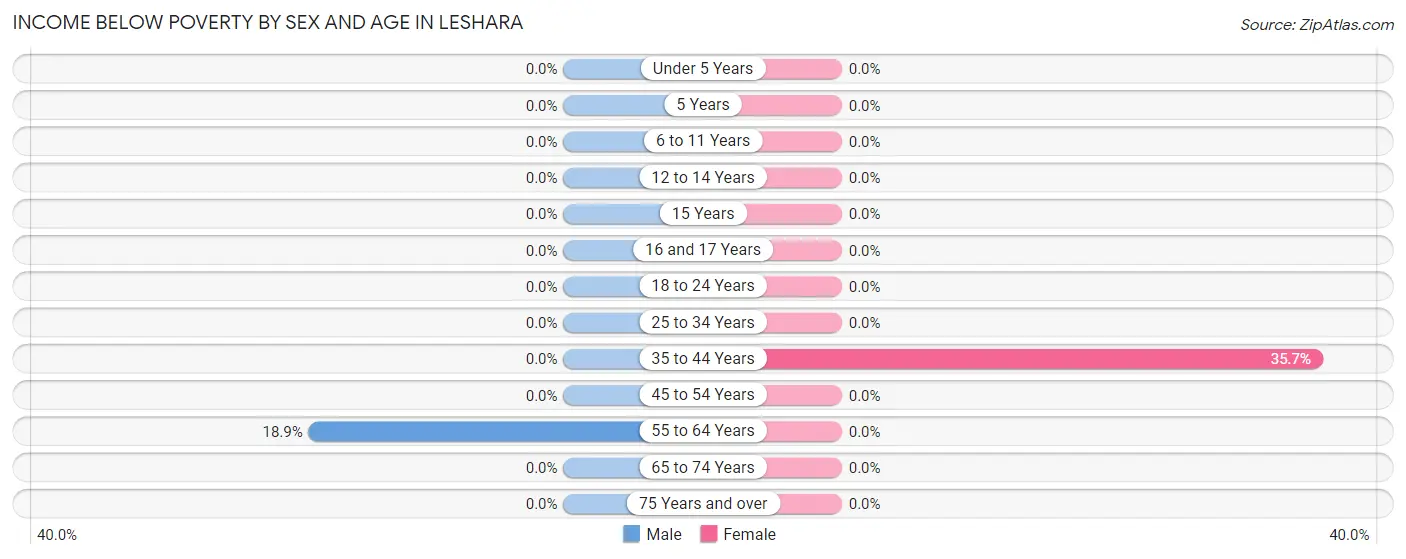
| Age Bracket | Male | Female |
| Under 5 Years | 0 (0.0%) | 0 (0.0%) |
| 5 Years | 0 (0.0%) | 0 (0.0%) |
| 6 to 11 Years | 0 (0.0%) | 0 (0.0%) |
| 12 to 14 Years | 0 (0.0%) | 0 (0.0%) |
| 15 Years | 0 (0.0%) | 0 (0.0%) |
| 16 and 17 Years | 0 (0.0%) | 0 (0.0%) |
| 18 to 24 Years | 0 (0.0%) | 0 (0.0%) |
| 25 to 34 Years | 0 (0.0%) | 0 (0.0%) |
| 35 to 44 Years | 0 (0.0%) | 5 (35.7%) |
| 45 to 54 Years | 0 (0.0%) | 0 (0.0%) |
| 55 to 64 Years | 7 (18.9%) | 0 (0.0%) |
| 65 to 74 Years | 0 (0.0%) | 0 (0.0%) |
| 75 Years and over | 0 (0.0%) | 0 (0.0%) |
| Total | 7 (7.5%) | 5 (9.1%) |
Income Above Poverty by Sex and Age in Leshara
According to the poverty statistics in Leshara, males aged under 5 years and females aged 18 to 24 years are the age groups that are most secure financially, with 100.0% of males and 100.0% of females in these age groups living above the poverty line.
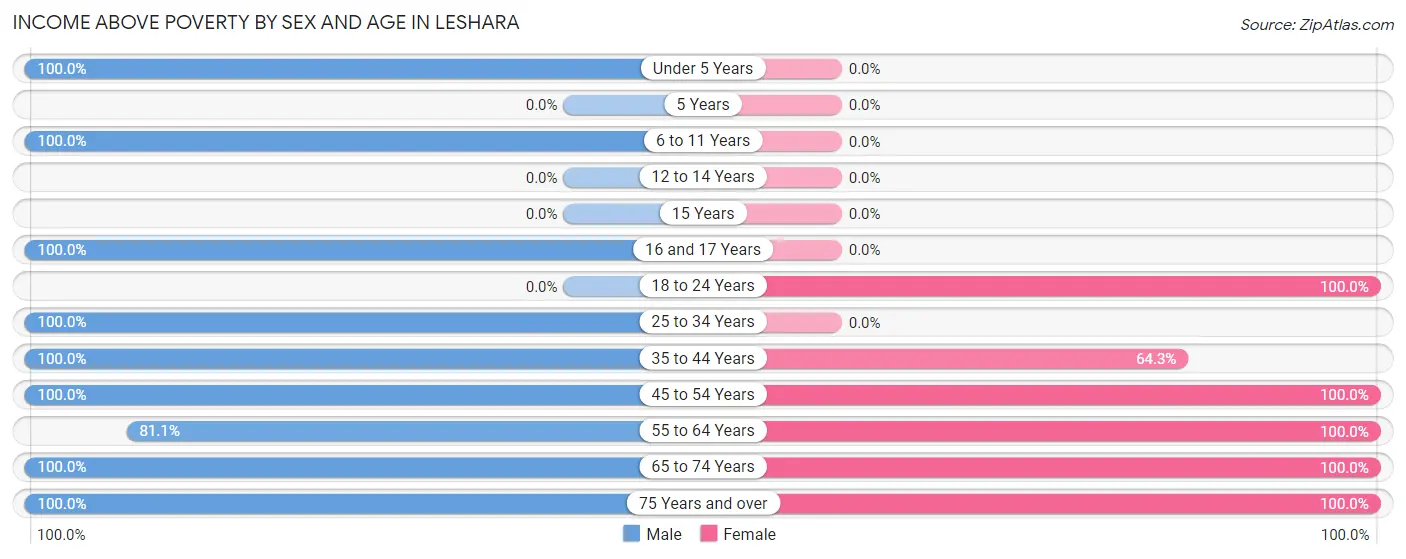
| Age Bracket | Male | Female |
| Under 5 Years | 3 (100.0%) | 0 (0.0%) |
| 5 Years | 0 (0.0%) | 0 (0.0%) |
| 6 to 11 Years | 2 (100.0%) | 0 (0.0%) |
| 12 to 14 Years | 0 (0.0%) | 0 (0.0%) |
| 15 Years | 0 (0.0%) | 0 (0.0%) |
| 16 and 17 Years | 13 (100.0%) | 0 (0.0%) |
| 18 to 24 Years | 0 (0.0%) | 4 (100.0%) |
| 25 to 34 Years | 16 (100.0%) | 0 (0.0%) |
| 35 to 44 Years | 3 (100.0%) | 9 (64.3%) |
| 45 to 54 Years | 15 (100.0%) | 16 (100.0%) |
| 55 to 64 Years | 30 (81.1%) | 16 (100.0%) |
| 65 to 74 Years | 2 (100.0%) | 3 (100.0%) |
| 75 Years and over | 2 (100.0%) | 2 (100.0%) |
| Total | 86 (92.5%) | 50 (90.9%) |
Income Below Poverty Among Married-Couple Families in Leshara
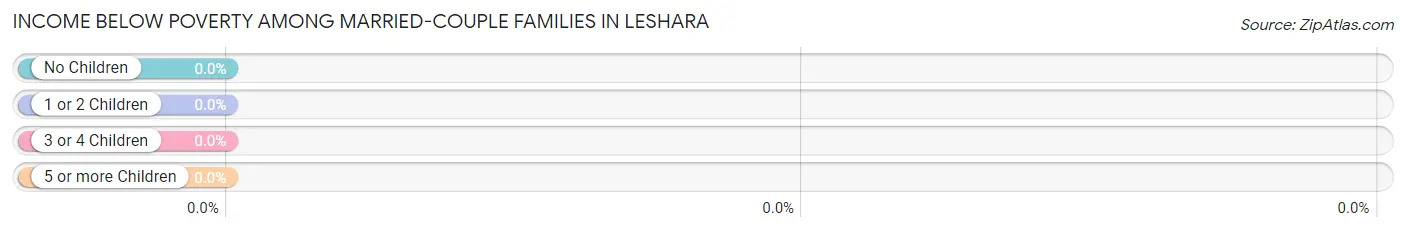
| Children | Above Poverty | Below Poverty |
| No Children | 32 (100.0%) | 0 (0.0%) |
| 1 or 2 Children | 19 (100.0%) | 0 (0.0%) |
| 3 or 4 Children | 0 (0.0%) | 0 (0.0%) |
| 5 or more Children | 0 (0.0%) | 0 (0.0%) |
| Total | 51 (100.0%) | 0 (0.0%) |
Income Below Poverty Among Single-Parent Households in Leshara
| Children | Single Father | Single Mother |
| No Children | 0 (0.0%) | 0 (0.0%) |
| 1 or 2 Children | 0 (0.0%) | 0 (0.0%) |
| 3 or 4 Children | 0 (0.0%) | 0 (0.0%) |
| 5 or more Children | 0 (0.0%) | 0 (0.0%) |
| Total | 0 (0.0%) | 0 (0.0%) |
Income Below Poverty Among Married-Couple vs Single-Parent Households in Leshara
| Children | Married-Couple Families | Single-Parent Households |
| No Children | 0 (0.0%) | 0 (0.0%) |
| 1 or 2 Children | 0 (0.0%) | 0 (0.0%) |
| 3 or 4 Children | 0 (0.0%) | 0 (0.0%) |
| 5 or more Children | 0 (0.0%) | 0 (0.0%) |
| Total | 0 (0.0%) | 0 (0.0%) |
Race in Leshara
The most populous races in Leshara are White / Caucasian (137 | 92.6%), and Two or more Races (11 | 7.4%).
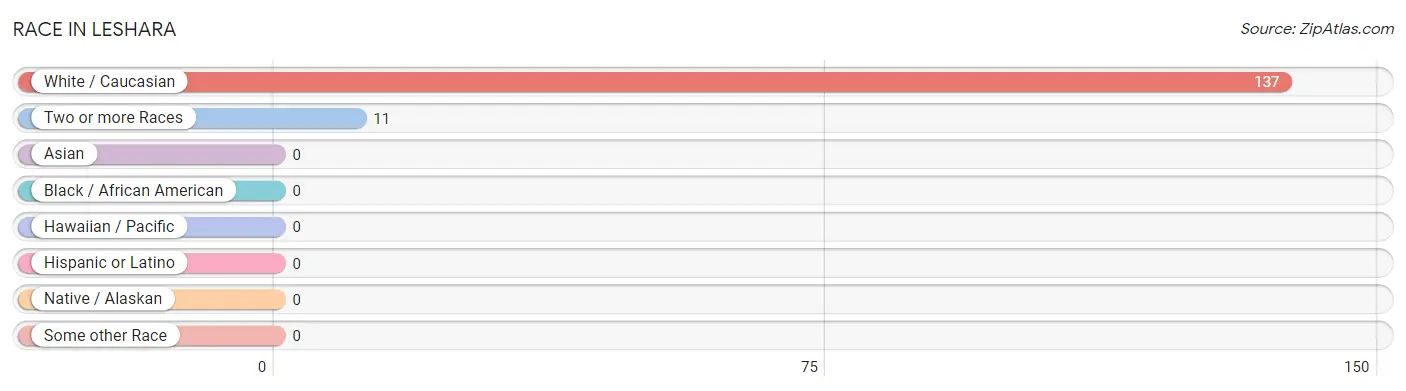
| Race | # Population | % Population |
| Asian | 0 | 0.0% |
| Black / African American | 0 | 0.0% |
| Hawaiian / Pacific | 0 | 0.0% |
| Hispanic or Latino | 0 | 0.0% |
| Native / Alaskan | 0 | 0.0% |
| White / Caucasian | 137 | 92.6% |
| Two or more Races | 11 | 7.4% |
| Some other Race | 0 | 0.0% |
| Total | 148 | 100.0% |
Ancestry in Leshara
The most populous ancestries reported in Leshara are American (59 | 39.9%), German (41 | 27.7%), Irish (35 | 23.6%), Czech (14 | 9.5%), and Dutch (13 | 8.8%), together accounting for 109.5% of all Leshara residents.
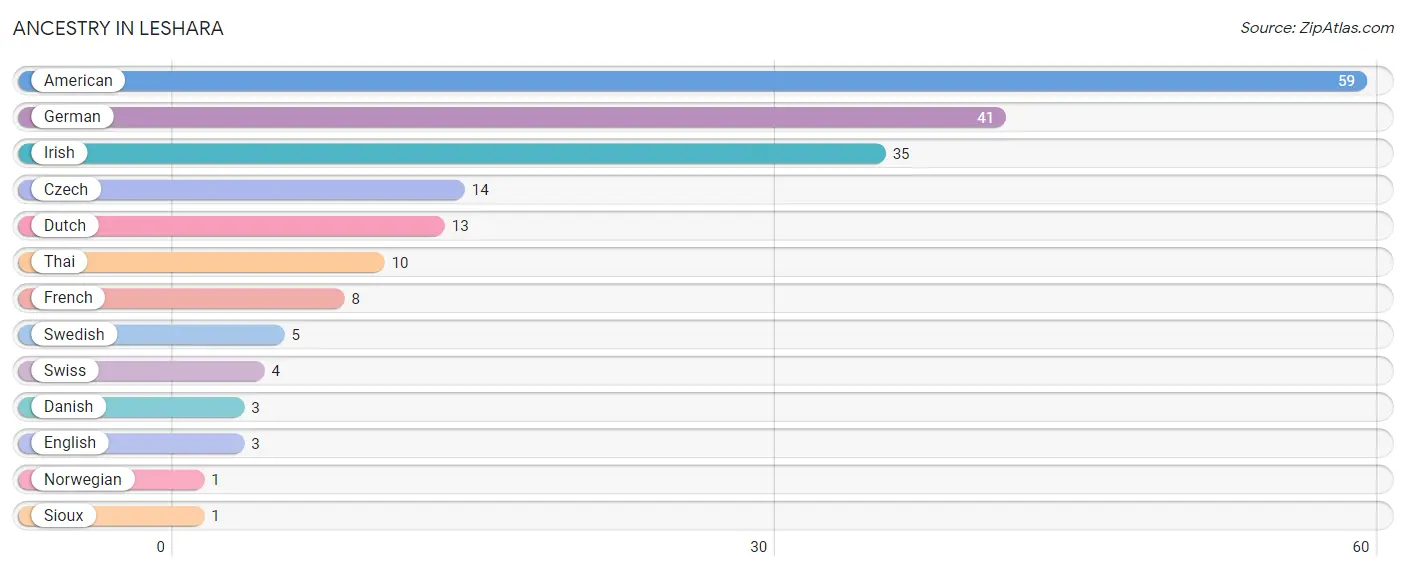
| Ancestry | # Population | % Population |
| American | 59 | 39.9% |
| Czech | 14 | 9.5% |
| Danish | 3 | 2.0% |
| Dutch | 13 | 8.8% |
| English | 3 | 2.0% |
| French | 8 | 5.4% |
| German | 41 | 27.7% |
| Irish | 35 | 23.6% |
| Norwegian | 1 | 0.7% |
| Sioux | 1 | 0.7% |
| Swedish | 5 | 3.4% |
| Swiss | 4 | 2.7% |
| Thai | 10 | 6.8% | View All 13 Rows |
Immigrants in Leshara

| Immigration Origin | # Population | % Population | View All 0 Rows |
Sex and Age in Leshara
Sex and Age in Leshara
The most populous age groups in Leshara are 55 to 59 Years (29 | 31.2%) for men and 50 to 54 Years (15 | 27.3%) for women.
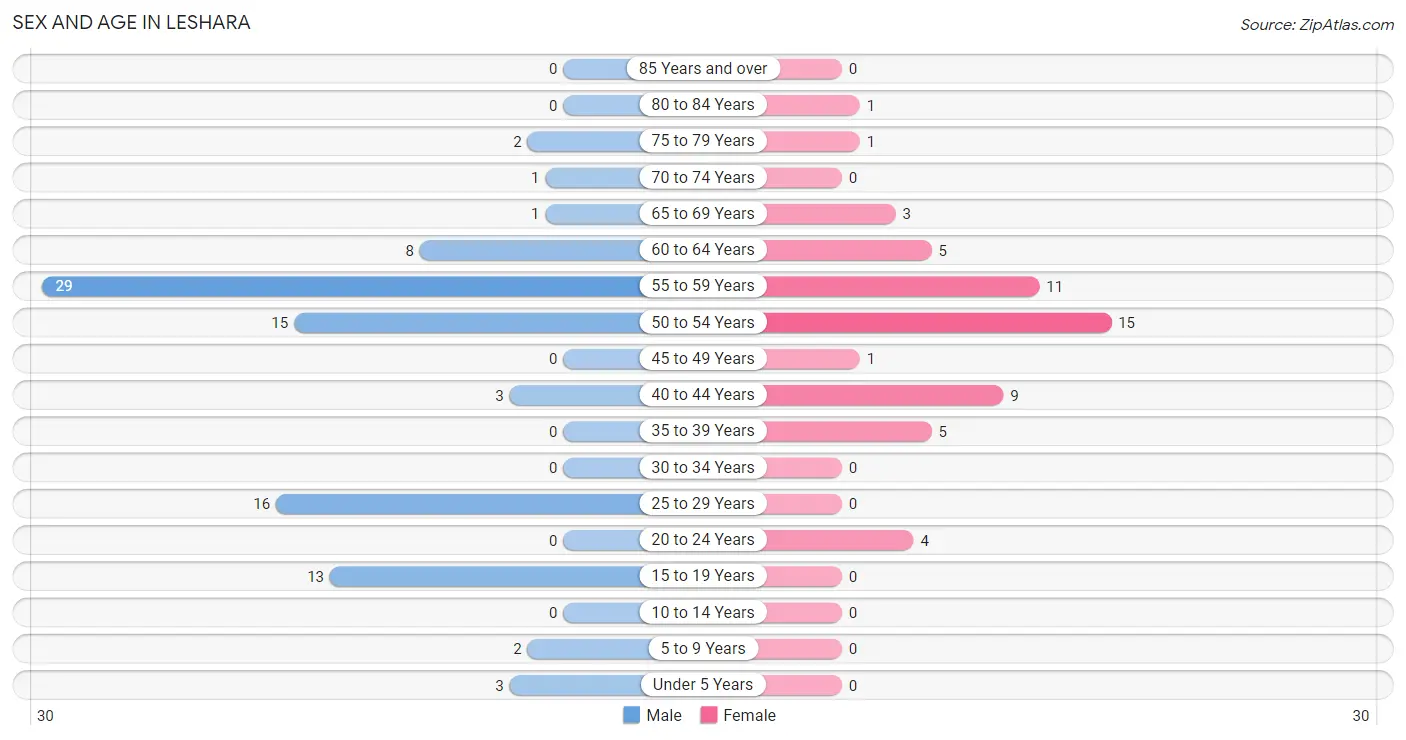
| Age Bracket | Male | Female |
| Under 5 Years | 3 (3.2%) | 0 (0.0%) |
| 5 to 9 Years | 2 (2.1%) | 0 (0.0%) |
| 10 to 14 Years | 0 (0.0%) | 0 (0.0%) |
| 15 to 19 Years | 13 (14.0%) | 0 (0.0%) |
| 20 to 24 Years | 0 (0.0%) | 4 (7.3%) |
| 25 to 29 Years | 16 (17.2%) | 0 (0.0%) |
| 30 to 34 Years | 0 (0.0%) | 0 (0.0%) |
| 35 to 39 Years | 0 (0.0%) | 5 (9.1%) |
| 40 to 44 Years | 3 (3.2%) | 9 (16.4%) |
| 45 to 49 Years | 0 (0.0%) | 1 (1.8%) |
| 50 to 54 Years | 15 (16.1%) | 15 (27.3%) |
| 55 to 59 Years | 29 (31.2%) | 11 (20.0%) |
| 60 to 64 Years | 8 (8.6%) | 5 (9.1%) |
| 65 to 69 Years | 1 (1.1%) | 3 (5.4%) |
| 70 to 74 Years | 1 (1.1%) | 0 (0.0%) |
| 75 to 79 Years | 2 (2.1%) | 1 (1.8%) |
| 80 to 84 Years | 0 (0.0%) | 1 (1.8%) |
| 85 Years and over | 0 (0.0%) | 0 (0.0%) |
| Total | 93 (100.0%) | 55 (100.0%) |
Families and Households in Leshara
Median Family Size in Leshara
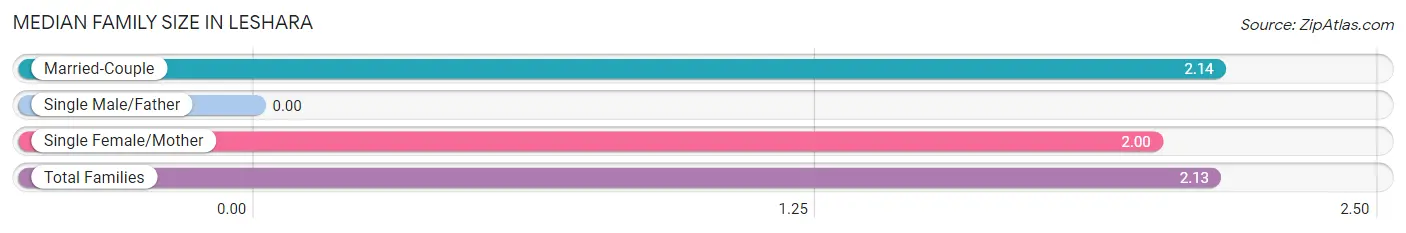
| Family Type | # Families | Family Size |
| Married-Couple | 51 (94.4%) | 2.14 |
| Single Male/Father | 0 (0.0%) | - |
| Single Female/Mother | 3 (5.6%) | 2.00 |
| Total Families | 54 (100.0%) | 2.13 |
Median Household Size in Leshara
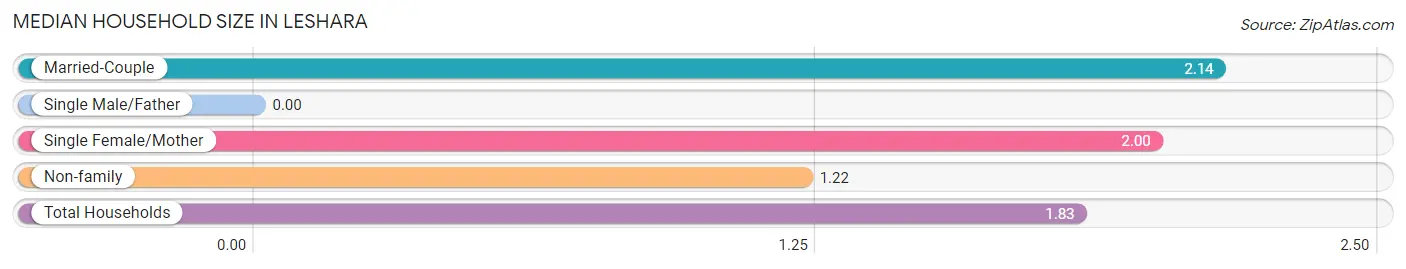
| Household Type | # Households | Household Size |
| Married-Couple | 51 (63.0%) | 2.14 |
| Single Male/Father | 0 (0.0%) | - |
| Single Female/Mother | 3 (3.7%) | 2.00 |
| Non-family | 27 (33.3%) | 1.22 |
| Total Households | 81 (100.0%) | 1.83 |
Household Size by Marriage Status in Leshara
Out of a total of 81 households in Leshara, 54 (66.7%) are family households, while 27 (33.3%) are nonfamily households. The most numerous type of family households are 2-person households, comprising 35, and the most common type of nonfamily households are 1-person households, comprising 22.
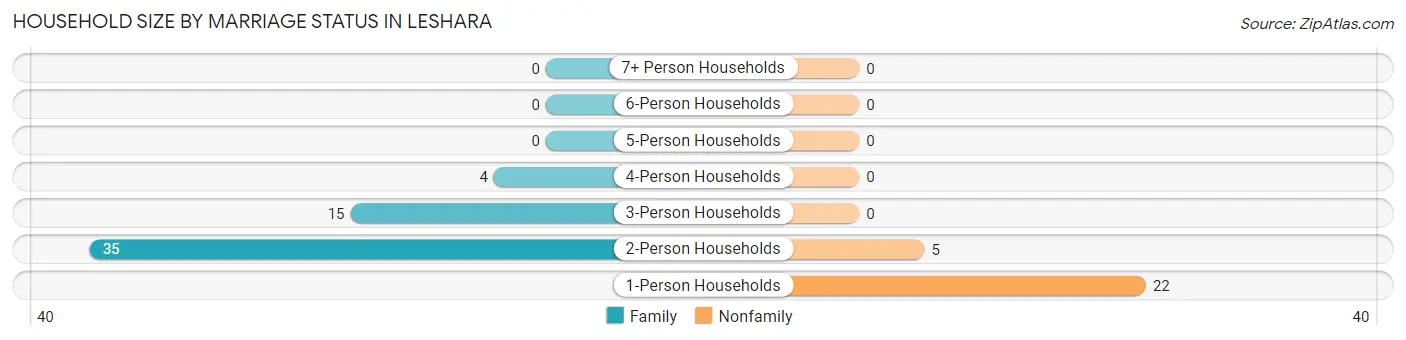
| Household Size | Family Households | Nonfamily Households |
| 1-Person Households | - | 22 (27.2%) |
| 2-Person Households | 35 (43.2%) | 5 (6.2%) |
| 3-Person Households | 15 (18.5%) | 0 (0.0%) |
| 4-Person Households | 4 (4.9%) | 0 (0.0%) |
| 5-Person Households | 0 (0.0%) | 0 (0.0%) |
| 6-Person Households | 0 (0.0%) | 0 (0.0%) |
| 7+ Person Households | 0 (0.0%) | 0 (0.0%) |
| Total | 54 (66.7%) | 27 (33.3%) |
Female Fertility in Leshara
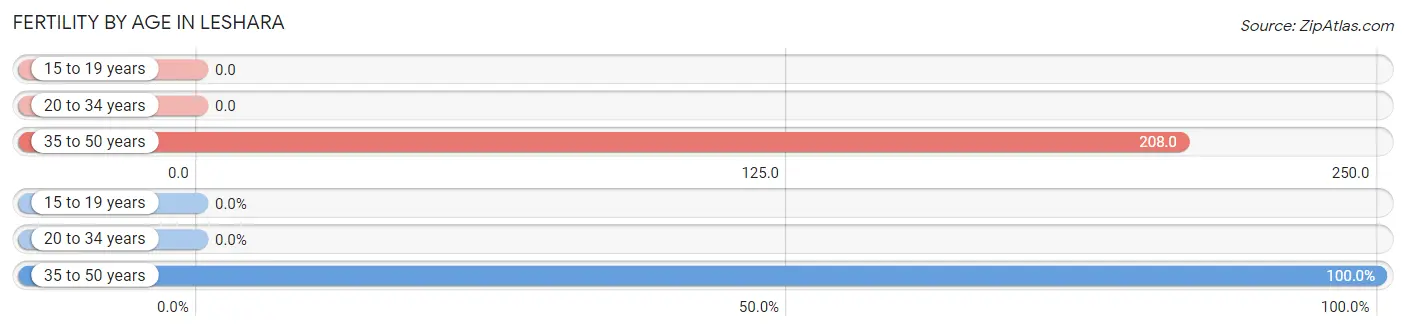
Fertility by Age in Leshara
Average fertility rate in Leshara is 179.0 births per 1,000 women. Women in the age bracket of 35 to 50 years have the highest fertility rate with 208.0 births per 1,000 women. Women in the age bracket of 35 to 50 years acount for 100.0% of all women with births.
| Age Bracket | Women with Births | Births / 1,000 Women |
| 15 to 19 years | 0 (0.0%) | 0.0 |
| 20 to 34 years | 0 (0.0%) | 0.0 |
| 35 to 50 years | 5 (100.0%) | 208.0 |
| Total | 5 (100.0%) | 179.0 |
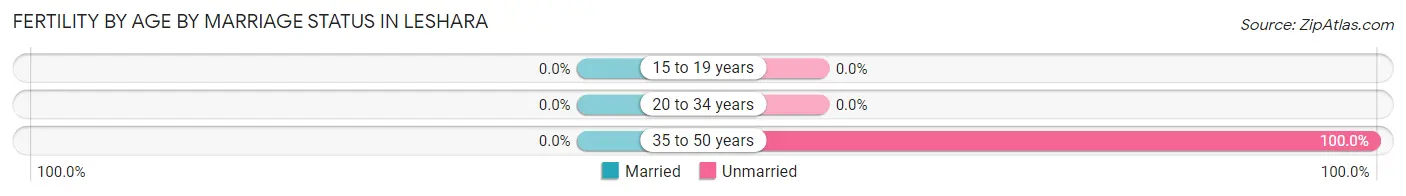
Fertility by Age by Marriage Status in Leshara
| Age Bracket | Married | Unmarried |
| 15 to 19 years | 0 (0.0%) | 0 (0.0%) |
| 20 to 34 years | 0 (0.0%) | 0 (0.0%) |
| 35 to 50 years | 0 (0.0%) | 5 (100.0%) |
| Total | 0 (0.0%) | 5 (100.0%) |
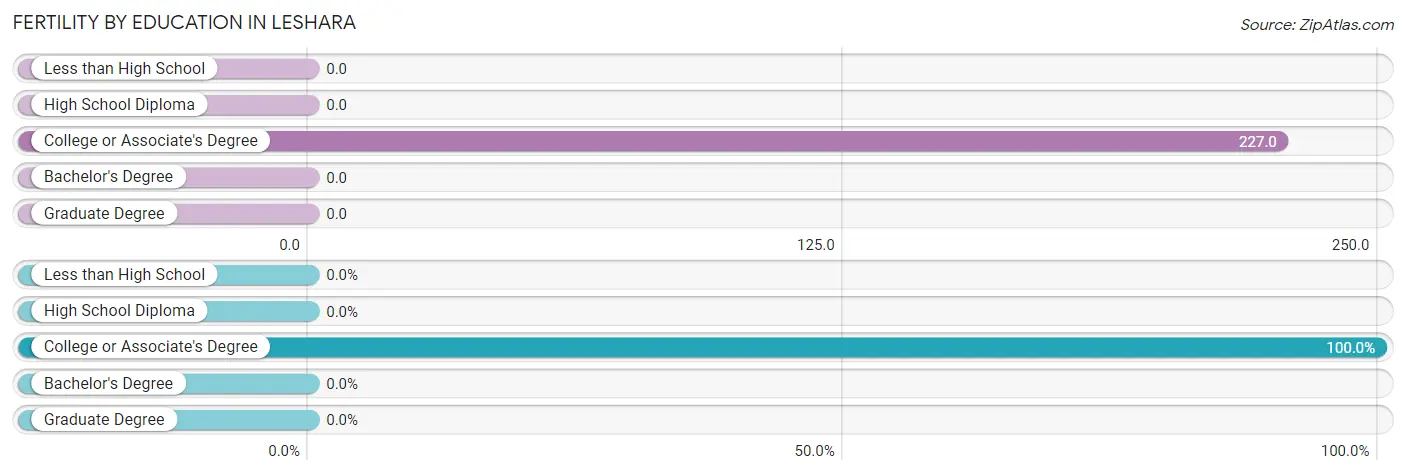
Fertility by Education in Leshara
| Educational Attainment | Women with Births | Births / 1,000 Women |
| Less than High School | 0 (0.0%) | 0.0 |
| High School Diploma | 0 (0.0%) | 0.0 |
| College or Associate's Degree | 5 (100.0%) | 227.0 |
| Bachelor's Degree | 0 (0.0%) | 0.0 |
| Graduate Degree | 0 (0.0%) | 0.0 |
| Total | 5 (100.0%) | 179.0 |
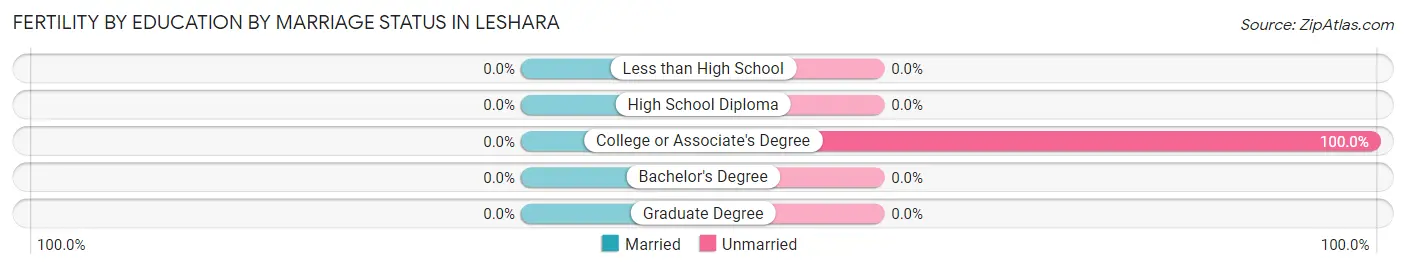
Fertility by Education by Marriage Status in Leshara
| Educational Attainment | Married | Unmarried |
| Less than High School | 0 (0.0%) | 0 (0.0%) |
| High School Diploma | 0 (0.0%) | 0 (0.0%) |
| College or Associate's Degree | 0 (0.0%) | 5 (100.0%) |
| Bachelor's Degree | 0 (0.0%) | 0 (0.0%) |
| Graduate Degree | 0 (0.0%) | 0 (0.0%) |
| Total | 0 (0.0%) | 5 (100.0%) |
Employment Characteristics in Leshara
Employment by Class of Employer in Leshara
Among the 121 employed individuals in Leshara, private company employees (90 | 74.4%), not-for-profit organizations (15 | 12.4%), and self-employed (not incorporated) (13 | 10.7%) make up the most common classes of employment.
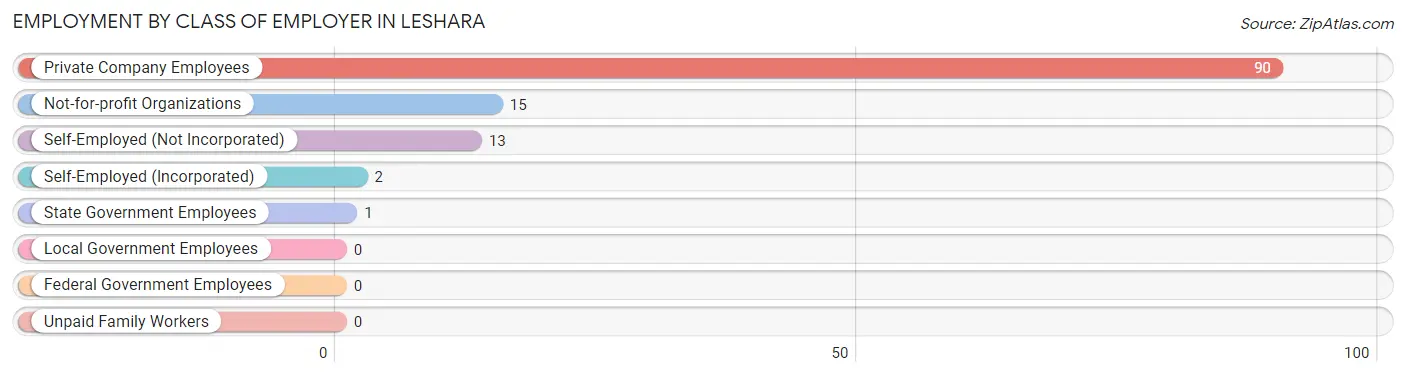
| Employer Class | # Employees | % Employees |
| Private Company Employees | 90 | 74.4% |
| Self-Employed (Incorporated) | 2 | 1.7% |
| Self-Employed (Not Incorporated) | 13 | 10.7% |
| Not-for-profit Organizations | 15 | 12.4% |
| Local Government Employees | 0 | 0.0% |
| State Government Employees | 1 | 0.8% |
| Federal Government Employees | 0 | 0.0% |
| Unpaid Family Workers | 0 | 0.0% |
| Total | 121 | 100.0% |
Employment Status by Age in Leshara
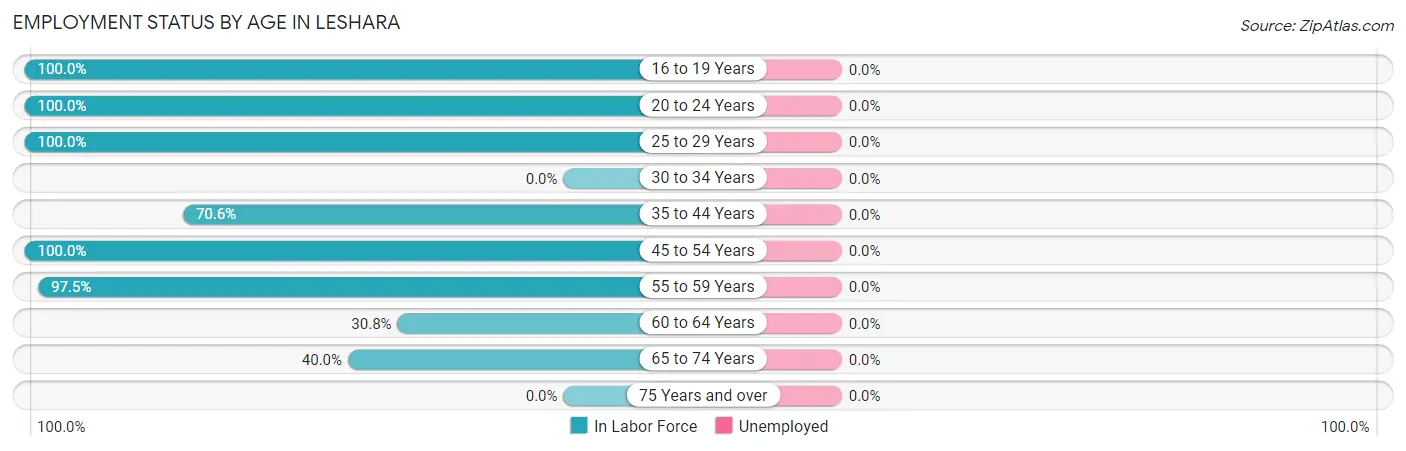
| Age Bracket | In Labor Force | Unemployed |
| 16 to 19 Years | 13 (100.0%) | 0 (0.0%) |
| 20 to 24 Years | 4 (100.0%) | 0 (0.0%) |
| 25 to 29 Years | 16 (100.0%) | 0 (0.0%) |
| 30 to 34 Years | 0 (0.0%) | 0 (0.0%) |
| 35 to 44 Years | 12 (70.6%) | 0 (0.0%) |
| 45 to 54 Years | 31 (100.0%) | 0 (0.0%) |
| 55 to 59 Years | 39 (97.5%) | 0 (0.0%) |
| 60 to 64 Years | 4 (30.8%) | 0 (0.0%) |
| 65 to 74 Years | 2 (40.0%) | 0 (0.0%) |
| 75 Years and over | 0 (0.0%) | 0 (0.0%) |
| Total | 121 (84.6%) | 0 (0.0%) |
Employment Status by Educational Attainment in Leshara
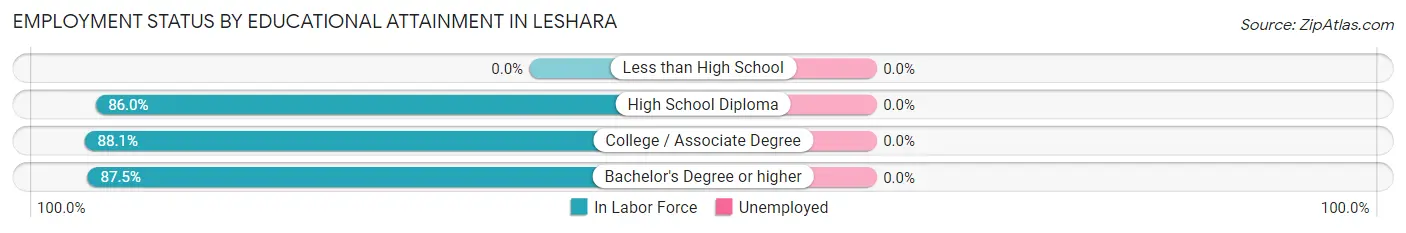
| Educational Attainment | In Labor Force | Unemployed |
| Less than High School | 0 (0.0%) | 0 (0.0%) |
| High School Diploma | 43 (86.0%) | 0 (0.0%) |
| College / Associate Degree | 52 (88.1%) | 0 (0.0%) |
| Bachelor's Degree or higher | 7 (87.5%) | 0 (0.0%) |
| Total | 102 (87.2%) | 0 (0.0%) |
Employment Occupations by Sex in Leshara
Management, Business, Science and Arts Occupations
The most common Management, Business, Science and Arts occupations in Leshara are Computers, Engineering & Science (25 | 20.7%), Architecture & Engineering (15 | 12.4%), Business & Financial (12 | 9.9%), Computers & Mathematics (10 | 8.3%), and Health Diagnosing & Treating (4 | 3.3%).
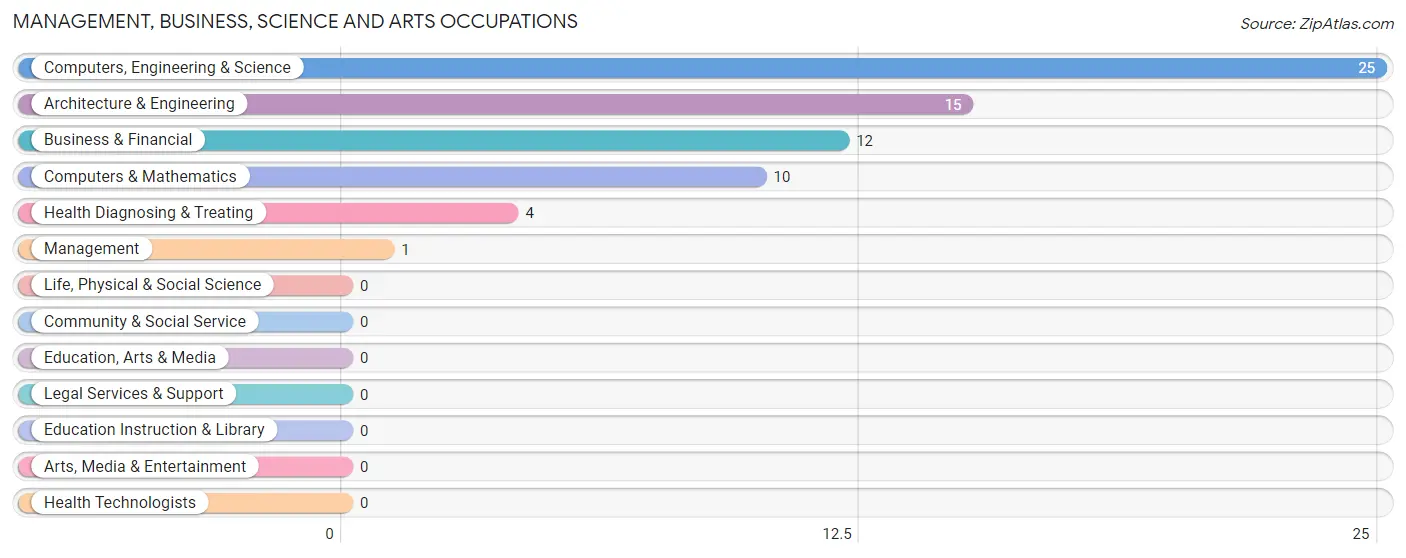
Management, Business, Science and Arts Occupations by Sex
Within the Management, Business, Science and Arts occupations in Leshara, the most male-oriented occupations are Management (100.0%), Computers, Engineering & Science (100.0%), and Computers & Mathematics (100.0%), while the most female-oriented occupations are Business & Financial (100.0%), and Health Diagnosing & Treating (100.0%).
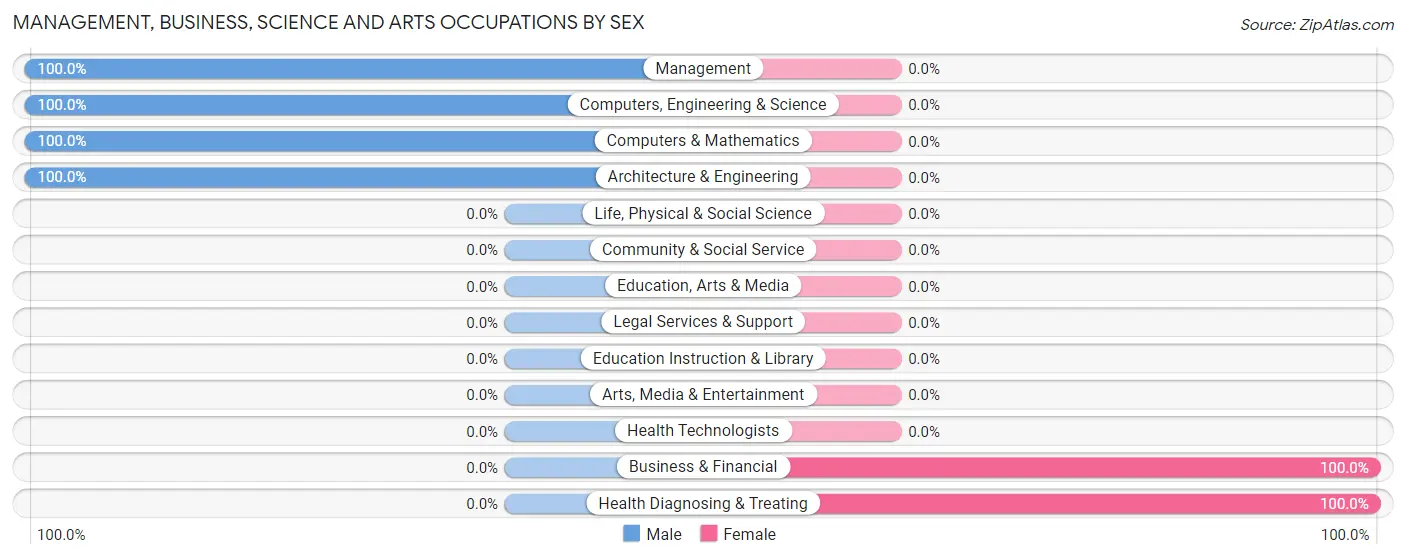
| Occupation | Male | Female |
| Management | 1 (100.0%) | 0 (0.0%) |
| Business & Financial | 0 (0.0%) | 12 (100.0%) |
| Computers, Engineering & Science | 25 (100.0%) | 0 (0.0%) |
| Computers & Mathematics | 10 (100.0%) | 0 (0.0%) |
| Architecture & Engineering | 15 (100.0%) | 0 (0.0%) |
| Life, Physical & Social Science | 0 (0.0%) | 0 (0.0%) |
| Community & Social Service | 0 (0.0%) | 0 (0.0%) |
| Education, Arts & Media | 0 (0.0%) | 0 (0.0%) |
| Legal Services & Support | 0 (0.0%) | 0 (0.0%) |
| Education Instruction & Library | 0 (0.0%) | 0 (0.0%) |
| Arts, Media & Entertainment | 0 (0.0%) | 0 (0.0%) |
| Health Diagnosing & Treating | 0 (0.0%) | 4 (100.0%) |
| Health Technologists | 0 (0.0%) | 0 (0.0%) |
| Total (Category) | 26 (61.9%) | 16 (38.1%) |
| Total (Overall) | 76 (62.8%) | 45 (37.2%) |
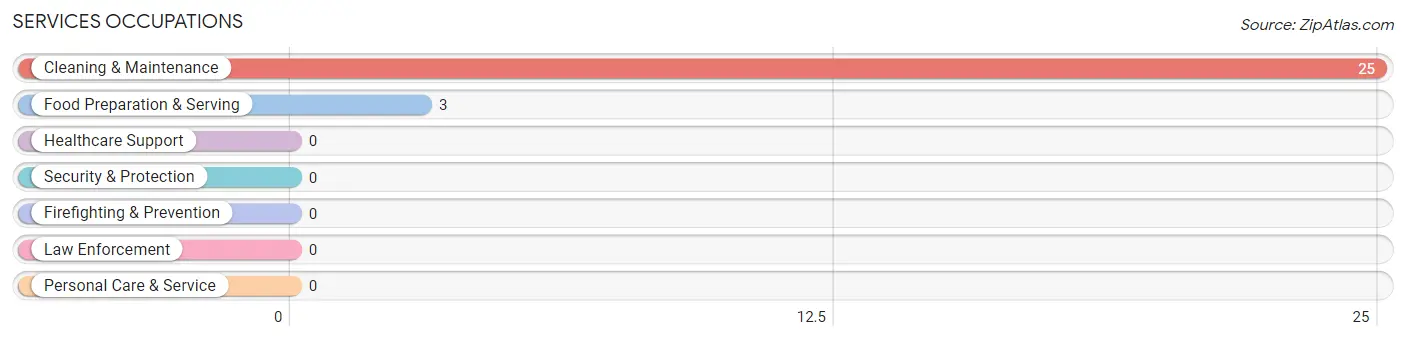
Services Occupations
The most common Services occupations in Leshara are Cleaning & Maintenance (25 | 20.7%), and Food Preparation & Serving (3 | 2.5%).
Services Occupations by Sex
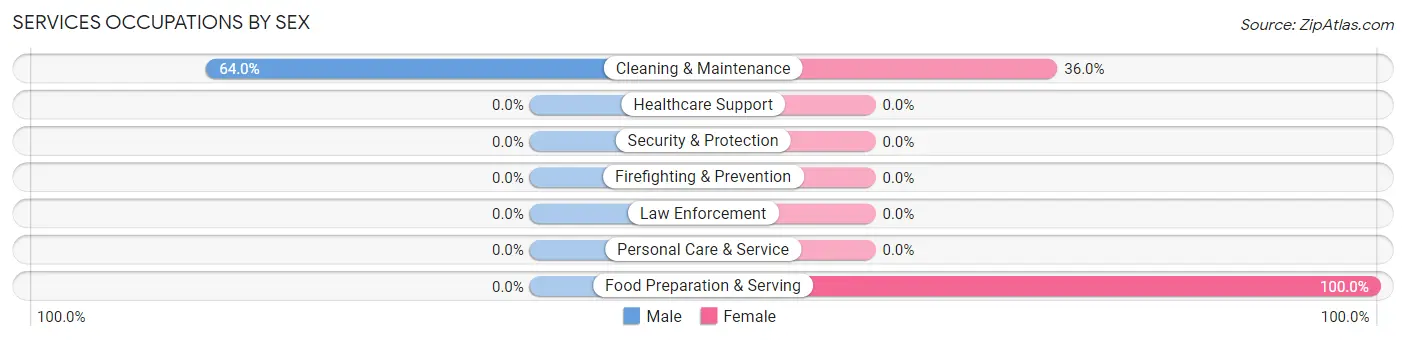
| Occupation | Male | Female |
| Healthcare Support | 0 (0.0%) | 0 (0.0%) |
| Security & Protection | 0 (0.0%) | 0 (0.0%) |
| Firefighting & Prevention | 0 (0.0%) | 0 (0.0%) |
| Law Enforcement | 0 (0.0%) | 0 (0.0%) |
| Food Preparation & Serving | 0 (0.0%) | 3 (100.0%) |
| Cleaning & Maintenance | 16 (64.0%) | 9 (36.0%) |
| Personal Care & Service | 0 (0.0%) | 0 (0.0%) |
| Total (Category) | 16 (57.1%) | 12 (42.9%) |
| Total (Overall) | 76 (62.8%) | 45 (37.2%) |
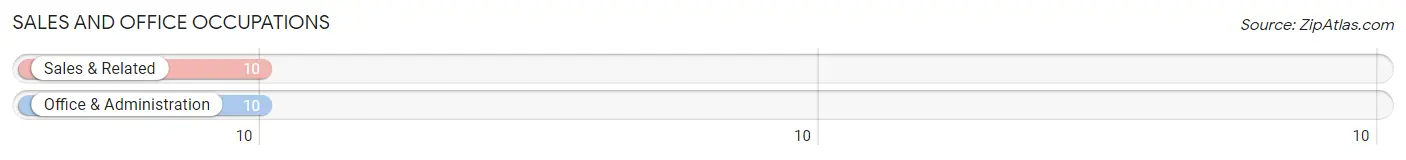
Sales and Office Occupations
The most common Sales and Office occupations in Leshara are Sales & Related (10 | 8.3%), and Office & Administration (10 | 8.3%).
Sales and Office Occupations by Sex
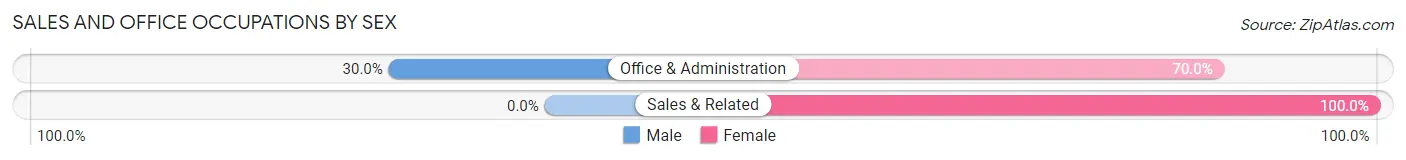
| Occupation | Male | Female |
| Sales & Related | 0 (0.0%) | 10 (100.0%) |
| Office & Administration | 3 (30.0%) | 7 (70.0%) |
| Total (Category) | 3 (15.0%) | 17 (85.0%) |
| Total (Overall) | 76 (62.8%) | 45 (37.2%) |
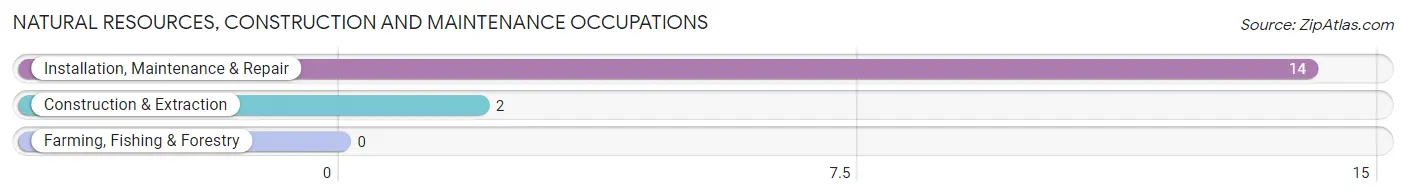
Natural Resources, Construction and Maintenance Occupations
The most common Natural Resources, Construction and Maintenance occupations in Leshara are Installation, Maintenance & Repair (14 | 11.6%), and Construction & Extraction (2 | 1.7%).
Natural Resources, Construction and Maintenance Occupations by Sex
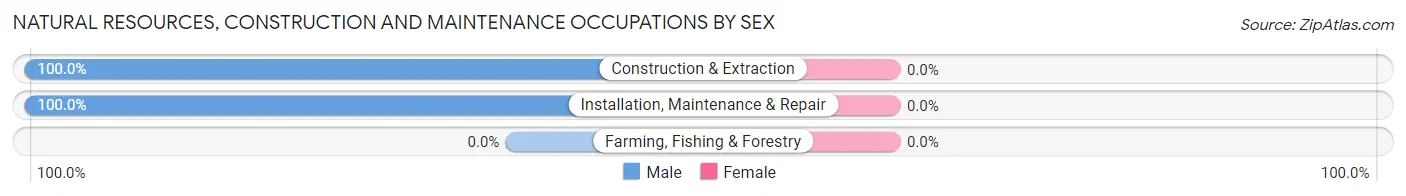
| Occupation | Male | Female |
| Farming, Fishing & Forestry | 0 (0.0%) | 0 (0.0%) |
| Construction & Extraction | 2 (100.0%) | 0 (0.0%) |
| Installation, Maintenance & Repair | 14 (100.0%) | 0 (0.0%) |
| Total (Category) | 16 (100.0%) | 0 (0.0%) |
| Total (Overall) | 76 (62.8%) | 45 (37.2%) |
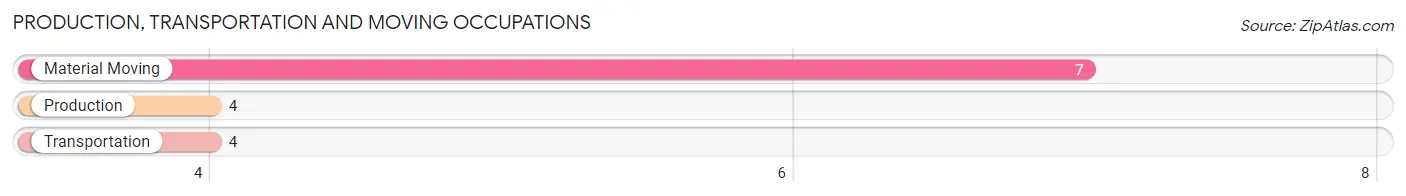
Production, Transportation and Moving Occupations
The most common Production, Transportation and Moving occupations in Leshara are Material Moving (7 | 5.8%), Production (4 | 3.3%), and Transportation (4 | 3.3%).
Production, Transportation and Moving Occupations by Sex
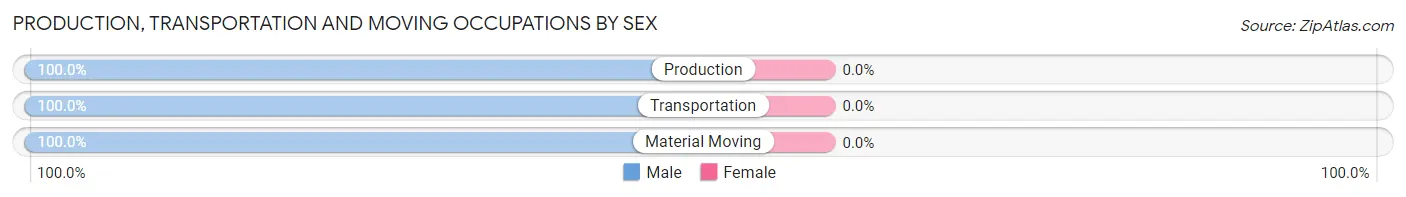
| Occupation | Male | Female |
| Production | 4 (100.0%) | 0 (0.0%) |
| Transportation | 4 (100.0%) | 0 (0.0%) |
| Material Moving | 7 (100.0%) | 0 (0.0%) |
| Total (Category) | 15 (100.0%) | 0 (0.0%) |
| Total (Overall) | 76 (62.8%) | 45 (37.2%) |
Employment Industries by Sex in Leshara
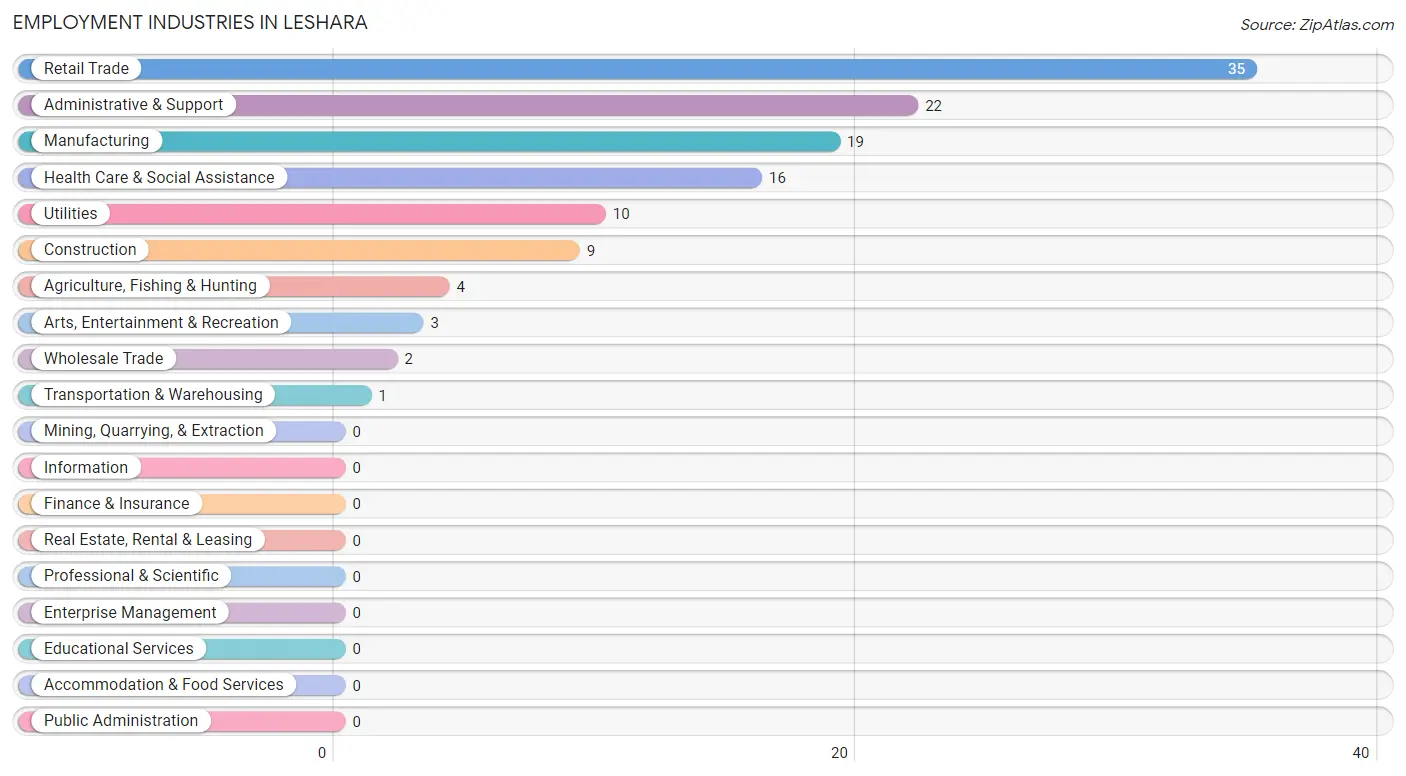
Employment Industries in Leshara
The major employment industries in Leshara include Retail Trade (35 | 28.9%), Administrative & Support (22 | 18.2%), Manufacturing (19 | 15.7%), Health Care & Social Assistance (16 | 13.2%), and Utilities (10 | 8.3%).
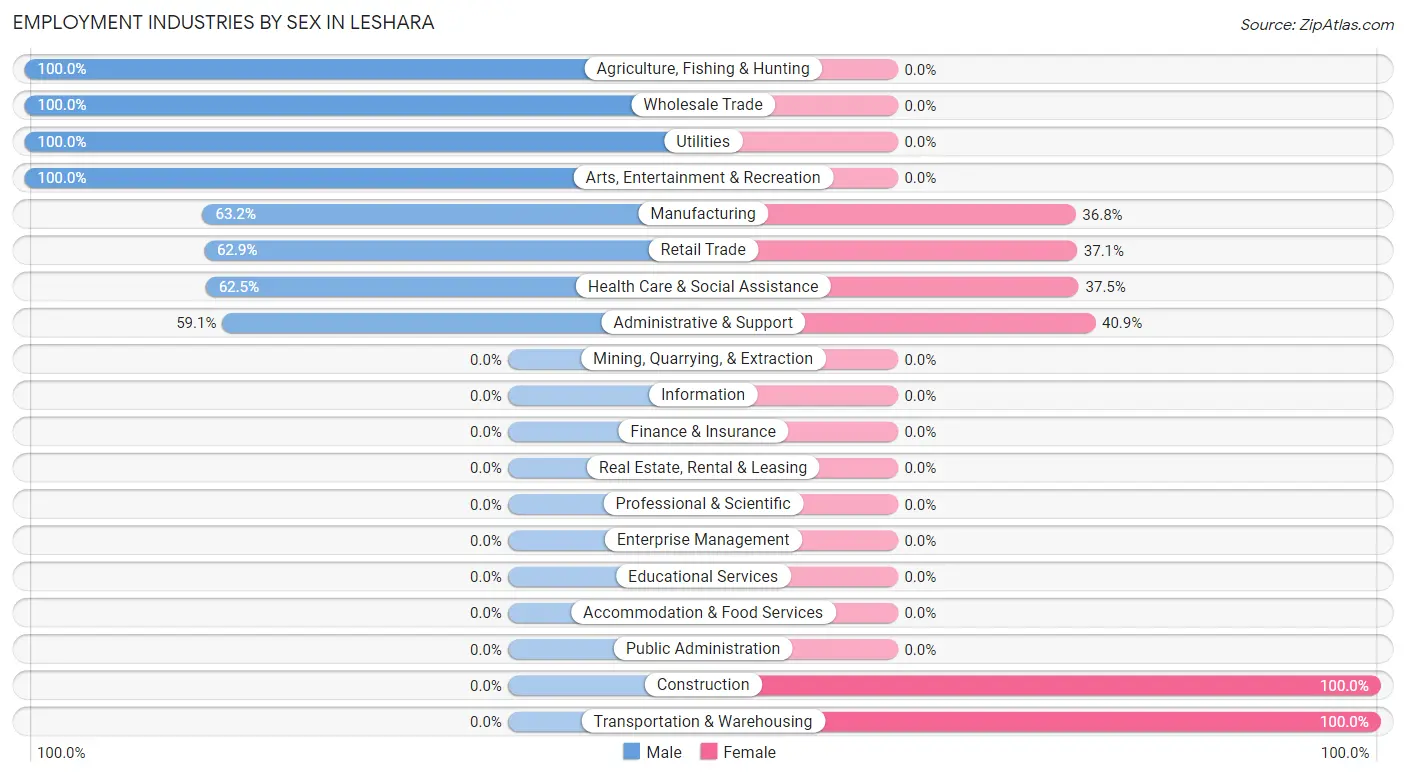
Employment Industries by Sex in Leshara
The Leshara industries that see more men than women are Agriculture, Fishing & Hunting (100.0%), Wholesale Trade (100.0%), and Utilities (100.0%), whereas the industries that tend to have a higher number of women are Construction (100.0%), Transportation & Warehousing (100.0%), and Administrative & Support (40.9%).
| Industry | Male | Female |
| Agriculture, Fishing & Hunting | 4 (100.0%) | 0 (0.0%) |
| Mining, Quarrying, & Extraction | 0 (0.0%) | 0 (0.0%) |
| Construction | 0 (0.0%) | 9 (100.0%) |
| Manufacturing | 12 (63.2%) | 7 (36.8%) |
| Wholesale Trade | 2 (100.0%) | 0 (0.0%) |
| Retail Trade | 22 (62.9%) | 13 (37.1%) |
| Transportation & Warehousing | 0 (0.0%) | 1 (100.0%) |
| Utilities | 10 (100.0%) | 0 (0.0%) |
| Information | 0 (0.0%) | 0 (0.0%) |
| Finance & Insurance | 0 (0.0%) | 0 (0.0%) |
| Real Estate, Rental & Leasing | 0 (0.0%) | 0 (0.0%) |
| Professional & Scientific | 0 (0.0%) | 0 (0.0%) |
| Enterprise Management | 0 (0.0%) | 0 (0.0%) |
| Administrative & Support | 13 (59.1%) | 9 (40.9%) |
| Educational Services | 0 (0.0%) | 0 (0.0%) |
| Health Care & Social Assistance | 10 (62.5%) | 6 (37.5%) |
| Arts, Entertainment & Recreation | 3 (100.0%) | 0 (0.0%) |
| Accommodation & Food Services | 0 (0.0%) | 0 (0.0%) |
| Public Administration | 0 (0.0%) | 0 (0.0%) |
| Total | 76 (62.8%) | 45 (37.2%) |
Education in Leshara
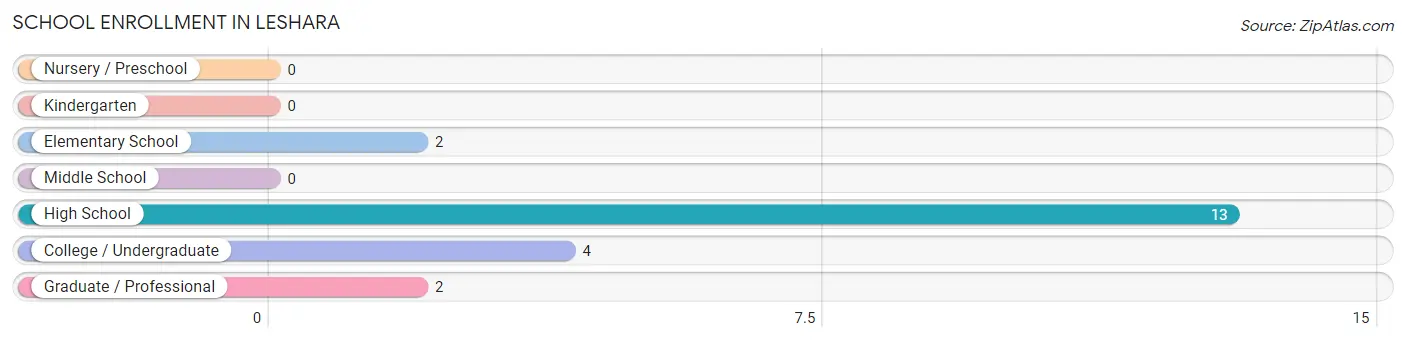
School Enrollment in Leshara
The most common levels of schooling among the 21 students in Leshara are high school (13 | 61.9%), college / undergraduate (4 | 19.1%), and elementary school (2 | 9.5%).
| School Level | # Students | % Students |
| Nursery / Preschool | 0 | 0.0% |
| Kindergarten | 0 | 0.0% |
| Elementary School | 2 | 9.5% |
| Middle School | 0 | 0.0% |
| High School | 13 | 61.9% |
| College / Undergraduate | 4 | 19.1% |
| Graduate / Professional | 2 | 9.5% |
| Total | 21 | 100.0% |
School Enrollment by Age by Funding Source in Leshara
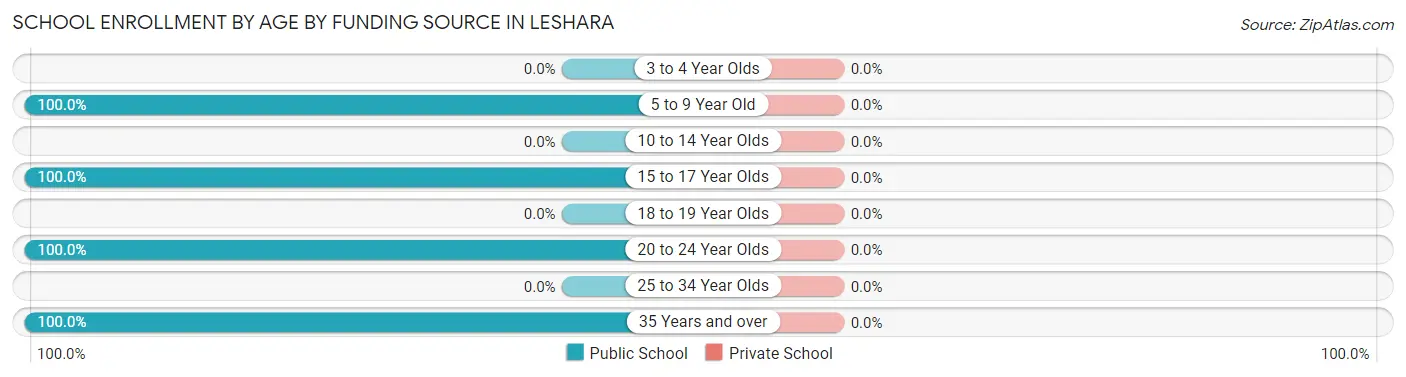
| Age Bracket | Public School | Private School |
| 3 to 4 Year Olds | 0 (0.0%) | 0 (0.0%) |
| 5 to 9 Year Old | 2 (100.0%) | 0 (0.0%) |
| 10 to 14 Year Olds | 0 (0.0%) | 0 (0.0%) |
| 15 to 17 Year Olds | 13 (100.0%) | 0 (0.0%) |
| 18 to 19 Year Olds | 0 (0.0%) | 0 (0.0%) |
| 20 to 24 Year Olds | 4 (100.0%) | 0 (0.0%) |
| 25 to 34 Year Olds | 0 (0.0%) | 0 (0.0%) |
| 35 Years and over | 2 (100.0%) | 0 (0.0%) |
| Total | 21 (100.0%) | 0 (0.0%) |
Educational Attainment by Field of Study in Leshara
Arts & humanities (6 | 75.0%), physical & health sciences (1 | 12.5%), and communications (1 | 12.5%) are the most common fields of study among 8 individuals in Leshara who have obtained a bachelor's degree or higher.
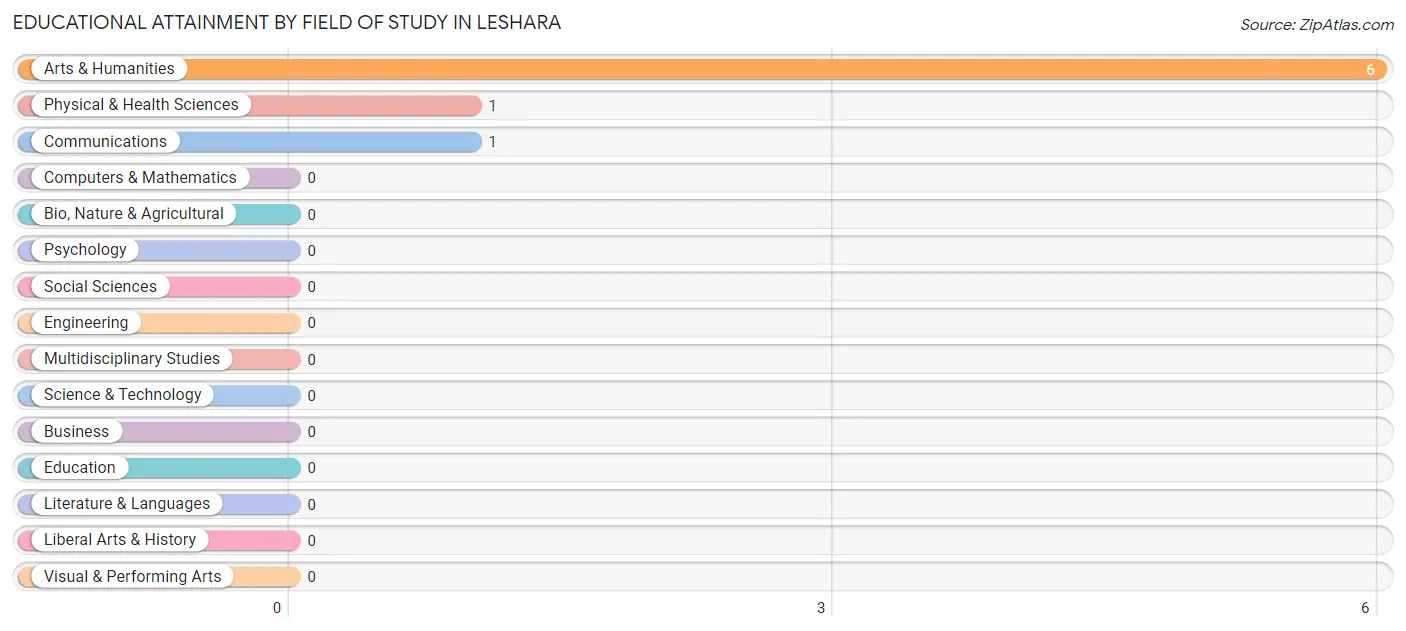
| Field of Study | # Graduates | % Graduates |
| Computers & Mathematics | 0 | 0.0% |
| Bio, Nature & Agricultural | 0 | 0.0% |
| Physical & Health Sciences | 1 | 12.5% |
| Psychology | 0 | 0.0% |
| Social Sciences | 0 | 0.0% |
| Engineering | 0 | 0.0% |
| Multidisciplinary Studies | 0 | 0.0% |
| Science & Technology | 0 | 0.0% |
| Business | 0 | 0.0% |
| Education | 0 | 0.0% |
| Literature & Languages | 0 | 0.0% |
| Liberal Arts & History | 0 | 0.0% |
| Visual & Performing Arts | 0 | 0.0% |
| Communications | 1 | 12.5% |
| Arts & Humanities | 6 | 75.0% |
| Total | 8 | 100.0% |
Transportation & Commute in Leshara
Vehicle Availability by Sex in Leshara
The most prevalent vehicle ownership categories in Leshara are males with 4 vehicles (32, accounting for 42.1%) and females with 4 vehicles (10, making up 71.1%).
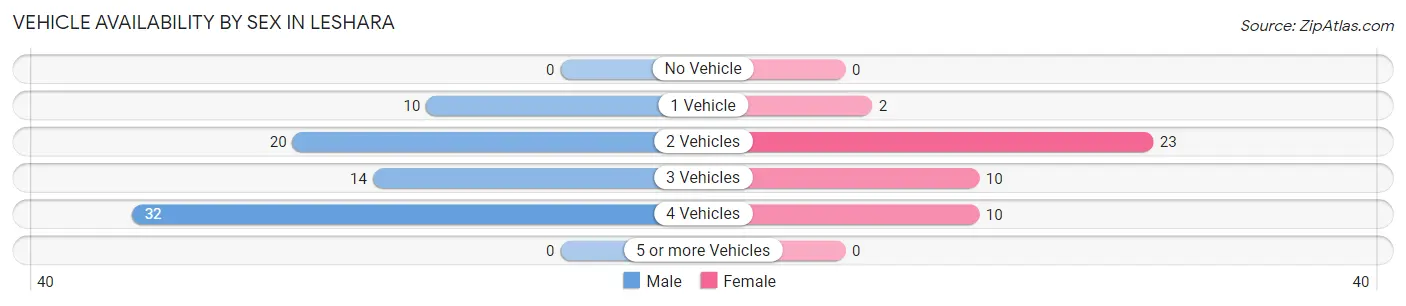
| Vehicles Available | Male | Female |
| No Vehicle | 0 (0.0%) | 0 (0.0%) |
| 1 Vehicle | 10 (13.2%) | 2 (4.4%) |
| 2 Vehicles | 20 (26.3%) | 23 (51.1%) |
| 3 Vehicles | 14 (18.4%) | 10 (22.2%) |
| 4 Vehicles | 32 (42.1%) | 10 (22.2%) |
| 5 or more Vehicles | 0 (0.0%) | 0 (0.0%) |
| Total | 76 (100.0%) | 45 (100.0%) |
Commute Time in Leshara
The most frequently occuring commute durations in Leshara are 20 to 24 minutes (21 commuters, 22.8%), 15 to 19 minutes (16 commuters, 17.4%), and 5 to 9 minutes (14 commuters, 15.2%).
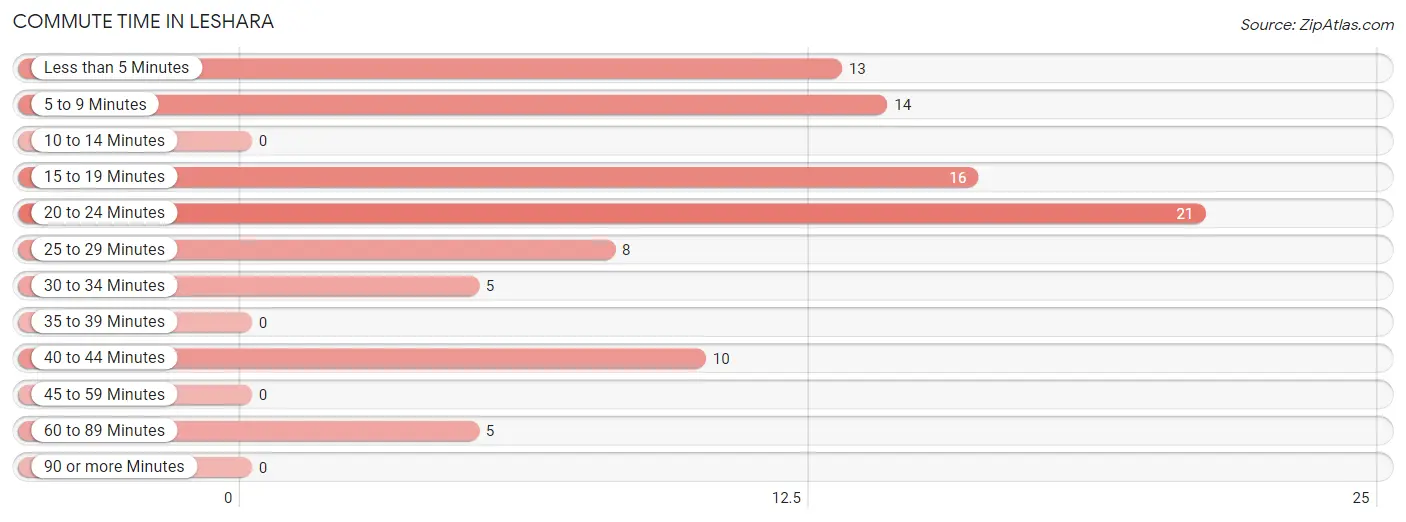
| Commute Time | # Commuters | % Commuters |
| Less than 5 Minutes | 13 | 14.1% |
| 5 to 9 Minutes | 14 | 15.2% |
| 10 to 14 Minutes | 0 | 0.0% |
| 15 to 19 Minutes | 16 | 17.4% |
| 20 to 24 Minutes | 21 | 22.8% |
| 25 to 29 Minutes | 8 | 8.7% |
| 30 to 34 Minutes | 5 | 5.4% |
| 35 to 39 Minutes | 0 | 0.0% |
| 40 to 44 Minutes | 10 | 10.9% |
| 45 to 59 Minutes | 0 | 0.0% |
| 60 to 89 Minutes | 5 | 5.4% |
| 90 or more Minutes | 0 | 0.0% |
Commute Time by Sex in Leshara
The most common commute times in Leshara are 5 to 9 minutes (14 commuters, 29.2%) for males and 20 to 24 minutes (15 commuters, 34.1%) for females.
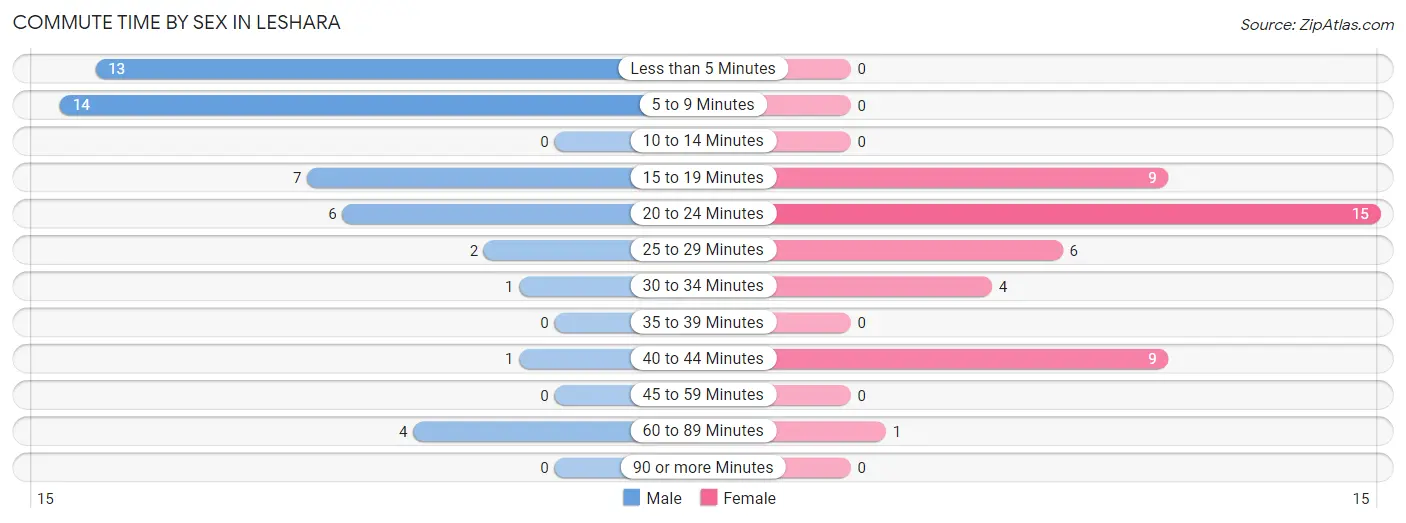
| Commute Time | Male | Female |
| Less than 5 Minutes | 13 (27.1%) | 0 (0.0%) |
| 5 to 9 Minutes | 14 (29.2%) | 0 (0.0%) |
| 10 to 14 Minutes | 0 (0.0%) | 0 (0.0%) |
| 15 to 19 Minutes | 7 (14.6%) | 9 (20.4%) |
| 20 to 24 Minutes | 6 (12.5%) | 15 (34.1%) |
| 25 to 29 Minutes | 2 (4.2%) | 6 (13.6%) |
| 30 to 34 Minutes | 1 (2.1%) | 4 (9.1%) |
| 35 to 39 Minutes | 0 (0.0%) | 0 (0.0%) |
| 40 to 44 Minutes | 1 (2.1%) | 9 (20.4%) |
| 45 to 59 Minutes | 0 (0.0%) | 0 (0.0%) |
| 60 to 89 Minutes | 4 (8.3%) | 1 (2.3%) |
| 90 or more Minutes | 0 (0.0%) | 0 (0.0%) |
Time of Departure to Work by Sex in Leshara
The most frequent times of departure to work in Leshara are 12:00 PM to 3:59 PM (13, 27.1%) for males and 4:00 PM to 11:59 PM (13, 29.5%) for females.
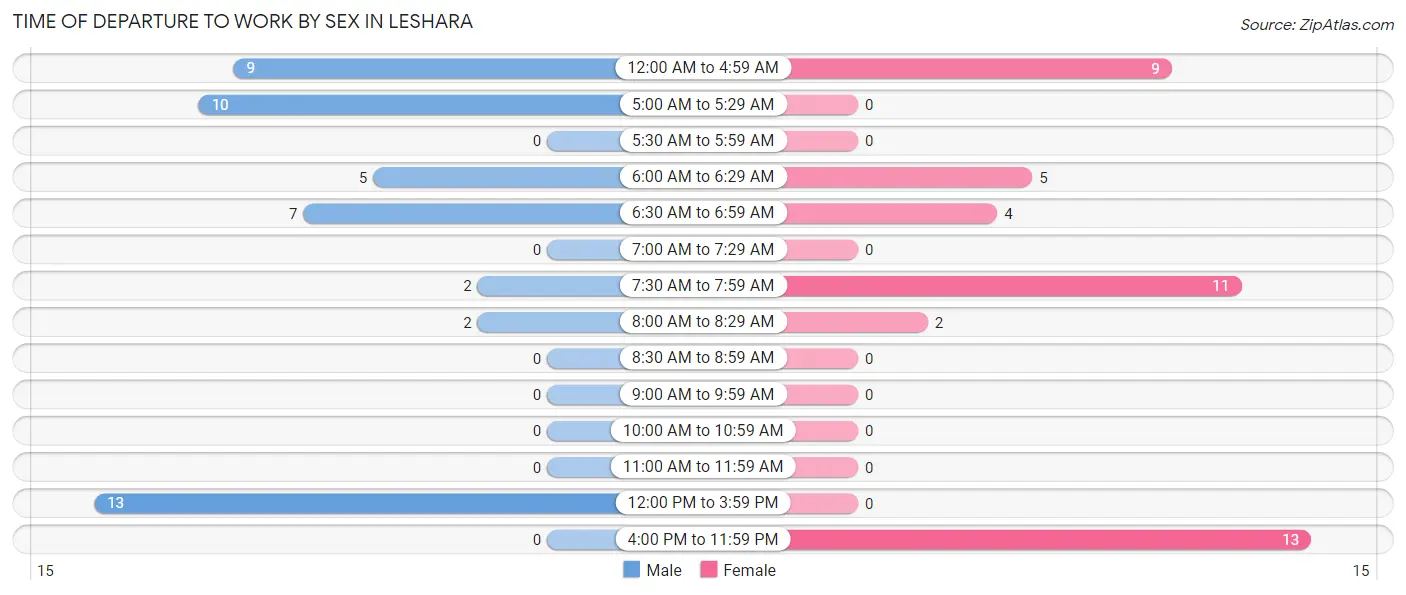
| Time of Departure | Male | Female |
| 12:00 AM to 4:59 AM | 9 (18.8%) | 9 (20.4%) |
| 5:00 AM to 5:29 AM | 10 (20.8%) | 0 (0.0%) |
| 5:30 AM to 5:59 AM | 0 (0.0%) | 0 (0.0%) |
| 6:00 AM to 6:29 AM | 5 (10.4%) | 5 (11.4%) |
| 6:30 AM to 6:59 AM | 7 (14.6%) | 4 (9.1%) |
| 7:00 AM to 7:29 AM | 0 (0.0%) | 0 (0.0%) |
| 7:30 AM to 7:59 AM | 2 (4.2%) | 11 (25.0%) |
| 8:00 AM to 8:29 AM | 2 (4.2%) | 2 (4.5%) |
| 8:30 AM to 8:59 AM | 0 (0.0%) | 0 (0.0%) |
| 9:00 AM to 9:59 AM | 0 (0.0%) | 0 (0.0%) |
| 10:00 AM to 10:59 AM | 0 (0.0%) | 0 (0.0%) |
| 11:00 AM to 11:59 AM | 0 (0.0%) | 0 (0.0%) |
| 12:00 PM to 3:59 PM | 13 (27.1%) | 0 (0.0%) |
| 4:00 PM to 11:59 PM | 0 (0.0%) | 13 (29.5%) |
| Total | 48 (100.0%) | 44 (100.0%) |
Housing Occupancy in Leshara
Occupancy by Ownership in Leshara
Of the total 81 dwellings in Leshara, owner-occupied units account for 79 (97.5%), while renter-occupied units make up 2 (2.5%).
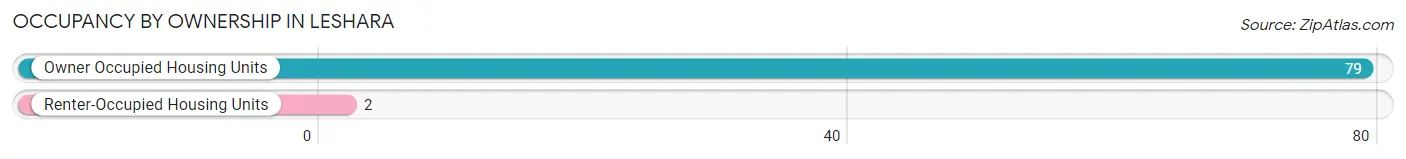
| Occupancy | # Housing Units | % Housing Units |
| Owner Occupied Housing Units | 79 | 97.5% |
| Renter-Occupied Housing Units | 2 | 2.5% |
| Total Occupied Housing Units | 81 | 100.0% |
Occupancy by Household Size in Leshara
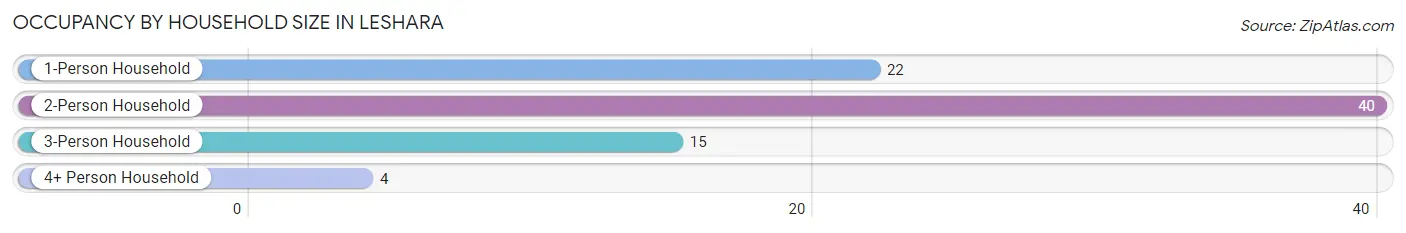
| Household Size | # Housing Units | % Housing Units |
| 1-Person Household | 22 | 27.2% |
| 2-Person Household | 40 | 49.4% |
| 3-Person Household | 15 | 18.5% |
| 4+ Person Household | 4 | 4.9% |
| Total Housing Units | 81 | 100.0% |
Occupancy by Ownership by Household Size in Leshara
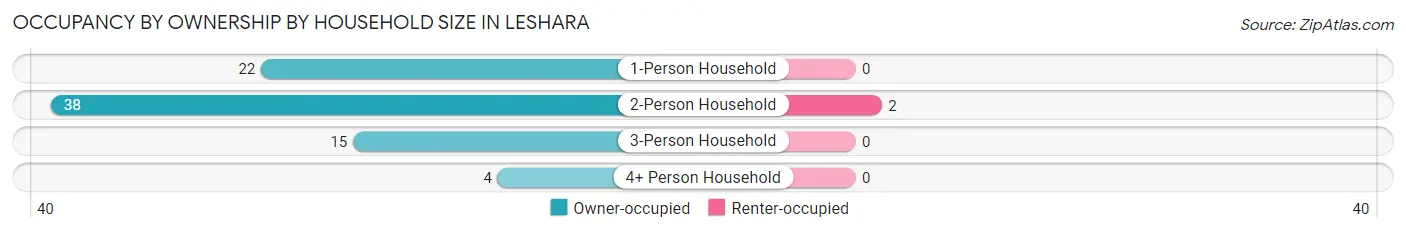
| Household Size | Owner-occupied | Renter-occupied |
| 1-Person Household | 22 (100.0%) | 0 (0.0%) |
| 2-Person Household | 38 (95.0%) | 2 (5.0%) |
| 3-Person Household | 15 (100.0%) | 0 (0.0%) |
| 4+ Person Household | 4 (100.0%) | 0 (0.0%) |
| Total Housing Units | 79 (97.5%) | 2 (2.5%) |
Occupancy by Educational Attainment in Leshara
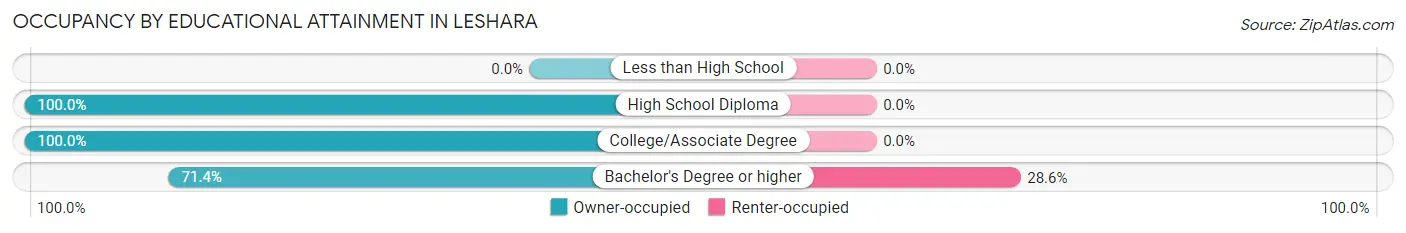
| Household Size | Owner-occupied | Renter-occupied |
| Less than High School | 0 (0.0%) | 0 (0.0%) |
| High School Diploma | 35 (100.0%) | 0 (0.0%) |
| College/Associate Degree | 39 (100.0%) | 0 (0.0%) |
| Bachelor's Degree or higher | 5 (71.4%) | 2 (28.6%) |
Occupancy by Age of Householder in Leshara
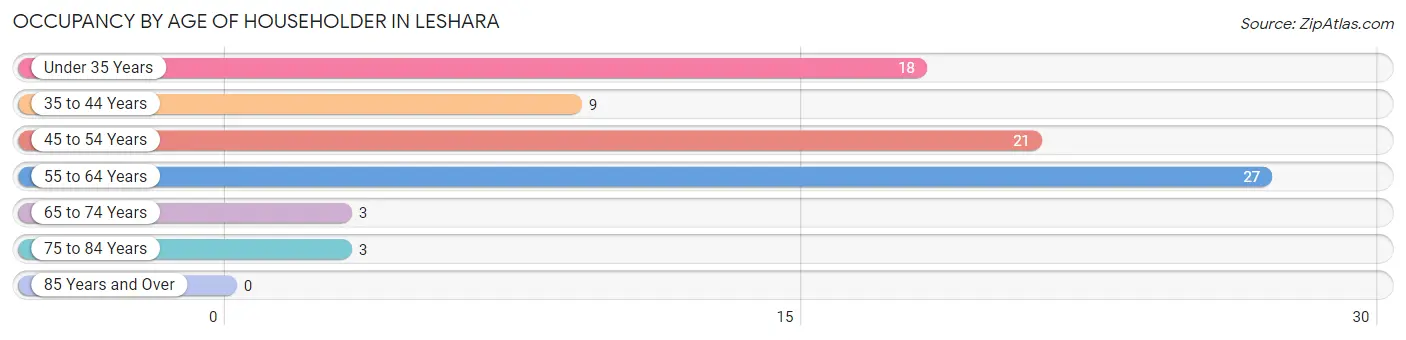
| Age Bracket | # Households | % Households |
| Under 35 Years | 18 | 22.2% |
| 35 to 44 Years | 9 | 11.1% |
| 45 to 54 Years | 21 | 25.9% |
| 55 to 64 Years | 27 | 33.3% |
| 65 to 74 Years | 3 | 3.7% |
| 75 to 84 Years | 3 | 3.7% |
| 85 Years and Over | 0 | 0.0% |
| Total | 81 | 100.0% |
Housing Finances in Leshara
Median Income by Occupancy in Leshara
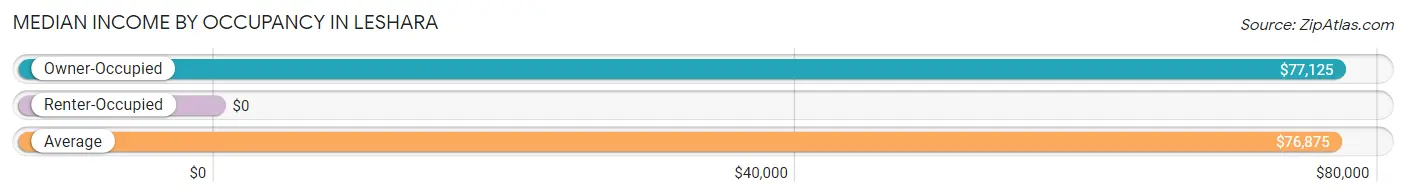
| Occupancy Type | # Households | Median Income |
| Owner-Occupied | 79 (97.5%) | $77,125 |
| Renter-Occupied | 2 (2.5%) | $0 |
| Average | 81 (100.0%) | $76,875 |
Occupancy by Householder Income Bracket in Leshara
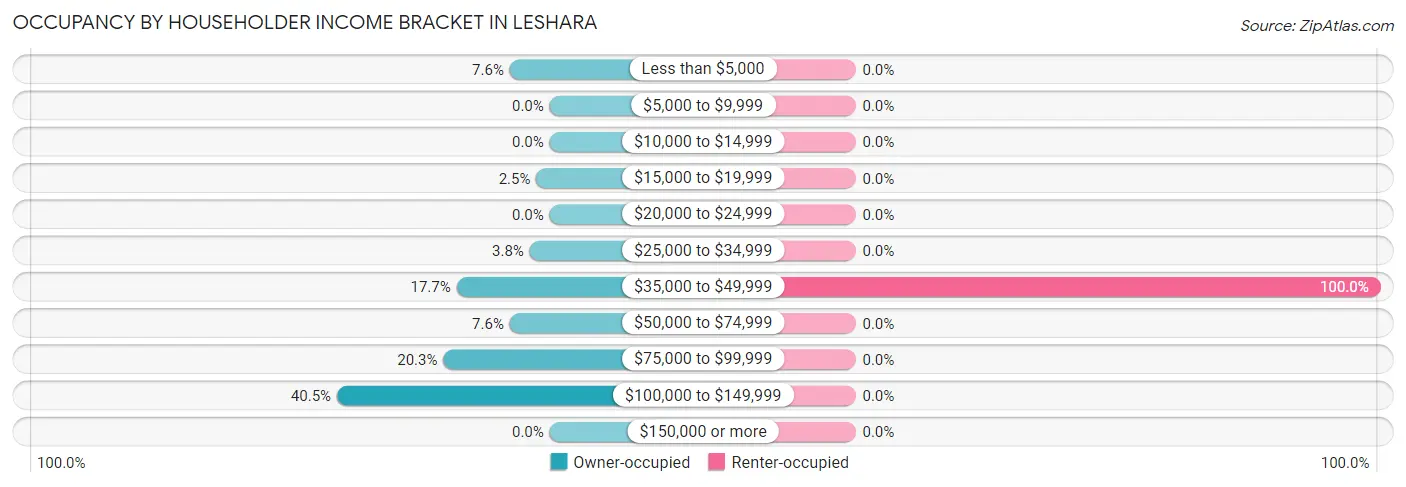
| Income Bracket | Owner-occupied | Renter-occupied |
| Less than $5,000 | 6 (7.6%) | 0 (0.0%) |
| $5,000 to $9,999 | 0 (0.0%) | 0 (0.0%) |
| $10,000 to $14,999 | 0 (0.0%) | 0 (0.0%) |
| $15,000 to $19,999 | 2 (2.5%) | 0 (0.0%) |
| $20,000 to $24,999 | 0 (0.0%) | 0 (0.0%) |
| $25,000 to $34,999 | 3 (3.8%) | 0 (0.0%) |
| $35,000 to $49,999 | 14 (17.7%) | 2 (100.0%) |
| $50,000 to $74,999 | 6 (7.6%) | 0 (0.0%) |
| $75,000 to $99,999 | 16 (20.3%) | 0 (0.0%) |
| $100,000 to $149,999 | 32 (40.5%) | 0 (0.0%) |
| $150,000 or more | 0 (0.0%) | 0 (0.0%) |
| Total | 79 (100.0%) | 2 (100.0%) |
Monthly Housing Cost Tiers in Leshara
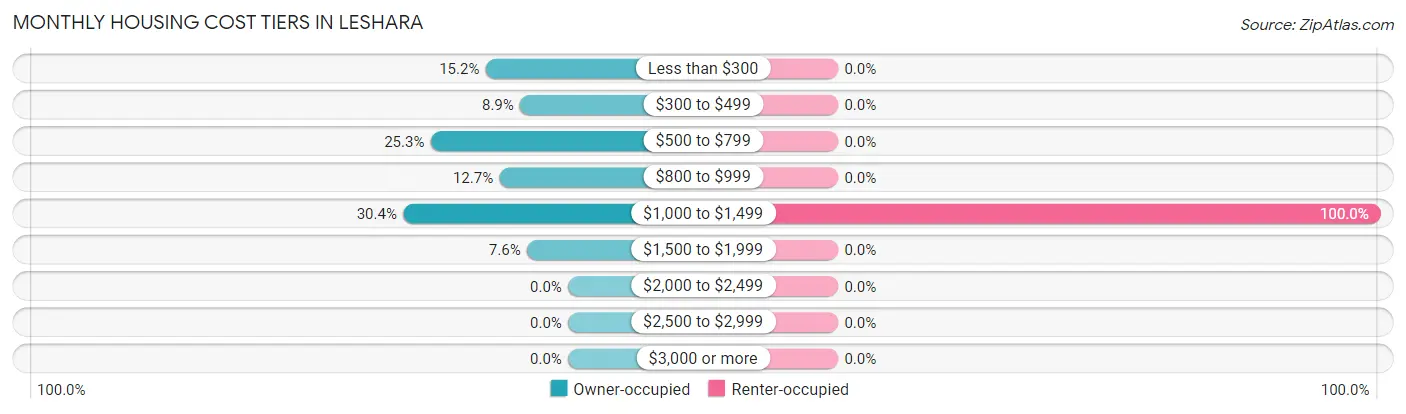
| Monthly Cost | Owner-occupied | Renter-occupied |
| Less than $300 | 12 (15.2%) | 0 (0.0%) |
| $300 to $499 | 7 (8.9%) | 0 (0.0%) |
| $500 to $799 | 20 (25.3%) | 0 (0.0%) |
| $800 to $999 | 10 (12.7%) | 0 (0.0%) |
| $1,000 to $1,499 | 24 (30.4%) | 2 (100.0%) |
| $1,500 to $1,999 | 6 (7.6%) | 0 (0.0%) |
| $2,000 to $2,499 | 0 (0.0%) | 0 (0.0%) |
| $2,500 to $2,999 | 0 (0.0%) | 0 (0.0%) |
| $3,000 or more | 0 (0.0%) | 0 (0.0%) |
| Total | 79 (100.0%) | 2 (100.0%) |
Physical Housing Characteristics in Leshara
Housing Structures in Leshara
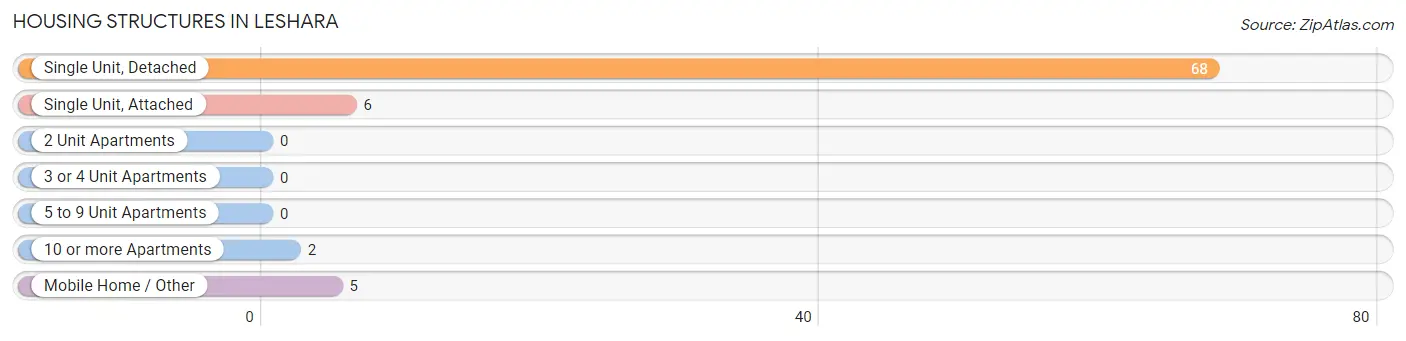
| Structure Type | # Housing Units | % Housing Units |
| Single Unit, Detached | 68 | 84.0% |
| Single Unit, Attached | 6 | 7.4% |
| 2 Unit Apartments | 0 | 0.0% |
| 3 or 4 Unit Apartments | 0 | 0.0% |
| 5 to 9 Unit Apartments | 0 | 0.0% |
| 10 or more Apartments | 2 | 2.5% |
| Mobile Home / Other | 5 | 6.2% |
| Total | 81 | 100.0% |
Housing Structures by Occupancy in Leshara
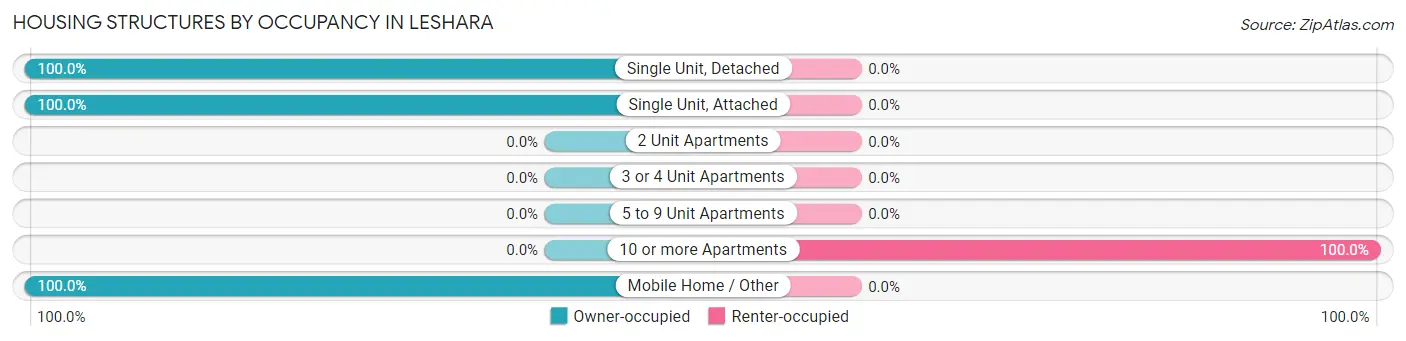
| Structure Type | Owner-occupied | Renter-occupied |
| Single Unit, Detached | 68 (100.0%) | 0 (0.0%) |
| Single Unit, Attached | 6 (100.0%) | 0 (0.0%) |
| 2 Unit Apartments | 0 (0.0%) | 0 (0.0%) |
| 3 or 4 Unit Apartments | 0 (0.0%) | 0 (0.0%) |
| 5 to 9 Unit Apartments | 0 (0.0%) | 0 (0.0%) |
| 10 or more Apartments | 0 (0.0%) | 2 (100.0%) |
| Mobile Home / Other | 5 (100.0%) | 0 (0.0%) |
| Total | 79 (97.5%) | 2 (2.5%) |
Housing Structures by Number of Rooms in Leshara
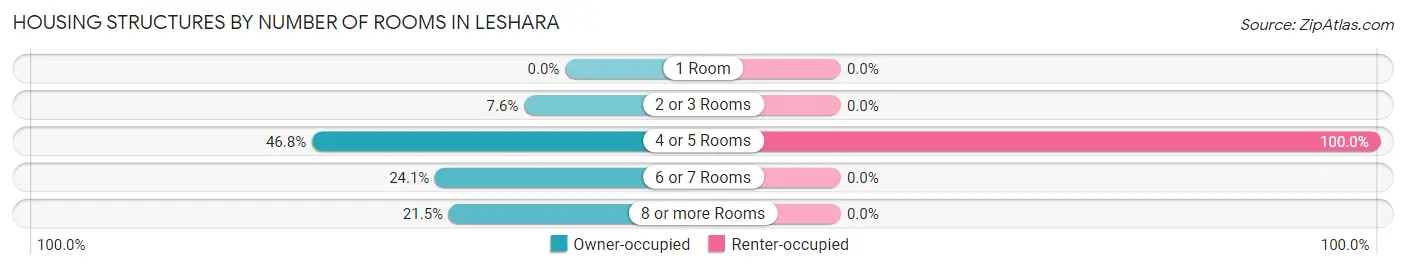
| Number of Rooms | Owner-occupied | Renter-occupied |
| 1 Room | 0 (0.0%) | 0 (0.0%) |
| 2 or 3 Rooms | 6 (7.6%) | 0 (0.0%) |
| 4 or 5 Rooms | 37 (46.8%) | 2 (100.0%) |
| 6 or 7 Rooms | 19 (24.0%) | 0 (0.0%) |
| 8 or more Rooms | 17 (21.5%) | 0 (0.0%) |
| Total | 79 (100.0%) | 2 (100.0%) |
Housing Structure by Heating Type in Leshara
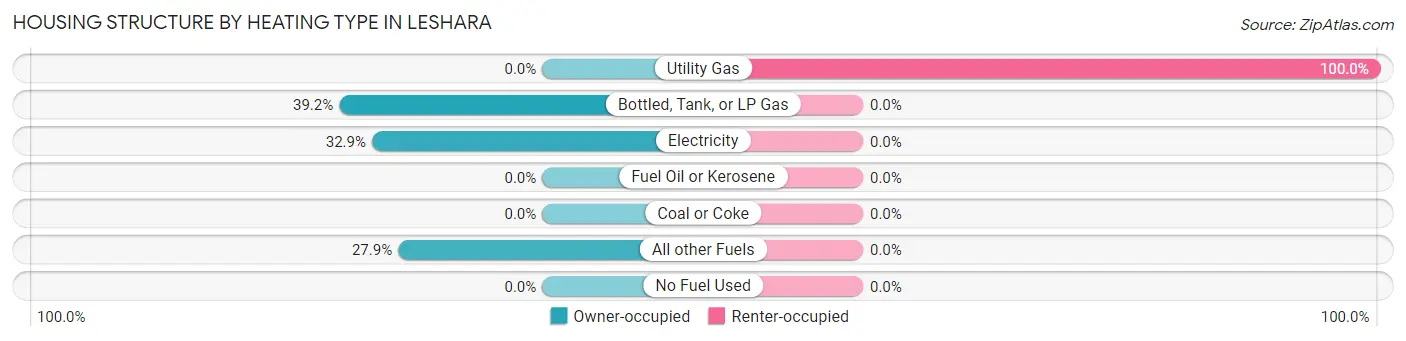
| Heating Type | Owner-occupied | Renter-occupied |
| Utility Gas | 0 (0.0%) | 2 (100.0%) |
| Bottled, Tank, or LP Gas | 31 (39.2%) | 0 (0.0%) |
| Electricity | 26 (32.9%) | 0 (0.0%) |
| Fuel Oil or Kerosene | 0 (0.0%) | 0 (0.0%) |
| Coal or Coke | 0 (0.0%) | 0 (0.0%) |
| All other Fuels | 22 (27.9%) | 0 (0.0%) |
| No Fuel Used | 0 (0.0%) | 0 (0.0%) |
| Total | 79 (100.0%) | 2 (100.0%) |
Household Vehicle Usage in Leshara
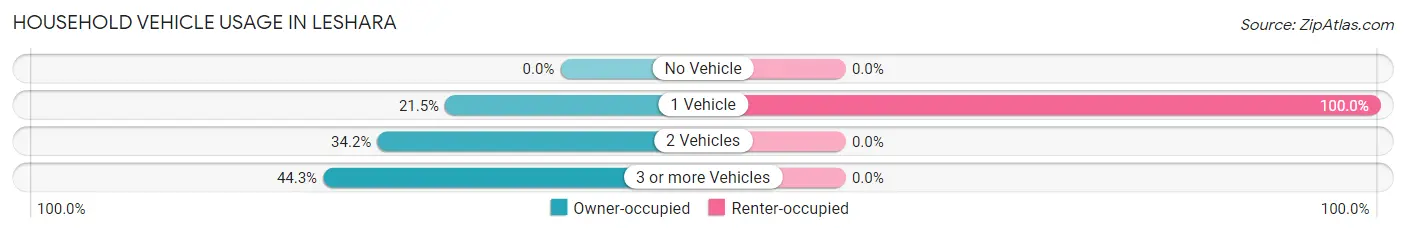
| Vehicles per Household | Owner-occupied | Renter-occupied |
| No Vehicle | 0 (0.0%) | 0 (0.0%) |
| 1 Vehicle | 17 (21.5%) | 2 (100.0%) |
| 2 Vehicles | 27 (34.2%) | 0 (0.0%) |
| 3 or more Vehicles | 35 (44.3%) | 0 (0.0%) |
| Total | 79 (100.0%) | 2 (100.0%) |
Real Estate & Mortgages in Leshara
Real Estate and Mortgage Overview in Leshara
| Characteristic | Without Mortgage | With Mortgage |
| Housing Units | 39 | 40 |
| Median Property Value | - | - |
| Median Household Income | $108,438 | $0 |
| Monthly Housing Costs | $517 | $0 |
| Real Estate Taxes | $2,600 | $0 |
Property Value by Mortgage Status in Leshara
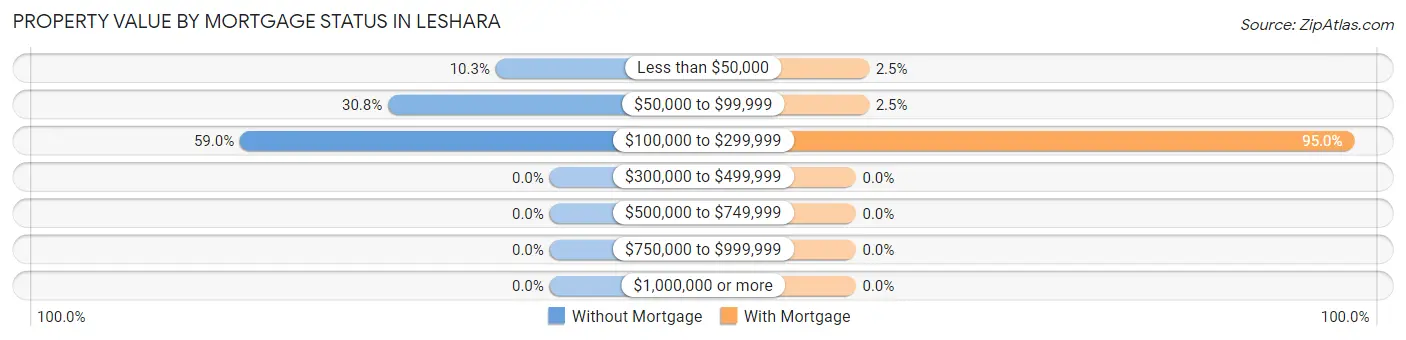
| Property Value | Without Mortgage | With Mortgage |
| Less than $50,000 | 4 (10.3%) | 1 (2.5%) |
| $50,000 to $99,999 | 12 (30.8%) | 1 (2.5%) |
| $100,000 to $299,999 | 23 (59.0%) | 38 (95.0%) |
| $300,000 to $499,999 | 0 (0.0%) | 0 (0.0%) |
| $500,000 to $749,999 | 0 (0.0%) | 0 (0.0%) |
| $750,000 to $999,999 | 0 (0.0%) | 0 (0.0%) |
| $1,000,000 or more | 0 (0.0%) | 0 (0.0%) |
| Total | 39 (100.0%) | 40 (100.0%) |
Household Income by Mortgage Status in Leshara
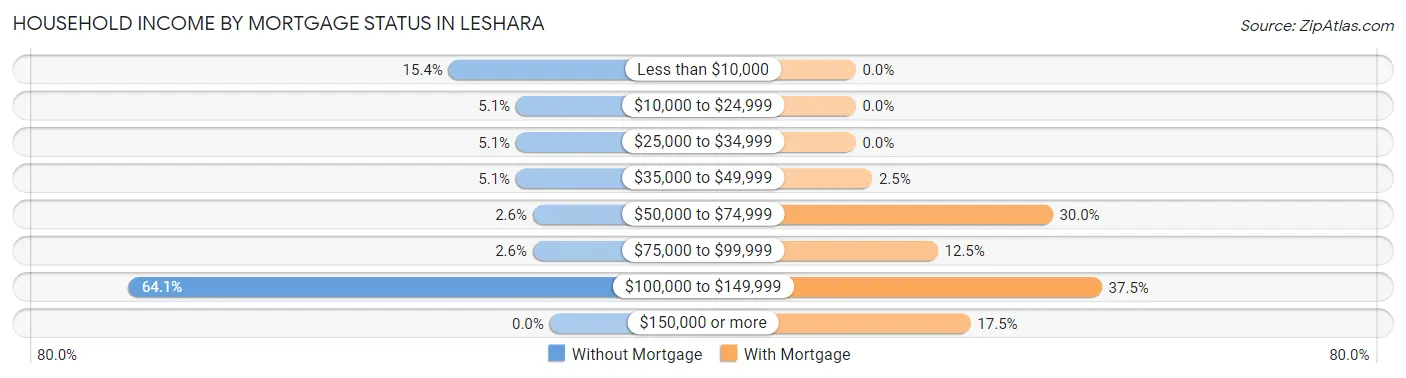
| Household Income | Without Mortgage | With Mortgage |
| Less than $10,000 | 6 (15.4%) | 0 (0.0%) |
| $10,000 to $24,999 | 2 (5.1%) | 0 (0.0%) |
| $25,000 to $34,999 | 2 (5.1%) | 0 (0.0%) |
| $35,000 to $49,999 | 2 (5.1%) | 1 (2.5%) |
| $50,000 to $74,999 | 1 (2.6%) | 12 (30.0%) |
| $75,000 to $99,999 | 1 (2.6%) | 5 (12.5%) |
| $100,000 to $149,999 | 25 (64.1%) | 15 (37.5%) |
| $150,000 or more | 0 (0.0%) | 7 (17.5%) |
| Total | 39 (100.0%) | 40 (100.0%) |
Property Value to Household Income Ratio in Leshara
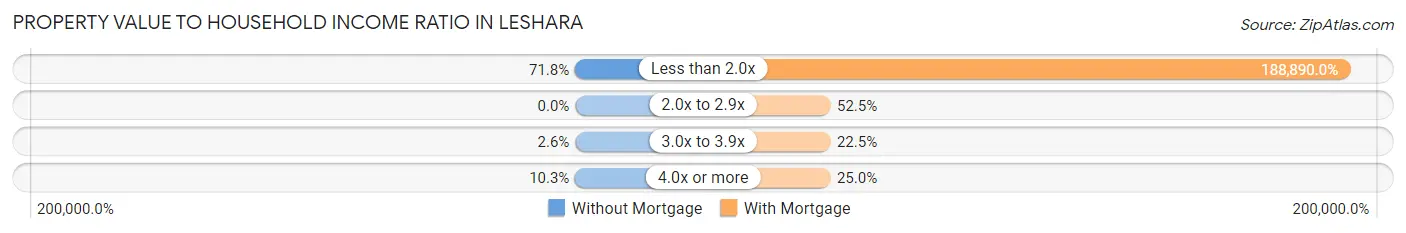
| Value-to-Income Ratio | Without Mortgage | With Mortgage |
| Less than 2.0x | 28 (71.8%) | 75,556 (188,890.0%) |
| 2.0x to 2.9x | 0 (0.0%) | 21 (52.5%) |
| 3.0x to 3.9x | 1 (2.6%) | 9 (22.5%) |
| 4.0x or more | 4 (10.3%) | 10 (25.0%) |
| Total | 39 (100.0%) | 40 (100.0%) |
Real Estate Taxes by Mortgage Status in Leshara
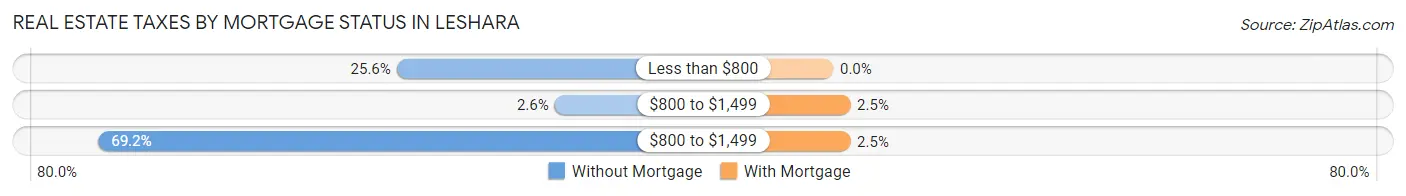
| Property Taxes | Without Mortgage | With Mortgage |
| Less than $800 | 10 (25.6%) | 0 (0.0%) |
| $800 to $1,499 | 1 (2.6%) | 1 (2.5%) |
| $800 to $1,499 | 27 (69.2%) | 1 (2.5%) |
| Total | 39 (100.0%) | 40 (100.0%) |
Health & Disability in Leshara
Health Insurance Coverage by Age in Leshara
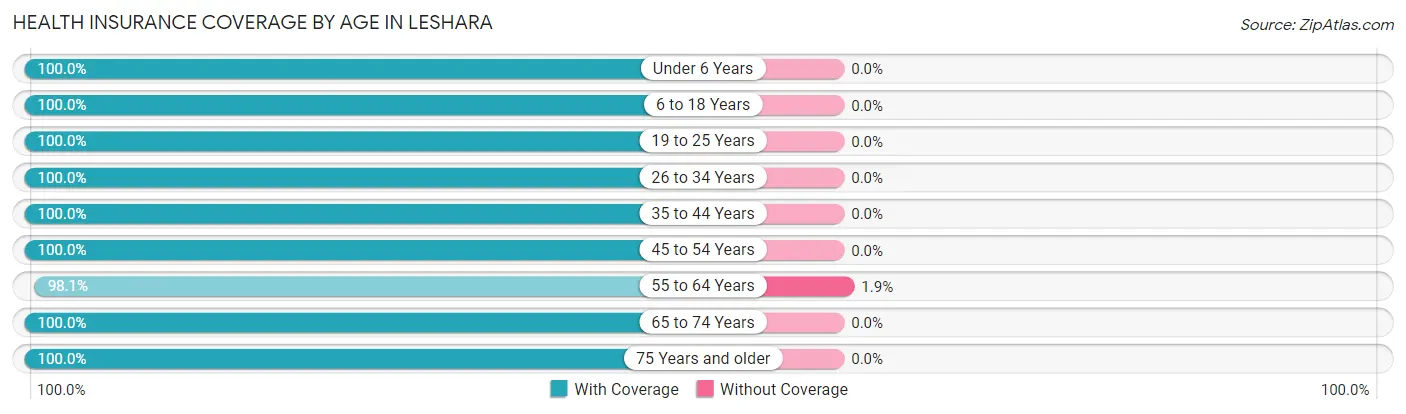
| Age Bracket | With Coverage | Without Coverage |
| Under 6 Years | 3 (100.0%) | 0 (0.0%) |
| 6 to 18 Years | 15 (100.0%) | 0 (0.0%) |
| 19 to 25 Years | 16 (100.0%) | 0 (0.0%) |
| 26 to 34 Years | 4 (100.0%) | 0 (0.0%) |
| 35 to 44 Years | 17 (100.0%) | 0 (0.0%) |
| 45 to 54 Years | 31 (100.0%) | 0 (0.0%) |
| 55 to 64 Years | 52 (98.1%) | 1 (1.9%) |
| 65 to 74 Years | 5 (100.0%) | 0 (0.0%) |
| 75 Years and older | 4 (100.0%) | 0 (0.0%) |
| Total | 147 (99.3%) | 1 (0.7%) |
Health Insurance Coverage by Citizenship Status in Leshara
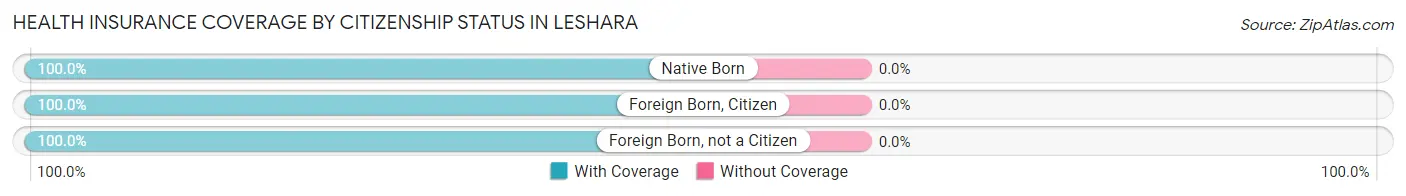
| Citizenship Status | With Coverage | Without Coverage |
| Native Born | 3 (100.0%) | 0 (0.0%) |
| Foreign Born, Citizen | 15 (100.0%) | 0 (0.0%) |
| Foreign Born, not a Citizen | 16 (100.0%) | 0 (0.0%) |
Health Insurance Coverage by Household Income in Leshara
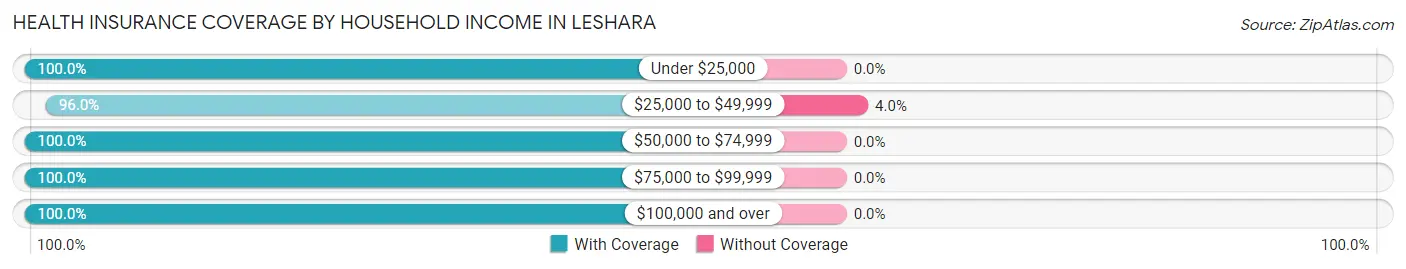
| Household Income | With Coverage | Without Coverage |
| Under $25,000 | 8 (100.0%) | 0 (0.0%) |
| $25,000 to $49,999 | 24 (96.0%) | 1 (4.0%) |
| $50,000 to $74,999 | 12 (100.0%) | 0 (0.0%) |
| $75,000 to $99,999 | 32 (100.0%) | 0 (0.0%) |
| $100,000 and over | 71 (100.0%) | 0 (0.0%) |
Public vs Private Health Insurance Coverage by Age in Leshara
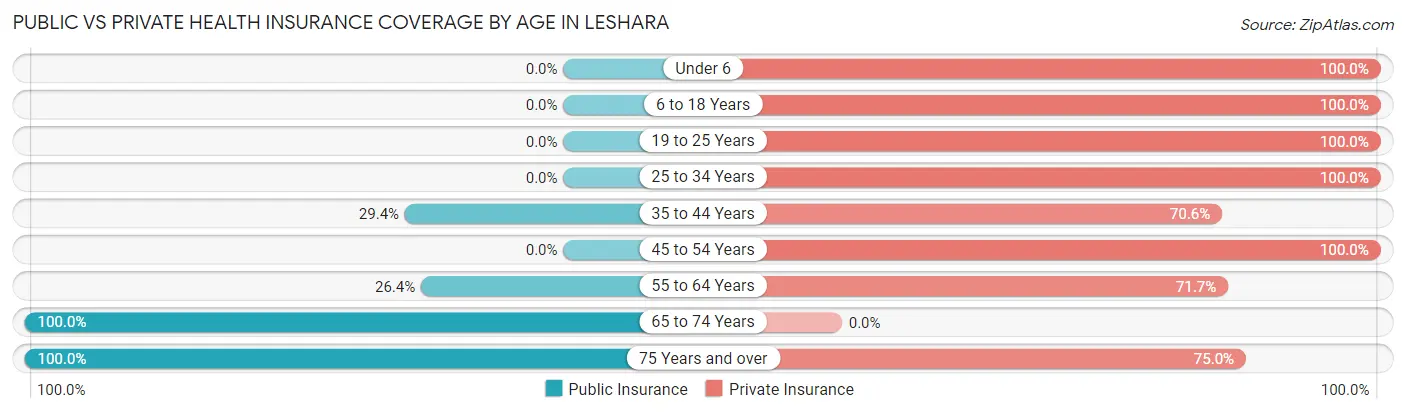
| Age Bracket | Public Insurance | Private Insurance |
| Under 6 | 0 (0.0%) | 3 (100.0%) |
| 6 to 18 Years | 0 (0.0%) | 15 (100.0%) |
| 19 to 25 Years | 0 (0.0%) | 16 (100.0%) |
| 25 to 34 Years | 0 (0.0%) | 4 (100.0%) |
| 35 to 44 Years | 5 (29.4%) | 12 (70.6%) |
| 45 to 54 Years | 0 (0.0%) | 31 (100.0%) |
| 55 to 64 Years | 14 (26.4%) | 38 (71.7%) |
| 65 to 74 Years | 5 (100.0%) | 0 (0.0%) |
| 75 Years and over | 4 (100.0%) | 3 (75.0%) |
| Total | 28 (18.9%) | 122 (82.4%) |
Disability Status by Sex by Age in Leshara
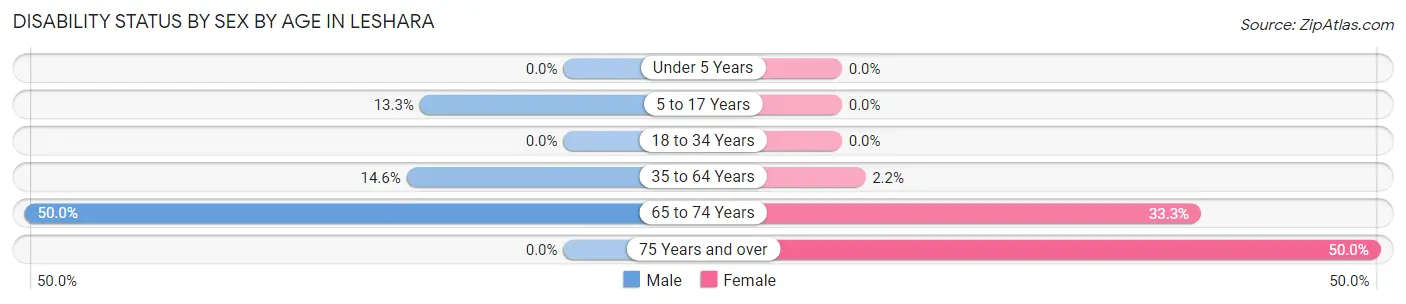
| Age Bracket | Male | Female |
| Under 5 Years | 0 (0.0%) | 0 (0.0%) |
| 5 to 17 Years | 2 (13.3%) | 0 (0.0%) |
| 18 to 34 Years | 0 (0.0%) | 0 (0.0%) |
| 35 to 64 Years | 8 (14.5%) | 1 (2.2%) |
| 65 to 74 Years | 1 (50.0%) | 1 (33.3%) |
| 75 Years and over | 0 (0.0%) | 1 (50.0%) |
Disability Class by Sex by Age in Leshara
Disability Class: Hearing Difficulty
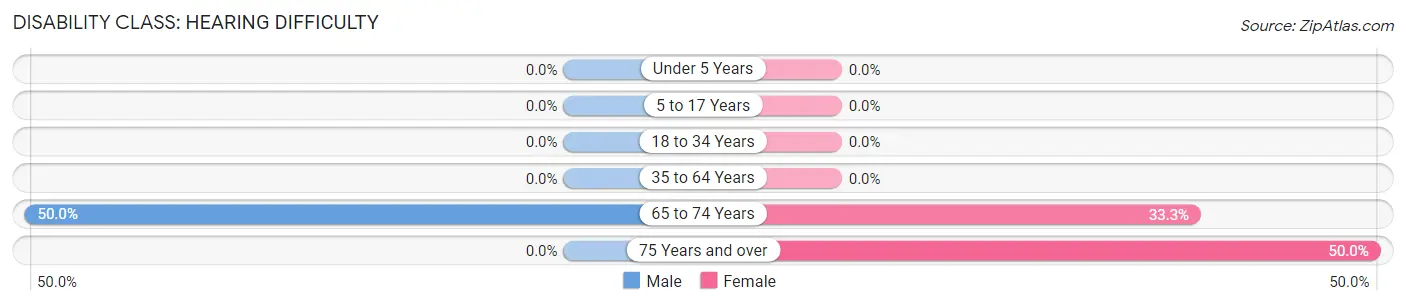
| Age Bracket | Male | Female |
| Under 5 Years | 0 (0.0%) | 0 (0.0%) |
| 5 to 17 Years | 0 (0.0%) | 0 (0.0%) |
| 18 to 34 Years | 0 (0.0%) | 0 (0.0%) |
| 35 to 64 Years | 0 (0.0%) | 0 (0.0%) |
| 65 to 74 Years | 1 (50.0%) | 1 (33.3%) |
| 75 Years and over | 0 (0.0%) | 1 (50.0%) |
Disability Class: Vision Difficulty
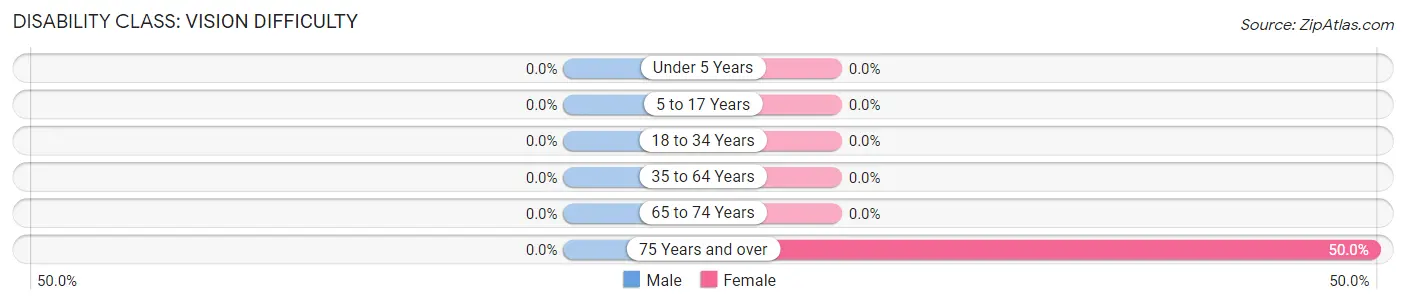
| Age Bracket | Male | Female |
| Under 5 Years | 0 (0.0%) | 0 (0.0%) |
| 5 to 17 Years | 0 (0.0%) | 0 (0.0%) |
| 18 to 34 Years | 0 (0.0%) | 0 (0.0%) |
| 35 to 64 Years | 0 (0.0%) | 0 (0.0%) |
| 65 to 74 Years | 0 (0.0%) | 0 (0.0%) |
| 75 Years and over | 0 (0.0%) | 1 (50.0%) |
Disability Class: Cognitive Difficulty
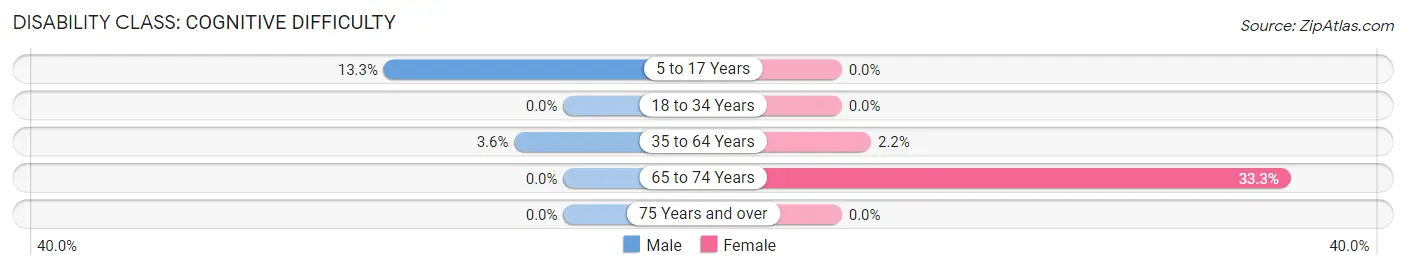
| Age Bracket | Male | Female |
| 5 to 17 Years | 2 (13.3%) | 0 (0.0%) |
| 18 to 34 Years | 0 (0.0%) | 0 (0.0%) |
| 35 to 64 Years | 2 (3.6%) | 1 (2.2%) |
| 65 to 74 Years | 0 (0.0%) | 1 (33.3%) |
| 75 Years and over | 0 (0.0%) | 0 (0.0%) |
Disability Class: Ambulatory Difficulty
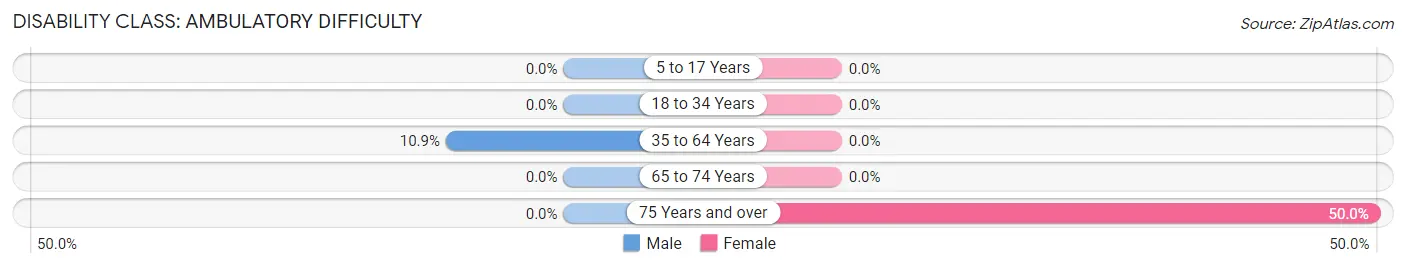
| Age Bracket | Male | Female |
| 5 to 17 Years | 0 (0.0%) | 0 (0.0%) |
| 18 to 34 Years | 0 (0.0%) | 0 (0.0%) |
| 35 to 64 Years | 6 (10.9%) | 0 (0.0%) |
| 65 to 74 Years | 0 (0.0%) | 0 (0.0%) |
| 75 Years and over | 0 (0.0%) | 1 (50.0%) |
Disability Class: Self-Care Difficulty
| Age Bracket | Male | Female |
| 5 to 17 Years | 0 (0.0%) | 0 (0.0%) |
| 18 to 34 Years | 0 (0.0%) | 0 (0.0%) |
| 35 to 64 Years | 0 (0.0%) | 0 (0.0%) |
| 65 to 74 Years | 0 (0.0%) | 0 (0.0%) |
| 75 Years and over | 0 (0.0%) | 0 (0.0%) |
Technology Access in Leshara
Computing Device Access in Leshara
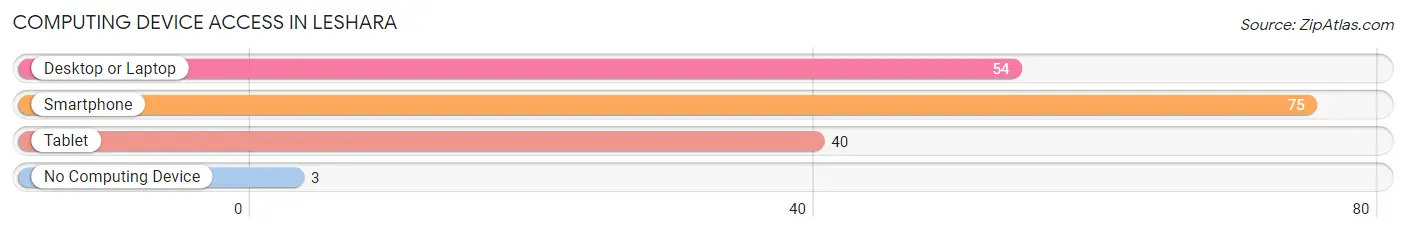
| Device Type | # Households | % Households |
| Desktop or Laptop | 54 | 66.7% |
| Smartphone | 75 | 92.6% |
| Tablet | 40 | 49.4% |
| No Computing Device | 3 | 3.7% |
| Total | 81 | 100.0% |
Internet Access in Leshara
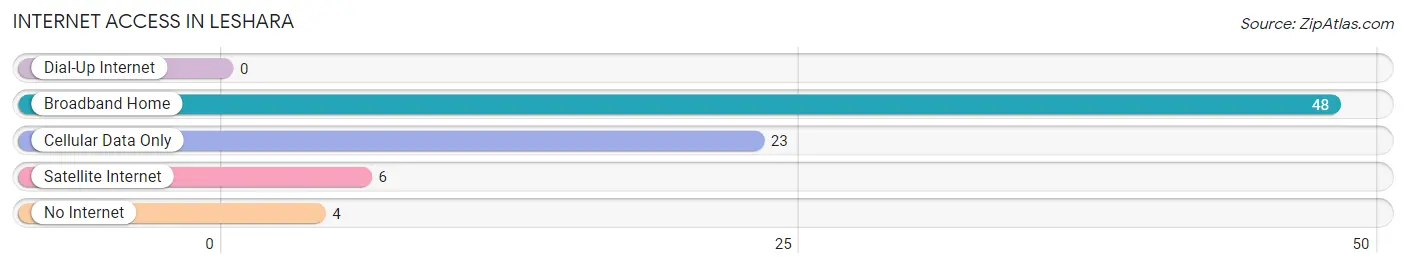
| Internet Type | # Households | % Households |
| Dial-Up Internet | 0 | 0.0% |
| Broadband Home | 48 | 59.3% |
| Cellular Data Only | 23 | 28.4% |
| Satellite Internet | 6 | 7.4% |
| No Internet | 4 | 4.9% |
| Total | 81 | 100.0% |
Leshara Summary
Leshara is a small unincorporated community located in Saunders County, Nebraska. It is situated along the Platte River, approximately 20 miles northwest of Omaha. The population of Leshara was estimated to be around 200 people in 2020.
Geography
Leshara is located in the eastern part of Saunders County, Nebraska, along the Platte River. It is situated at an elevation of 1,072 feet above sea level. The town is located in the Central Lowland region of the United States, and is part of the Great Plains. The climate in Leshara is characterized by hot summers and cold winters. The average annual temperature is around 50 degrees Fahrenheit, with temperatures ranging from the low 30s in the winter to the mid-80s in the summer.
The town is surrounded by agricultural land, with corn and soybeans being the primary crops. The Platte River provides a source of water for the area, and is also used for recreational activities such as fishing and boating.
History
Leshara was founded in 1871 by a group of settlers from Iowa. The town was named after the nearby Leshara Creek, which was named after a Native American chief. The town was originally a farming community, and the main crops were corn and wheat.
In the early 1900s, the town began to grow and develop. A post office was established in 1906, and a school was built in 1910. The town also had a general store, a blacksmith shop, and a few other businesses.
In the 1950s, the town began to decline as many of the residents moved away. The post office closed in 1965, and the school closed in 1971. The town has remained relatively small since then, with a population of around 200 people in 2020.
Economy
The economy of Leshara is largely based on agriculture. Corn and soybeans are the primary crops, and the town also has a few small businesses. The town is also home to a few small manufacturing companies, such as a furniture factory and a plastics factory.
Demographics
The population of Leshara was estimated to be around 200 people in 2020. The racial makeup of the town is predominantly white, with a small percentage of African Americans and Native Americans. The median household income is around $50,000, and the median home value is around $150,000.
Conclusion
Leshara is a small unincorporated community located in Saunders County, Nebraska. It is situated along the Platte River, approximately 20 miles northwest of Omaha. The population of Leshara was estimated to be around 200 people in 2020. The town is largely agricultural, with corn and soybeans being the primary crops. The economy is also supported by a few small businesses and manufacturing companies. The racial makeup of the town is predominantly white, with a small percentage of African Americans and Native Americans. The median household income is around $50,000, and the median home value is around $150,000.
Common Questions
What is Per Capita Income in Leshara?
Per Capita income in Leshara is $42,878.
What is the Median Family Income in Leshara?
Median Family Income in Leshara is $107,857.
What is the Median Household income in Leshara?
Median Household Income in Leshara is $76,875.
What is Income or Wage Gap in Leshara?
Income or Wage Gap in Leshara is 52.6%.
Women in Leshara earn 47.4 cents for every dollar earned by a man.
What is Inequality or Gini Index in Leshara?
Inequality or Gini Index in Leshara is 0.30.
What is the Total Population of Leshara?
Total Population of Leshara is 148.
What is the Total Male Population of Leshara?
Total Male Population of Leshara is 93.
What is the Total Female Population of Leshara?
Total Female Population of Leshara is 55.
What is the Ratio of Males per 100 Females in Leshara?
There are 169.09 Males per 100 Females in Leshara.
What is the Ratio of Females per 100 Males in Leshara?
There are 59.14 Females per 100 Males in Leshara.
What is the Median Population Age in Leshara?
Median Population Age in Leshara is 50.8 Years.
What is the Average Family Size in Leshara
Average Family Size in Leshara is 2.1 People.
What is the Average Household Size in Leshara
Average Household Size in Leshara is 1.8 People.
How Large is the Labor Force in Leshara?
There are 121 People in the Labor Forcein in Leshara.
What is the Percentage of People in the Labor Force in Leshara?
84.6% of People are in the Labor Force in Leshara.