Center, NE Map & Demographics
Center Map
Center Overview
$13,442
PER CAPITA INCOME
$41,250
AVG FAMILY INCOME
$46,250
AVG HOUSEHOLD INCOME
0.28
INEQUALITY / GINI INDEX
199
TOTAL POPULATION
95
MALE POPULATION
104
FEMALE POPULATION
91.35
MALES / 100 FEMALES
109.47
FEMALES / 100 MALES
21.9
MEDIAN AGE
4.2
AVG FAMILY SIZE
4.3
AVG HOUSEHOLD SIZE
112
LABOR FORCE [ PEOPLE ]
70.9%
PERCENT IN LABOR FORCE
16.1%
UNEMPLOYMENT RATE
Center Zip Codes
Center Area Codes
Income in Center
Income Overview in Center
Per Capita Income in Center is $13,442, while median incomes of families and households are $41,250 and $46,250 respectively.
| Characteristic | Number | Measure |
| Per Capita Income | 199 | $13,442 |
| Median Family Income | 42 | $41,250 |
| Mean Family Income | 42 | $47,940 |
| Median Household Income | 44 | $46,250 |
| Mean Household Income | 44 | $48,759 |
| Income Deficit | 42 | $0 |
| Wage / Income Gap (%) | 199 | 0.00% |
| Wage / Income Gap ($) | 199 | 100.00¢ per $1 |
| Gini / Inequality Index | 199 | 0.28 |
Earnings by Sex in Center
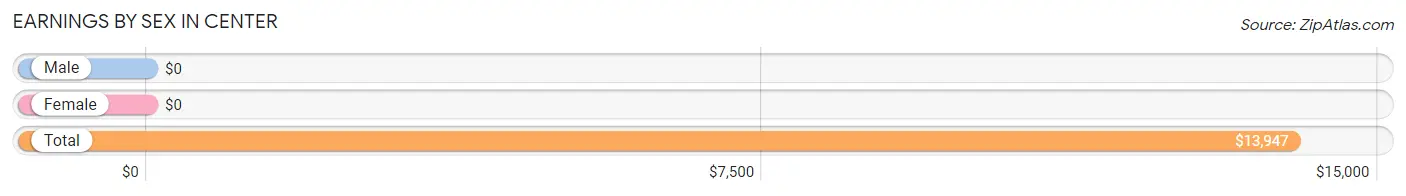
| Sex | Number | Average Earnings |
| Male | 64 (55.2%) | $0 |
| Female | 52 (44.8%) | $0 |
| Total | 116 (100.0%) | $13,947 |
Earnings by Sex by Income Bracket in Center
The most common earnings brackets in Center are $12,500 to $14,999 for men (19 | 29.7%) and $2,499 or less for women (13 | 25.0%).
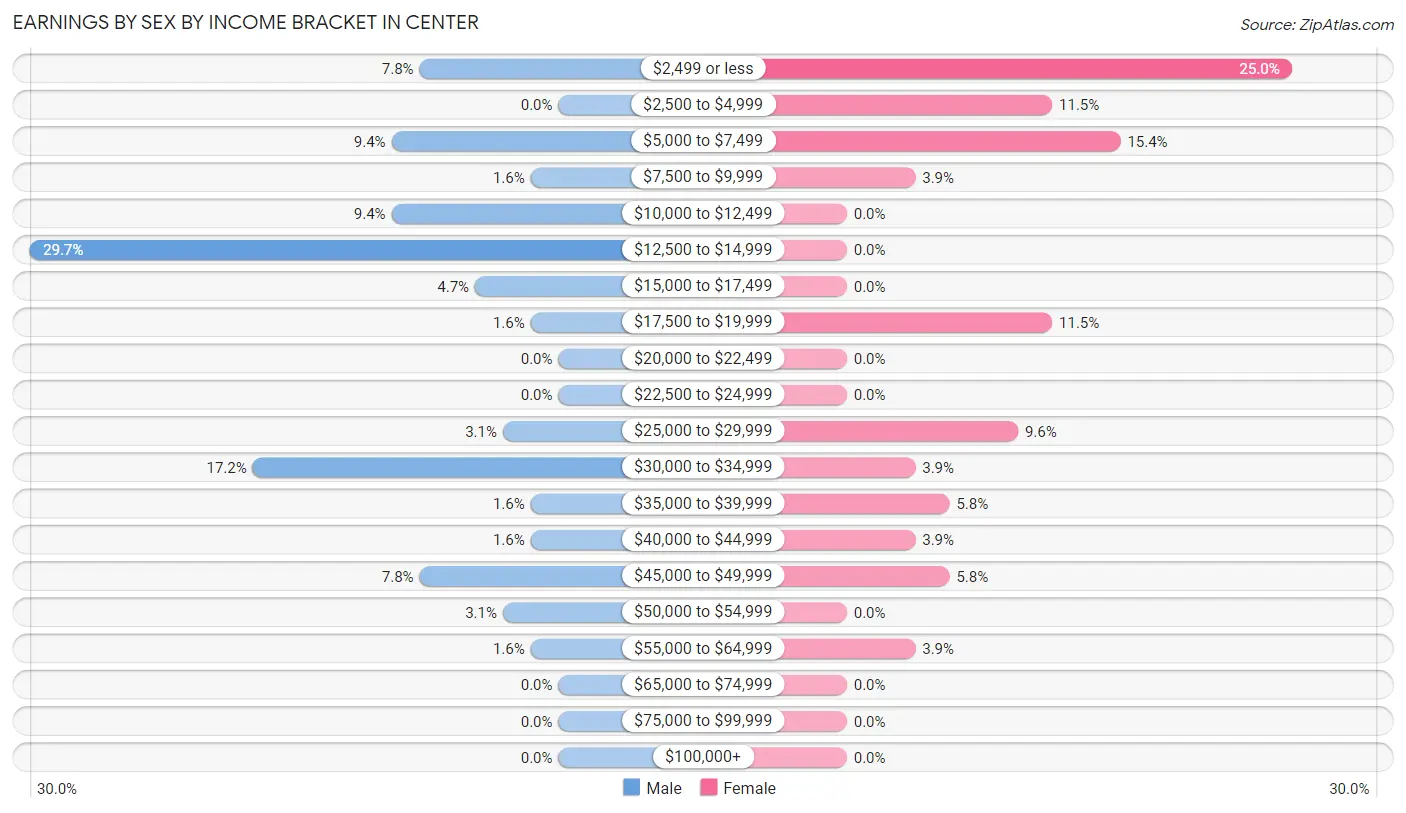
| Income | Male | Female |
| $2,499 or less | 5 (7.8%) | 13 (25.0%) |
| $2,500 to $4,999 | 0 (0.0%) | 6 (11.5%) |
| $5,000 to $7,499 | 6 (9.4%) | 8 (15.4%) |
| $7,500 to $9,999 | 1 (1.6%) | 2 (3.8%) |
| $10,000 to $12,499 | 6 (9.4%) | 0 (0.0%) |
| $12,500 to $14,999 | 19 (29.7%) | 0 (0.0%) |
| $15,000 to $17,499 | 3 (4.7%) | 0 (0.0%) |
| $17,500 to $19,999 | 1 (1.6%) | 6 (11.5%) |
| $20,000 to $22,499 | 0 (0.0%) | 0 (0.0%) |
| $22,500 to $24,999 | 0 (0.0%) | 0 (0.0%) |
| $25,000 to $29,999 | 2 (3.1%) | 5 (9.6%) |
| $30,000 to $34,999 | 11 (17.2%) | 2 (3.8%) |
| $35,000 to $39,999 | 1 (1.6%) | 3 (5.8%) |
| $40,000 to $44,999 | 1 (1.6%) | 2 (3.8%) |
| $45,000 to $49,999 | 5 (7.8%) | 3 (5.8%) |
| $50,000 to $54,999 | 2 (3.1%) | 0 (0.0%) |
| $55,000 to $64,999 | 1 (1.6%) | 2 (3.8%) |
| $65,000 to $74,999 | 0 (0.0%) | 0 (0.0%) |
| $75,000 to $99,999 | 0 (0.0%) | 0 (0.0%) |
| $100,000+ | 0 (0.0%) | 0 (0.0%) |
| Total | 64 (100.0%) | 52 (100.0%) |
Earnings by Sex by Educational Attainment in Center
Average earnings in Center are $12,292 for men and $18,958 for women, a difference of 35.2%. Men with an educational attainment of less than high school enjoy the highest average annual earnings of $2,499, while those with less than high school education earn the least with $2,499. Women with an educational attainment of college or associate's degree earn the most with the average annual earnings of $36,250, while those with college or associate's degree education have the smallest earnings of $36,250.
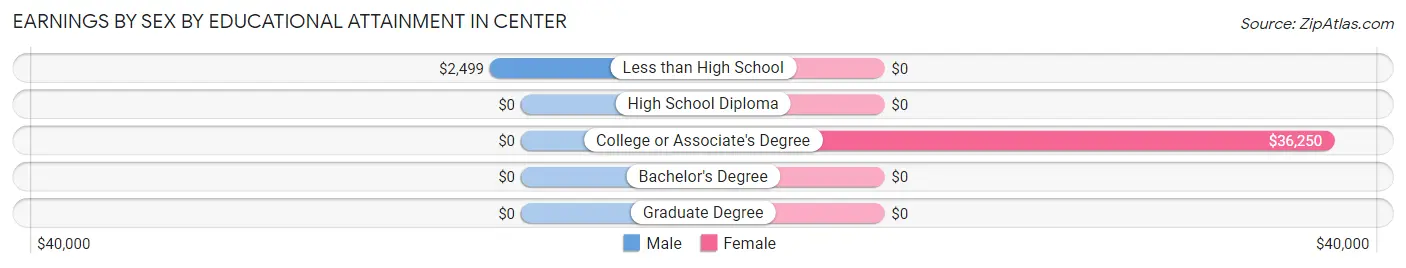
| Educational Attainment | Male Income | Female Income |
| Less than High School | $2,499 | $0 |
| High School Diploma | - | - |
| College or Associate's Degree | - | - |
| Bachelor's Degree | - | - |
| Graduate Degree | - | - |
| Total | $12,292 | $18,958 |
Family Income in Center
Family Income Brackets in Center
According to the Center family income data, there are 15 families falling into the $25,000 to $34,999 income range, which is the most common income bracket and makes up 35.7% of all families.
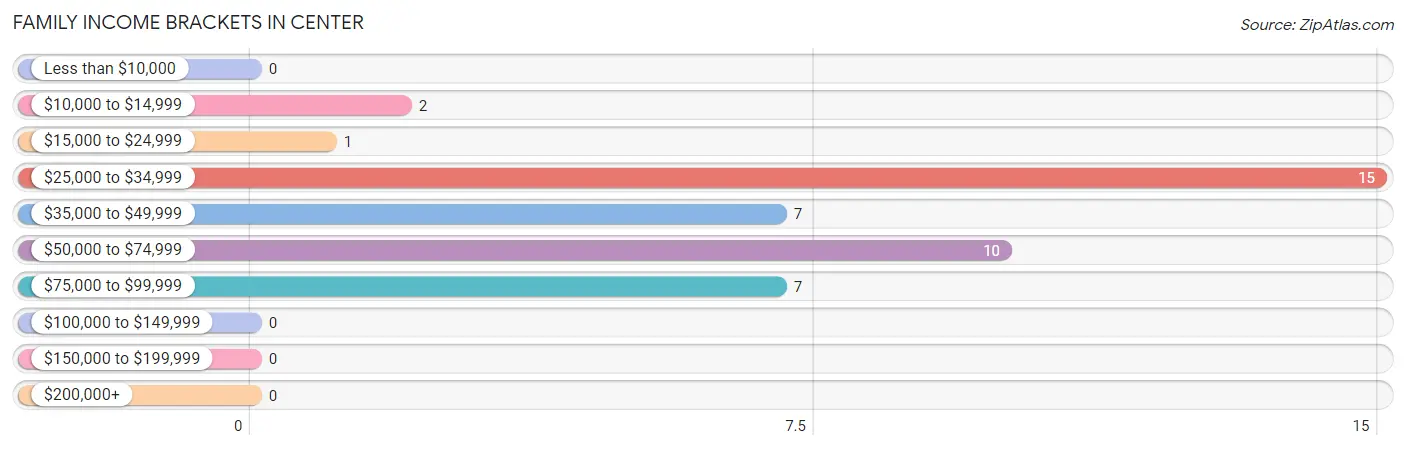
| Income Bracket | # Families | % Families |
| Less than $10,000 | 0 | 0.0% |
| $10,000 to $14,999 | 2 | 4.8% |
| $15,000 to $24,999 | 1 | 2.4% |
| $25,000 to $34,999 | 15 | 35.7% |
| $35,000 to $49,999 | 7 | 16.7% |
| $50,000 to $74,999 | 10 | 23.8% |
| $75,000 to $99,999 | 7 | 16.7% |
| $100,000 to $149,999 | 0 | 0.0% |
| $150,000 to $199,999 | 0 | 0.0% |
| $200,000+ | 0 | 0.0% |
Family Income by Famaliy Size in Center
2-person families (15 | 35.7%) account for the highest median family income in Center with $60,417 per family, while 2-person families (15 | 35.7%) have the highest median income of $30,208 per family member.
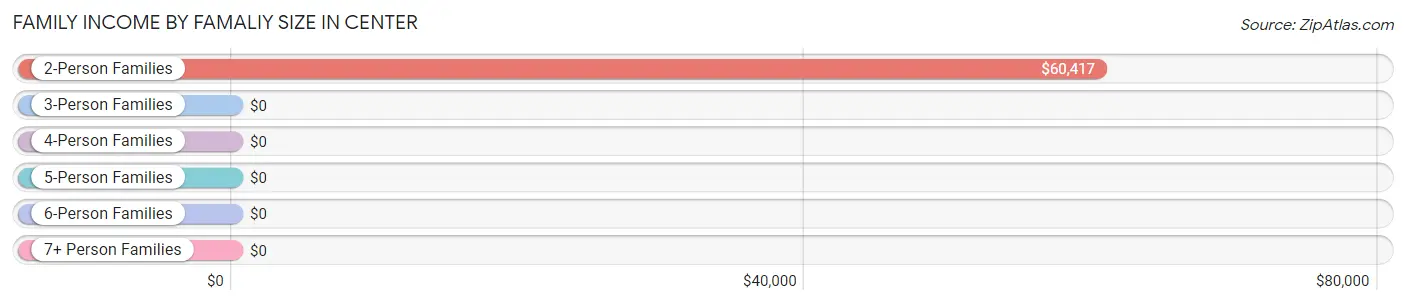
| Income Bracket | # Families | Median Income |
| 2-Person Families | 15 (35.7%) | $60,417 |
| 3-Person Families | 9 (21.4%) | $0 |
| 4-Person Families | 9 (21.4%) | $0 |
| 5-Person Families | 1 (2.4%) | $0 |
| 6-Person Families | 6 (14.3%) | $0 |
| 7+ Person Families | 2 (4.8%) | $0 |
| Total | 42 (100.0%) | $41,250 |
Family Income by Number of Earners in Center
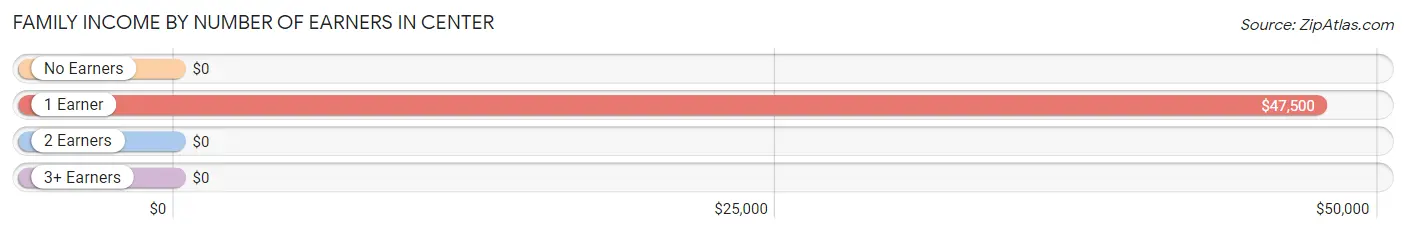
| Number of Earners | # Families | Median Income |
| No Earners | 1 (2.4%) | $0 |
| 1 Earner | 10 (23.8%) | $47,500 |
| 2 Earners | 25 (59.5%) | $0 |
| 3+ Earners | 6 (14.3%) | $0 |
| Total | 42 (100.0%) | $41,250 |
Household Income in Center
Household Income Brackets in Center
With 15 households falling in the category, the $25,000 to $34,999 income range is the most frequent in Center, accounting for 34.1% of all households.
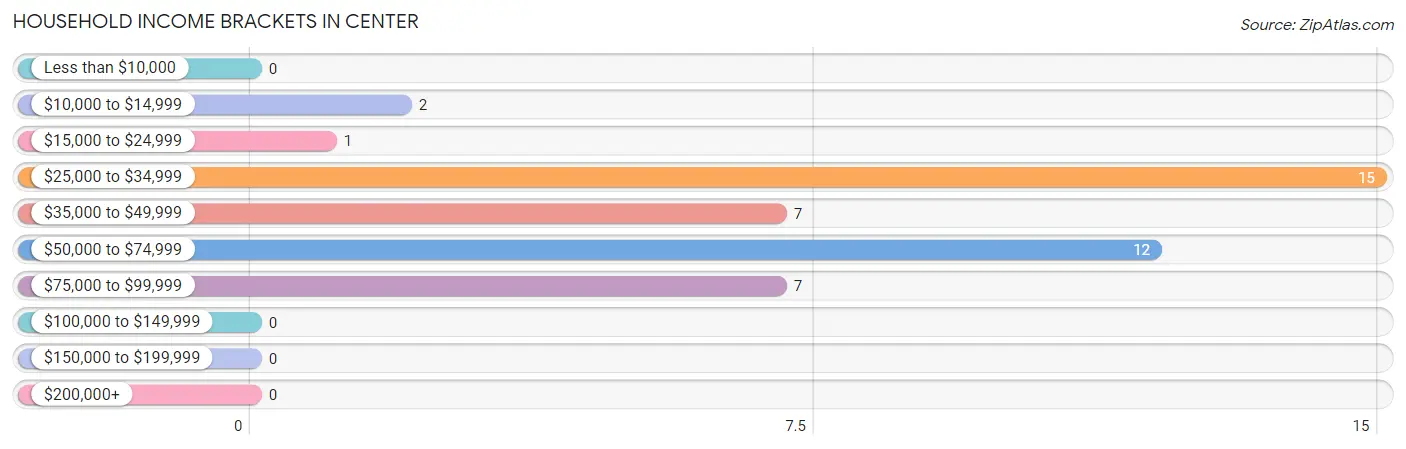
| Income Bracket | # Households | % Households |
| Less than $10,000 | 0 | 0.0% |
| $10,000 to $14,999 | 2 | 4.5% |
| $15,000 to $24,999 | 1 | 2.3% |
| $25,000 to $34,999 | 15 | 34.1% |
| $35,000 to $49,999 | 7 | 15.9% |
| $50,000 to $74,999 | 12 | 27.3% |
| $75,000 to $99,999 | 7 | 15.9% |
| $100,000 to $149,999 | 0 | 0.0% |
| $150,000 to $199,999 | 0 | 0.0% |
| $200,000+ | 0 | 0.0% |
Household Income by Householder Age in Center
The median household income in Center is $46,250, with the highest median household income of $53,125 found in the 45 to 64 years age bracket for the primary householder. A total of 13 households (29.5%) fall into this category. Meanwhile, the 15 to 24 years age bracket for the primary householder has the lowest median household income of $0, with 2 households (4.5%) in this group.
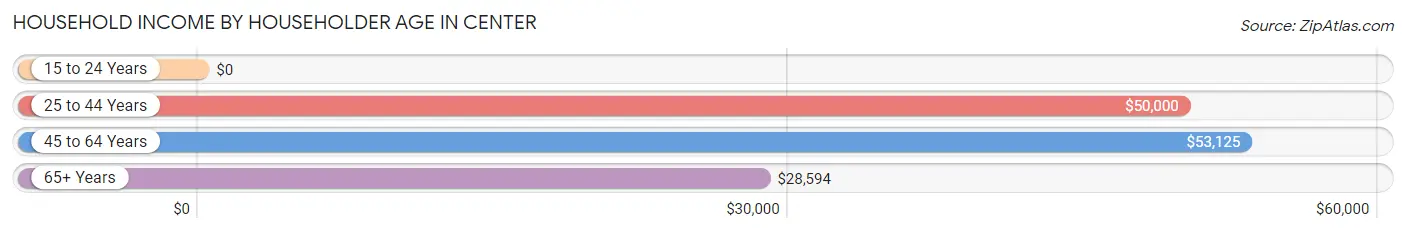
| Income Bracket | # Households | Median Income |
| 15 to 24 Years | 2 (4.5%) | $0 |
| 25 to 44 Years | 18 (40.9%) | $50,000 |
| 45 to 64 Years | 13 (29.5%) | $53,125 |
| 65+ Years | 11 (25.0%) | $28,594 |
| Total | 44 (100.0%) | $46,250 |
Poverty in Center
Income Below Poverty by Sex and Age in Center
With 52.3% poverty level for males and 59.8% for females among the residents of Center, 5 year old males and 12 to 14 year old females are the most vulnerable to poverty, with 2 males (100.0%) and 7 females (100.0%) in their respective age groups living below the poverty level.
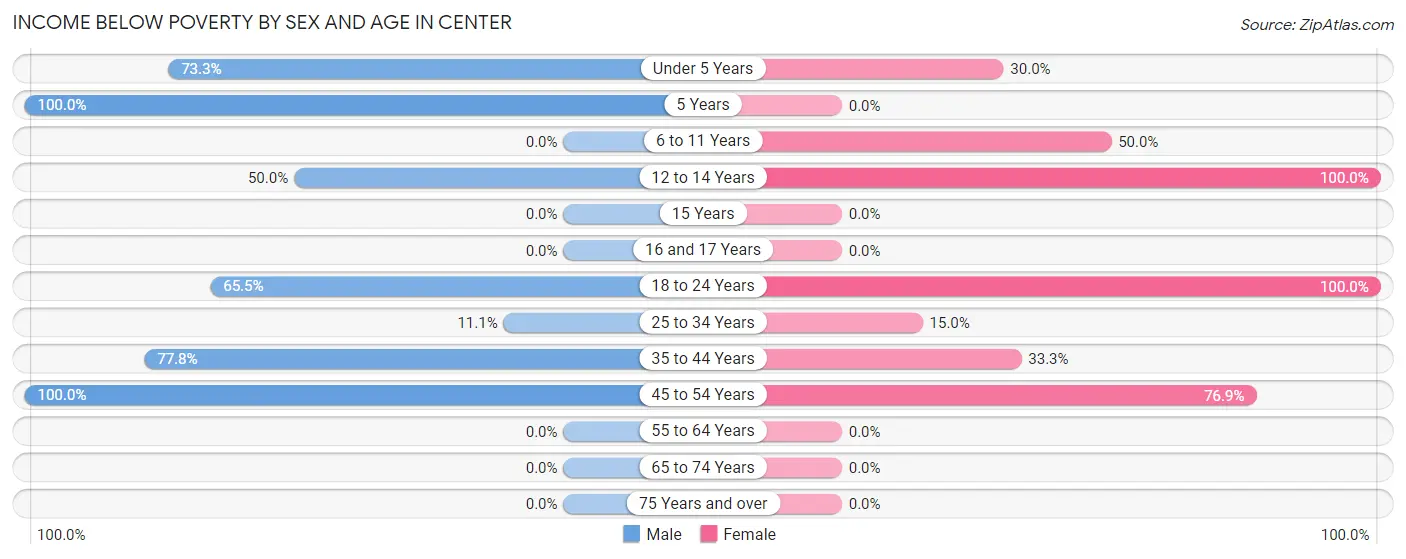
| Age Bracket | Male | Female |
| Under 5 Years | 11 (73.3%) | 3 (30.0%) |
| 5 Years | 2 (100.0%) | 0 (0.0%) |
| 6 to 11 Years | 0 (0.0%) | 2 (50.0%) |
| 12 to 14 Years | 1 (50.0%) | 7 (100.0%) |
| 15 Years | 0 (0.0%) | 0 (0.0%) |
| 16 and 17 Years | 0 (0.0%) | 0 (0.0%) |
| 18 to 24 Years | 19 (65.5%) | 34 (100.0%) |
| 25 to 34 Years | 1 (11.1%) | 3 (15.0%) |
| 35 to 44 Years | 7 (77.8%) | 2 (33.3%) |
| 45 to 54 Years | 5 (100.0%) | 10 (76.9%) |
| 55 to 64 Years | 0 (0.0%) | 0 (0.0%) |
| 65 to 74 Years | 0 (0.0%) | 0 (0.0%) |
| 75 Years and over | 0 (0.0%) | 0 (0.0%) |
| Total | 46 (52.3%) | 61 (59.8%) |
Income Above Poverty by Sex and Age in Center
According to the poverty statistics in Center, males aged 6 to 11 years and females aged 55 to 64 years are the age groups that are most secure financially, with 100.0% of males and 100.0% of females in these age groups living above the poverty line.
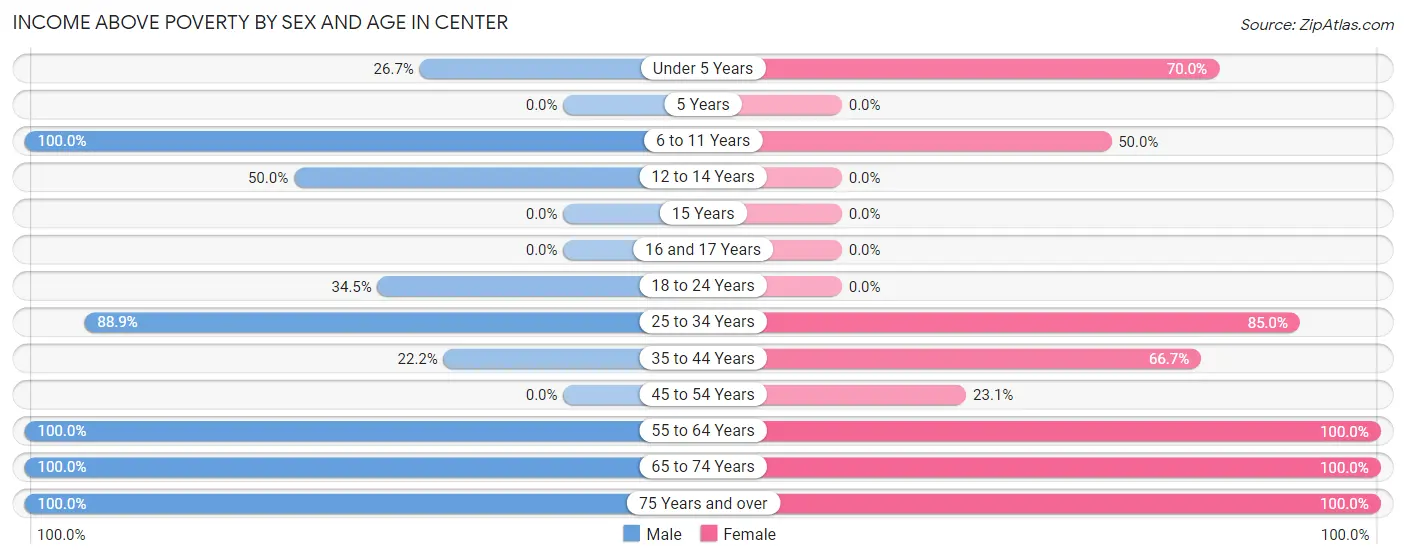
| Age Bracket | Male | Female |
| Under 5 Years | 4 (26.7%) | 7 (70.0%) |
| 5 Years | 0 (0.0%) | 0 (0.0%) |
| 6 to 11 Years | 1 (100.0%) | 2 (50.0%) |
| 12 to 14 Years | 1 (50.0%) | 0 (0.0%) |
| 15 Years | 0 (0.0%) | 0 (0.0%) |
| 16 and 17 Years | 0 (0.0%) | 0 (0.0%) |
| 18 to 24 Years | 10 (34.5%) | 0 (0.0%) |
| 25 to 34 Years | 8 (88.9%) | 17 (85.0%) |
| 35 to 44 Years | 2 (22.2%) | 4 (66.7%) |
| 45 to 54 Years | 0 (0.0%) | 3 (23.1%) |
| 55 to 64 Years | 6 (100.0%) | 3 (100.0%) |
| 65 to 74 Years | 9 (100.0%) | 2 (100.0%) |
| 75 Years and over | 1 (100.0%) | 3 (100.0%) |
| Total | 42 (47.7%) | 41 (40.2%) |
Income Below Poverty Among Married-Couple Families in Center
The poverty statistics for married-couple families in Center show that 51.8% or 14 of the total 27 families live below the poverty line. Families with 5 or more children have the highest poverty rate of 100.0%, comprising of 2 families. On the other hand, families with no children have the lowest poverty rate of 28.6%, which includes 4 families.
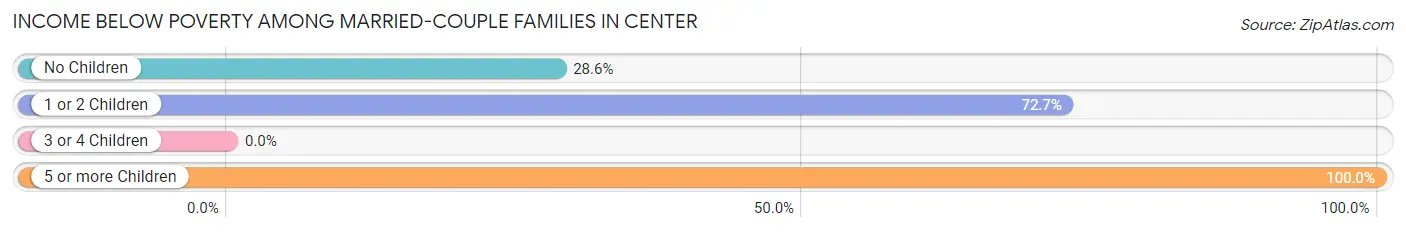
| Children | Above Poverty | Below Poverty |
| No Children | 10 (71.4%) | 4 (28.6%) |
| 1 or 2 Children | 3 (27.3%) | 8 (72.7%) |
| 3 or 4 Children | 0 (0.0%) | 0 (0.0%) |
| 5 or more Children | 0 (0.0%) | 2 (100.0%) |
| Total | 13 (48.1%) | 14 (51.8%) |
Income Below Poverty Among Single-Parent Households in Center

| Children | Single Father | Single Mother |
| No Children | 0 (0.0%) | 0 (0.0%) |
| 1 or 2 Children | 1 (100.0%) | 0 (0.0%) |
| 3 or 4 Children | 0 (0.0%) | 0 (0.0%) |
| 5 or more Children | 0 (0.0%) | 0 (0.0%) |
| Total | 1 (10.0%) | 0 (0.0%) |
Income Below Poverty Among Married-Couple vs Single-Parent Households in Center
The poverty data for Center shows that 14 of the married-couple family households (51.8%) and 1 of the single-parent households (6.7%) are living below the poverty level. Within the married-couple family households, those with 5 or more children have the highest poverty rate, with 2 households (100.0%) falling below the poverty line. Among the single-parent households, those with 1 or 2 children have the highest poverty rate, with 1 household (33.3%) living below poverty.
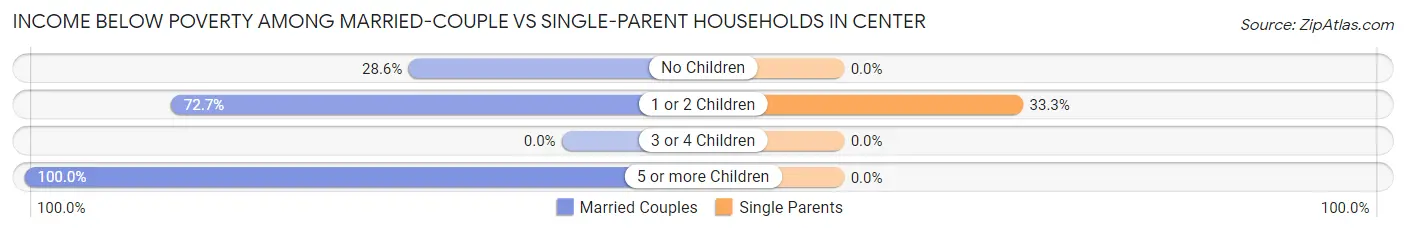
| Children | Married-Couple Families | Single-Parent Households |
| No Children | 4 (28.6%) | 0 (0.0%) |
| 1 or 2 Children | 8 (72.7%) | 1 (33.3%) |
| 3 or 4 Children | 0 (0.0%) | 0 (0.0%) |
| 5 or more Children | 2 (100.0%) | 0 (0.0%) |
| Total | 14 (51.8%) | 1 (6.7%) |
Race in Center
The most populous races in Center are White / Caucasian (181 | 90.9%), Native / Alaskan (17 | 8.5%), and Hispanic or Latino (7 | 3.5%).
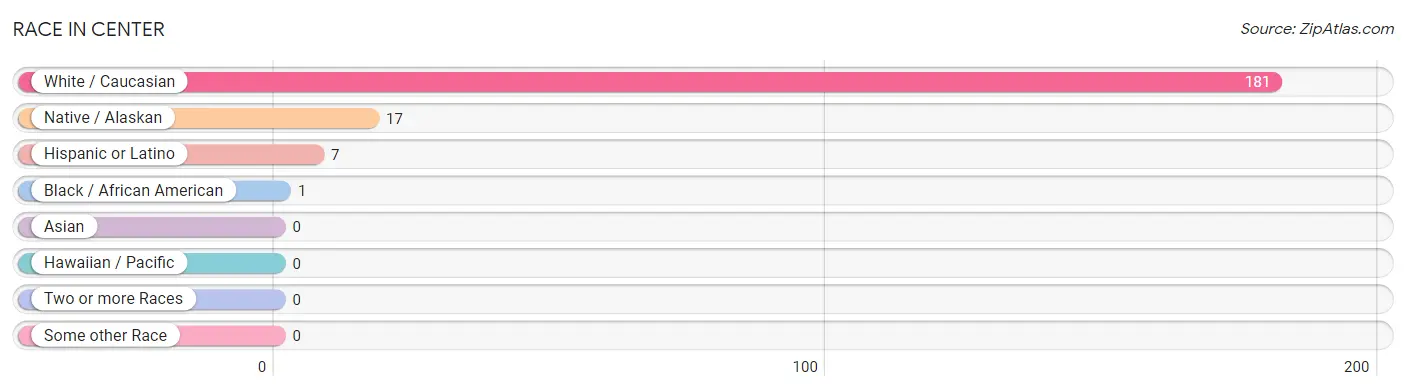
| Race | # Population | % Population |
| Asian | 0 | 0.0% |
| Black / African American | 1 | 0.5% |
| Hawaiian / Pacific | 0 | 0.0% |
| Hispanic or Latino | 7 | 3.5% |
| Native / Alaskan | 17 | 8.5% |
| White / Caucasian | 181 | 90.9% |
| Two or more Races | 0 | 0.0% |
| Some other Race | 0 | 0.0% |
| Total | 199 | 100.0% |
Ancestry in Center
The most populous ancestries reported in Center are German (133 | 66.8%), Scotch-Irish (43 | 21.6%), Sioux (17 | 8.5%), Irish (15 | 7.5%), and English (14 | 7.0%), together accounting for 111.6% of all Center residents.
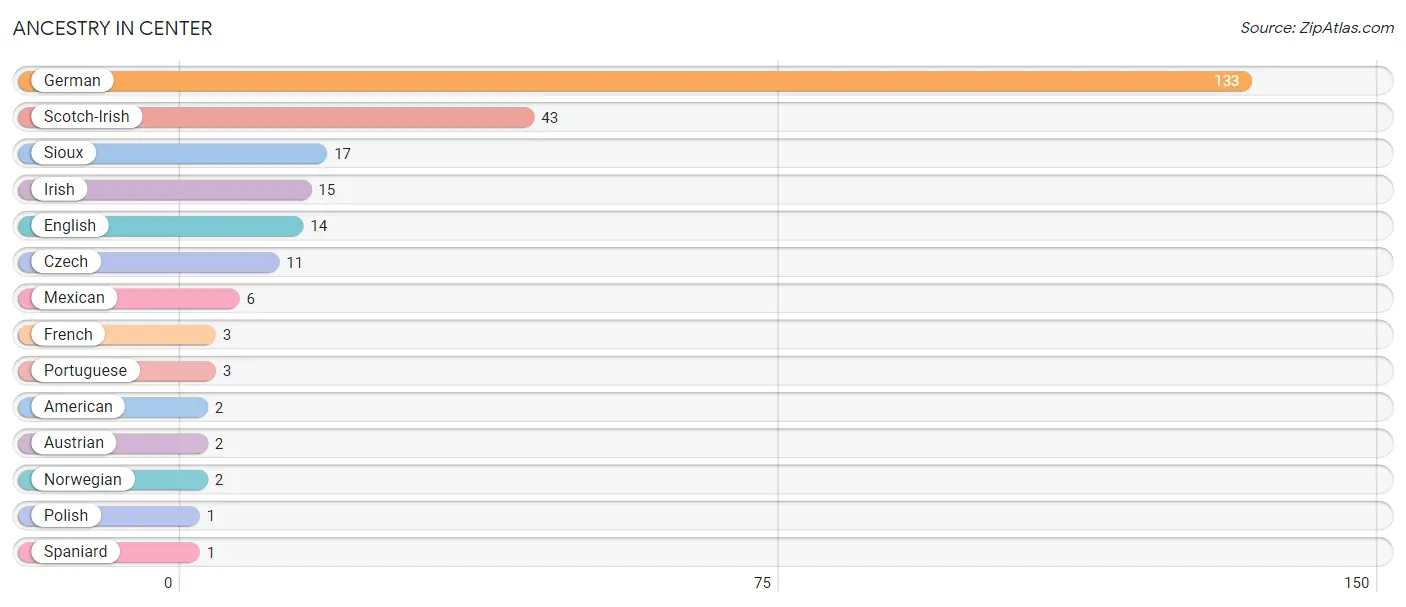
| Ancestry | # Population | % Population |
| American | 2 | 1.0% |
| Austrian | 2 | 1.0% |
| Czech | 11 | 5.5% |
| English | 14 | 7.0% |
| French | 3 | 1.5% |
| German | 133 | 66.8% |
| Irish | 15 | 7.5% |
| Mexican | 6 | 3.0% |
| Norwegian | 2 | 1.0% |
| Polish | 1 | 0.5% |
| Portuguese | 3 | 1.5% |
| Scotch-Irish | 43 | 21.6% |
| Sioux | 17 | 8.5% |
| Spaniard | 1 | 0.5% | View All 14 Rows |
Immigrants in Center
The most numerous immigrant groups reported in Center came from Australia (2 | 1.0%), Europe (2 | 1.0%), Germany (2 | 1.0%), Oceania (2 | 1.0%), and Western Europe (2 | 1.0%), together accounting for 5.0% of all Center residents.
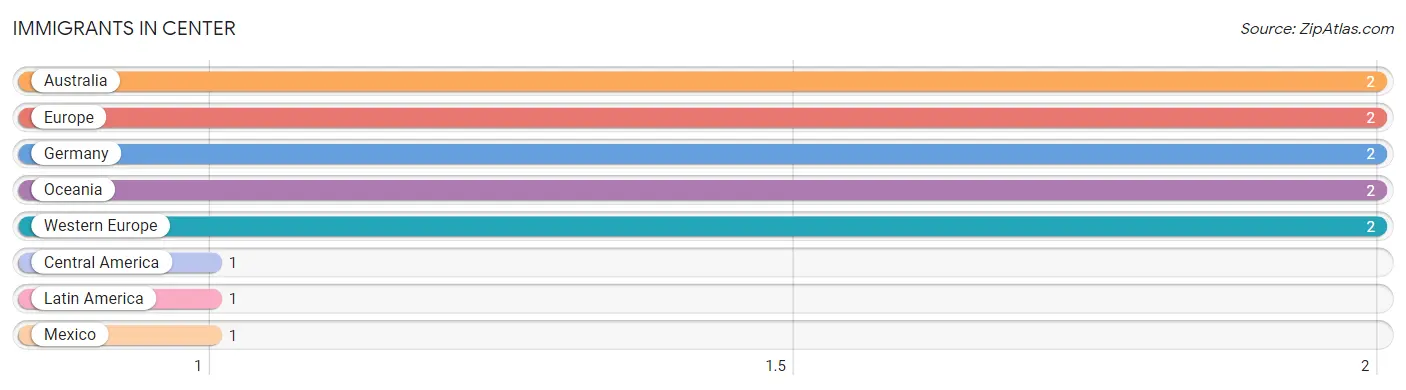
| Immigration Origin | # Population | % Population |
| Australia | 2 | 1.0% |
| Central America | 1 | 0.5% |
| Europe | 2 | 1.0% |
| Germany | 2 | 1.0% |
| Latin America | 1 | 0.5% |
| Mexico | 1 | 0.5% |
| Oceania | 2 | 1.0% |
| Western Europe | 2 | 1.0% | View All 8 Rows |
Sex and Age in Center
Sex and Age in Center
The most populous age groups in Center are 20 to 24 Years (29 | 30.5%) for men and 15 to 19 Years (19 | 18.3%) for women.
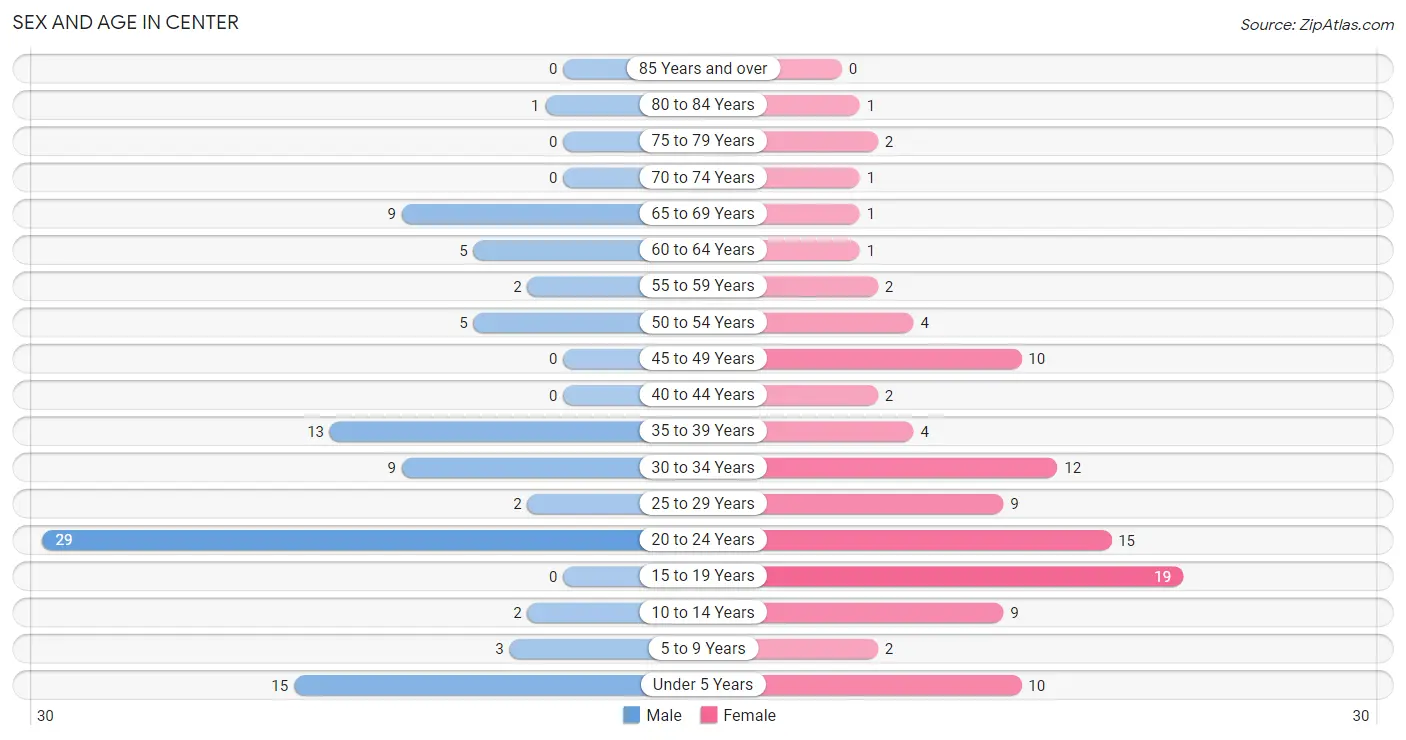
| Age Bracket | Male | Female |
| Under 5 Years | 15 (15.8%) | 10 (9.6%) |
| 5 to 9 Years | 3 (3.2%) | 2 (1.9%) |
| 10 to 14 Years | 2 (2.1%) | 9 (8.6%) |
| 15 to 19 Years | 0 (0.0%) | 19 (18.3%) |
| 20 to 24 Years | 29 (30.5%) | 15 (14.4%) |
| 25 to 29 Years | 2 (2.1%) | 9 (8.6%) |
| 30 to 34 Years | 9 (9.5%) | 12 (11.5%) |
| 35 to 39 Years | 13 (13.7%) | 4 (3.8%) |
| 40 to 44 Years | 0 (0.0%) | 2 (1.9%) |
| 45 to 49 Years | 0 (0.0%) | 10 (9.6%) |
| 50 to 54 Years | 5 (5.3%) | 4 (3.8%) |
| 55 to 59 Years | 2 (2.1%) | 2 (1.9%) |
| 60 to 64 Years | 5 (5.3%) | 1 (1.0%) |
| 65 to 69 Years | 9 (9.5%) | 1 (1.0%) |
| 70 to 74 Years | 0 (0.0%) | 1 (1.0%) |
| 75 to 79 Years | 0 (0.0%) | 2 (1.9%) |
| 80 to 84 Years | 1 (1.1%) | 1 (1.0%) |
| 85 Years and over | 0 (0.0%) | 0 (0.0%) |
| Total | 95 (100.0%) | 104 (100.0%) |
Families and Households in Center
Median Family Size in Center
The median family size in Center is 4.21 persons per family, with married-couple families (27 | 64.3%) accounting for the largest median family size of 4.7 persons per family. On the other hand, single male/father families (10 | 23.8%) represent the smallest median family size with 3.20 persons per family.
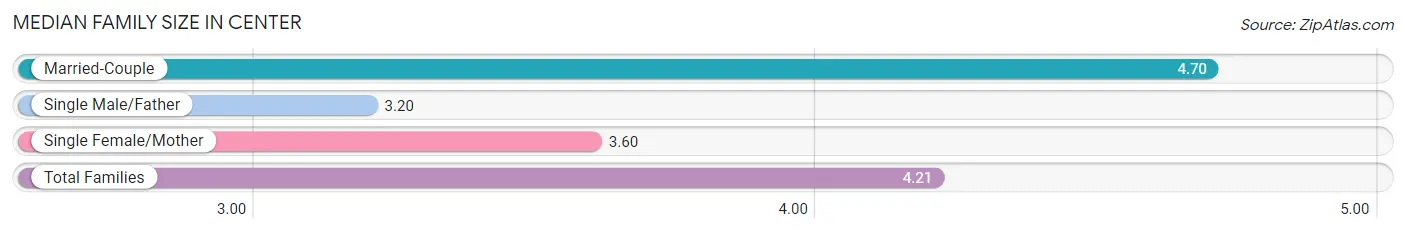
| Family Type | # Families | Family Size |
| Married-Couple | 27 (64.3%) | 4.70 |
| Single Male/Father | 10 (23.8%) | 3.20 |
| Single Female/Mother | 5 (11.9%) | 3.60 |
| Total Families | 42 (100.0%) | 4.21 |
Median Household Size in Center
The median household size in Center is 4.32 persons per household, with married-couple households (27 | 61.4%) accounting for the largest median household size of 4.93 persons per household. non-family households (2 | 4.5%) represent the smallest median household size with 2.00 persons per household.
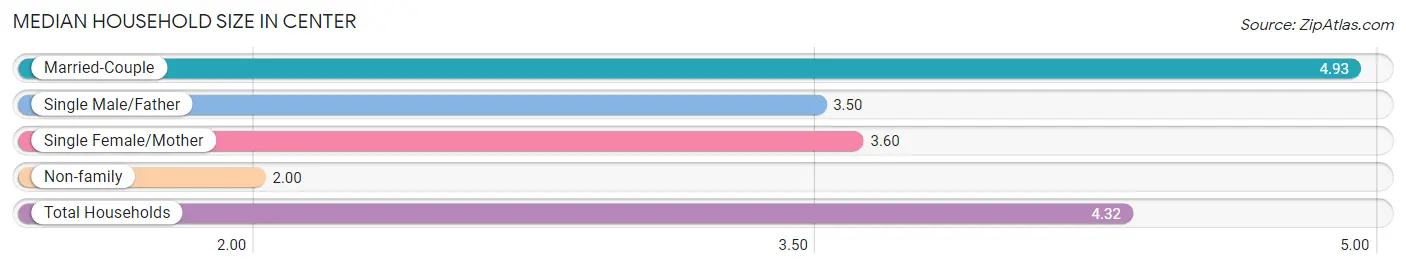
| Household Type | # Households | Household Size |
| Married-Couple | 27 (61.4%) | 4.93 |
| Single Male/Father | 10 (22.7%) | 3.50 |
| Single Female/Mother | 5 (11.4%) | 3.60 |
| Non-family | 2 (4.5%) | 2.00 |
| Total Households | 44 (100.0%) | 4.32 |
Household Size by Marriage Status in Center
Out of a total of 44 households in Center, 42 (95.5%) are family households, while 2 (4.5%) are nonfamily households. The most numerous type of family households are 2-person households, comprising 14, and the most common type of nonfamily households are 1-person households, comprising 1.
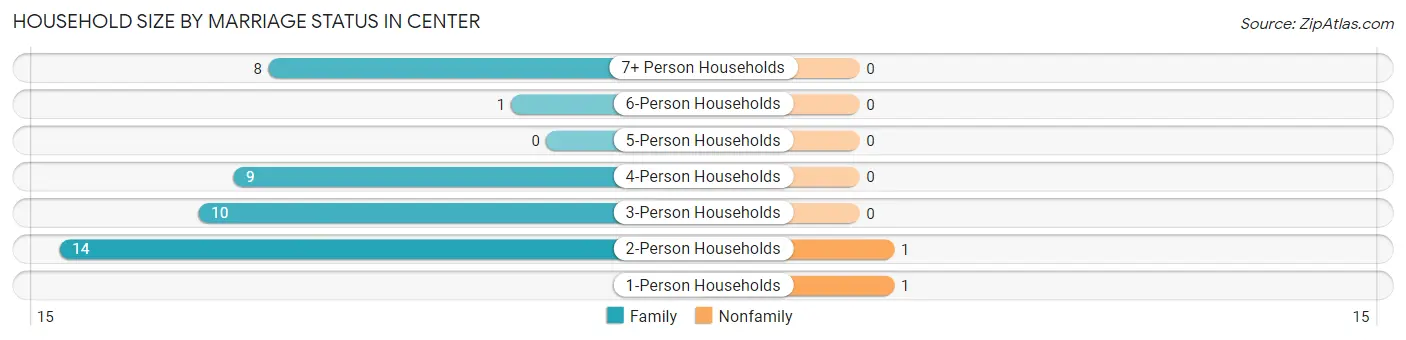
| Household Size | Family Households | Nonfamily Households |
| 1-Person Households | - | 1 (2.3%) |
| 2-Person Households | 14 (31.8%) | 1 (2.3%) |
| 3-Person Households | 10 (22.7%) | 0 (0.0%) |
| 4-Person Households | 9 (20.4%) | 0 (0.0%) |
| 5-Person Households | 0 (0.0%) | 0 (0.0%) |
| 6-Person Households | 1 (2.3%) | 0 (0.0%) |
| 7+ Person Households | 8 (18.2%) | 0 (0.0%) |
| Total | 42 (95.5%) | 2 (4.5%) |
Female Fertility in Center
Fertility by Age in Center
Average fertility rate in Center is 83.0 births per 1,000 women. Women in the age bracket of 20 to 34 years have the highest fertility rate with 167.0 births per 1,000 women. Women in the age bracket of 20 to 34 years acount for 100.0% of all women with births.
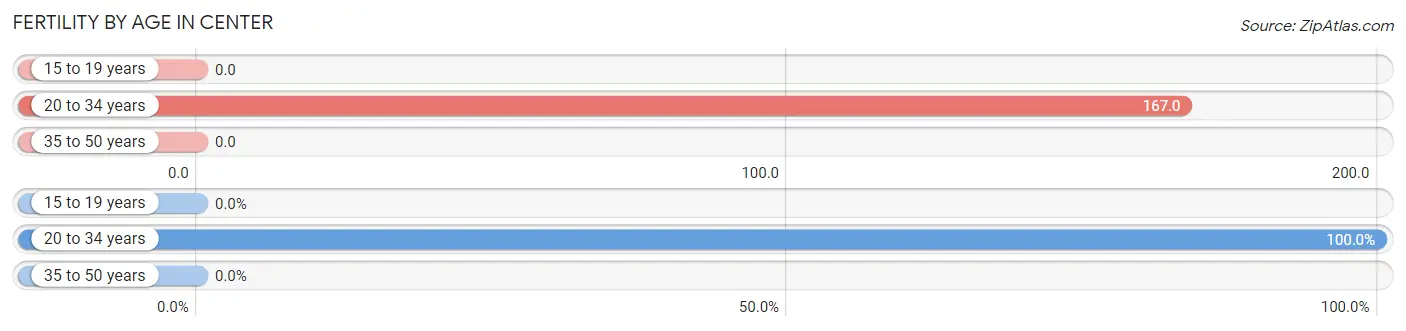
| Age Bracket | Women with Births | Births / 1,000 Women |
| 15 to 19 years | 0 (0.0%) | 0.0 |
| 20 to 34 years | 6 (100.0%) | 167.0 |
| 35 to 50 years | 0 (0.0%) | 0.0 |
| Total | 6 (100.0%) | 83.0 |
Fertility by Age by Marriage Status in Center
83.3% of women with births (6) in Center are married. The highest percentage of unmarried women with births falls into 20 to 34 years age bracket with 16.7% of them unmarried at the time of birth, while the lowest percentage of unmarried women with births belong to 20 to 34 years age bracket with 16.7% of them unmarried.
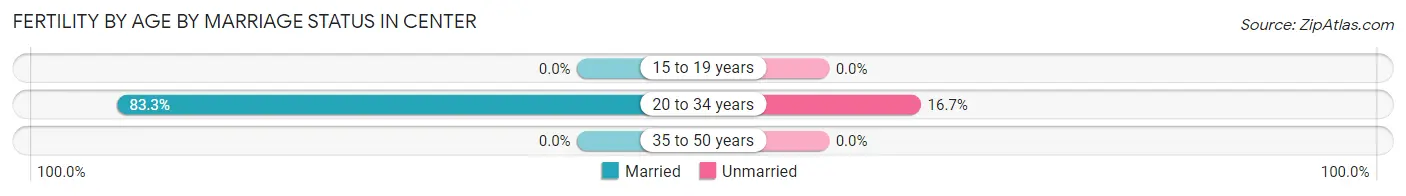
| Age Bracket | Married | Unmarried |
| 15 to 19 years | 0 (0.0%) | 0 (0.0%) |
| 20 to 34 years | 5 (83.3%) | 1 (16.7%) |
| 35 to 50 years | 0 (0.0%) | 0 (0.0%) |
| Total | 5 (83.3%) | 1 (16.7%) |
Fertility by Education in Center
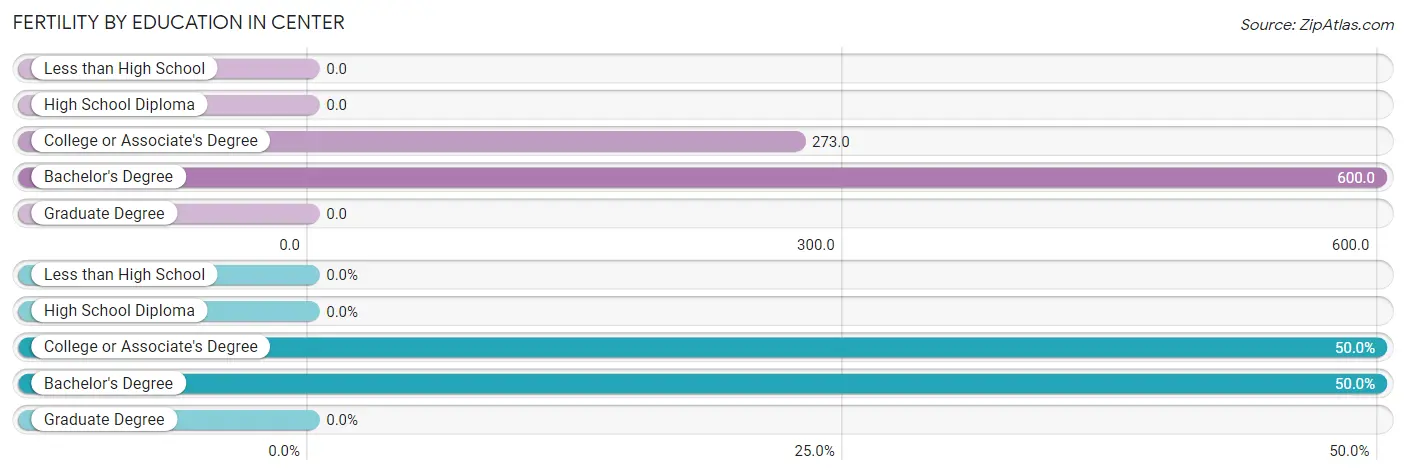
| Educational Attainment | Women with Births | Births / 1,000 Women |
| Less than High School | 0 (0.0%) | 0.0 |
| High School Diploma | 0 (0.0%) | 0.0 |
| College or Associate's Degree | 3 (50.0%) | 273.0 |
| Bachelor's Degree | 3 (50.0%) | 600.0 |
| Graduate Degree | 0 (0.0%) | 0.0 |
| Total | 6 (100.0%) | 83.0 |
Fertility by Education by Marriage Status in Center
16.7% of women with births in Center are unmarried. Women with the educational attainment of bachelor's degree are most likely to be married with 100.0% of them married at childbirth, while women with the educational attainment of college or associate's degree are least likely to be married with 33.3% of them unmarried at childbirth.
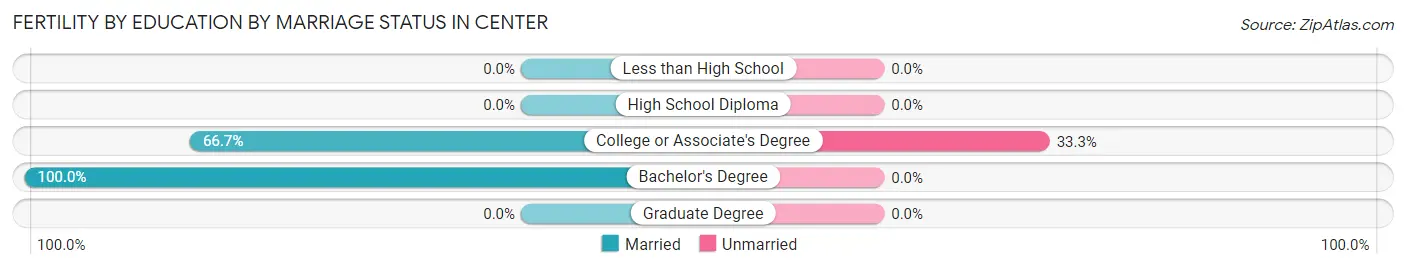
| Educational Attainment | Married | Unmarried |
| Less than High School | 0 (0.0%) | 0 (0.0%) |
| High School Diploma | 0 (0.0%) | 0 (0.0%) |
| College or Associate's Degree | 2 (66.7%) | 1 (33.3%) |
| Bachelor's Degree | 3 (100.0%) | 0 (0.0%) |
| Graduate Degree | 0 (0.0%) | 0 (0.0%) |
| Total | 5 (83.3%) | 1 (16.7%) |
Employment Characteristics in Center
Employment by Class of Employer in Center
Among the 94 employed individuals in Center, private company employees (71 | 75.5%), self-employed (not incorporated) (12 | 12.8%), and local government employees (7 | 7.4%) make up the most common classes of employment.
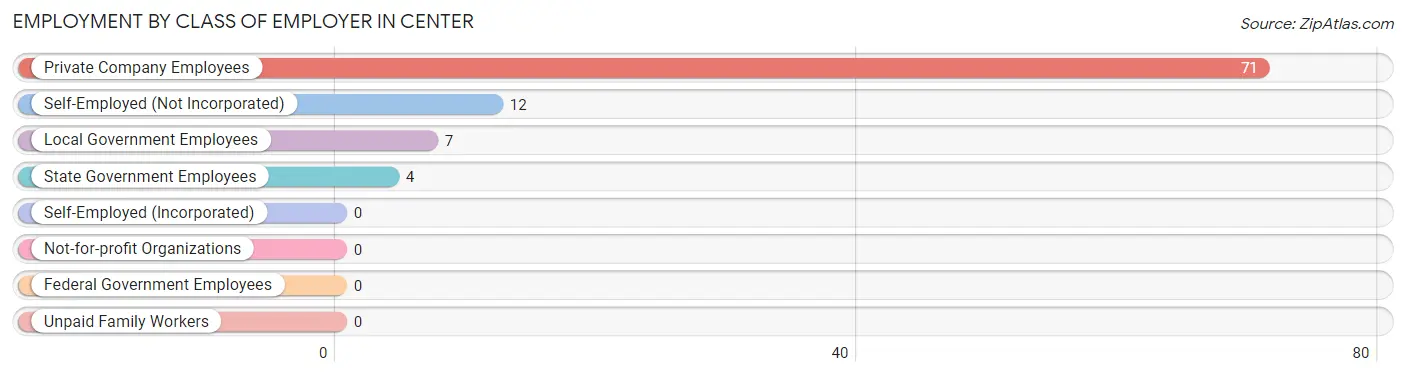
| Employer Class | # Employees | % Employees |
| Private Company Employees | 71 | 75.5% |
| Self-Employed (Incorporated) | 0 | 0.0% |
| Self-Employed (Not Incorporated) | 12 | 12.8% |
| Not-for-profit Organizations | 0 | 0.0% |
| Local Government Employees | 7 | 7.4% |
| State Government Employees | 4 | 4.3% |
| Federal Government Employees | 0 | 0.0% |
| Unpaid Family Workers | 0 | 0.0% |
| Total | 94 | 100.0% |
Employment Status by Age in Center
According to the labor force statistics for Center, out of the total population over 16 years of age (158), 70.9% or 112 individuals are in the labor force, with 16.1% or 18 of them unemployed. The age group with the highest labor force participation rate is 30 to 34 years, with 95.2% or 20 individuals in the labor force. Within the labor force, the 16 to 19 years age range has the highest percentage of unemployed individuals, with 100.0% or 13 of them being unemployed.
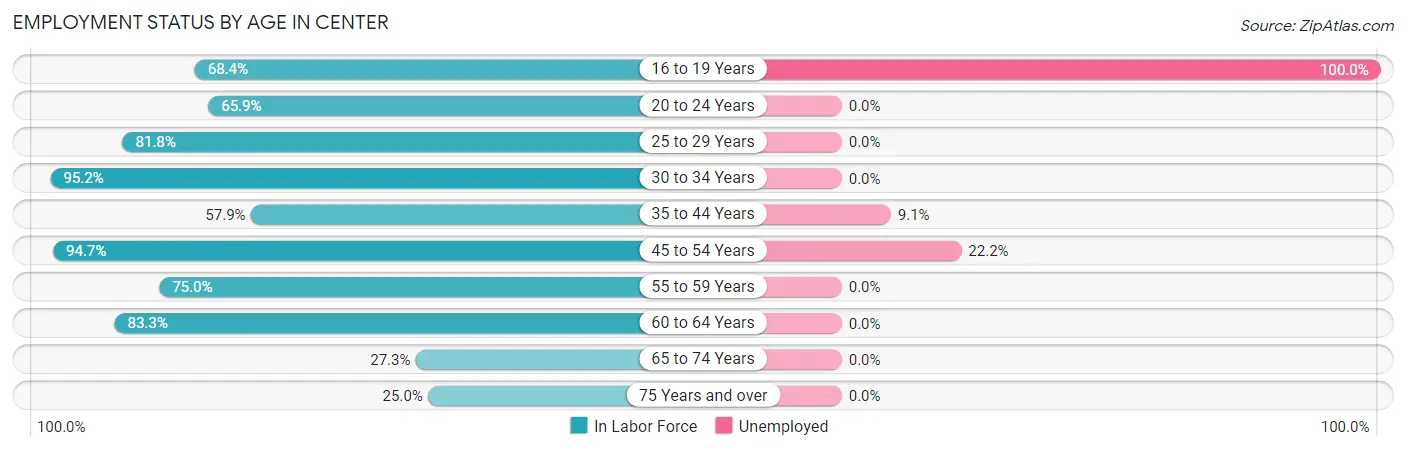
| Age Bracket | In Labor Force | Unemployed |
| 16 to 19 Years | 13 (68.4%) | 13 (100.0%) |
| 20 to 24 Years | 29 (65.9%) | 0 (0.0%) |
| 25 to 29 Years | 9 (81.8%) | 0 (0.0%) |
| 30 to 34 Years | 20 (95.2%) | 0 (0.0%) |
| 35 to 44 Years | 11 (57.9%) | 1 (9.1%) |
| 45 to 54 Years | 18 (94.7%) | 4 (22.2%) |
| 55 to 59 Years | 3 (75.0%) | 0 (0.0%) |
| 60 to 64 Years | 5 (83.3%) | 0 (0.0%) |
| 65 to 74 Years | 3 (27.3%) | 0 (0.0%) |
| 75 Years and over | 1 (25.0%) | 0 (0.0%) |
| Total | 112 (70.9%) | 18 (16.1%) |
Employment Status by Educational Attainment in Center
According to labor force statistics for Center, 82.5% of individuals (66) out of the total population between 25 and 64 years of age (80) are in the labor force, with 7.6% or 5 of them being unemployed. The group with the highest labor force participation rate are those with the educational attainment of college / associate degree, with 92.3% or 24 individuals in the labor force. Within the labor force, individuals with high school diploma education have the highest percentage of unemployment, with 18.5% or 5 of them being unemployed.
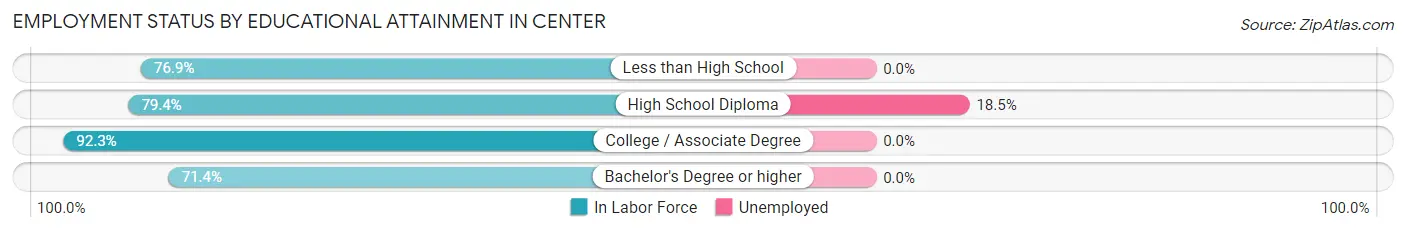
| Educational Attainment | In Labor Force | Unemployed |
| Less than High School | 10 (76.9%) | 0 (0.0%) |
| High School Diploma | 27 (79.4%) | 6 (18.5%) |
| College / Associate Degree | 24 (92.3%) | 0 (0.0%) |
| Bachelor's Degree or higher | 5 (71.4%) | 0 (0.0%) |
| Total | 66 (82.5%) | 6 (7.6%) |
Employment Occupations by Sex in Center
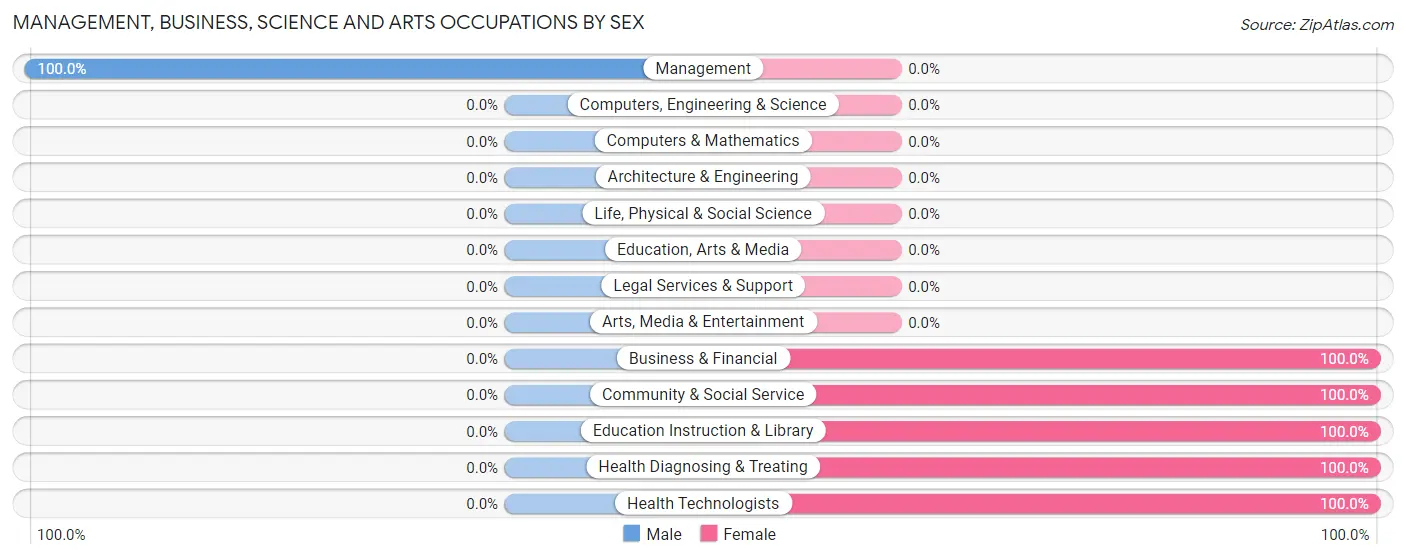
Management, Business, Science and Arts Occupations
The most common Management, Business, Science and Arts occupations in Center are Management (12 | 12.8%), Health Diagnosing & Treating (4 | 4.3%), Health Technologists (4 | 4.3%), Community & Social Service (3 | 3.2%), and Education Instruction & Library (3 | 3.2%).
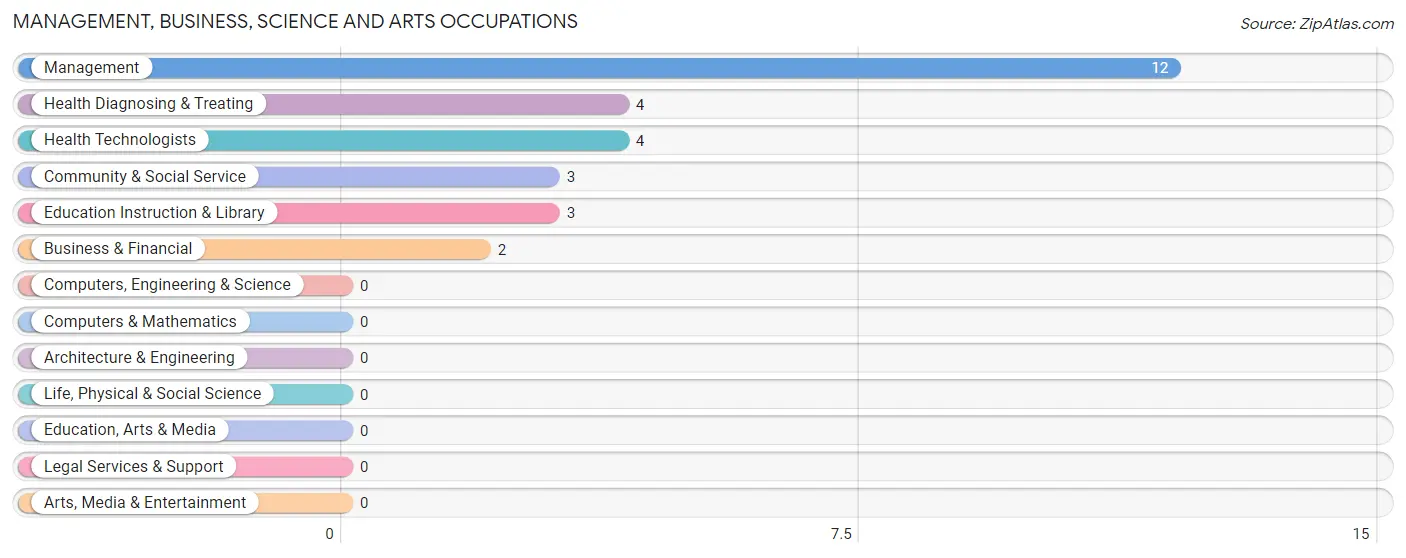
Management, Business, Science and Arts Occupations by Sex
| Occupation | Male | Female |
| Management | 12 (100.0%) | 0 (0.0%) |
| Business & Financial | 0 (0.0%) | 2 (100.0%) |
| Computers, Engineering & Science | 0 (0.0%) | 0 (0.0%) |
| Computers & Mathematics | 0 (0.0%) | 0 (0.0%) |
| Architecture & Engineering | 0 (0.0%) | 0 (0.0%) |
| Life, Physical & Social Science | 0 (0.0%) | 0 (0.0%) |
| Community & Social Service | 0 (0.0%) | 3 (100.0%) |
| Education, Arts & Media | 0 (0.0%) | 0 (0.0%) |
| Legal Services & Support | 0 (0.0%) | 0 (0.0%) |
| Education Instruction & Library | 0 (0.0%) | 3 (100.0%) |
| Arts, Media & Entertainment | 0 (0.0%) | 0 (0.0%) |
| Health Diagnosing & Treating | 0 (0.0%) | 4 (100.0%) |
| Health Technologists | 0 (0.0%) | 4 (100.0%) |
| Total (Category) | 12 (57.1%) | 9 (42.9%) |
| Total (Overall) | 59 (62.8%) | 35 (37.2%) |
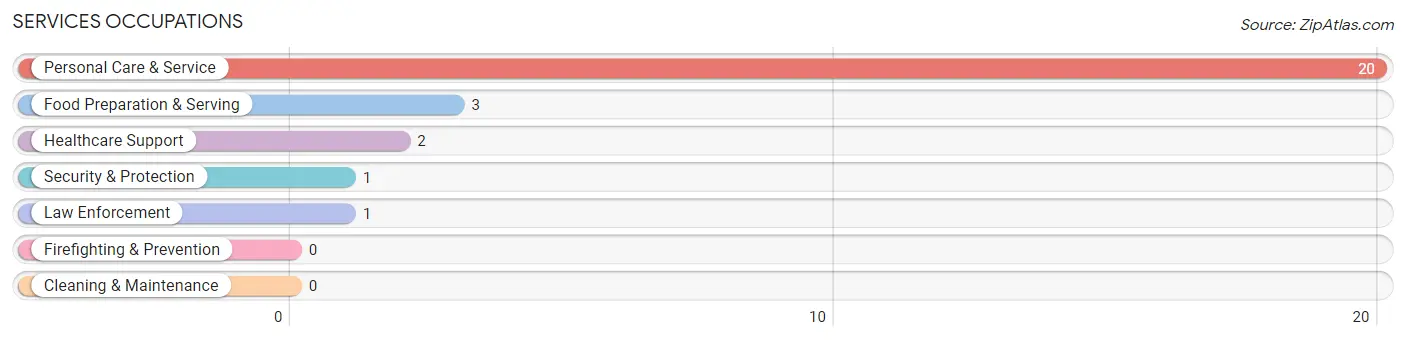
Services Occupations
The most common Services occupations in Center are Personal Care & Service (20 | 21.3%), Food Preparation & Serving (3 | 3.2%), Healthcare Support (2 | 2.1%), Security & Protection (1 | 1.1%), and Law Enforcement (1 | 1.1%).
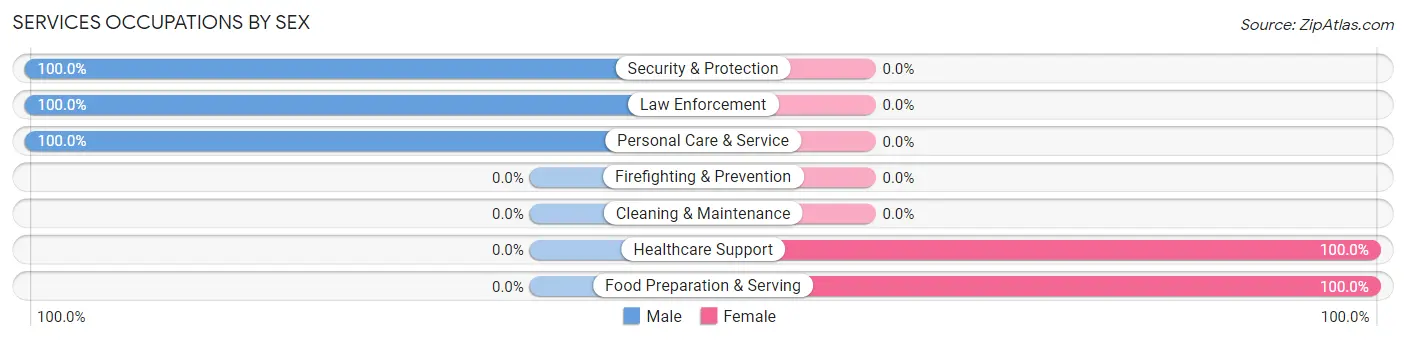
Services Occupations by Sex
Within the Services occupations in Center, the most male-oriented occupations are Security & Protection (100.0%), Law Enforcement (100.0%), and Personal Care & Service (100.0%), while the most female-oriented occupations are Healthcare Support (100.0%), and Food Preparation & Serving (100.0%).
| Occupation | Male | Female |
| Healthcare Support | 0 (0.0%) | 2 (100.0%) |
| Security & Protection | 1 (100.0%) | 0 (0.0%) |
| Firefighting & Prevention | 0 (0.0%) | 0 (0.0%) |
| Law Enforcement | 1 (100.0%) | 0 (0.0%) |
| Food Preparation & Serving | 0 (0.0%) | 3 (100.0%) |
| Cleaning & Maintenance | 0 (0.0%) | 0 (0.0%) |
| Personal Care & Service | 20 (100.0%) | 0 (0.0%) |
| Total (Category) | 21 (80.8%) | 5 (19.2%) |
| Total (Overall) | 59 (62.8%) | 35 (37.2%) |
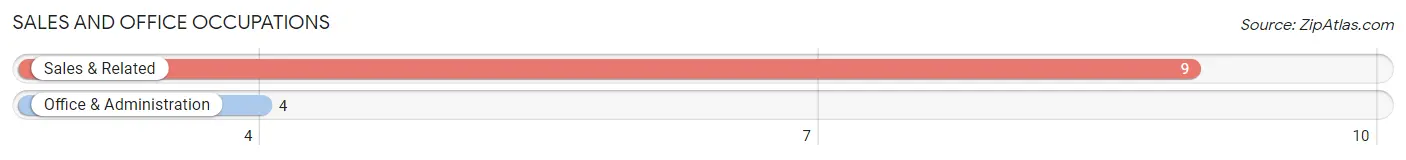
Sales and Office Occupations
The most common Sales and Office occupations in Center are Sales & Related (9 | 9.6%), and Office & Administration (4 | 4.3%).
Sales and Office Occupations by Sex
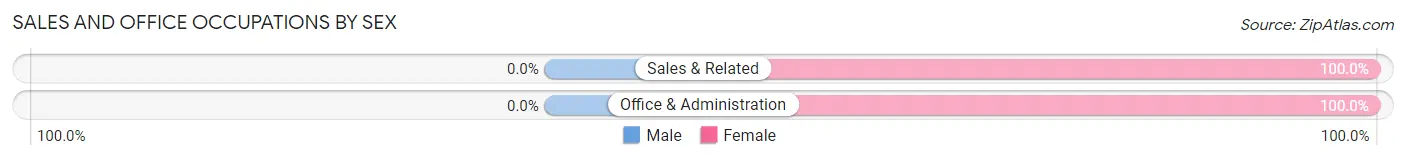
| Occupation | Male | Female |
| Sales & Related | 0 (0.0%) | 9 (100.0%) |
| Office & Administration | 0 (0.0%) | 4 (100.0%) |
| Total (Category) | 0 (0.0%) | 13 (100.0%) |
| Total (Overall) | 59 (62.8%) | 35 (37.2%) |
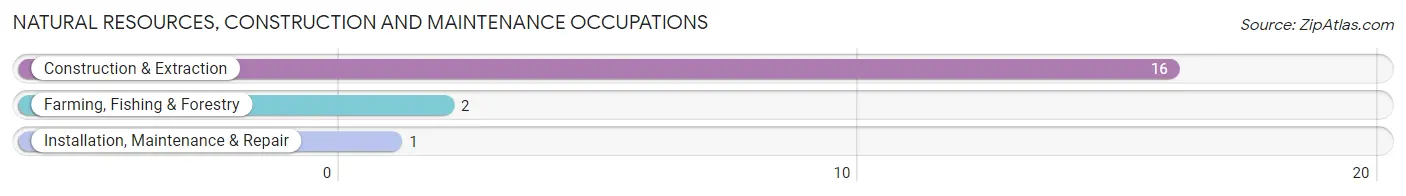
Natural Resources, Construction and Maintenance Occupations
The most common Natural Resources, Construction and Maintenance occupations in Center are Construction & Extraction (16 | 17.0%), Farming, Fishing & Forestry (2 | 2.1%), and Installation, Maintenance & Repair (1 | 1.1%).
Natural Resources, Construction and Maintenance Occupations by Sex
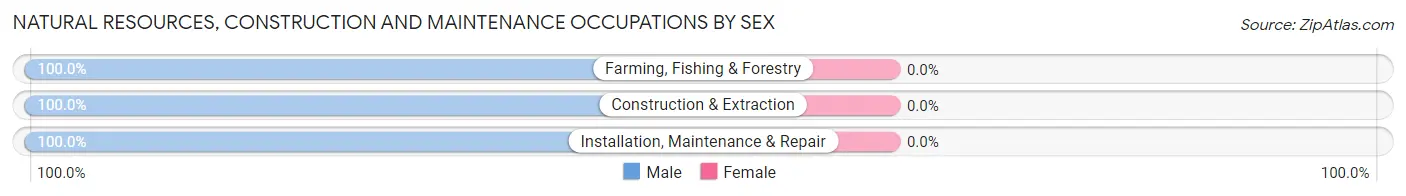
| Occupation | Male | Female |
| Farming, Fishing & Forestry | 2 (100.0%) | 0 (0.0%) |
| Construction & Extraction | 16 (100.0%) | 0 (0.0%) |
| Installation, Maintenance & Repair | 1 (100.0%) | 0 (0.0%) |
| Total (Category) | 19 (100.0%) | 0 (0.0%) |
| Total (Overall) | 59 (62.8%) | 35 (37.2%) |
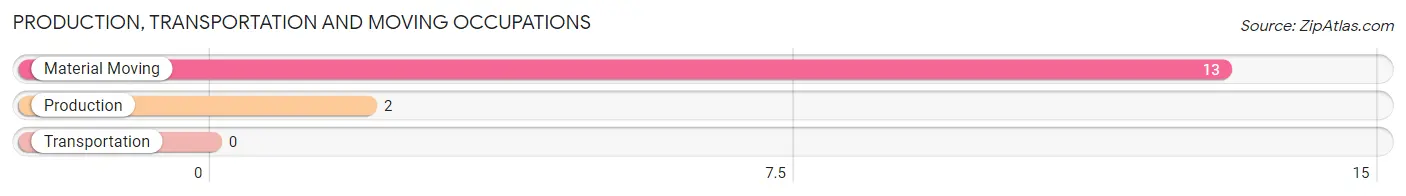
Production, Transportation and Moving Occupations
The most common Production, Transportation and Moving occupations in Center are Material Moving (13 | 13.8%), and Production (2 | 2.1%).
Production, Transportation and Moving Occupations by Sex
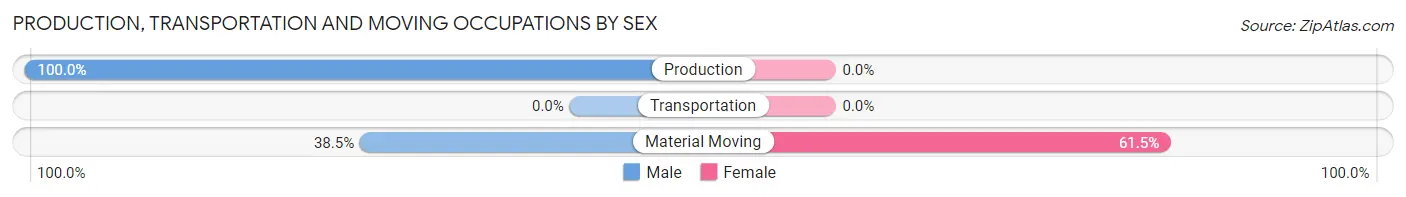
| Occupation | Male | Female |
| Production | 2 (100.0%) | 0 (0.0%) |
| Transportation | 0 (0.0%) | 0 (0.0%) |
| Material Moving | 5 (38.5%) | 8 (61.5%) |
| Total (Category) | 7 (46.7%) | 8 (53.3%) |
| Total (Overall) | 59 (62.8%) | 35 (37.2%) |
Employment Industries by Sex in Center
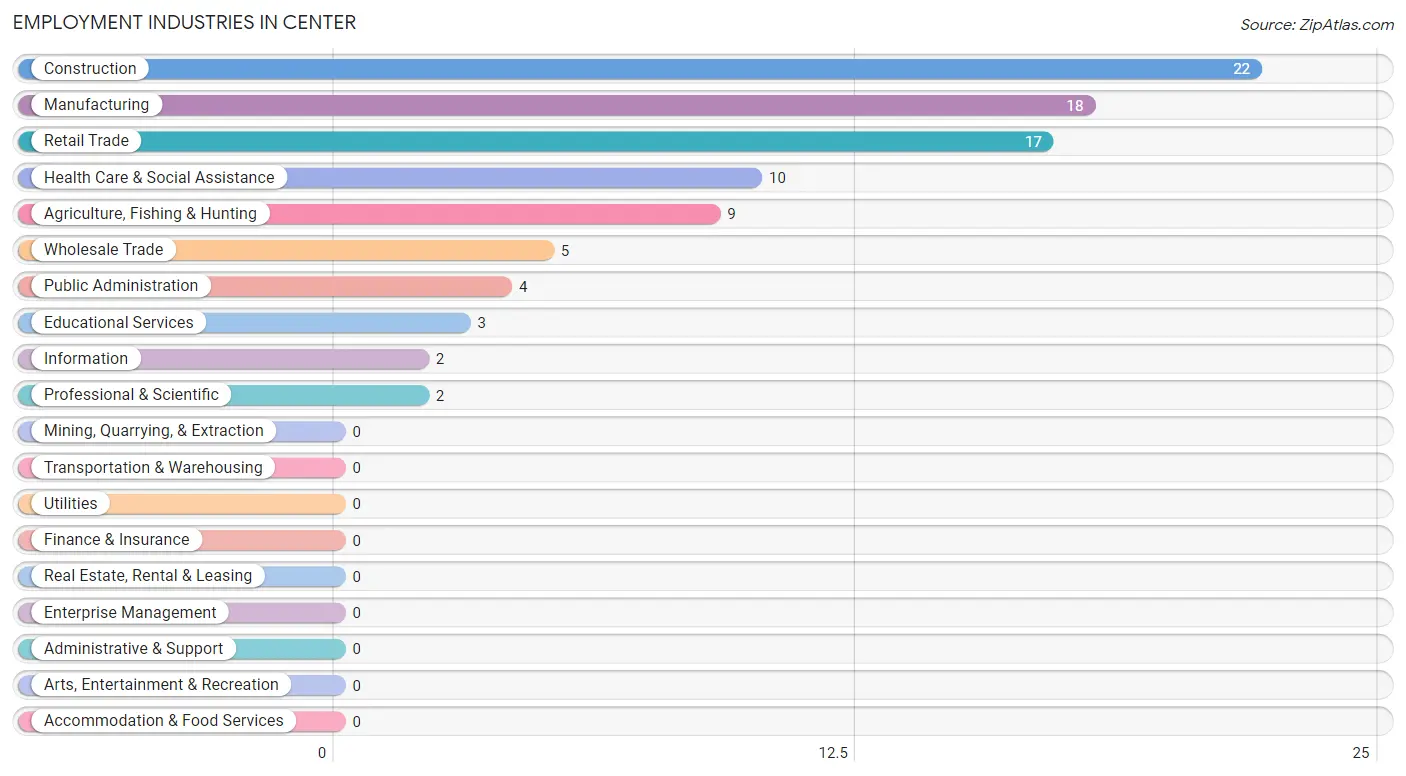
Employment Industries in Center
The major employment industries in Center include Construction (22 | 23.4%), Manufacturing (18 | 19.2%), Retail Trade (17 | 18.1%), Health Care & Social Assistance (10 | 10.6%), and Agriculture, Fishing & Hunting (9 | 9.6%).
Employment Industries by Sex in Center
The Center industries that see more men than women are Agriculture, Fishing & Hunting (100.0%), Construction (100.0%), and Manufacturing (100.0%), whereas the industries that tend to have a higher number of women are Retail Trade (100.0%), Professional & Scientific (100.0%), and Educational Services (100.0%).
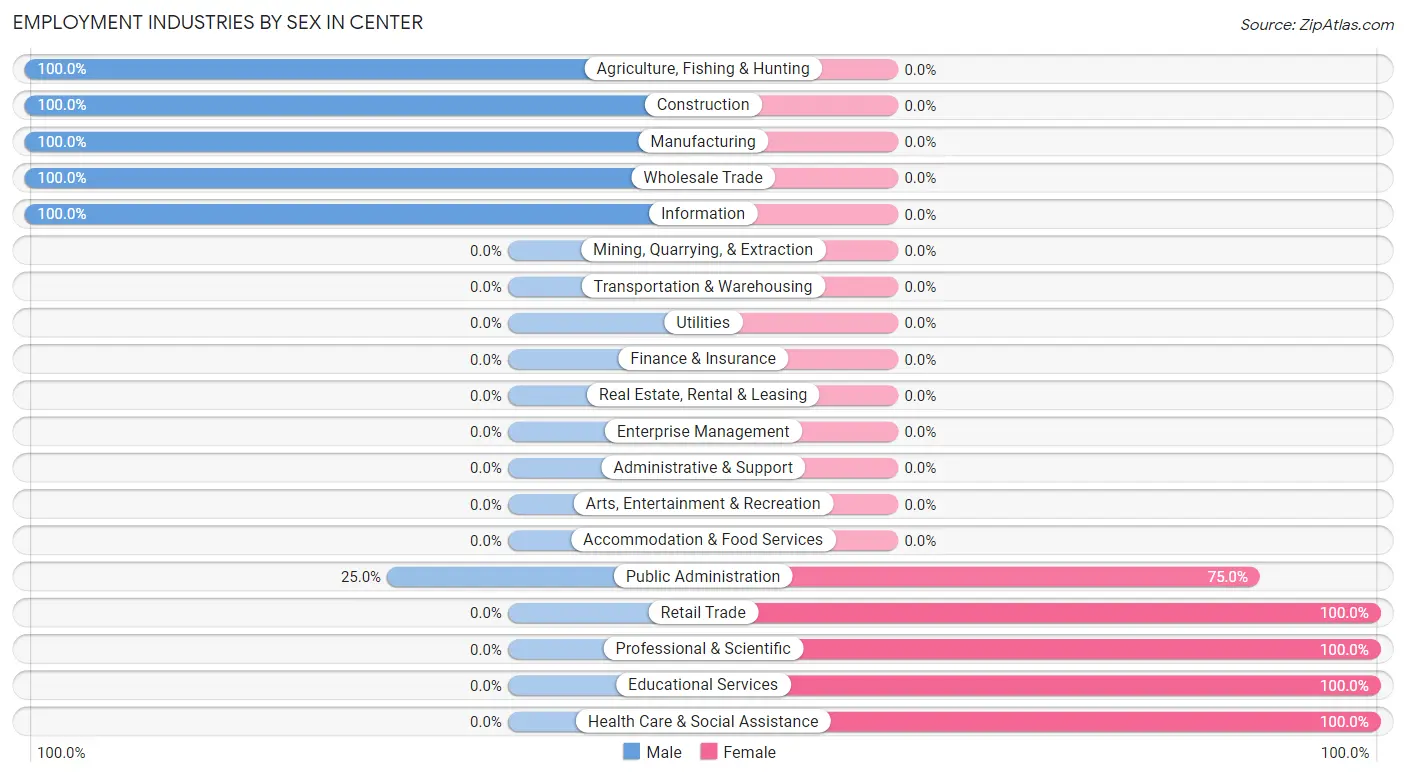
| Industry | Male | Female |
| Agriculture, Fishing & Hunting | 9 (100.0%) | 0 (0.0%) |
| Mining, Quarrying, & Extraction | 0 (0.0%) | 0 (0.0%) |
| Construction | 22 (100.0%) | 0 (0.0%) |
| Manufacturing | 18 (100.0%) | 0 (0.0%) |
| Wholesale Trade | 5 (100.0%) | 0 (0.0%) |
| Retail Trade | 0 (0.0%) | 17 (100.0%) |
| Transportation & Warehousing | 0 (0.0%) | 0 (0.0%) |
| Utilities | 0 (0.0%) | 0 (0.0%) |
| Information | 2 (100.0%) | 0 (0.0%) |
| Finance & Insurance | 0 (0.0%) | 0 (0.0%) |
| Real Estate, Rental & Leasing | 0 (0.0%) | 0 (0.0%) |
| Professional & Scientific | 0 (0.0%) | 2 (100.0%) |
| Enterprise Management | 0 (0.0%) | 0 (0.0%) |
| Administrative & Support | 0 (0.0%) | 0 (0.0%) |
| Educational Services | 0 (0.0%) | 3 (100.0%) |
| Health Care & Social Assistance | 0 (0.0%) | 10 (100.0%) |
| Arts, Entertainment & Recreation | 0 (0.0%) | 0 (0.0%) |
| Accommodation & Food Services | 0 (0.0%) | 0 (0.0%) |
| Public Administration | 1 (25.0%) | 3 (75.0%) |
| Total | 59 (62.8%) | 35 (37.2%) |
Education in Center
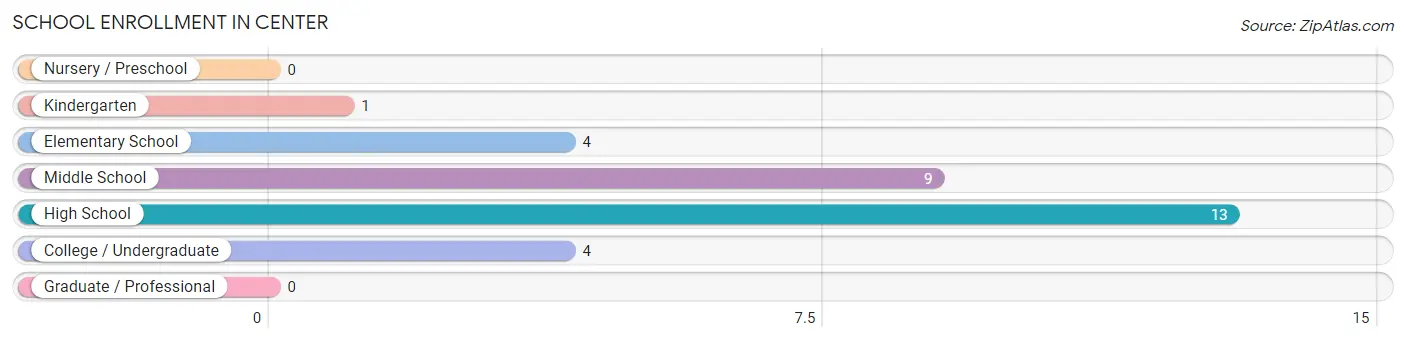
School Enrollment in Center
The most common levels of schooling among the 31 students in Center are high school (13 | 41.9%), middle school (9 | 29.0%), and elementary school (4 | 12.9%).
| School Level | # Students | % Students |
| Nursery / Preschool | 0 | 0.0% |
| Kindergarten | 1 | 3.2% |
| Elementary School | 4 | 12.9% |
| Middle School | 9 | 29.0% |
| High School | 13 | 41.9% |
| College / Undergraduate | 4 | 12.9% |
| Graduate / Professional | 0 | 0.0% |
| Total | 31 | 100.0% |
School Enrollment by Age by Funding Source in Center
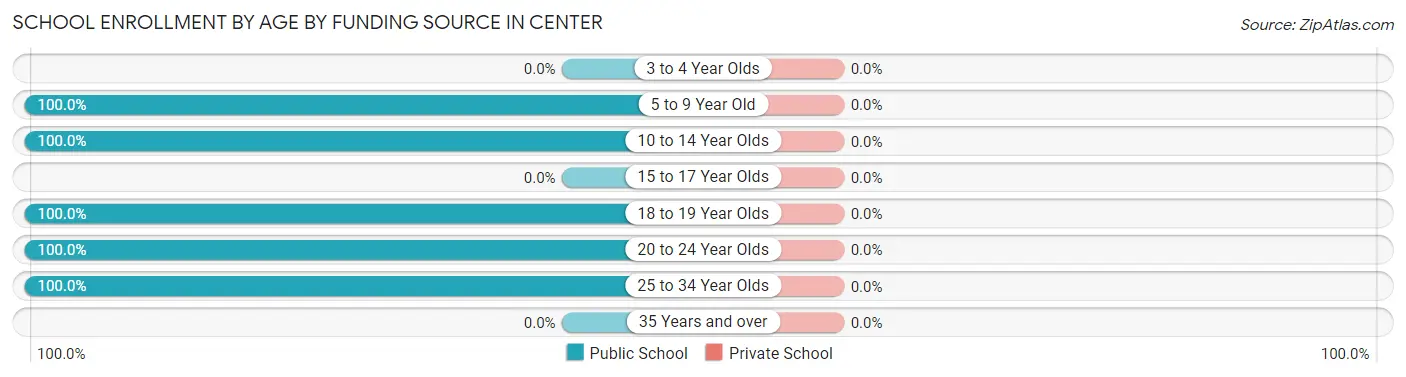
| Age Bracket | Public School | Private School |
| 3 to 4 Year Olds | 0 (0.0%) | 0 (0.0%) |
| 5 to 9 Year Old | 3 (100.0%) | 0 (0.0%) |
| 10 to 14 Year Olds | 11 (100.0%) | 0 (0.0%) |
| 15 to 17 Year Olds | 0 (0.0%) | 0 (0.0%) |
| 18 to 19 Year Olds | 13 (100.0%) | 0 (0.0%) |
| 20 to 24 Year Olds | 2 (100.0%) | 0 (0.0%) |
| 25 to 34 Year Olds | 2 (100.0%) | 0 (0.0%) |
| 35 Years and over | 0 (0.0%) | 0 (0.0%) |
| Total | 31 (100.0%) | 0 (0.0%) |
Educational Attainment by Field of Study in Center
Science & technology (3 | 42.9%), arts & humanities (2 | 28.6%), computers & mathematics (1 | 14.3%), and physical & health sciences (1 | 14.3%) are the most common fields of study among 7 individuals in Center who have obtained a bachelor's degree or higher.
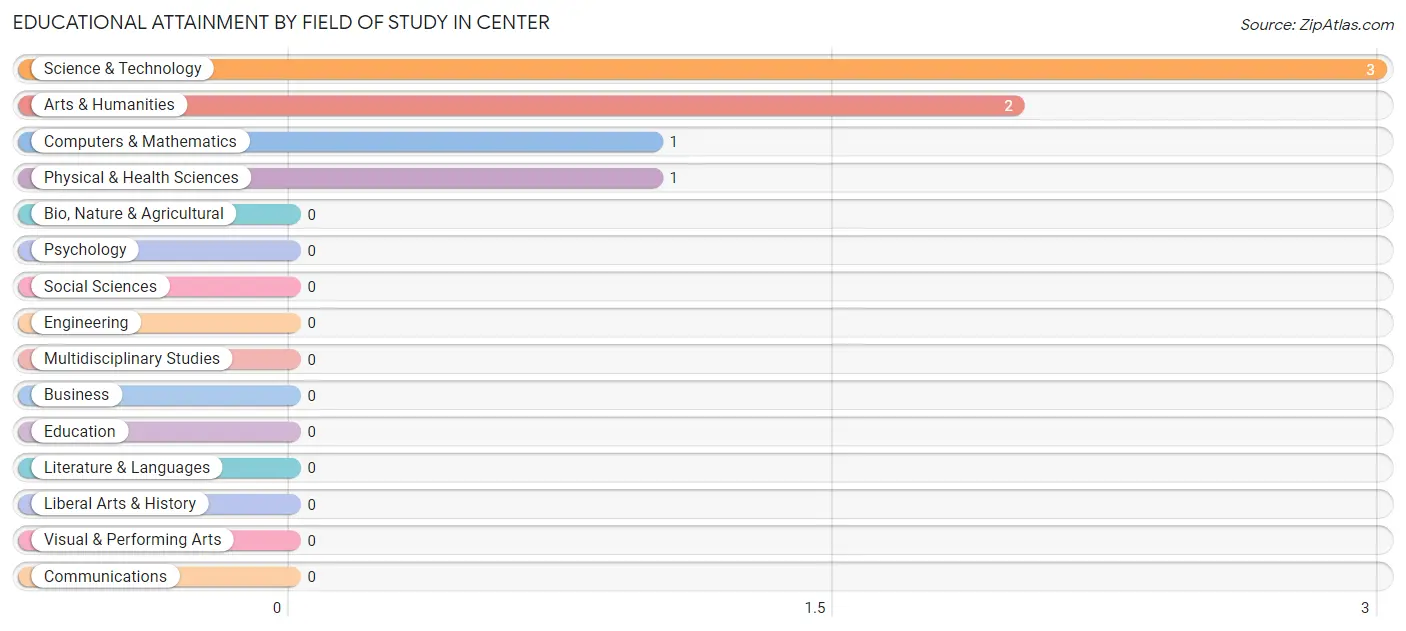
| Field of Study | # Graduates | % Graduates |
| Computers & Mathematics | 1 | 14.3% |
| Bio, Nature & Agricultural | 0 | 0.0% |
| Physical & Health Sciences | 1 | 14.3% |
| Psychology | 0 | 0.0% |
| Social Sciences | 0 | 0.0% |
| Engineering | 0 | 0.0% |
| Multidisciplinary Studies | 0 | 0.0% |
| Science & Technology | 3 | 42.9% |
| Business | 0 | 0.0% |
| Education | 0 | 0.0% |
| Literature & Languages | 0 | 0.0% |
| Liberal Arts & History | 0 | 0.0% |
| Visual & Performing Arts | 0 | 0.0% |
| Communications | 0 | 0.0% |
| Arts & Humanities | 2 | 28.6% |
| Total | 7 | 100.0% |
Transportation & Commute in Center
Vehicle Availability by Sex in Center
The most prevalent vehicle ownership categories in Center are males with 5 or more vehicles (24, accounting for 40.7%) and females with 5 or more vehicles (8, making up 68.6%).
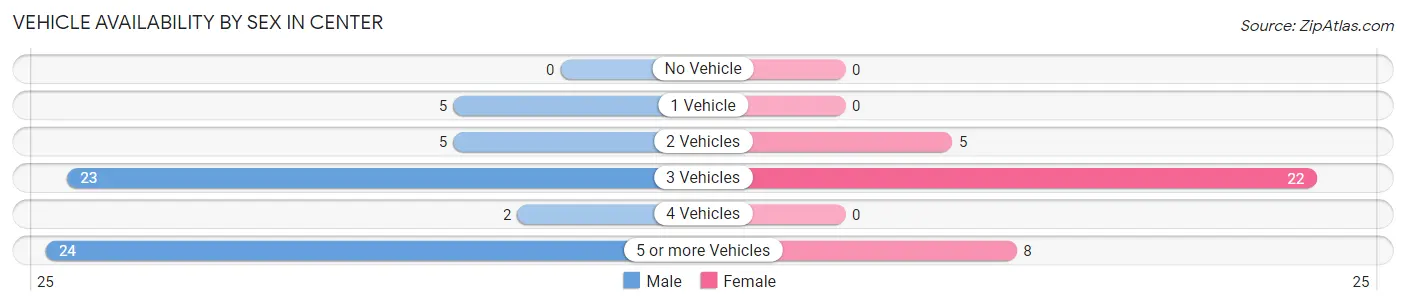
| Vehicles Available | Male | Female |
| No Vehicle | 0 (0.0%) | 0 (0.0%) |
| 1 Vehicle | 5 (8.5%) | 0 (0.0%) |
| 2 Vehicles | 5 (8.5%) | 5 (14.3%) |
| 3 Vehicles | 23 (39.0%) | 22 (62.9%) |
| 4 Vehicles | 2 (3.4%) | 0 (0.0%) |
| 5 or more Vehicles | 24 (40.7%) | 8 (22.9%) |
| Total | 59 (100.0%) | 35 (100.0%) |
Commute Time in Center
The most frequently occuring commute durations in Center are 10 to 14 minutes (29 commuters, 31.5%), 15 to 19 minutes (26 commuters, 28.3%), and 20 to 24 minutes (17 commuters, 18.5%).
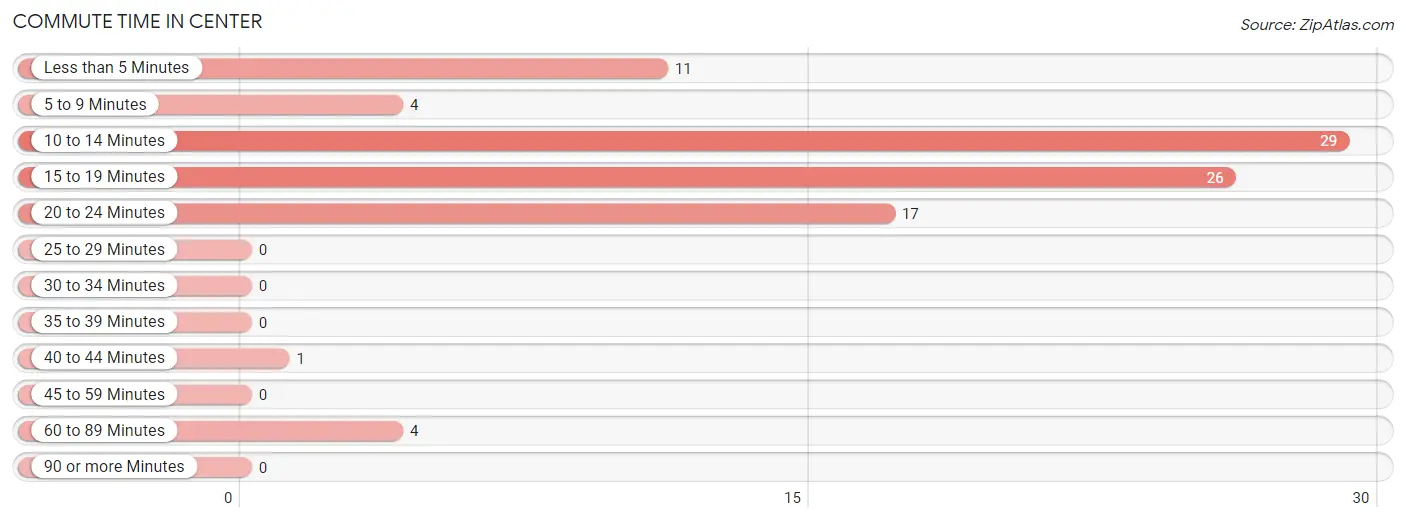
| Commute Time | # Commuters | % Commuters |
| Less than 5 Minutes | 11 | 12.0% |
| 5 to 9 Minutes | 4 | 4.3% |
| 10 to 14 Minutes | 29 | 31.5% |
| 15 to 19 Minutes | 26 | 28.3% |
| 20 to 24 Minutes | 17 | 18.5% |
| 25 to 29 Minutes | 0 | 0.0% |
| 30 to 34 Minutes | 0 | 0.0% |
| 35 to 39 Minutes | 0 | 0.0% |
| 40 to 44 Minutes | 1 | 1.1% |
| 45 to 59 Minutes | 0 | 0.0% |
| 60 to 89 Minutes | 4 | 4.3% |
| 90 or more Minutes | 0 | 0.0% |
Commute Time by Sex in Center
The most common commute times in Center are 15 to 19 minutes (21 commuters, 35.6%) for males and 10 to 14 minutes (11 commuters, 33.3%) for females.
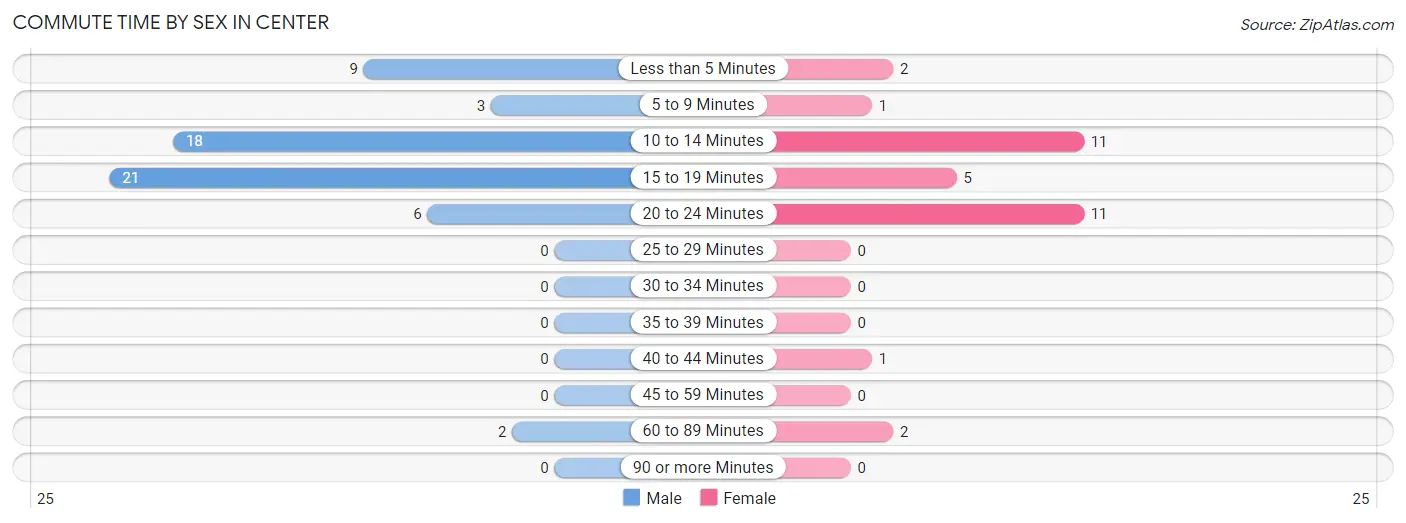
| Commute Time | Male | Female |
| Less than 5 Minutes | 9 (15.2%) | 2 (6.1%) |
| 5 to 9 Minutes | 3 (5.1%) | 1 (3.0%) |
| 10 to 14 Minutes | 18 (30.5%) | 11 (33.3%) |
| 15 to 19 Minutes | 21 (35.6%) | 5 (15.1%) |
| 20 to 24 Minutes | 6 (10.2%) | 11 (33.3%) |
| 25 to 29 Minutes | 0 (0.0%) | 0 (0.0%) |
| 30 to 34 Minutes | 0 (0.0%) | 0 (0.0%) |
| 35 to 39 Minutes | 0 (0.0%) | 0 (0.0%) |
| 40 to 44 Minutes | 0 (0.0%) | 1 (3.0%) |
| 45 to 59 Minutes | 0 (0.0%) | 0 (0.0%) |
| 60 to 89 Minutes | 2 (3.4%) | 2 (6.1%) |
| 90 or more Minutes | 0 (0.0%) | 0 (0.0%) |
Time of Departure to Work by Sex in Center
The most frequent times of departure to work in Center are 6:30 AM to 6:59 AM (23, 39.0%) for males and 7:00 AM to 7:29 AM (11, 33.3%) for females.
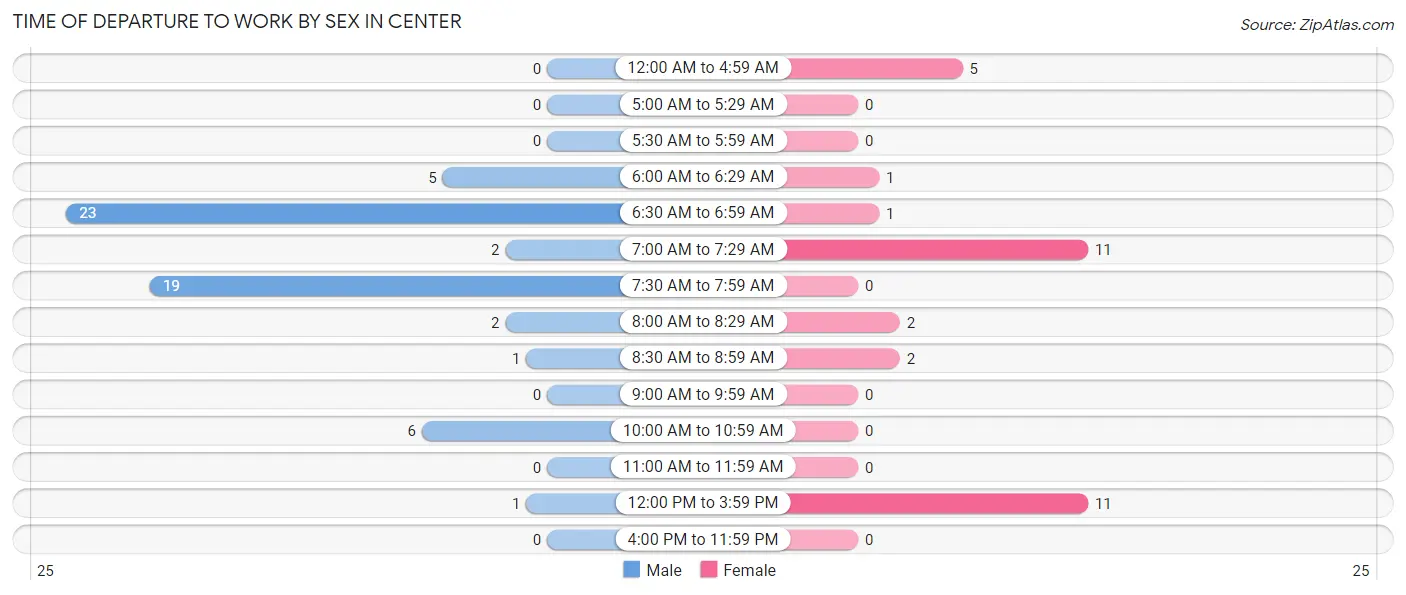
| Time of Departure | Male | Female |
| 12:00 AM to 4:59 AM | 0 (0.0%) | 5 (15.1%) |
| 5:00 AM to 5:29 AM | 0 (0.0%) | 0 (0.0%) |
| 5:30 AM to 5:59 AM | 0 (0.0%) | 0 (0.0%) |
| 6:00 AM to 6:29 AM | 5 (8.5%) | 1 (3.0%) |
| 6:30 AM to 6:59 AM | 23 (39.0%) | 1 (3.0%) |
| 7:00 AM to 7:29 AM | 2 (3.4%) | 11 (33.3%) |
| 7:30 AM to 7:59 AM | 19 (32.2%) | 0 (0.0%) |
| 8:00 AM to 8:29 AM | 2 (3.4%) | 2 (6.1%) |
| 8:30 AM to 8:59 AM | 1 (1.7%) | 2 (6.1%) |
| 9:00 AM to 9:59 AM | 0 (0.0%) | 0 (0.0%) |
| 10:00 AM to 10:59 AM | 6 (10.2%) | 0 (0.0%) |
| 11:00 AM to 11:59 AM | 0 (0.0%) | 0 (0.0%) |
| 12:00 PM to 3:59 PM | 1 (1.7%) | 11 (33.3%) |
| 4:00 PM to 11:59 PM | 0 (0.0%) | 0 (0.0%) |
| Total | 59 (100.0%) | 33 (100.0%) |
Housing Occupancy in Center
Occupancy by Ownership in Center
Of the total 44 dwellings in Center, owner-occupied units account for 37 (84.1%), while renter-occupied units make up 7 (15.9%).
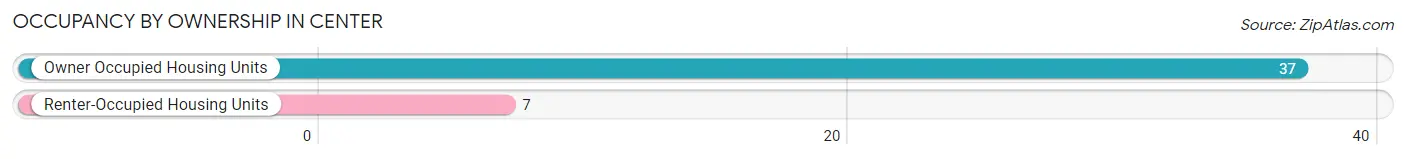
| Occupancy | # Housing Units | % Housing Units |
| Owner Occupied Housing Units | 37 | 84.1% |
| Renter-Occupied Housing Units | 7 | 15.9% |
| Total Occupied Housing Units | 44 | 100.0% |
Occupancy by Household Size in Center
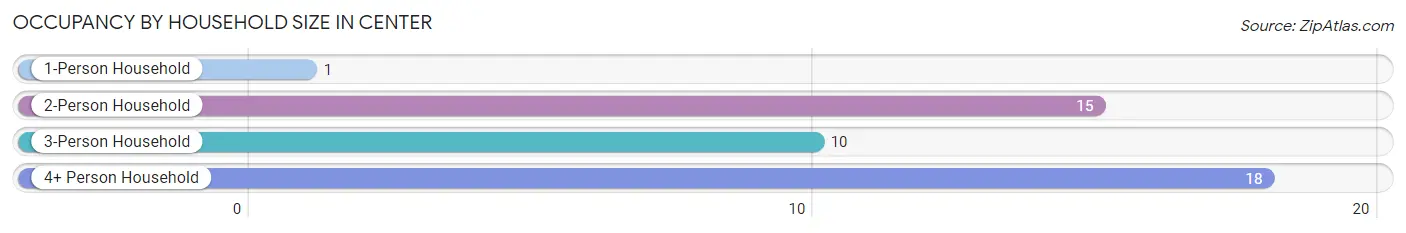
| Household Size | # Housing Units | % Housing Units |
| 1-Person Household | 1 | 2.3% |
| 2-Person Household | 15 | 34.1% |
| 3-Person Household | 10 | 22.7% |
| 4+ Person Household | 18 | 40.9% |
| Total Housing Units | 44 | 100.0% |
Occupancy by Ownership by Household Size in Center
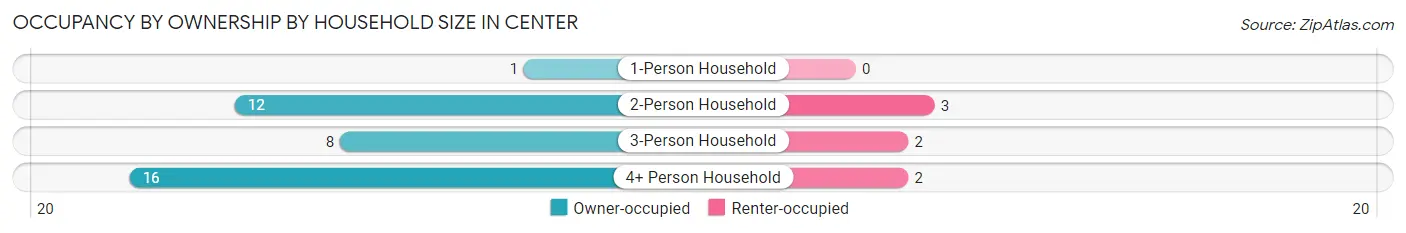
| Household Size | Owner-occupied | Renter-occupied |
| 1-Person Household | 1 (100.0%) | 0 (0.0%) |
| 2-Person Household | 12 (80.0%) | 3 (20.0%) |
| 3-Person Household | 8 (80.0%) | 2 (20.0%) |
| 4+ Person Household | 16 (88.9%) | 2 (11.1%) |
| Total Housing Units | 37 (84.1%) | 7 (15.9%) |
Occupancy by Educational Attainment in Center
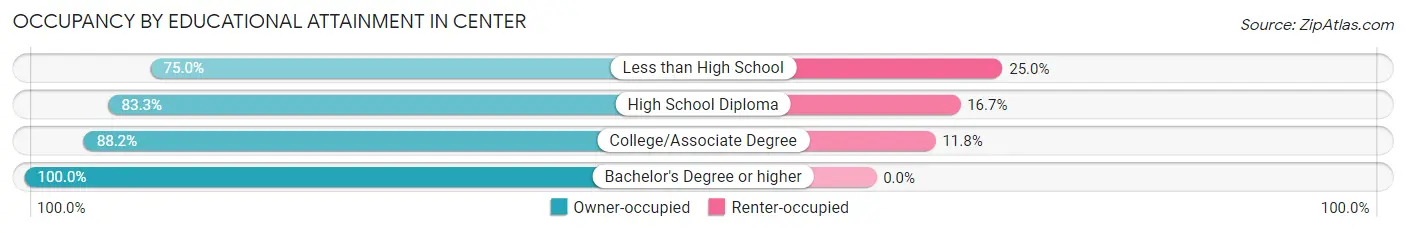
| Household Size | Owner-occupied | Renter-occupied |
| Less than High School | 9 (75.0%) | 3 (25.0%) |
| High School Diploma | 10 (83.3%) | 2 (16.7%) |
| College/Associate Degree | 15 (88.2%) | 2 (11.8%) |
| Bachelor's Degree or higher | 3 (100.0%) | 0 (0.0%) |
Occupancy by Age of Householder in Center
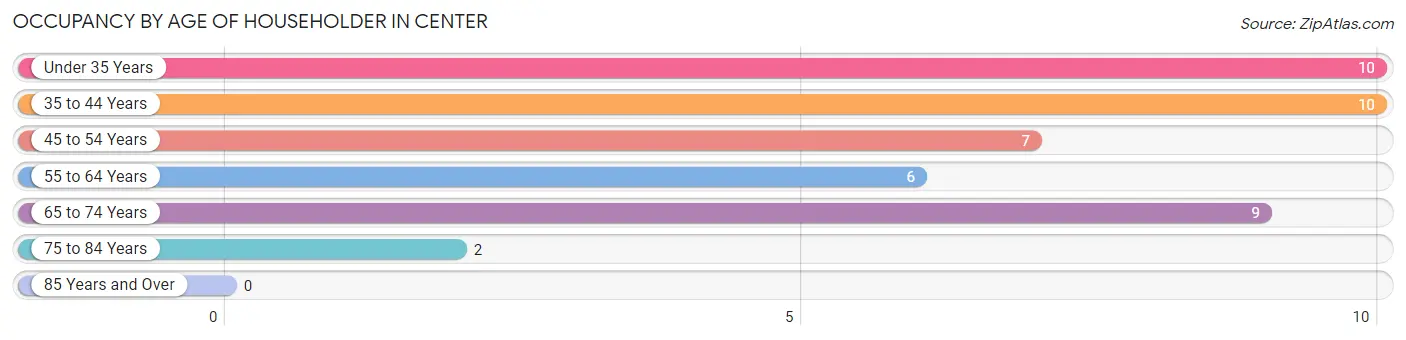
| Age Bracket | # Households | % Households |
| Under 35 Years | 10 | 22.7% |
| 35 to 44 Years | 10 | 22.7% |
| 45 to 54 Years | 7 | 15.9% |
| 55 to 64 Years | 6 | 13.6% |
| 65 to 74 Years | 9 | 20.4% |
| 75 to 84 Years | 2 | 4.5% |
| 85 Years and Over | 0 | 0.0% |
| Total | 44 | 100.0% |
Housing Finances in Center
Median Income by Occupancy in Center
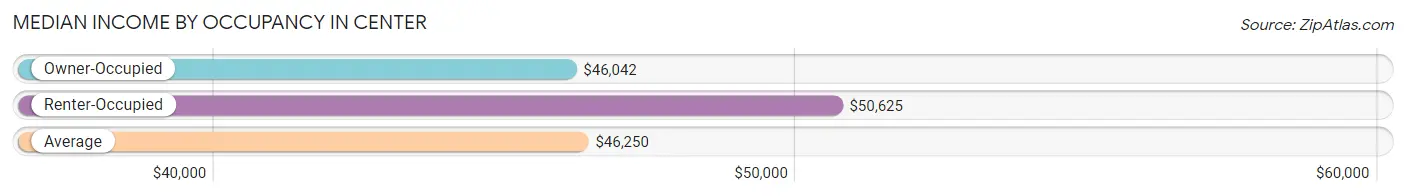
| Occupancy Type | # Households | Median Income |
| Owner-Occupied | 37 (84.1%) | $46,042 |
| Renter-Occupied | 7 (15.9%) | $50,625 |
| Average | 44 (100.0%) | $46,250 |
Occupancy by Householder Income Bracket in Center
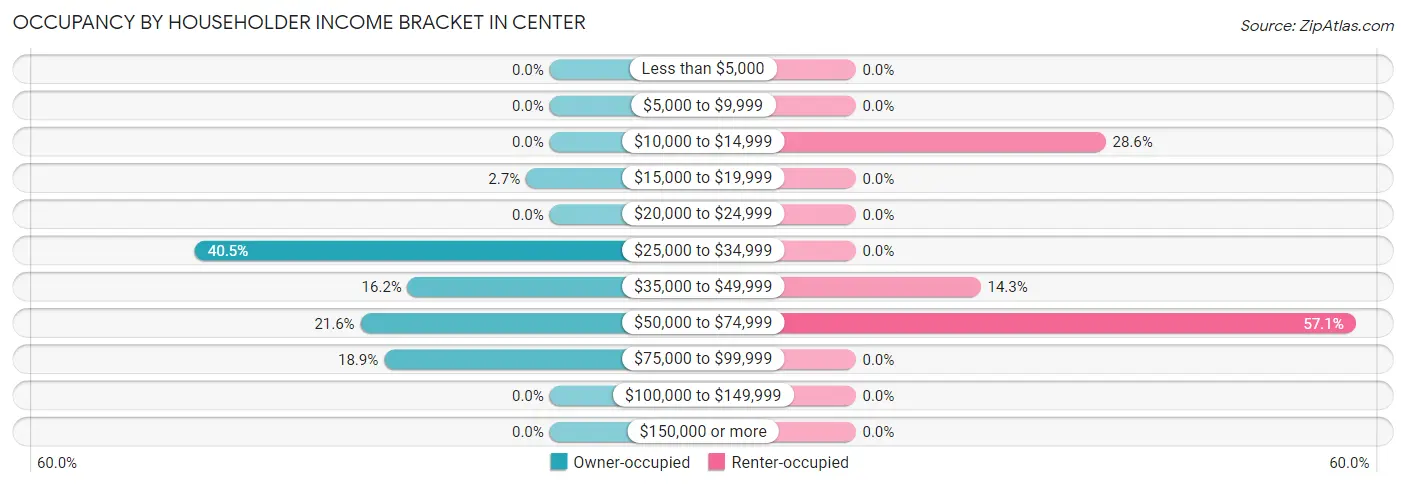
| Income Bracket | Owner-occupied | Renter-occupied |
| Less than $5,000 | 0 (0.0%) | 0 (0.0%) |
| $5,000 to $9,999 | 0 (0.0%) | 0 (0.0%) |
| $10,000 to $14,999 | 0 (0.0%) | 2 (28.6%) |
| $15,000 to $19,999 | 1 (2.7%) | 0 (0.0%) |
| $20,000 to $24,999 | 0 (0.0%) | 0 (0.0%) |
| $25,000 to $34,999 | 15 (40.5%) | 0 (0.0%) |
| $35,000 to $49,999 | 6 (16.2%) | 1 (14.3%) |
| $50,000 to $74,999 | 8 (21.6%) | 4 (57.1%) |
| $75,000 to $99,999 | 7 (18.9%) | 0 (0.0%) |
| $100,000 to $149,999 | 0 (0.0%) | 0 (0.0%) |
| $150,000 or more | 0 (0.0%) | 0 (0.0%) |
| Total | 37 (100.0%) | 7 (100.0%) |
Monthly Housing Cost Tiers in Center
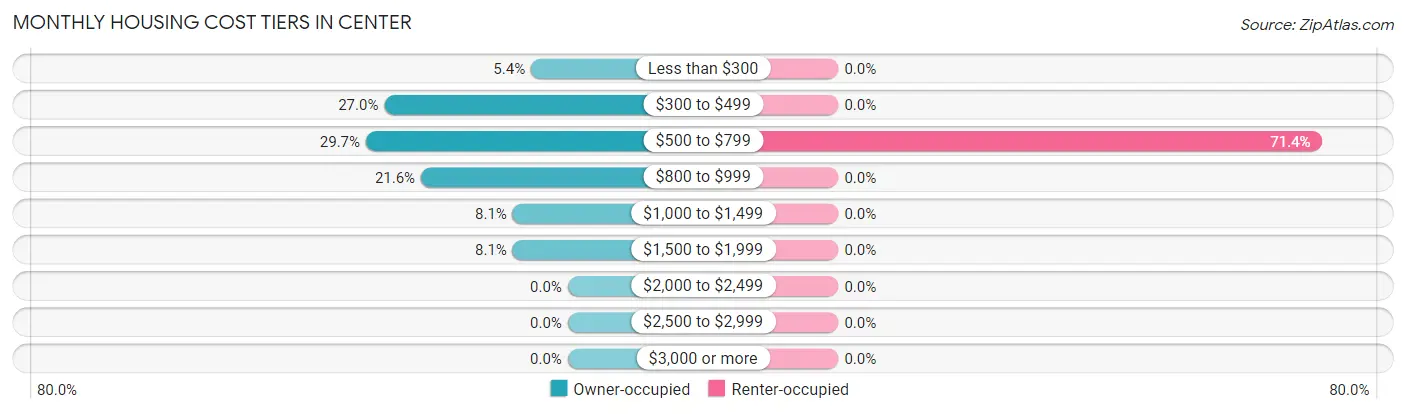
| Monthly Cost | Owner-occupied | Renter-occupied |
| Less than $300 | 2 (5.4%) | 0 (0.0%) |
| $300 to $499 | 10 (27.0%) | 0 (0.0%) |
| $500 to $799 | 11 (29.7%) | 5 (71.4%) |
| $800 to $999 | 8 (21.6%) | 0 (0.0%) |
| $1,000 to $1,499 | 3 (8.1%) | 0 (0.0%) |
| $1,500 to $1,999 | 3 (8.1%) | 0 (0.0%) |
| $2,000 to $2,499 | 0 (0.0%) | 0 (0.0%) |
| $2,500 to $2,999 | 0 (0.0%) | 0 (0.0%) |
| $3,000 or more | 0 (0.0%) | 0 (0.0%) |
| Total | 37 (100.0%) | 7 (100.0%) |
Physical Housing Characteristics in Center
Housing Structures in Center
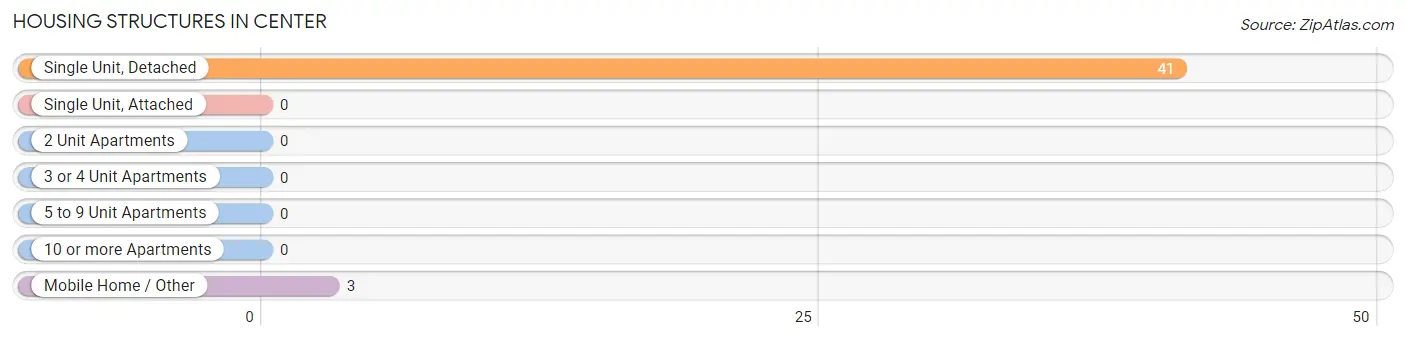
| Structure Type | # Housing Units | % Housing Units |
| Single Unit, Detached | 41 | 93.2% |
| Single Unit, Attached | 0 | 0.0% |
| 2 Unit Apartments | 0 | 0.0% |
| 3 or 4 Unit Apartments | 0 | 0.0% |
| 5 to 9 Unit Apartments | 0 | 0.0% |
| 10 or more Apartments | 0 | 0.0% |
| Mobile Home / Other | 3 | 6.8% |
| Total | 44 | 100.0% |
Housing Structures by Occupancy in Center
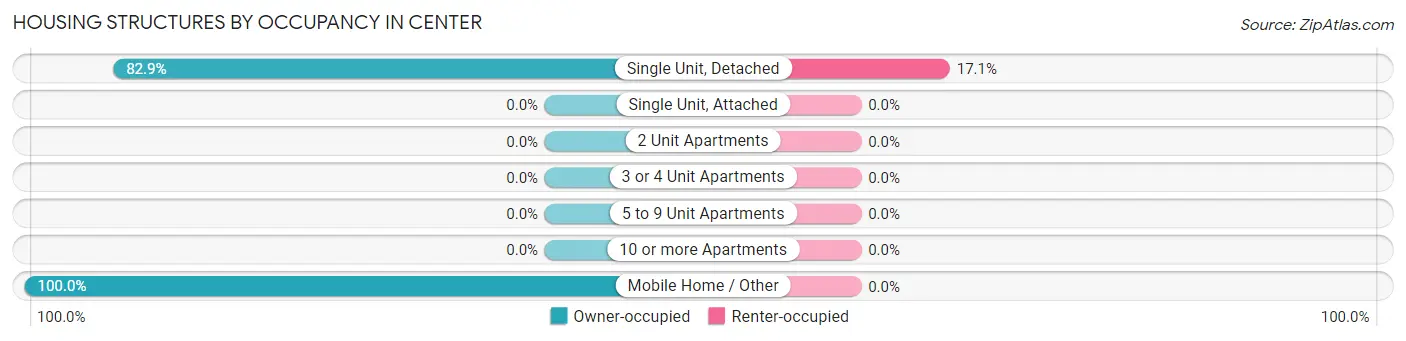
| Structure Type | Owner-occupied | Renter-occupied |
| Single Unit, Detached | 34 (82.9%) | 7 (17.1%) |
| Single Unit, Attached | 0 (0.0%) | 0 (0.0%) |
| 2 Unit Apartments | 0 (0.0%) | 0 (0.0%) |
| 3 or 4 Unit Apartments | 0 (0.0%) | 0 (0.0%) |
| 5 to 9 Unit Apartments | 0 (0.0%) | 0 (0.0%) |
| 10 or more Apartments | 0 (0.0%) | 0 (0.0%) |
| Mobile Home / Other | 3 (100.0%) | 0 (0.0%) |
| Total | 37 (84.1%) | 7 (15.9%) |
Housing Structures by Number of Rooms in Center
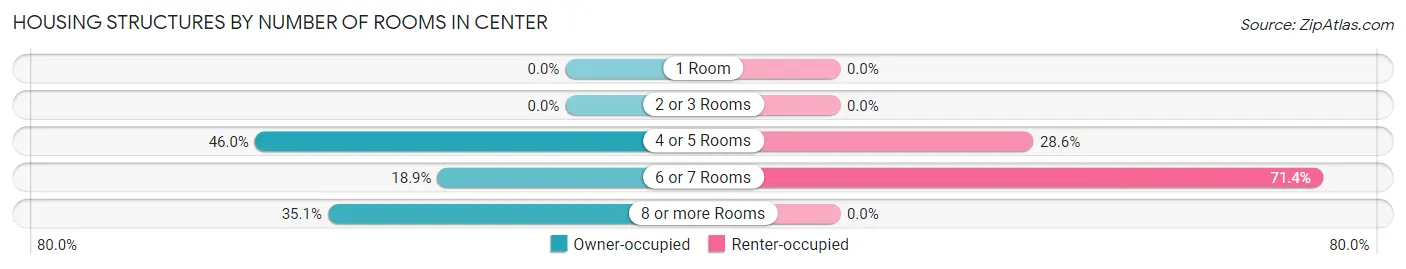
| Number of Rooms | Owner-occupied | Renter-occupied |
| 1 Room | 0 (0.0%) | 0 (0.0%) |
| 2 or 3 Rooms | 0 (0.0%) | 0 (0.0%) |
| 4 or 5 Rooms | 17 (46.0%) | 2 (28.6%) |
| 6 or 7 Rooms | 7 (18.9%) | 5 (71.4%) |
| 8 or more Rooms | 13 (35.1%) | 0 (0.0%) |
| Total | 37 (100.0%) | 7 (100.0%) |
Housing Structure by Heating Type in Center
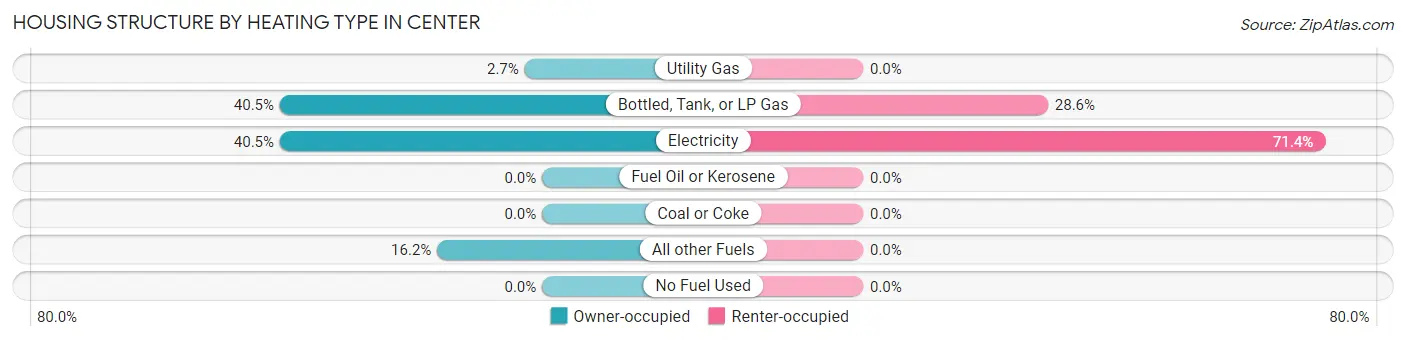
| Heating Type | Owner-occupied | Renter-occupied |
| Utility Gas | 1 (2.7%) | 0 (0.0%) |
| Bottled, Tank, or LP Gas | 15 (40.5%) | 2 (28.6%) |
| Electricity | 15 (40.5%) | 5 (71.4%) |
| Fuel Oil or Kerosene | 0 (0.0%) | 0 (0.0%) |
| Coal or Coke | 0 (0.0%) | 0 (0.0%) |
| All other Fuels | 6 (16.2%) | 0 (0.0%) |
| No Fuel Used | 0 (0.0%) | 0 (0.0%) |
| Total | 37 (100.0%) | 7 (100.0%) |
Household Vehicle Usage in Center
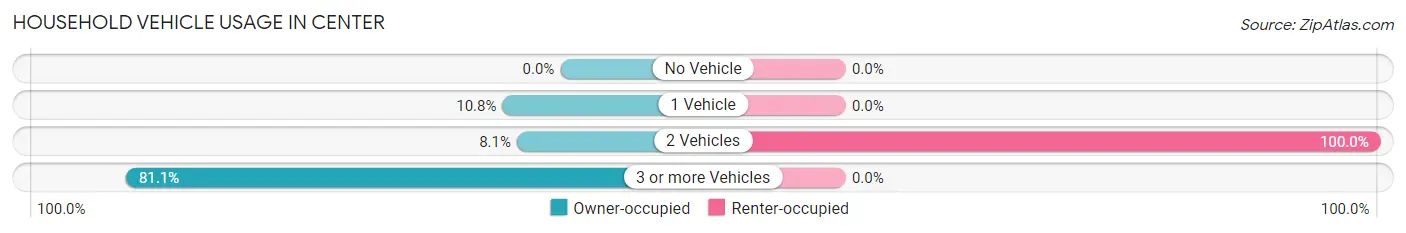
| Vehicles per Household | Owner-occupied | Renter-occupied |
| No Vehicle | 0 (0.0%) | 0 (0.0%) |
| 1 Vehicle | 4 (10.8%) | 0 (0.0%) |
| 2 Vehicles | 3 (8.1%) | 7 (100.0%) |
| 3 or more Vehicles | 30 (81.1%) | 0 (0.0%) |
| Total | 37 (100.0%) | 7 (100.0%) |
Real Estate & Mortgages in Center
Real Estate and Mortgage Overview in Center
| Characteristic | Without Mortgage | With Mortgage |
| Housing Units | 22 | 15 |
| Median Property Value | $35,700 | $69,200 |
| Median Household Income | $29,375 | $0 |
| Monthly Housing Costs | $489 | $0 |
| Real Estate Taxes | $386 | $2 |
Property Value by Mortgage Status in Center
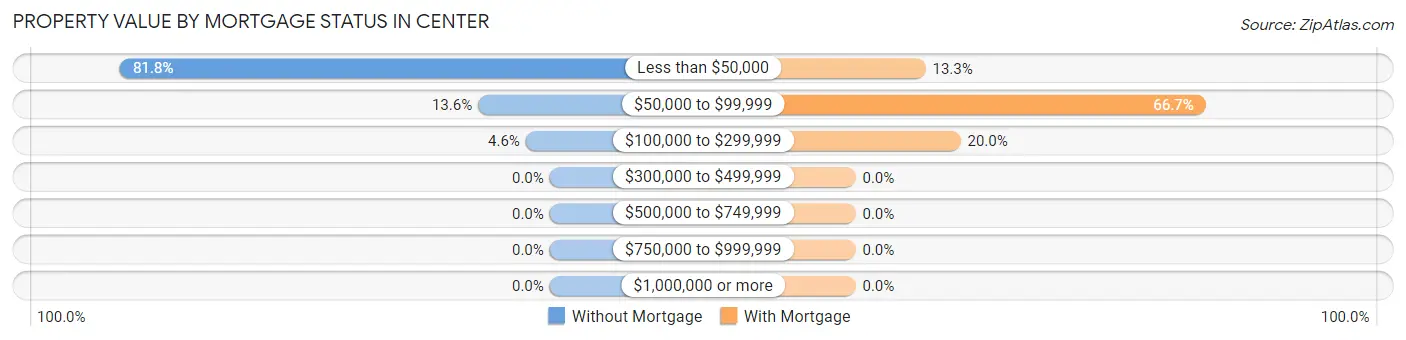
| Property Value | Without Mortgage | With Mortgage |
| Less than $50,000 | 18 (81.8%) | 2 (13.3%) |
| $50,000 to $99,999 | 3 (13.6%) | 10 (66.7%) |
| $100,000 to $299,999 | 1 (4.5%) | 3 (20.0%) |
| $300,000 to $499,999 | 0 (0.0%) | 0 (0.0%) |
| $500,000 to $749,999 | 0 (0.0%) | 0 (0.0%) |
| $750,000 to $999,999 | 0 (0.0%) | 0 (0.0%) |
| $1,000,000 or more | 0 (0.0%) | 0 (0.0%) |
| Total | 22 (100.0%) | 15 (100.0%) |
Household Income by Mortgage Status in Center
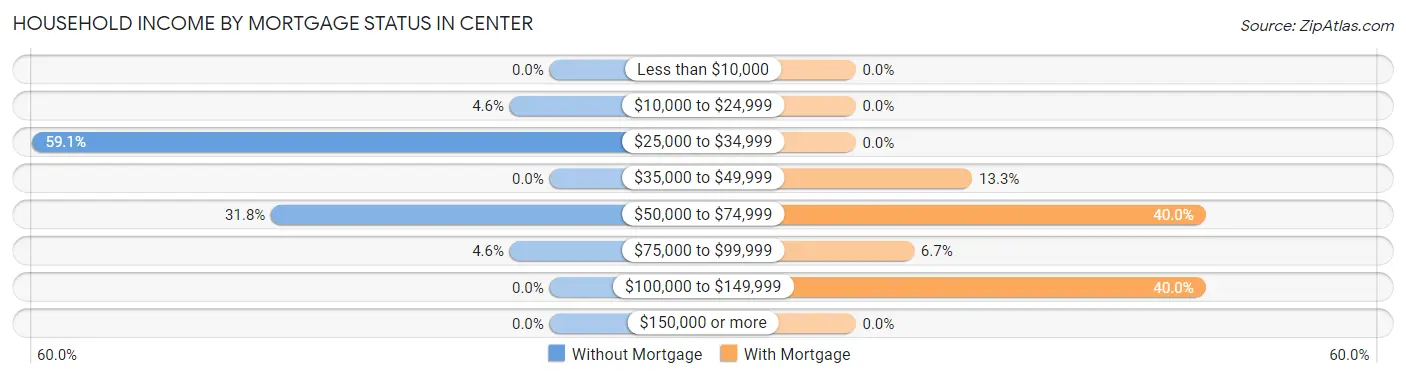
| Household Income | Without Mortgage | With Mortgage |
| Less than $10,000 | 0 (0.0%) | 0 (0.0%) |
| $10,000 to $24,999 | 1 (4.5%) | 0 (0.0%) |
| $25,000 to $34,999 | 13 (59.1%) | 0 (0.0%) |
| $35,000 to $49,999 | 0 (0.0%) | 2 (13.3%) |
| $50,000 to $74,999 | 7 (31.8%) | 6 (40.0%) |
| $75,000 to $99,999 | 1 (4.5%) | 1 (6.7%) |
| $100,000 to $149,999 | 0 (0.0%) | 6 (40.0%) |
| $150,000 or more | 0 (0.0%) | 0 (0.0%) |
| Total | 22 (100.0%) | 15 (100.0%) |
Property Value to Household Income Ratio in Center
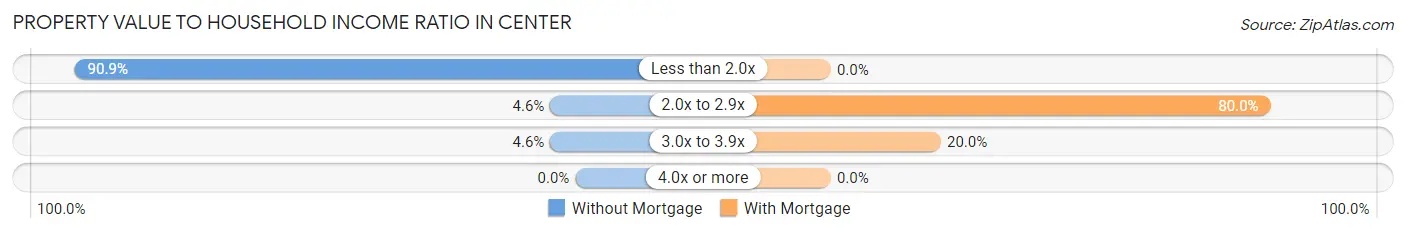
| Value-to-Income Ratio | Without Mortgage | With Mortgage |
| Less than 2.0x | 20 (90.9%) | 0 (0.0%) |
| 2.0x to 2.9x | 1 (4.5%) | 12 (80.0%) |
| 3.0x to 3.9x | 1 (4.5%) | 3 (20.0%) |
| 4.0x or more | 0 (0.0%) | 0 (0.0%) |
| Total | 22 (100.0%) | 15 (100.0%) |
Real Estate Taxes by Mortgage Status in Center
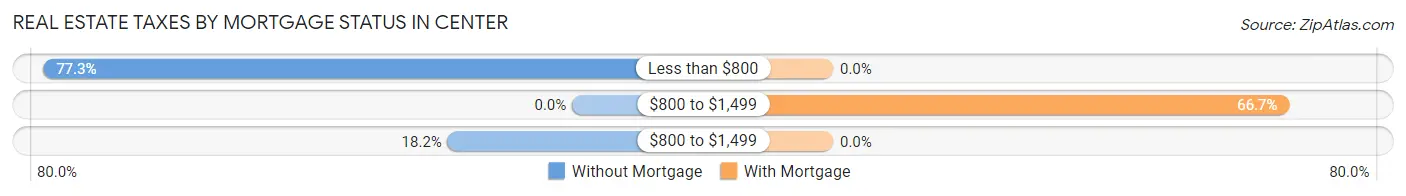
| Property Taxes | Without Mortgage | With Mortgage |
| Less than $800 | 17 (77.3%) | 0 (0.0%) |
| $800 to $1,499 | 0 (0.0%) | 10 (66.7%) |
| $800 to $1,499 | 4 (18.2%) | 0 (0.0%) |
| Total | 22 (100.0%) | 15 (100.0%) |
Health & Disability in Center
Health Insurance Coverage by Age in Center
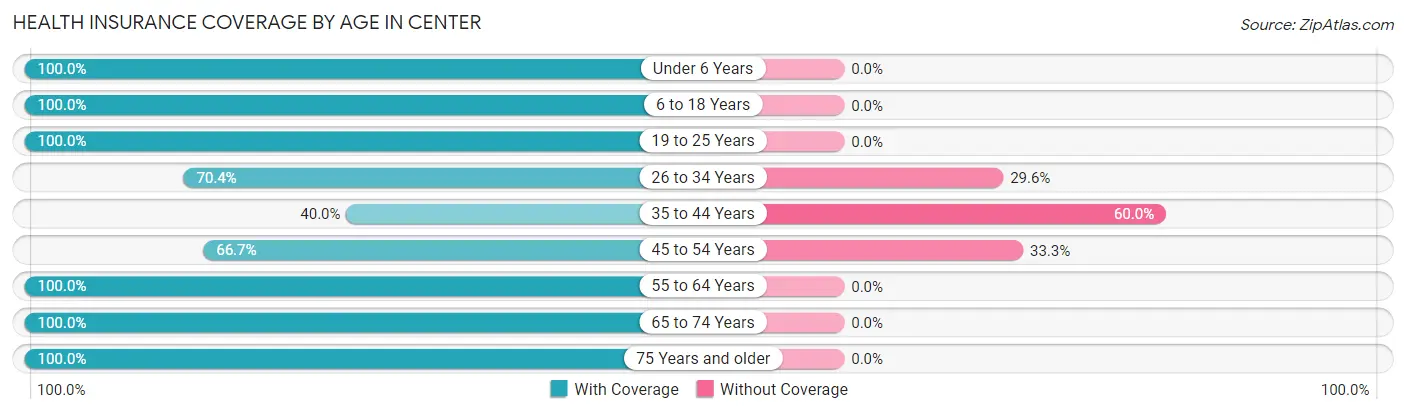
| Age Bracket | With Coverage | Without Coverage |
| Under 6 Years | 27 (100.0%) | 0 (0.0%) |
| 6 to 18 Years | 27 (100.0%) | 0 (0.0%) |
| 19 to 25 Years | 52 (100.0%) | 0 (0.0%) |
| 26 to 34 Years | 19 (70.4%) | 8 (29.6%) |
| 35 to 44 Years | 6 (40.0%) | 9 (60.0%) |
| 45 to 54 Years | 12 (66.7%) | 6 (33.3%) |
| 55 to 64 Years | 9 (100.0%) | 0 (0.0%) |
| 65 to 74 Years | 11 (100.0%) | 0 (0.0%) |
| 75 Years and older | 4 (100.0%) | 0 (0.0%) |
| Total | 167 (87.9%) | 23 (12.1%) |
Health Insurance Coverage by Citizenship Status in Center
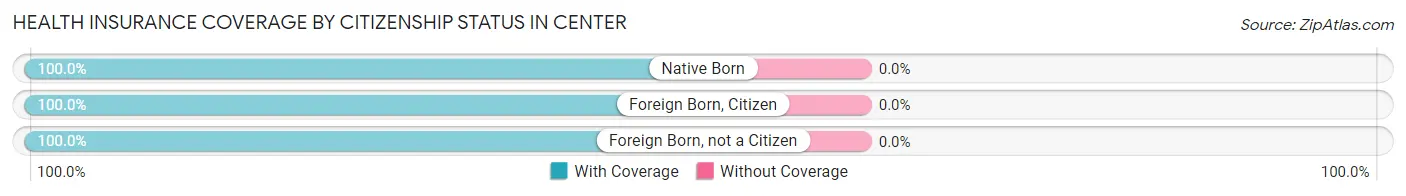
| Citizenship Status | With Coverage | Without Coverage |
| Native Born | 27 (100.0%) | 0 (0.0%) |
| Foreign Born, Citizen | 27 (100.0%) | 0 (0.0%) |
| Foreign Born, not a Citizen | 52 (100.0%) | 0 (0.0%) |
Health Insurance Coverage by Household Income in Center
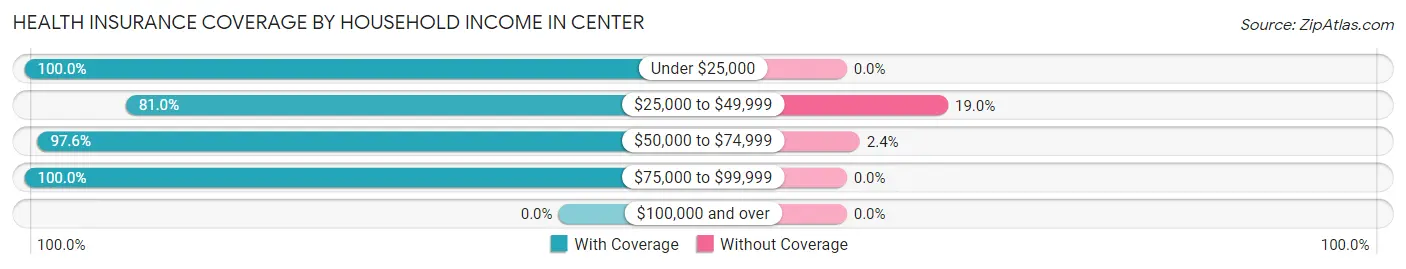
| Household Income | With Coverage | Without Coverage |
| Under $25,000 | 13 (100.0%) | 0 (0.0%) |
| $25,000 to $49,999 | 94 (81.0%) | 22 (19.0%) |
| $50,000 to $74,999 | 40 (97.6%) | 1 (2.4%) |
| $75,000 to $99,999 | 20 (100.0%) | 0 (0.0%) |
| $100,000 and over | 0 (0.0%) | 0 (0.0%) |
Public vs Private Health Insurance Coverage by Age in Center
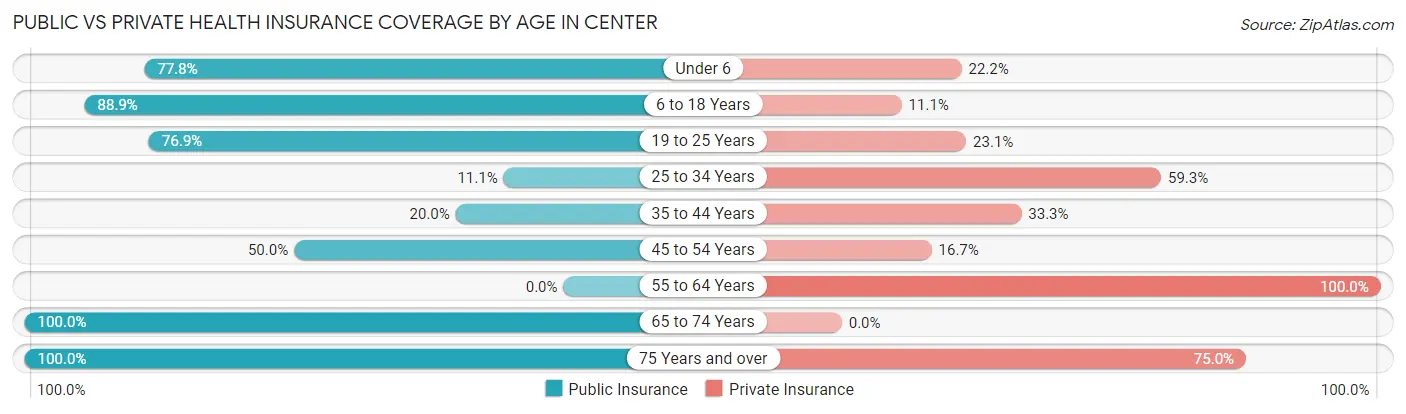
| Age Bracket | Public Insurance | Private Insurance |
| Under 6 | 21 (77.8%) | 6 (22.2%) |
| 6 to 18 Years | 24 (88.9%) | 3 (11.1%) |
| 19 to 25 Years | 40 (76.9%) | 12 (23.1%) |
| 25 to 34 Years | 3 (11.1%) | 16 (59.3%) |
| 35 to 44 Years | 3 (20.0%) | 5 (33.3%) |
| 45 to 54 Years | 9 (50.0%) | 3 (16.7%) |
| 55 to 64 Years | 0 (0.0%) | 9 (100.0%) |
| 65 to 74 Years | 11 (100.0%) | 0 (0.0%) |
| 75 Years and over | 4 (100.0%) | 3 (75.0%) |
| Total | 115 (60.5%) | 57 (30.0%) |
Disability Status by Sex by Age in Center
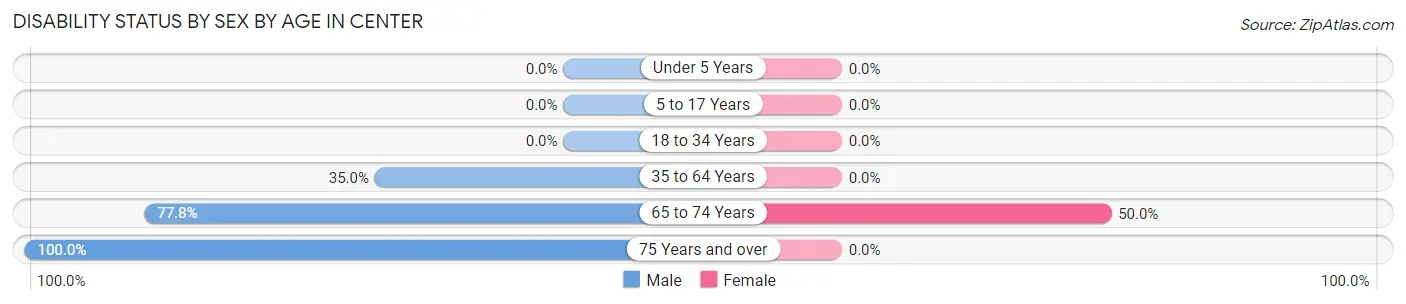
| Age Bracket | Male | Female |
| Under 5 Years | 0 (0.0%) | 0 (0.0%) |
| 5 to 17 Years | 0 (0.0%) | 0 (0.0%) |
| 18 to 34 Years | 0 (0.0%) | 0 (0.0%) |
| 35 to 64 Years | 7 (35.0%) | 0 (0.0%) |
| 65 to 74 Years | 7 (77.8%) | 1 (50.0%) |
| 75 Years and over | 1 (100.0%) | 0 (0.0%) |
Disability Class by Sex by Age in Center
Disability Class: Hearing Difficulty
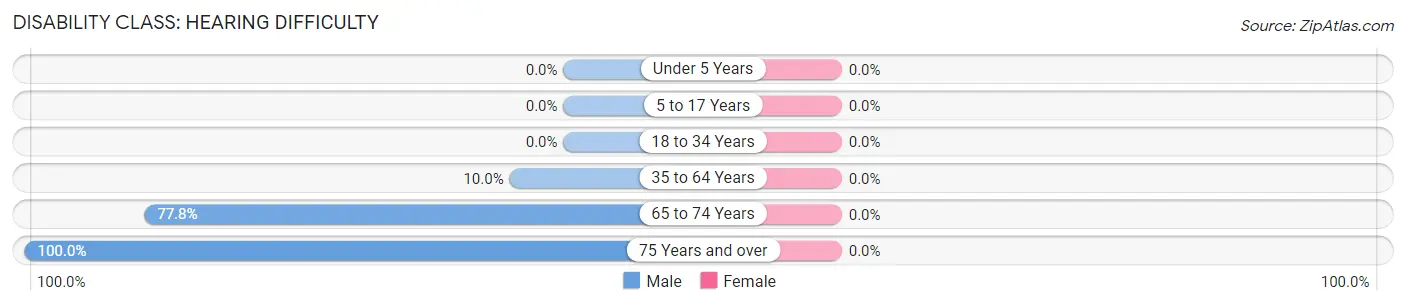
| Age Bracket | Male | Female |
| Under 5 Years | 0 (0.0%) | 0 (0.0%) |
| 5 to 17 Years | 0 (0.0%) | 0 (0.0%) |
| 18 to 34 Years | 0 (0.0%) | 0 (0.0%) |
| 35 to 64 Years | 2 (10.0%) | 0 (0.0%) |
| 65 to 74 Years | 7 (77.8%) | 0 (0.0%) |
| 75 Years and over | 1 (100.0%) | 0 (0.0%) |
Disability Class: Vision Difficulty
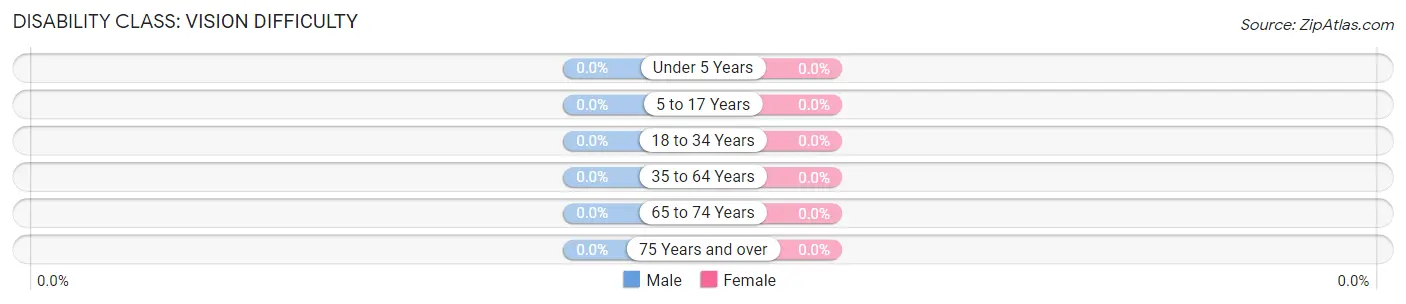
| Age Bracket | Male | Female |
| Under 5 Years | 0 (0.0%) | 0 (0.0%) |
| 5 to 17 Years | 0 (0.0%) | 0 (0.0%) |
| 18 to 34 Years | 0 (0.0%) | 0 (0.0%) |
| 35 to 64 Years | 0 (0.0%) | 0 (0.0%) |
| 65 to 74 Years | 0 (0.0%) | 0 (0.0%) |
| 75 Years and over | 0 (0.0%) | 0 (0.0%) |
Disability Class: Cognitive Difficulty
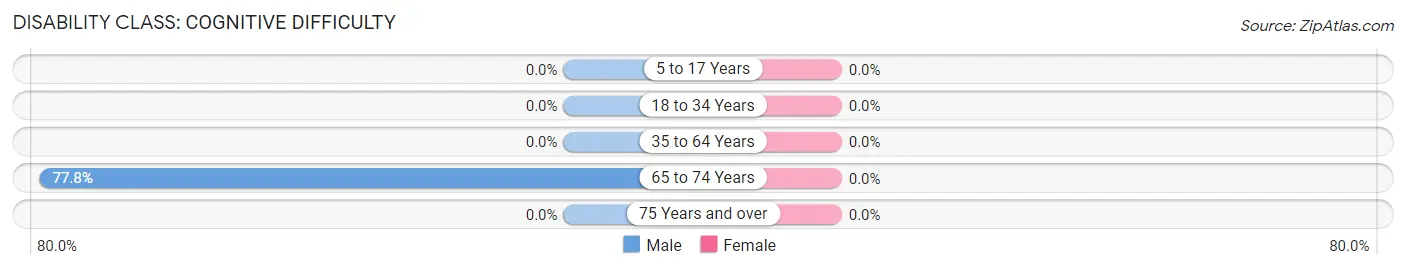
| Age Bracket | Male | Female |
| 5 to 17 Years | 0 (0.0%) | 0 (0.0%) |
| 18 to 34 Years | 0 (0.0%) | 0 (0.0%) |
| 35 to 64 Years | 0 (0.0%) | 0 (0.0%) |
| 65 to 74 Years | 7 (77.8%) | 0 (0.0%) |
| 75 Years and over | 0 (0.0%) | 0 (0.0%) |
Disability Class: Ambulatory Difficulty
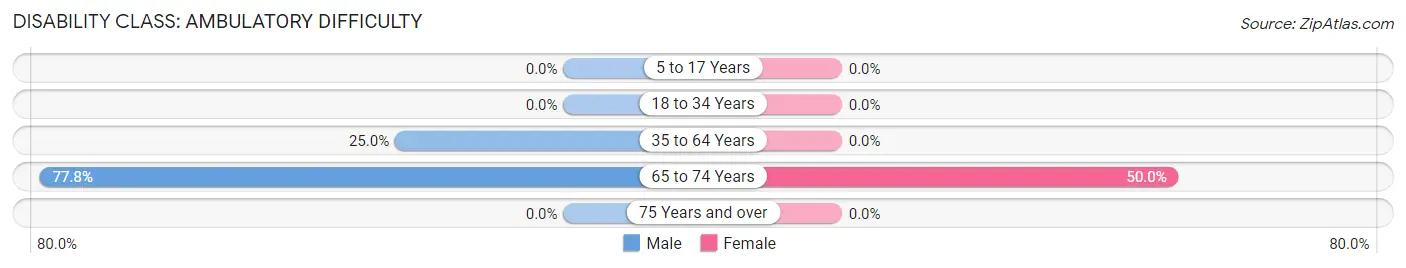
| Age Bracket | Male | Female |
| 5 to 17 Years | 0 (0.0%) | 0 (0.0%) |
| 18 to 34 Years | 0 (0.0%) | 0 (0.0%) |
| 35 to 64 Years | 5 (25.0%) | 0 (0.0%) |
| 65 to 74 Years | 7 (77.8%) | 1 (50.0%) |
| 75 Years and over | 0 (0.0%) | 0 (0.0%) |
Disability Class: Self-Care Difficulty
| Age Bracket | Male | Female |
| 5 to 17 Years | 0 (0.0%) | 0 (0.0%) |
| 18 to 34 Years | 0 (0.0%) | 0 (0.0%) |
| 35 to 64 Years | 0 (0.0%) | 0 (0.0%) |
| 65 to 74 Years | 0 (0.0%) | 0 (0.0%) |
| 75 Years and over | 0 (0.0%) | 0 (0.0%) |
Technology Access in Center
Computing Device Access in Center
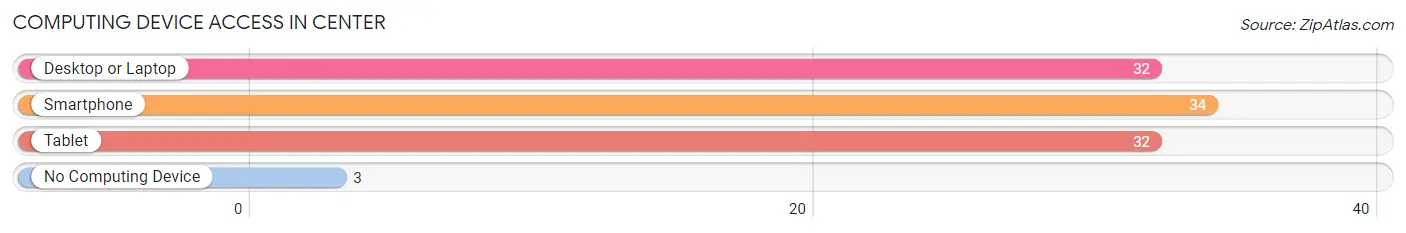
| Device Type | # Households | % Households |
| Desktop or Laptop | 32 | 72.7% |
| Smartphone | 34 | 77.3% |
| Tablet | 32 | 72.7% |
| No Computing Device | 3 | 6.8% |
| Total | 44 | 100.0% |
Internet Access in Center
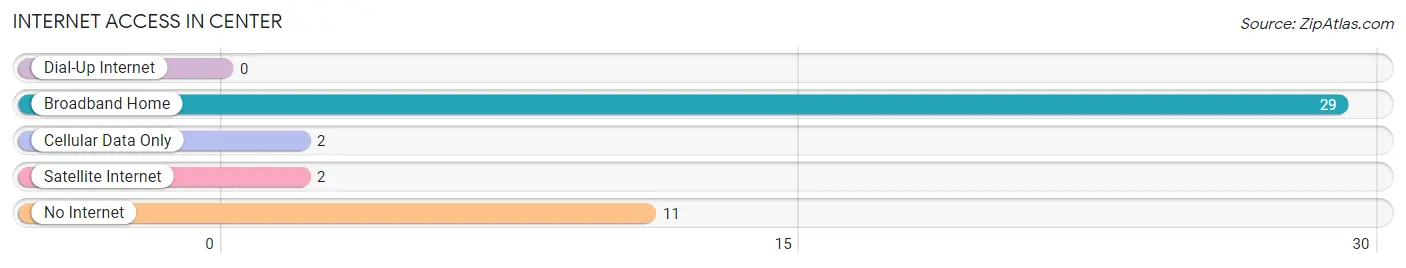
| Internet Type | # Households | % Households |
| Dial-Up Internet | 0 | 0.0% |
| Broadband Home | 29 | 65.9% |
| Cellular Data Only | 2 | 4.5% |
| Satellite Internet | 2 | 4.5% |
| No Internet | 11 | 25.0% |
| Total | 44 | 100.0% |
Center Summary
NE History
Northeast (NE) is a region of the United States that includes the states of Connecticut, Maine, Massachusetts, New Hampshire, Rhode Island, and Vermont. The region is known for its rich history, which dates back to the early 1600s when the first European settlers arrived in the area. The region was initially inhabited by Native American tribes, including the Abenaki, Mohegan, and Pequot. The first permanent English settlement in the region was established in 1620 in Plymouth, Massachusetts.
The region was a major center of the American Revolution, with many battles taking place in the area. The region was also a major center of the Industrial Revolution, with many factories and mills being built in the area. The region was also a major center of the abolitionist movement, with many prominent abolitionists coming from the region.
The region has a long and varied history, with many different cultures and influences. The region has been home to many different ethnic and religious groups, including Irish, French, Italian, and Jewish immigrants. The region has also been home to many prominent figures in American history, including John Adams, Benjamin Franklin, and Alexander Hamilton.
Geography
The Northeast region of the United States is located in the northeastern corner of the country. It is bordered by Canada to the north, the Atlantic Ocean to the east, the Appalachian Mountains to the west, and the Great Lakes to the northwest. The region is divided into six states: Connecticut, Maine, Massachusetts, New Hampshire, Rhode Island, and Vermont.
The region is known for its varied geography, with many different types of terrain. The region is home to many different types of forests, including deciduous, coniferous, and mixed forests. The region is also home to many different types of bodies of water, including rivers, lakes, and coastal areas. The region is also home to many different types of wildlife, including deer, moose, and black bears.
Economy
The economy of the Northeast region of the United States is largely based on services and manufacturing. The region is home to many large cities, including Boston, New York City, and Philadelphia. These cities are major centers of finance, technology, and culture. The region is also home to many universities, including Harvard, Yale, and the University of Pennsylvania.
The region is also home to many large companies, including General Electric, IBM, and Pfizer. The region is also home to many smaller companies, including tech startups and small businesses. The region is also home to many tourist attractions, including the Statue of Liberty, the Freedom Trail, and the White Mountains.
Demographics
The population of the Northeast region of the United States is estimated to be around 55 million people. The region is home to many different ethnic and racial groups, including African Americans, Hispanics, Asians, and Native Americans. The region is also home to many different religious groups, including Christians, Jews, and Muslims.
The region is also home to many different languages, including English, Spanish, French, and Portuguese. The region is also home to many different cultures, including Irish, Italian, and French. The region is also home to many different types of lifestyles, including urban, suburban, and rural.
Conclusion
The Northeast region of the United States is a region with a rich history, varied geography, and diverse population. The region is home to many different cultures, religions, and languages. The region is also home to many large cities, universities, and companies. The region is also home to many tourist attractions and small businesses. The region is an important part of the United States and has played a major role in the country’s history, economy, and culture.
Common Questions
What is Per Capita Income in Center?
Per Capita income in Center is $13,442.
What is the Median Family Income in Center?
Median Family Income in Center is $41,250.
What is the Median Household income in Center?
Median Household Income in Center is $46,250.
What is Inequality or Gini Index in Center?
Inequality or Gini Index in Center is 0.28.
What is the Total Population of Center?
Total Population of Center is 199.
What is the Total Male Population of Center?
Total Male Population of Center is 95.
What is the Total Female Population of Center?
Total Female Population of Center is 104.
What is the Ratio of Males per 100 Females in Center?
There are 91.35 Males per 100 Females in Center.
What is the Ratio of Females per 100 Males in Center?
There are 109.47 Females per 100 Males in Center.
What is the Median Population Age in Center?
Median Population Age in Center is 21.9 Years.
What is the Average Family Size in Center
Average Family Size in Center is 4.2 People.
What is the Average Household Size in Center
Average Household Size in Center is 4.3 People.
How Large is the Labor Force in Center?
There are 112 People in the Labor Forcein in Center.
What is the Percentage of People in the Labor Force in Center?
70.9% of People are in the Labor Force in Center.
What is the Unemployment Rate in Center?
Unemployment Rate in Center is 16.1%.