Page, NE Map & Demographics
Page Map
Page Overview
$35,723
PER CAPITA INCOME
$101,250
AVG FAMILY INCOME
$63,750
AVG HOUSEHOLD INCOME
0.35
INEQUALITY / GINI INDEX
130
TOTAL POPULATION
71
MALE POPULATION
59
FEMALE POPULATION
120.34
MALES / 100 FEMALES
83.10
FEMALES / 100 MALES
46.5
MEDIAN AGE
2.9
AVG FAMILY SIZE
2.5
AVG HOUSEHOLD SIZE
66
LABOR FORCE [ PEOPLE ]
67.3%
PERCENT IN LABOR FORCE
Page Zip Codes
Page Area Codes
Income in Page
Income Overview in Page
Per Capita Income in Page is $35,723, while median incomes of families and households are $101,250 and $63,750 respectively.
| Characteristic | Number | Measure |
| Per Capita Income | 130 | $35,723 |
| Median Family Income | 40 | $101,250 |
| Mean Family Income | 40 | $106,690 |
| Median Household Income | 53 | $63,750 |
| Mean Household Income | 53 | $90,275 |
| Income Deficit | 40 | $0 |
| Wage / Income Gap (%) | 130 | 0.00% |
| Wage / Income Gap ($) | 130 | 100.00¢ per $1 |
| Gini / Inequality Index | 130 | 0.35 |
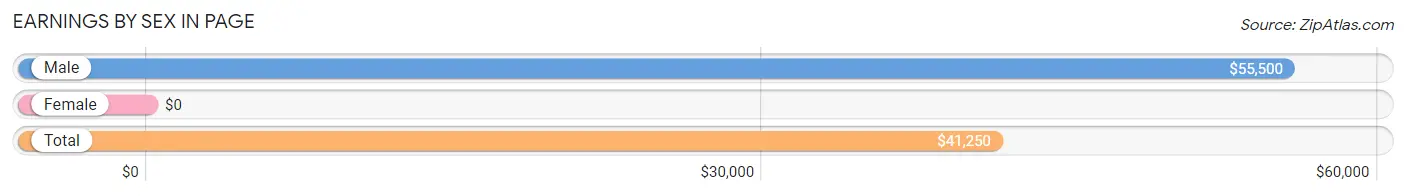
Earnings by Sex in Page
| Sex | Number | Average Earnings |
| Male | 40 (60.6%) | $55,500 |
| Female | 26 (39.4%) | $0 |
| Total | 66 (100.0%) | $41,250 |
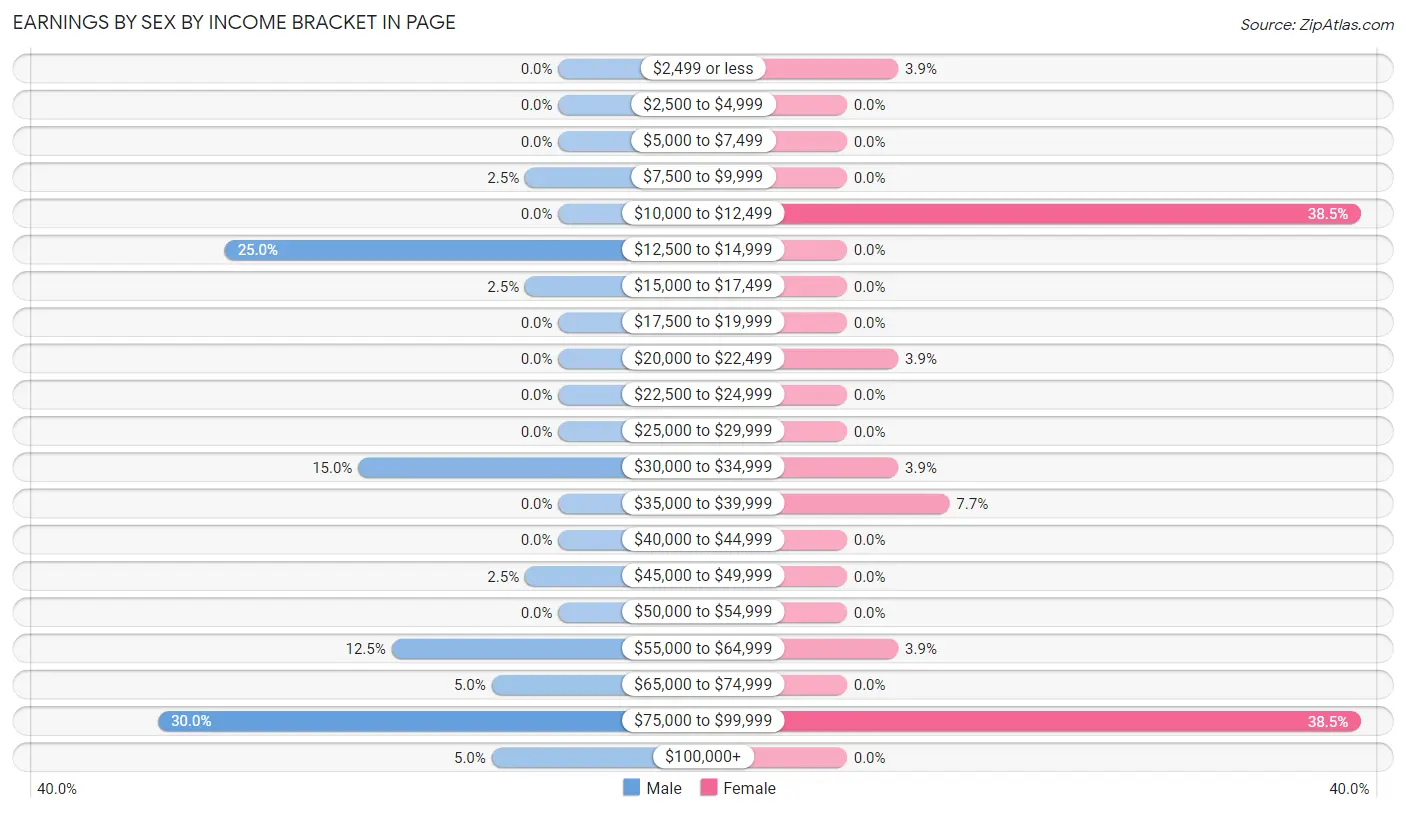
Earnings by Sex by Income Bracket in Page
The most common earnings brackets in Page are $75,000 to $99,999 for men (12 | 30.0%) and $10,000 to $12,499 for women (10 | 38.5%).
| Income | Male | Female |
| $2,499 or less | 0 (0.0%) | 1 (3.8%) |
| $2,500 to $4,999 | 0 (0.0%) | 0 (0.0%) |
| $5,000 to $7,499 | 0 (0.0%) | 0 (0.0%) |
| $7,500 to $9,999 | 1 (2.5%) | 0 (0.0%) |
| $10,000 to $12,499 | 0 (0.0%) | 10 (38.5%) |
| $12,500 to $14,999 | 10 (25.0%) | 0 (0.0%) |
| $15,000 to $17,499 | 1 (2.5%) | 0 (0.0%) |
| $17,500 to $19,999 | 0 (0.0%) | 0 (0.0%) |
| $20,000 to $22,499 | 0 (0.0%) | 1 (3.8%) |
| $22,500 to $24,999 | 0 (0.0%) | 0 (0.0%) |
| $25,000 to $29,999 | 0 (0.0%) | 0 (0.0%) |
| $30,000 to $34,999 | 6 (15.0%) | 1 (3.8%) |
| $35,000 to $39,999 | 0 (0.0%) | 2 (7.7%) |
| $40,000 to $44,999 | 0 (0.0%) | 0 (0.0%) |
| $45,000 to $49,999 | 1 (2.5%) | 0 (0.0%) |
| $50,000 to $54,999 | 0 (0.0%) | 0 (0.0%) |
| $55,000 to $64,999 | 5 (12.5%) | 1 (3.8%) |
| $65,000 to $74,999 | 2 (5.0%) | 0 (0.0%) |
| $75,000 to $99,999 | 12 (30.0%) | 10 (38.5%) |
| $100,000+ | 2 (5.0%) | 0 (0.0%) |
| Total | 40 (100.0%) | 26 (100.0%) |
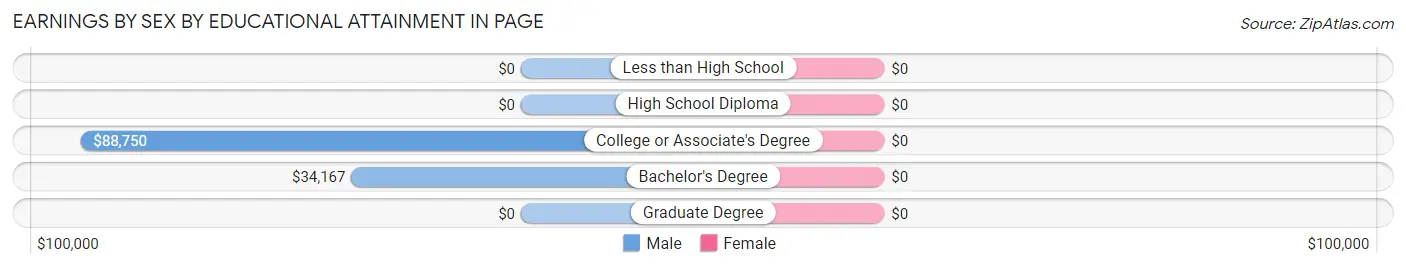
Earnings by Sex by Educational Attainment in Page
| Educational Attainment | Male Income | Female Income |
| Less than High School | - | - |
| High School Diploma | - | - |
| College or Associate's Degree | $88,750 | $0 |
| Bachelor's Degree | $34,167 | $0 |
| Graduate Degree | - | - |
| Total | $55,500 | $0 |
Family Income in Page
Family Income Brackets in Page
According to the Page family income data, there are 12 families falling into the $100,000 to $149,999 income range, which is the most common income bracket and makes up 30.0% of all families.
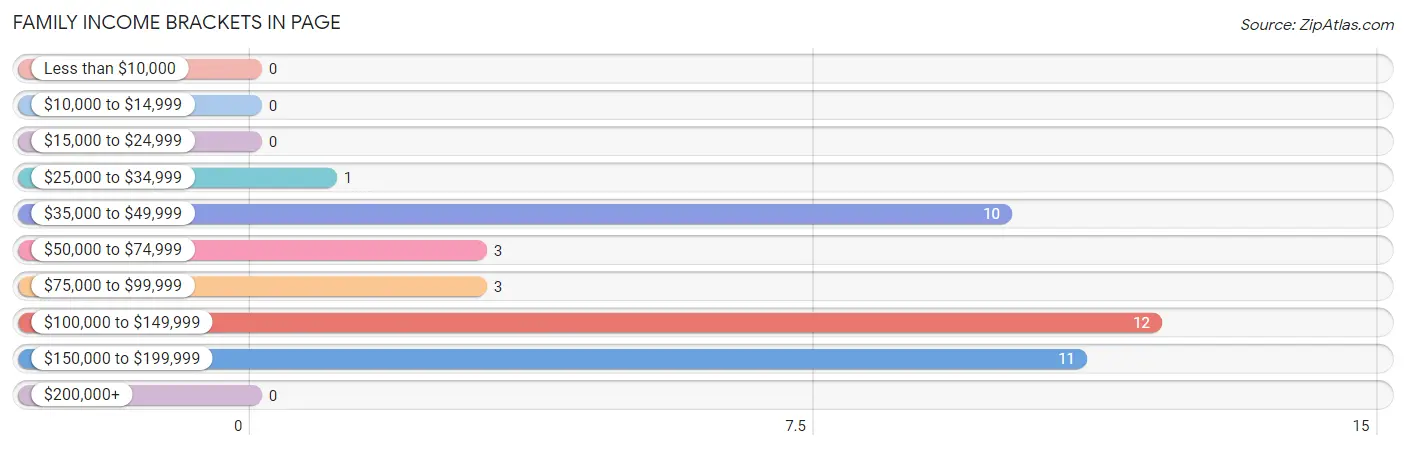
| Income Bracket | # Families | % Families |
| Less than $10,000 | 0 | 0.0% |
| $10,000 to $14,999 | 0 | 0.0% |
| $15,000 to $24,999 | 0 | 0.0% |
| $25,000 to $34,999 | 1 | 2.5% |
| $35,000 to $49,999 | 10 | 25.0% |
| $50,000 to $74,999 | 3 | 7.5% |
| $75,000 to $99,999 | 3 | 7.5% |
| $100,000 to $149,999 | 12 | 30.0% |
| $150,000 to $199,999 | 11 | 27.5% |
| $200,000+ | 0 | 0.0% |
Family Income by Famaliy Size in Page
2-person families (31 | 77.5%) account for the highest median family income in Page with $102,292 per family, while 2-person families (31 | 77.5%) have the highest median income of $51,146 per family member.
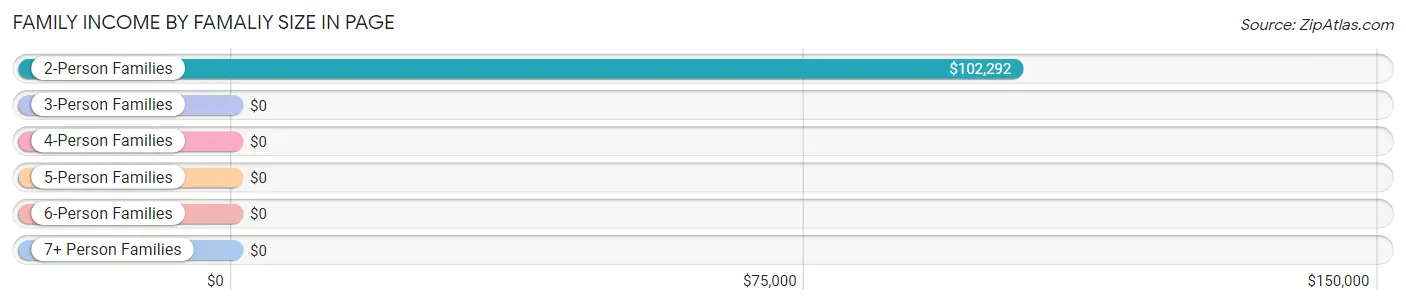
| Income Bracket | # Families | Median Income |
| 2-Person Families | 31 (77.5%) | $102,292 |
| 3-Person Families | 2 (5.0%) | $0 |
| 4-Person Families | 0 (0.0%) | $0 |
| 5-Person Families | 6 (15.0%) | $0 |
| 6-Person Families | 1 (2.5%) | $0 |
| 7+ Person Families | 0 (0.0%) | $0 |
| Total | 40 (100.0%) | $101,250 |
Family Income by Number of Earners in Page
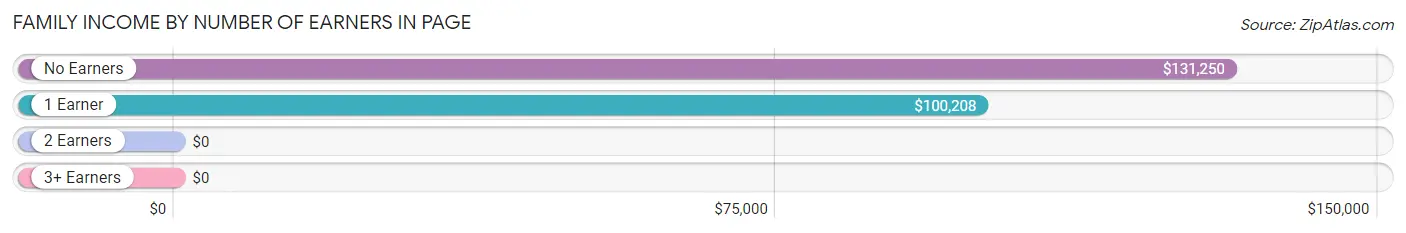
| Number of Earners | # Families | Median Income |
| No Earners | 4 (10.0%) | $131,250 |
| 1 Earner | 11 (27.5%) | $100,208 |
| 2 Earners | 24 (60.0%) | $0 |
| 3+ Earners | 1 (2.5%) | $0 |
| Total | 40 (100.0%) | $101,250 |
Household Income in Page
Household Income Brackets in Page
With 14 households falling in the category, the $35,000 to $49,999 income range is the most frequent in Page, accounting for 26.4% of all households.
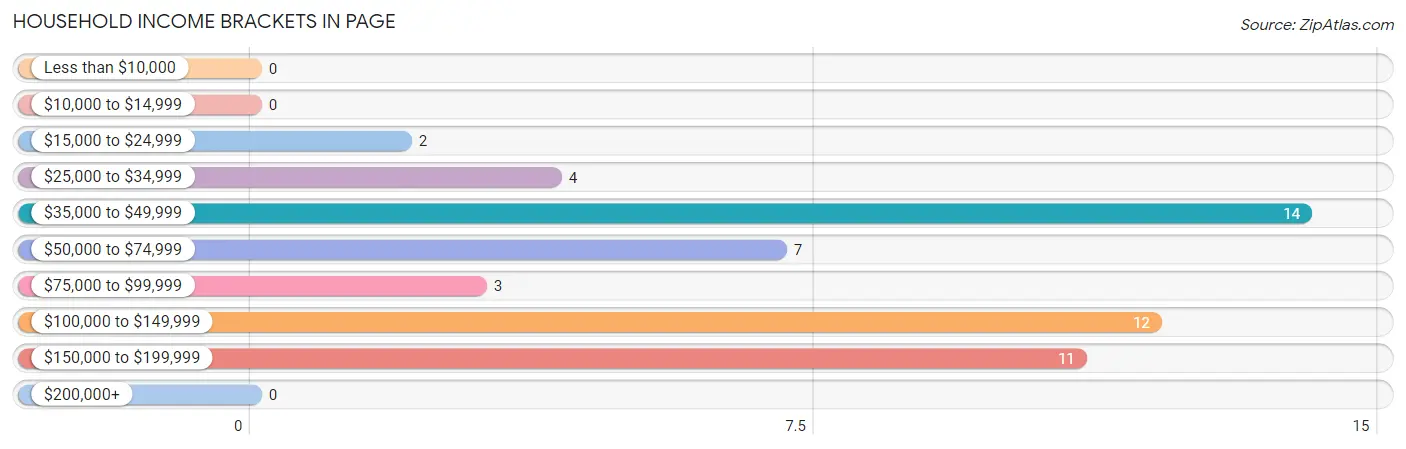
| Income Bracket | # Households | % Households |
| Less than $10,000 | 0 | 0.0% |
| $10,000 to $14,999 | 0 | 0.0% |
| $15,000 to $24,999 | 2 | 3.8% |
| $25,000 to $34,999 | 4 | 7.5% |
| $35,000 to $49,999 | 14 | 26.4% |
| $50,000 to $74,999 | 7 | 13.2% |
| $75,000 to $99,999 | 3 | 5.7% |
| $100,000 to $149,999 | 12 | 22.6% |
| $150,000 to $199,999 | 11 | 20.8% |
| $200,000+ | 0 | 0.0% |
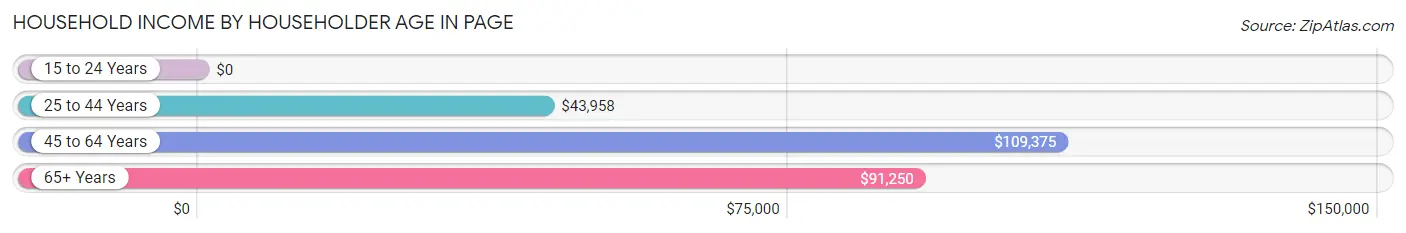
Household Income by Householder Age in Page
The median household income in Page is $63,750, with the highest median household income of $109,375 found in the 45 to 64 years age bracket for the primary householder. A total of 27 households (50.9%) fall into this category.
| Income Bracket | # Households | Median Income |
| 15 to 24 Years | 0 (0.0%) | $0 |
| 25 to 44 Years | 9 (17.0%) | $43,958 |
| 45 to 64 Years | 27 (50.9%) | $109,375 |
| 65+ Years | 17 (32.1%) | $91,250 |
| Total | 53 (100.0%) | $63,750 |
Poverty in Page
Income Below Poverty by Sex and Age in Page
| Age Bracket | Male | Female |
| Under 5 Years | 0 (0.0%) | 0 (0.0%) |
| 5 Years | 0 (0.0%) | 0 (0.0%) |
| 6 to 11 Years | 0 (0.0%) | 0 (0.0%) |
| 12 to 14 Years | 0 (0.0%) | 0 (0.0%) |
| 15 Years | 0 (0.0%) | 0 (0.0%) |
| 16 and 17 Years | 0 (0.0%) | 0 (0.0%) |
| 18 to 24 Years | 0 (0.0%) | 0 (0.0%) |
| 25 to 34 Years | 0 (0.0%) | 0 (0.0%) |
| 35 to 44 Years | 0 (0.0%) | 0 (0.0%) |
| 45 to 54 Years | 0 (0.0%) | 0 (0.0%) |
| 55 to 64 Years | 0 (0.0%) | 0 (0.0%) |
| 65 to 74 Years | 0 (0.0%) | 0 (0.0%) |
| 75 Years and over | 0 (0.0%) | 0 (0.0%) |
| Total | 0 (0.0%) | 0 (0.0%) |
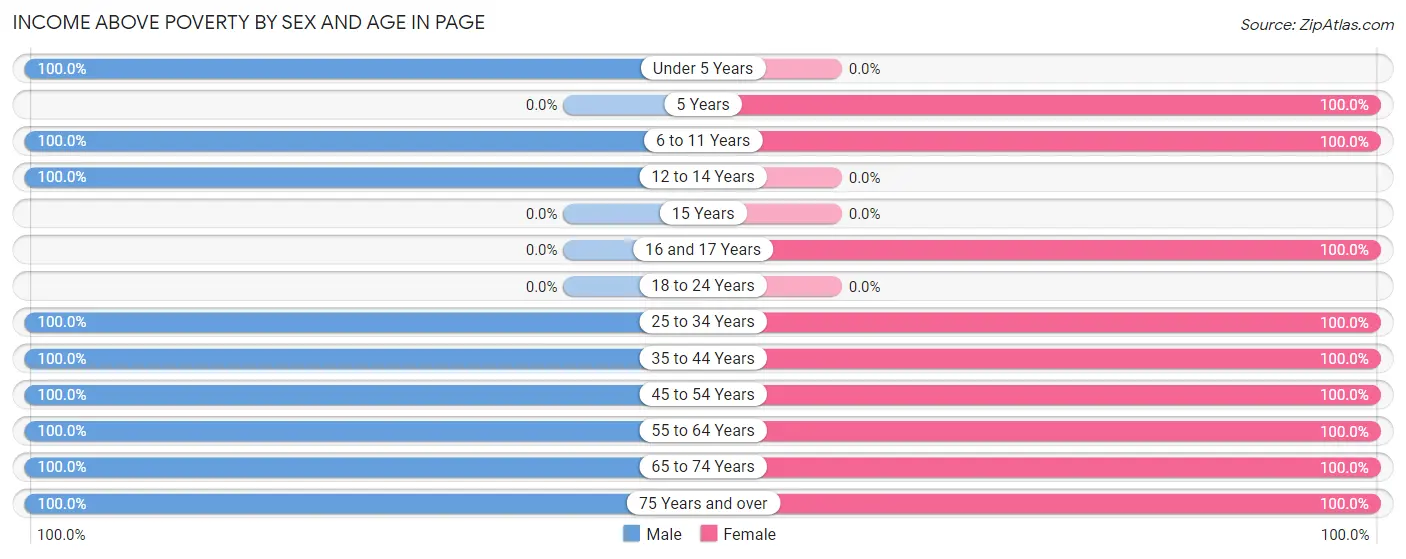
Income Above Poverty by Sex and Age in Page
According to the poverty statistics in Page, males aged under 5 years and females aged 5 years are the age groups that are most secure financially, with 100.0% of males and 100.0% of females in these age groups living above the poverty line.
| Age Bracket | Male | Female |
| Under 5 Years | 2 (100.0%) | 0 (0.0%) |
| 5 Years | 0 (0.0%) | 2 (100.0%) |
| 6 to 11 Years | 12 (100.0%) | 7 (100.0%) |
| 12 to 14 Years | 9 (100.0%) | 0 (0.0%) |
| 15 Years | 0 (0.0%) | 0 (0.0%) |
| 16 and 17 Years | 0 (0.0%) | 1 (100.0%) |
| 18 to 24 Years | 0 (0.0%) | 0 (0.0%) |
| 25 to 34 Years | 9 (100.0%) | 4 (100.0%) |
| 35 to 44 Years | 6 (100.0%) | 8 (100.0%) |
| 45 to 54 Years | 5 (100.0%) | 7 (100.0%) |
| 55 to 64 Years | 18 (100.0%) | 12 (100.0%) |
| 65 to 74 Years | 6 (100.0%) | 12 (100.0%) |
| 75 Years and over | 4 (100.0%) | 6 (100.0%) |
| Total | 71 (100.0%) | 59 (100.0%) |
Income Below Poverty Among Married-Couple Families in Page
| Children | Above Poverty | Below Poverty |
| No Children | 28 (100.0%) | 0 (0.0%) |
| 1 or 2 Children | 3 (100.0%) | 0 (0.0%) |
| 3 or 4 Children | 6 (100.0%) | 0 (0.0%) |
| 5 or more Children | 0 (0.0%) | 0 (0.0%) |
| Total | 37 (100.0%) | 0 (0.0%) |
Income Below Poverty Among Single-Parent Households in Page
| Children | Single Father | Single Mother |
| No Children | 0 (0.0%) | 0 (0.0%) |
| 1 or 2 Children | 0 (0.0%) | 0 (0.0%) |
| 3 or 4 Children | 0 (0.0%) | 0 (0.0%) |
| 5 or more Children | 0 (0.0%) | 0 (0.0%) |
| Total | 0 (0.0%) | 0 (0.0%) |
Income Below Poverty Among Married-Couple vs Single-Parent Households in Page
| Children | Married-Couple Families | Single-Parent Households |
| No Children | 0 (0.0%) | 0 (0.0%) |
| 1 or 2 Children | 0 (0.0%) | 0 (0.0%) |
| 3 or 4 Children | 0 (0.0%) | 0 (0.0%) |
| 5 or more Children | 0 (0.0%) | 0 (0.0%) |
| Total | 0 (0.0%) | 0 (0.0%) |
Race in Page
The most populous races in Page are White / Caucasian (128 | 98.5%), Hispanic or Latino (2 | 1.5%), and Some other Race (2 | 1.5%).
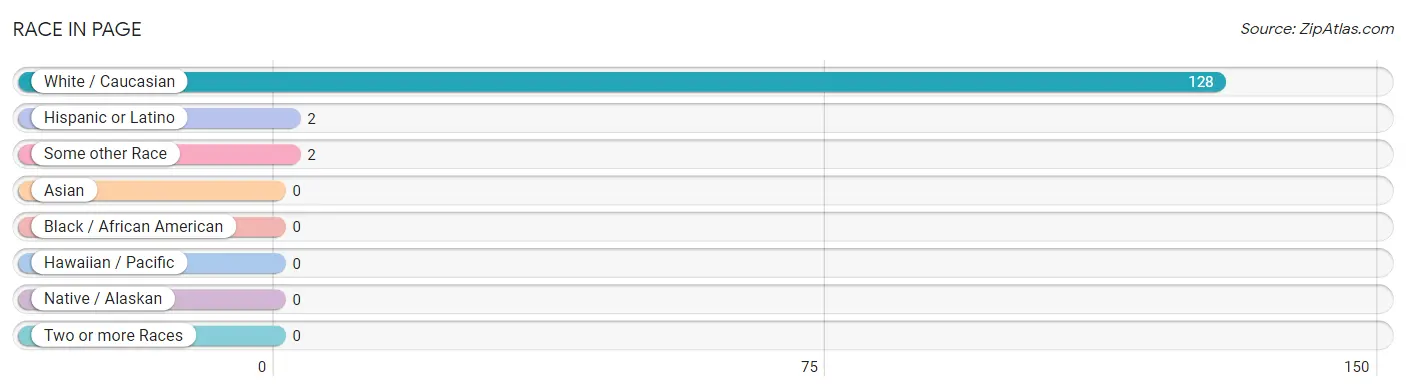
| Race | # Population | % Population |
| Asian | 0 | 0.0% |
| Black / African American | 0 | 0.0% |
| Hawaiian / Pacific | 0 | 0.0% |
| Hispanic or Latino | 2 | 1.5% |
| Native / Alaskan | 0 | 0.0% |
| White / Caucasian | 128 | 98.5% |
| Two or more Races | 0 | 0.0% |
| Some other Race | 2 | 1.5% |
| Total | 130 | 100.0% |
Ancestry in Page
The most populous ancestries reported in Page are Irish (46 | 35.4%), Polish (33 | 25.4%), English (29 | 22.3%), German (23 | 17.7%), and Swedish (7 | 5.4%), together accounting for 106.1% of all Page residents.
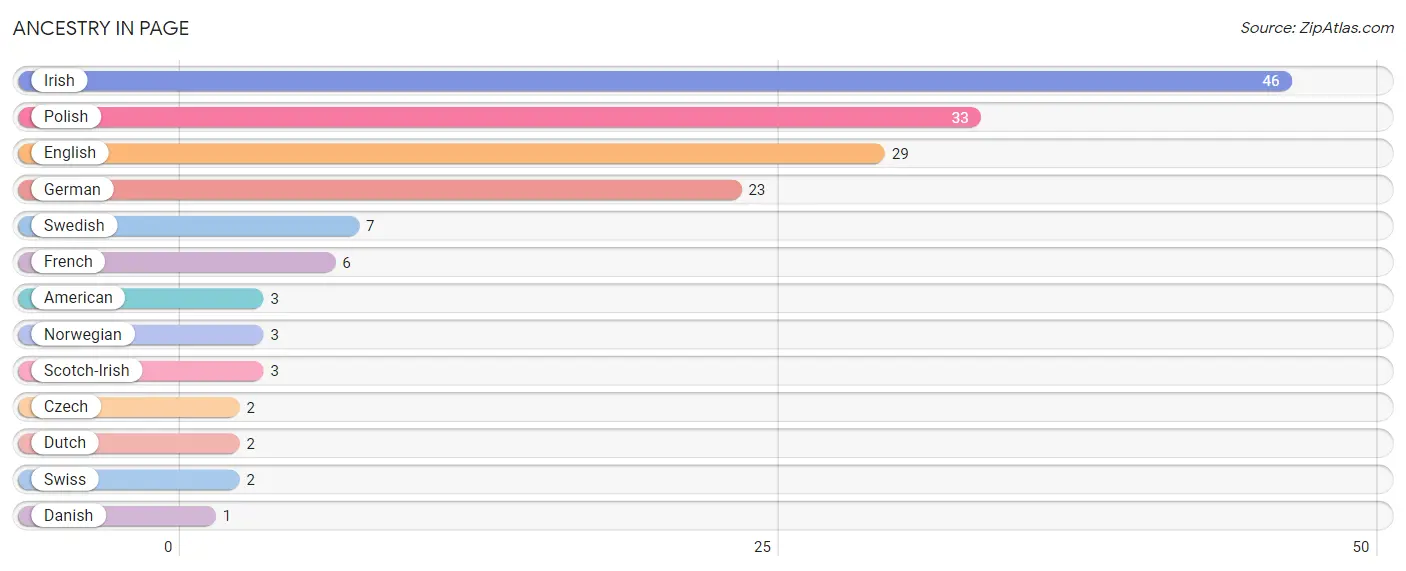
| Ancestry | # Population | % Population |
| American | 3 | 2.3% |
| Czech | 2 | 1.5% |
| Danish | 1 | 0.8% |
| Dutch | 2 | 1.5% |
| English | 29 | 22.3% |
| French | 6 | 4.6% |
| German | 23 | 17.7% |
| Irish | 46 | 35.4% |
| Norwegian | 3 | 2.3% |
| Polish | 33 | 25.4% |
| Scotch-Irish | 3 | 2.3% |
| Swedish | 7 | 5.4% |
| Swiss | 2 | 1.5% | View All 13 Rows |
Immigrants in Page

| Immigration Origin | # Population | % Population | View All 0 Rows |
Sex and Age in Page
Sex and Age in Page
The most populous age groups in Page are 60 to 64 Years (13 | 18.3%) for men and 60 to 64 Years (11 | 18.6%) for women.
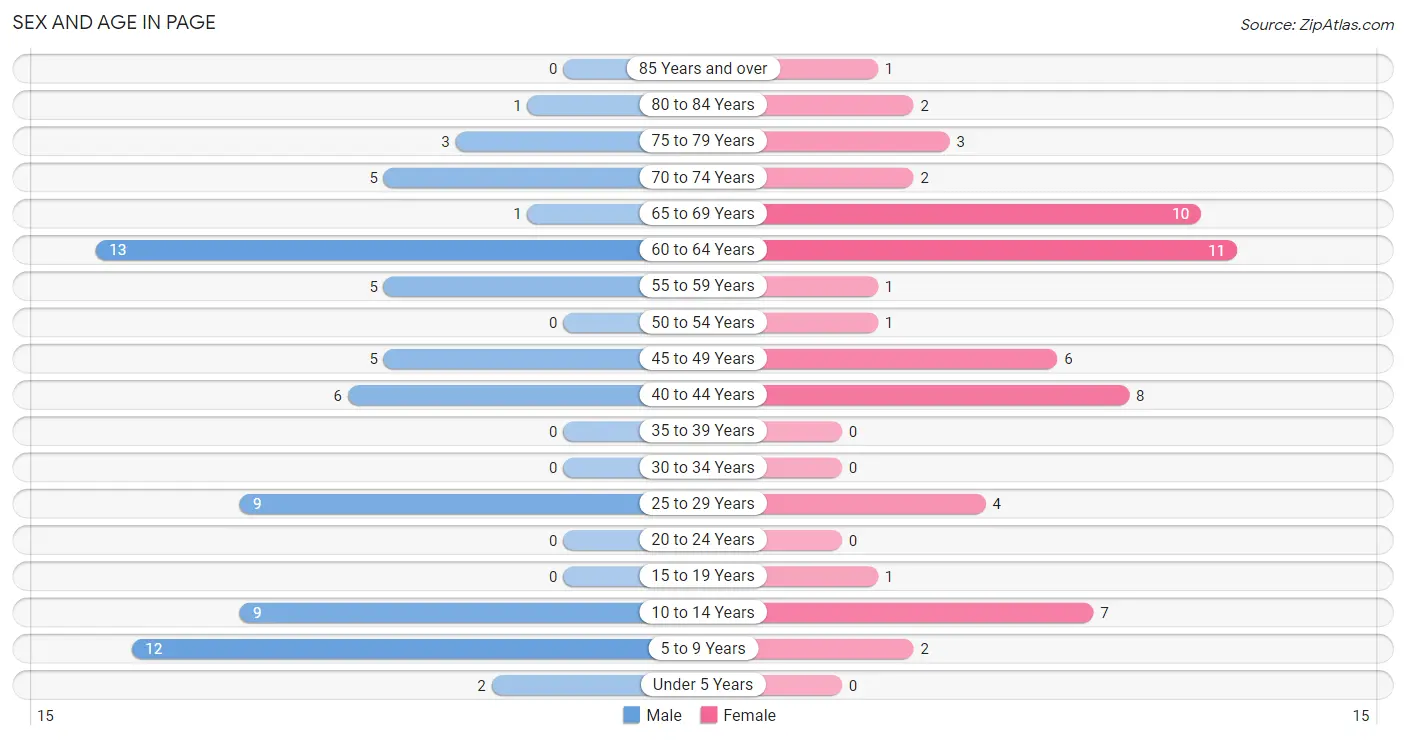
| Age Bracket | Male | Female |
| Under 5 Years | 2 (2.8%) | 0 (0.0%) |
| 5 to 9 Years | 12 (16.9%) | 2 (3.4%) |
| 10 to 14 Years | 9 (12.7%) | 7 (11.9%) |
| 15 to 19 Years | 0 (0.0%) | 1 (1.7%) |
| 20 to 24 Years | 0 (0.0%) | 0 (0.0%) |
| 25 to 29 Years | 9 (12.7%) | 4 (6.8%) |
| 30 to 34 Years | 0 (0.0%) | 0 (0.0%) |
| 35 to 39 Years | 0 (0.0%) | 0 (0.0%) |
| 40 to 44 Years | 6 (8.5%) | 8 (13.6%) |
| 45 to 49 Years | 5 (7.0%) | 6 (10.2%) |
| 50 to 54 Years | 0 (0.0%) | 1 (1.7%) |
| 55 to 59 Years | 5 (7.0%) | 1 (1.7%) |
| 60 to 64 Years | 13 (18.3%) | 11 (18.6%) |
| 65 to 69 Years | 1 (1.4%) | 10 (17.0%) |
| 70 to 74 Years | 5 (7.0%) | 2 (3.4%) |
| 75 to 79 Years | 3 (4.2%) | 3 (5.1%) |
| 80 to 84 Years | 1 (1.4%) | 2 (3.4%) |
| 85 Years and over | 0 (0.0%) | 1 (1.7%) |
| Total | 71 (100.0%) | 59 (100.0%) |
Families and Households in Page
Median Family Size in Page
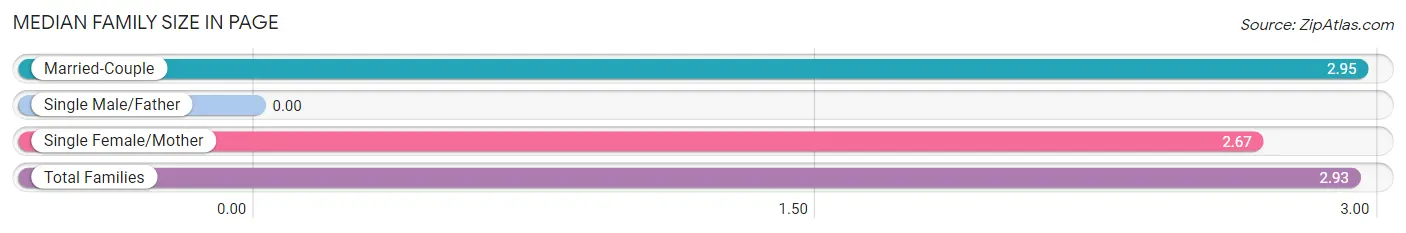
| Family Type | # Families | Family Size |
| Married-Couple | 37 (92.5%) | 2.95 |
| Single Male/Father | 0 (0.0%) | - |
| Single Female/Mother | 3 (7.5%) | 2.67 |
| Total Families | 40 (100.0%) | 2.93 |
Median Household Size in Page
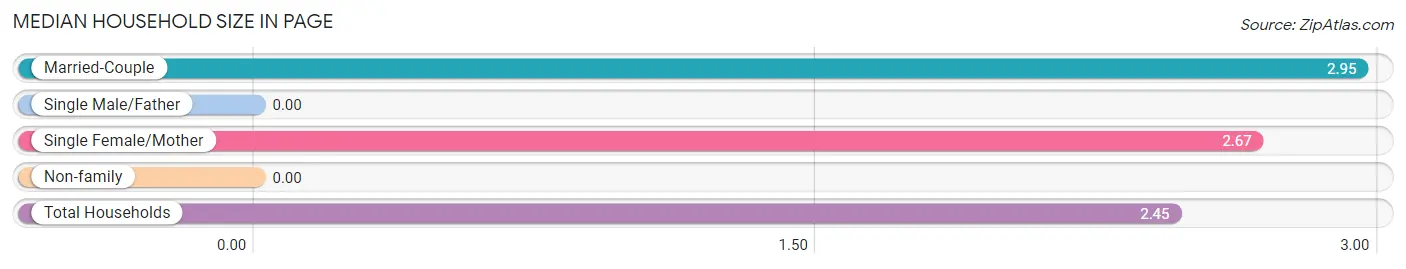
| Household Type | # Households | Household Size |
| Married-Couple | 37 (69.8%) | 2.95 |
| Single Male/Father | 0 (0.0%) | - |
| Single Female/Mother | 3 (5.7%) | 2.67 |
| Non-family | 13 (24.5%) | - |
| Total Households | 53 (100.0%) | 2.45 |
Household Size by Marriage Status in Page
Out of a total of 53 households in Page, 40 (75.5%) are family households, while 13 (24.5%) are nonfamily households. The most numerous type of family households are 2-person households, comprising 31, and the most common type of nonfamily households are 1-person households, comprising 13.
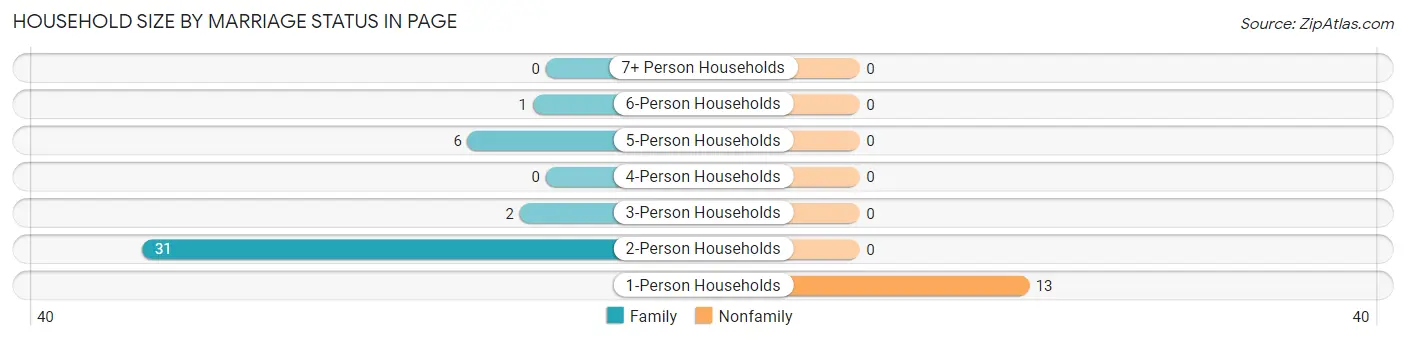
| Household Size | Family Households | Nonfamily Households |
| 1-Person Households | - | 13 (24.5%) |
| 2-Person Households | 31 (58.5%) | 0 (0.0%) |
| 3-Person Households | 2 (3.8%) | 0 (0.0%) |
| 4-Person Households | 0 (0.0%) | 0 (0.0%) |
| 5-Person Households | 6 (11.3%) | 0 (0.0%) |
| 6-Person Households | 1 (1.9%) | 0 (0.0%) |
| 7+ Person Households | 0 (0.0%) | 0 (0.0%) |
| Total | 40 (75.5%) | 13 (24.5%) |
Female Fertility in Page
Fertility by Age in Page
Average fertility rate in Page is 53.0 births per 1,000 women. Women in the age bracket of 20 to 34 years have the highest fertility rate with 250.0 births per 1,000 women. Women in the age bracket of 20 to 34 years acount for 100.0% of all women with births.
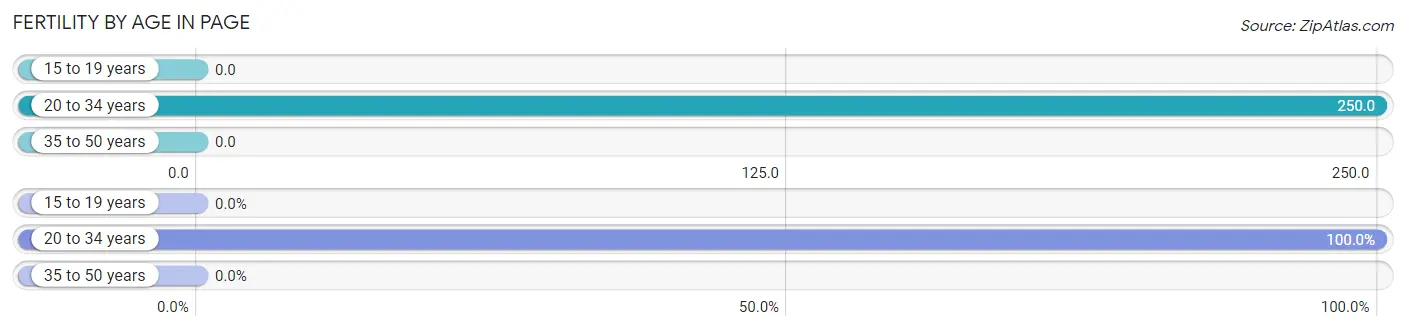
| Age Bracket | Women with Births | Births / 1,000 Women |
| 15 to 19 years | 0 (0.0%) | 0.0 |
| 20 to 34 years | 1 (100.0%) | 250.0 |
| 35 to 50 years | 0 (0.0%) | 0.0 |
| Total | 1 (100.0%) | 53.0 |
Fertility by Age by Marriage Status in Page
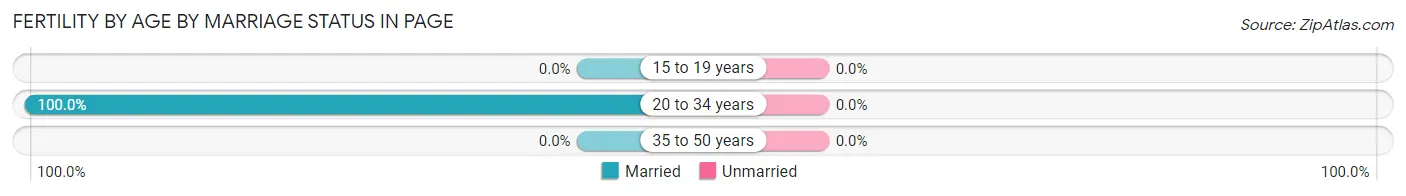
| Age Bracket | Married | Unmarried |
| 15 to 19 years | 0 (0.0%) | 0 (0.0%) |
| 20 to 34 years | 1 (100.0%) | 0 (0.0%) |
| 35 to 50 years | 0 (0.0%) | 0 (0.0%) |
| Total | 1 (100.0%) | 0 (0.0%) |
Fertility by Education in Page
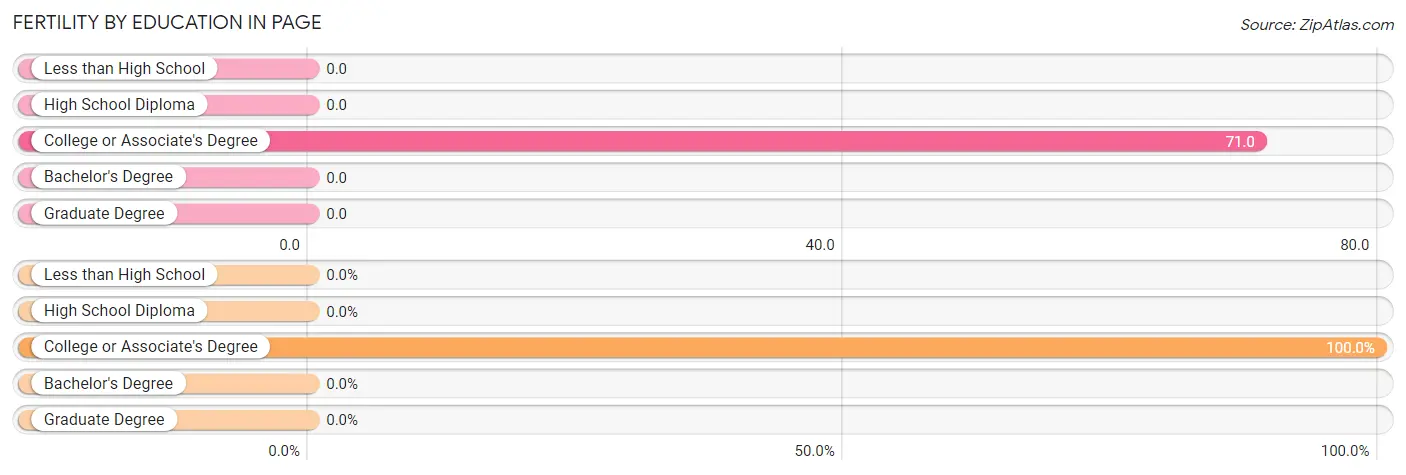
| Educational Attainment | Women with Births | Births / 1,000 Women |
| Less than High School | 0 (0.0%) | 0.0 |
| High School Diploma | 0 (0.0%) | 0.0 |
| College or Associate's Degree | 1 (100.0%) | 71.0 |
| Bachelor's Degree | 0 (0.0%) | 0.0 |
| Graduate Degree | 0 (0.0%) | 0.0 |
| Total | 1 (100.0%) | 53.0 |
Fertility by Education by Marriage Status in Page
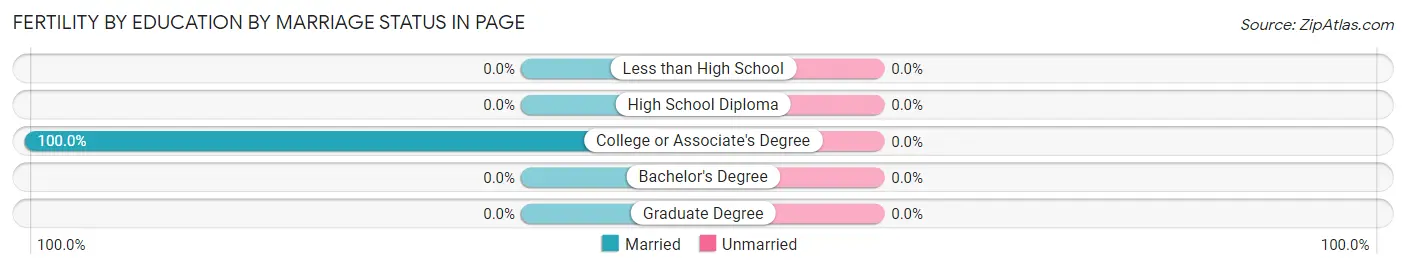
| Educational Attainment | Married | Unmarried |
| Less than High School | 0 (0.0%) | 0 (0.0%) |
| High School Diploma | 0 (0.0%) | 0 (0.0%) |
| College or Associate's Degree | 1 (100.0%) | 0 (0.0%) |
| Bachelor's Degree | 0 (0.0%) | 0 (0.0%) |
| Graduate Degree | 0 (0.0%) | 0 (0.0%) |
| Total | 1 (100.0%) | 0 (0.0%) |
Employment Characteristics in Page
Employment by Class of Employer in Page
Among the 66 employed individuals in Page, private company employees (44 | 66.7%), self-employed (incorporated) (8 | 12.1%), and state government employees (5 | 7.6%) make up the most common classes of employment.
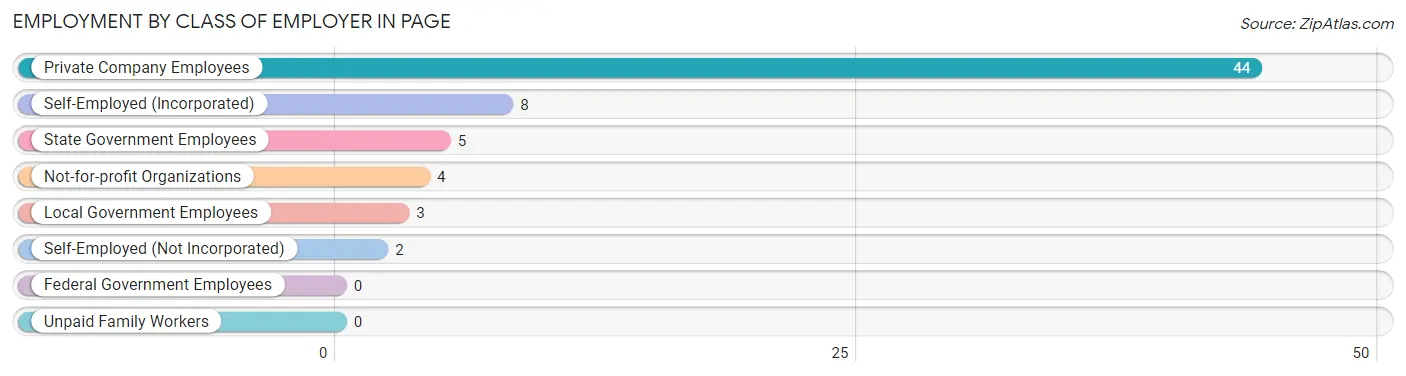
| Employer Class | # Employees | % Employees |
| Private Company Employees | 44 | 66.7% |
| Self-Employed (Incorporated) | 8 | 12.1% |
| Self-Employed (Not Incorporated) | 2 | 3.0% |
| Not-for-profit Organizations | 4 | 6.1% |
| Local Government Employees | 3 | 4.5% |
| State Government Employees | 5 | 7.6% |
| Federal Government Employees | 0 | 0.0% |
| Unpaid Family Workers | 0 | 0.0% |
| Total | 66 | 100.0% |
Employment Status by Age in Page
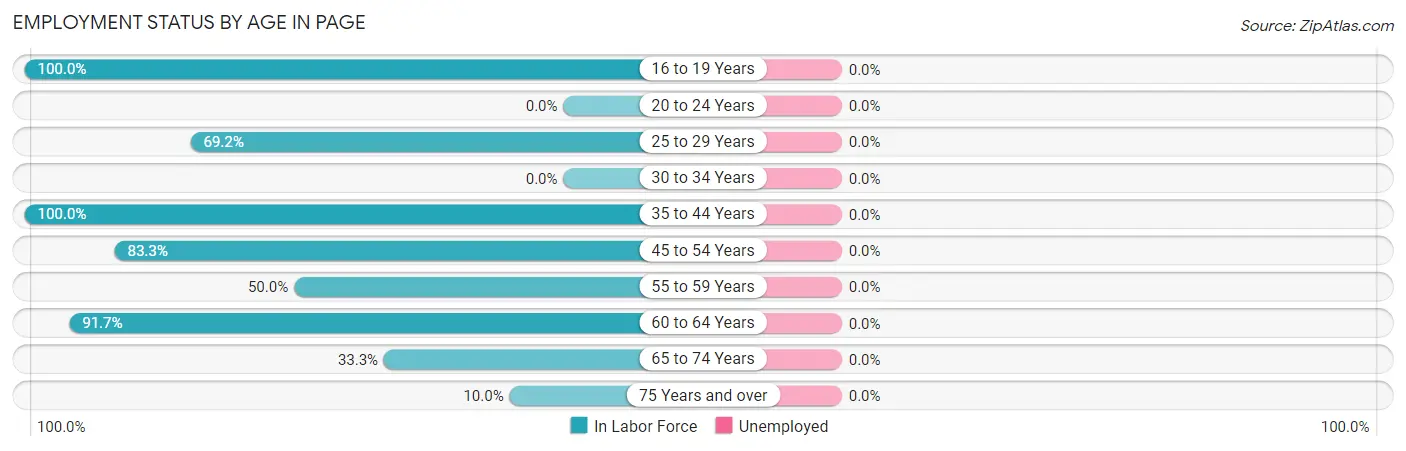
| Age Bracket | In Labor Force | Unemployed |
| 16 to 19 Years | 1 (100.0%) | 0 (0.0%) |
| 20 to 24 Years | 0 (0.0%) | 0 (0.0%) |
| 25 to 29 Years | 9 (69.2%) | 0 (0.0%) |
| 30 to 34 Years | 0 (0.0%) | 0 (0.0%) |
| 35 to 44 Years | 14 (100.0%) | 0 (0.0%) |
| 45 to 54 Years | 10 (83.3%) | 0 (0.0%) |
| 55 to 59 Years | 3 (50.0%) | 0 (0.0%) |
| 60 to 64 Years | 22 (91.7%) | 0 (0.0%) |
| 65 to 74 Years | 6 (33.3%) | 0 (0.0%) |
| 75 Years and over | 1 (10.0%) | 0 (0.0%) |
| Total | 66 (67.3%) | 0 (0.0%) |
Employment Status by Educational Attainment in Page
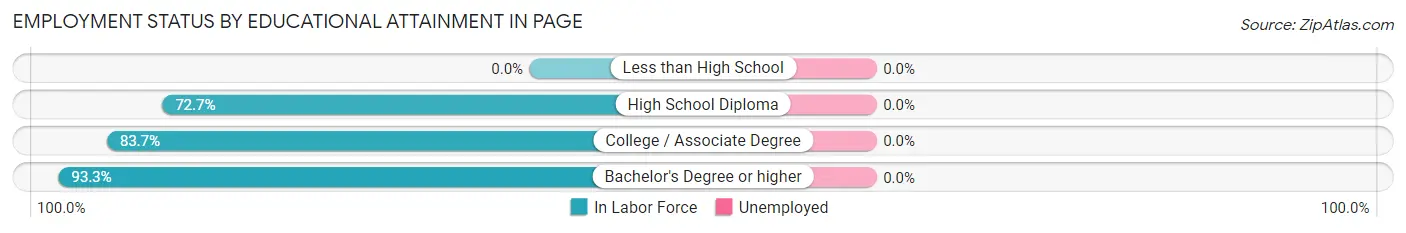
| Educational Attainment | In Labor Force | Unemployed |
| Less than High School | 0 (0.0%) | 0 (0.0%) |
| High School Diploma | 8 (72.7%) | 0 (0.0%) |
| College / Associate Degree | 36 (83.7%) | 0 (0.0%) |
| Bachelor's Degree or higher | 14 (93.3%) | 0 (0.0%) |
| Total | 58 (84.1%) | 0 (0.0%) |
Employment Occupations by Sex in Page
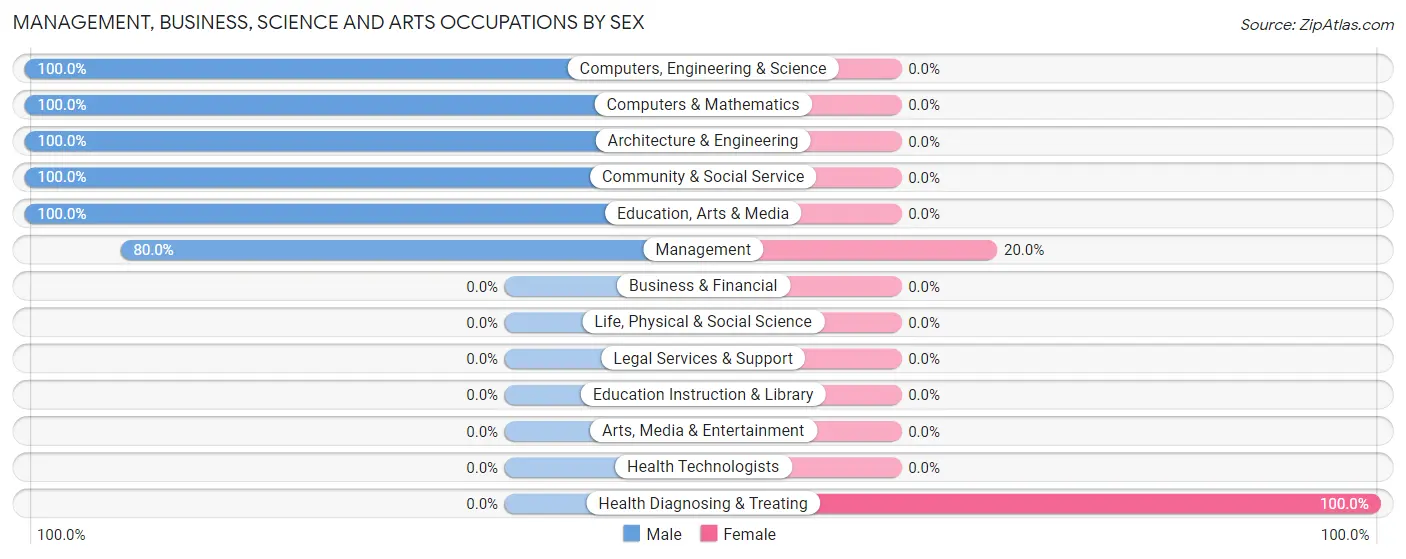
Management, Business, Science and Arts Occupations
The most common Management, Business, Science and Arts occupations in Page are Management (10 | 15.1%), Computers, Engineering & Science (10 | 15.1%), Computers & Mathematics (9 | 13.6%), Community & Social Service (3 | 4.5%), and Education, Arts & Media (3 | 4.5%).
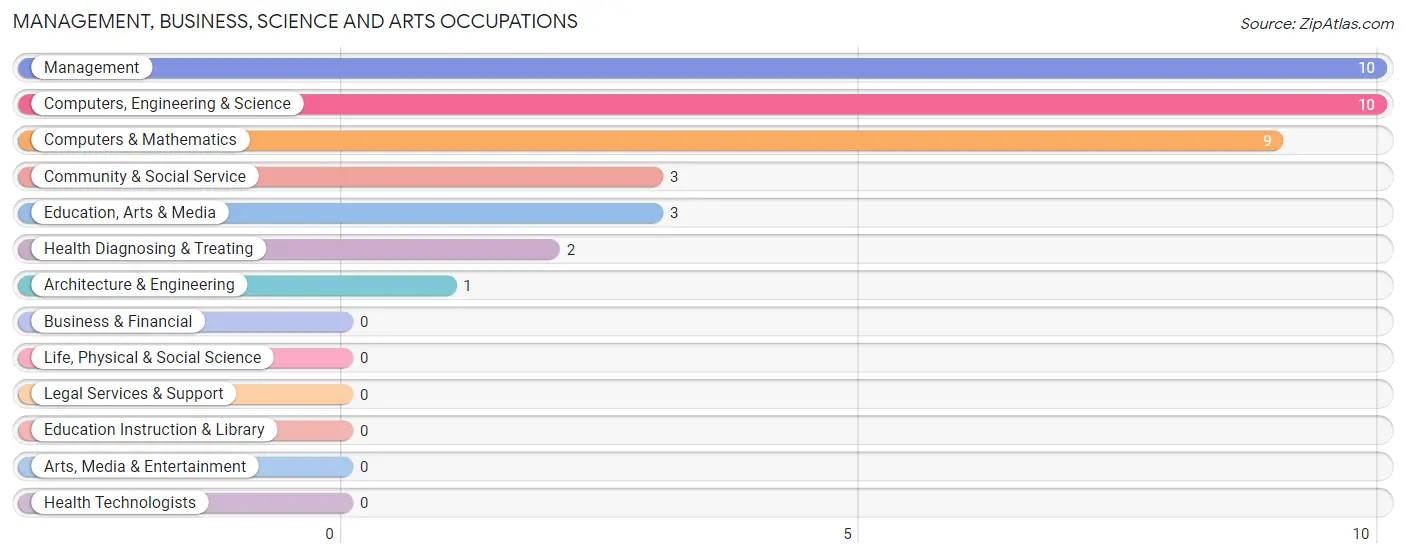
Management, Business, Science and Arts Occupations by Sex
Within the Management, Business, Science and Arts occupations in Page, the most male-oriented occupations are Computers, Engineering & Science (100.0%), Computers & Mathematics (100.0%), and Architecture & Engineering (100.0%), while the most female-oriented occupations are Health Diagnosing & Treating (100.0%), and Management (20.0%).
| Occupation | Male | Female |
| Management | 8 (80.0%) | 2 (20.0%) |
| Business & Financial | 0 (0.0%) | 0 (0.0%) |
| Computers, Engineering & Science | 10 (100.0%) | 0 (0.0%) |
| Computers & Mathematics | 9 (100.0%) | 0 (0.0%) |
| Architecture & Engineering | 1 (100.0%) | 0 (0.0%) |
| Life, Physical & Social Science | 0 (0.0%) | 0 (0.0%) |
| Community & Social Service | 3 (100.0%) | 0 (0.0%) |
| Education, Arts & Media | 3 (100.0%) | 0 (0.0%) |
| Legal Services & Support | 0 (0.0%) | 0 (0.0%) |
| Education Instruction & Library | 0 (0.0%) | 0 (0.0%) |
| Arts, Media & Entertainment | 0 (0.0%) | 0 (0.0%) |
| Health Diagnosing & Treating | 0 (0.0%) | 2 (100.0%) |
| Health Technologists | 0 (0.0%) | 0 (0.0%) |
| Total (Category) | 21 (84.0%) | 4 (16.0%) |
| Total (Overall) | 40 (60.6%) | 26 (39.4%) |
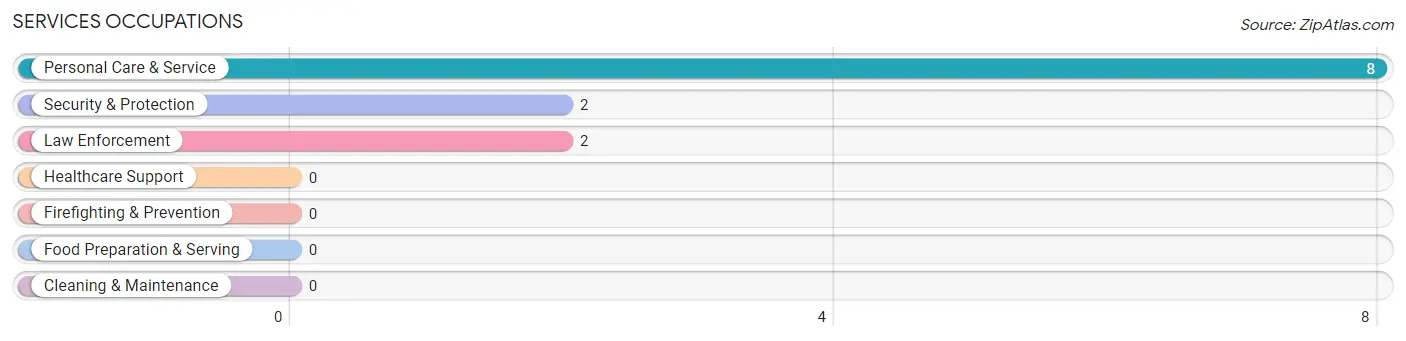
Services Occupations
The most common Services occupations in Page are Personal Care & Service (8 | 12.1%), Security & Protection (2 | 3.0%), and Law Enforcement (2 | 3.0%).
Services Occupations by Sex
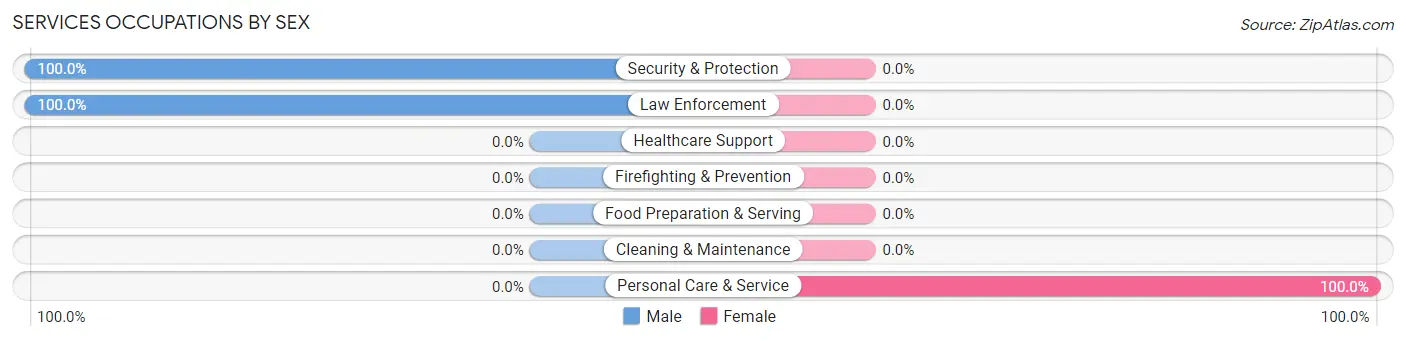
| Occupation | Male | Female |
| Healthcare Support | 0 (0.0%) | 0 (0.0%) |
| Security & Protection | 2 (100.0%) | 0 (0.0%) |
| Firefighting & Prevention | 0 (0.0%) | 0 (0.0%) |
| Law Enforcement | 2 (100.0%) | 0 (0.0%) |
| Food Preparation & Serving | 0 (0.0%) | 0 (0.0%) |
| Cleaning & Maintenance | 0 (0.0%) | 0 (0.0%) |
| Personal Care & Service | 0 (0.0%) | 8 (100.0%) |
| Total (Category) | 2 (20.0%) | 8 (80.0%) |
| Total (Overall) | 40 (60.6%) | 26 (39.4%) |
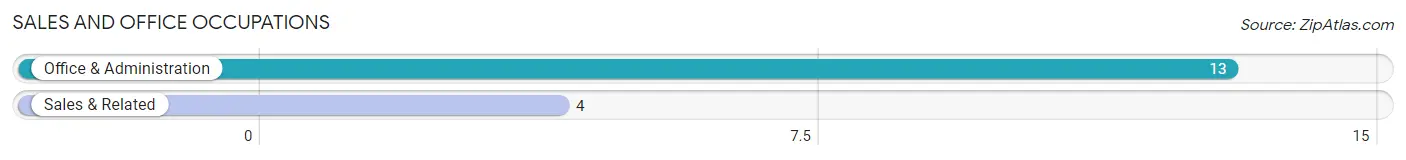
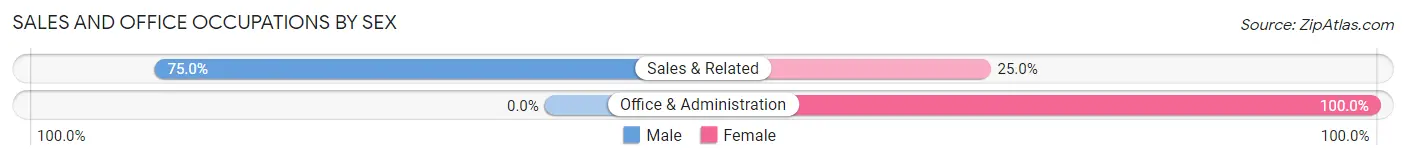
Sales and Office Occupations
The most common Sales and Office occupations in Page are Office & Administration (13 | 19.7%), and Sales & Related (4 | 6.1%).
Sales and Office Occupations by Sex
| Occupation | Male | Female |
| Sales & Related | 3 (75.0%) | 1 (25.0%) |
| Office & Administration | 0 (0.0%) | 13 (100.0%) |
| Total (Category) | 3 (17.6%) | 14 (82.4%) |
| Total (Overall) | 40 (60.6%) | 26 (39.4%) |
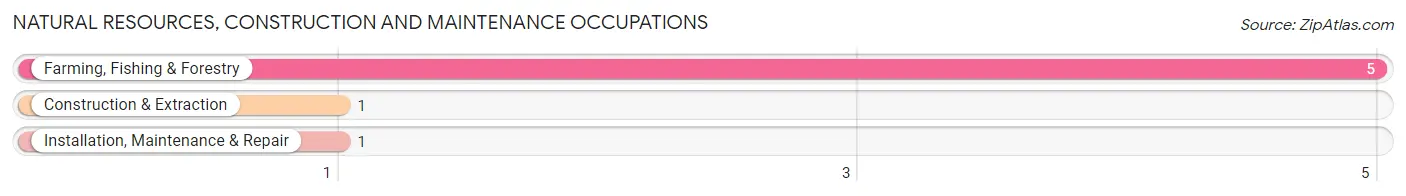
Natural Resources, Construction and Maintenance Occupations
The most common Natural Resources, Construction and Maintenance occupations in Page are Farming, Fishing & Forestry (5 | 7.6%), Construction & Extraction (1 | 1.5%), and Installation, Maintenance & Repair (1 | 1.5%).
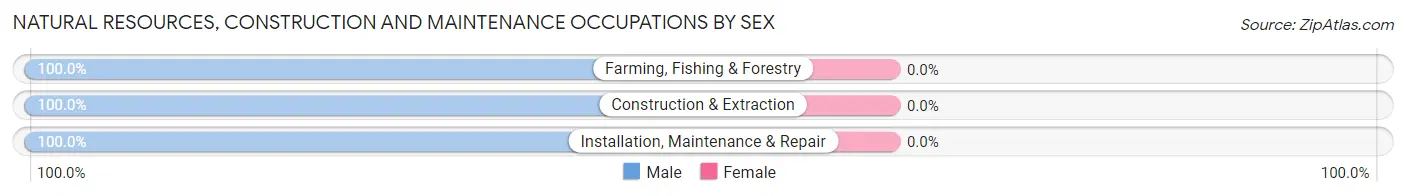
Natural Resources, Construction and Maintenance Occupations by Sex
| Occupation | Male | Female |
| Farming, Fishing & Forestry | 5 (100.0%) | 0 (0.0%) |
| Construction & Extraction | 1 (100.0%) | 0 (0.0%) |
| Installation, Maintenance & Repair | 1 (100.0%) | 0 (0.0%) |
| Total (Category) | 7 (100.0%) | 0 (0.0%) |
| Total (Overall) | 40 (60.6%) | 26 (39.4%) |
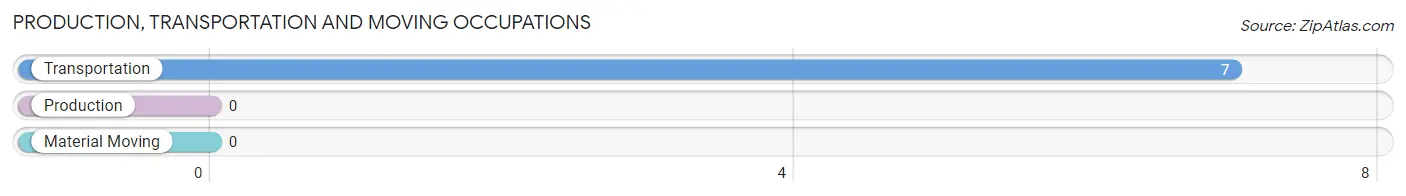
Production, Transportation and Moving Occupations
The most common Production, Transportation and Moving occupations in Page are , and Transportation (7 | 10.6%).
Production, Transportation and Moving Occupations by Sex
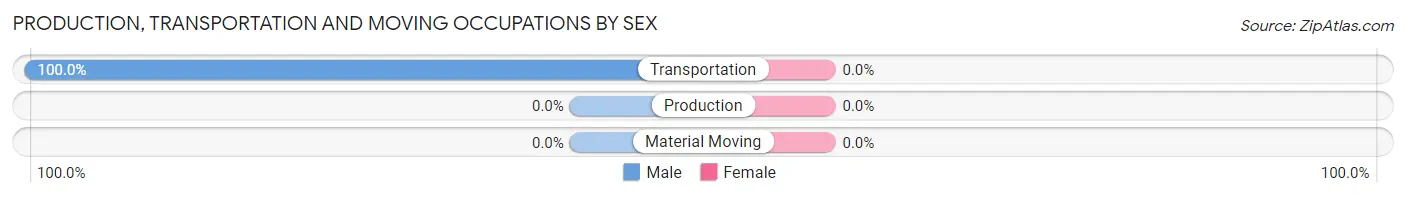
| Occupation | Male | Female |
| Production | 0 (0.0%) | 0 (0.0%) |
| Transportation | 7 (100.0%) | 0 (0.0%) |
| Material Moving | 0 (0.0%) | 0 (0.0%) |
| Total (Category) | 7 (100.0%) | 0 (0.0%) |
| Total (Overall) | 40 (60.6%) | 26 (39.4%) |
Employment Industries by Sex in Page
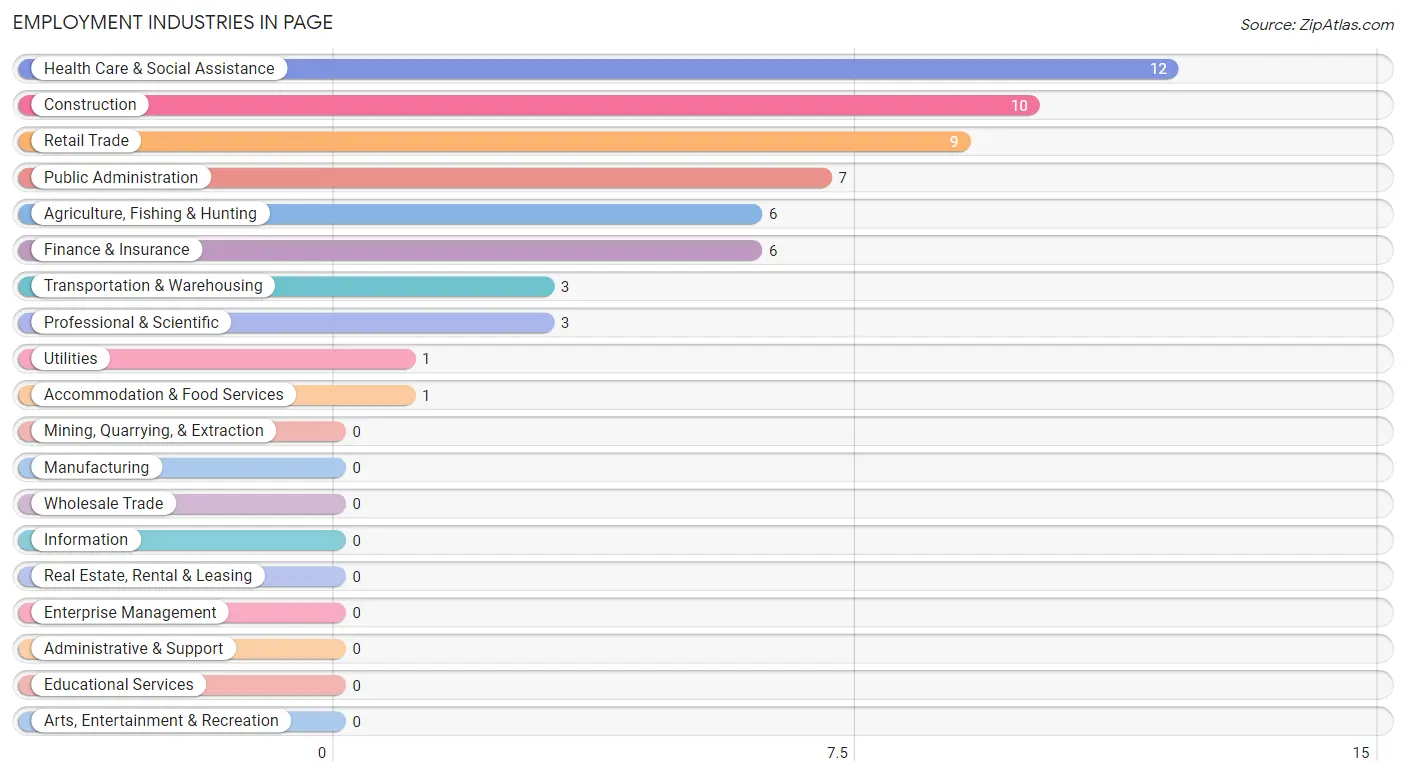
Employment Industries in Page
The major employment industries in Page include Health Care & Social Assistance (12 | 18.2%), Construction (10 | 15.1%), Retail Trade (9 | 13.6%), Public Administration (7 | 10.6%), and Agriculture, Fishing & Hunting (6 | 9.1%).
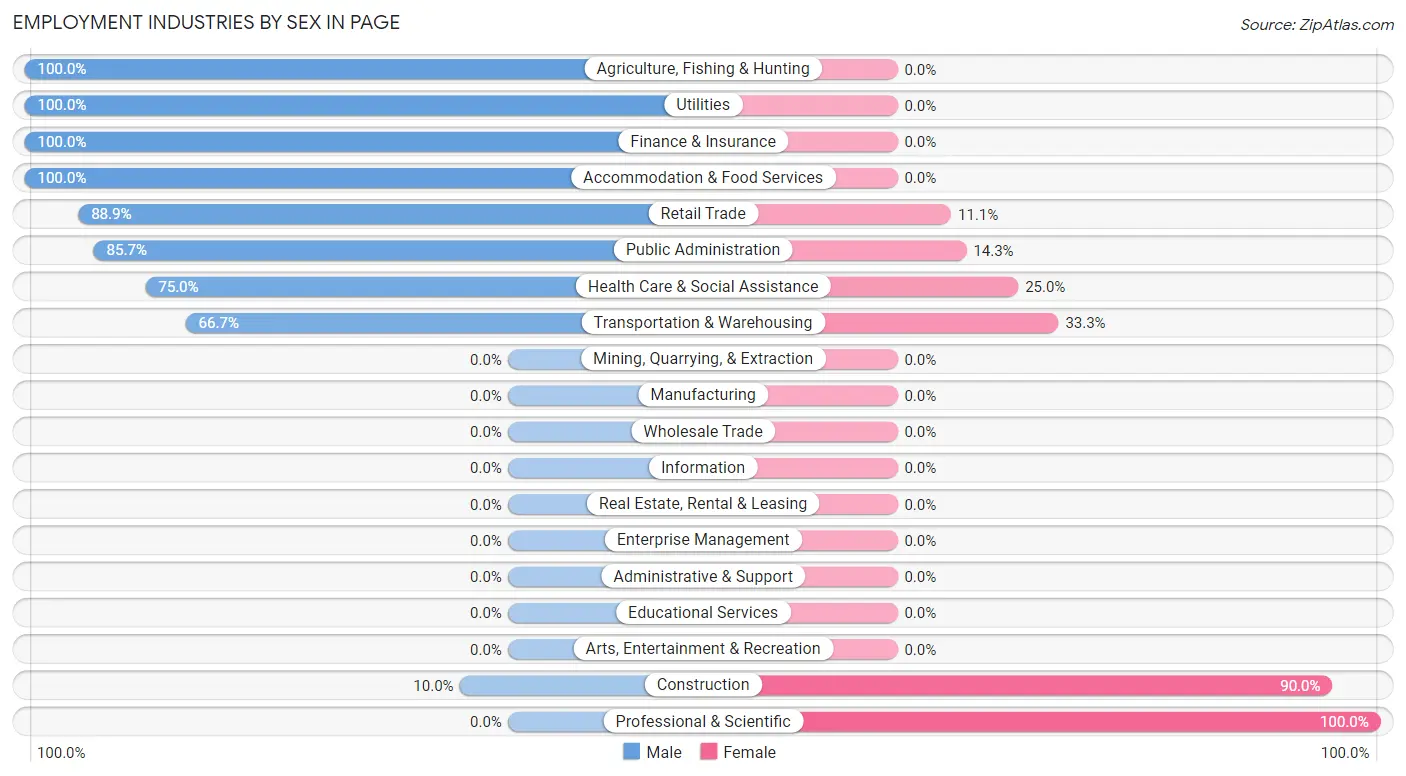
Employment Industries by Sex in Page
The Page industries that see more men than women are Agriculture, Fishing & Hunting (100.0%), Utilities (100.0%), and Finance & Insurance (100.0%), whereas the industries that tend to have a higher number of women are Professional & Scientific (100.0%), Construction (90.0%), and Transportation & Warehousing (33.3%).
| Industry | Male | Female |
| Agriculture, Fishing & Hunting | 6 (100.0%) | 0 (0.0%) |
| Mining, Quarrying, & Extraction | 0 (0.0%) | 0 (0.0%) |
| Construction | 1 (10.0%) | 9 (90.0%) |
| Manufacturing | 0 (0.0%) | 0 (0.0%) |
| Wholesale Trade | 0 (0.0%) | 0 (0.0%) |
| Retail Trade | 8 (88.9%) | 1 (11.1%) |
| Transportation & Warehousing | 2 (66.7%) | 1 (33.3%) |
| Utilities | 1 (100.0%) | 0 (0.0%) |
| Information | 0 (0.0%) | 0 (0.0%) |
| Finance & Insurance | 6 (100.0%) | 0 (0.0%) |
| Real Estate, Rental & Leasing | 0 (0.0%) | 0 (0.0%) |
| Professional & Scientific | 0 (0.0%) | 3 (100.0%) |
| Enterprise Management | 0 (0.0%) | 0 (0.0%) |
| Administrative & Support | 0 (0.0%) | 0 (0.0%) |
| Educational Services | 0 (0.0%) | 0 (0.0%) |
| Health Care & Social Assistance | 9 (75.0%) | 3 (25.0%) |
| Arts, Entertainment & Recreation | 0 (0.0%) | 0 (0.0%) |
| Accommodation & Food Services | 1 (100.0%) | 0 (0.0%) |
| Public Administration | 6 (85.7%) | 1 (14.3%) |
| Total | 40 (60.6%) | 26 (39.4%) |
Education in Page
School Enrollment in Page
The most common levels of schooling among the 31 students in Page are kindergarten (11 | 35.5%), elementary school (10 | 32.3%), and middle school (9 | 29.0%).
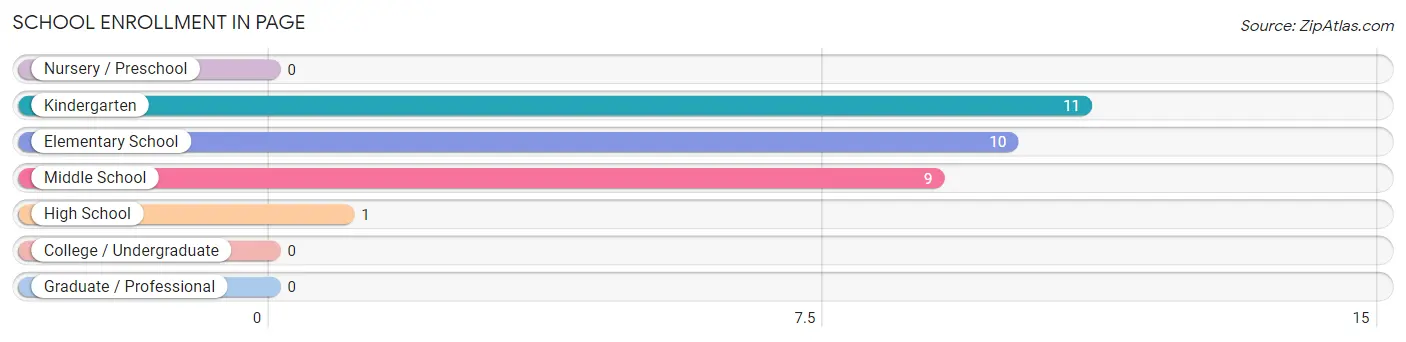
| School Level | # Students | % Students |
| Nursery / Preschool | 0 | 0.0% |
| Kindergarten | 11 | 35.5% |
| Elementary School | 10 | 32.3% |
| Middle School | 9 | 29.0% |
| High School | 1 | 3.2% |
| College / Undergraduate | 0 | 0.0% |
| Graduate / Professional | 0 | 0.0% |
| Total | 31 | 100.0% |
School Enrollment by Age by Funding Source in Page
Out of a total of 31 students who are enrolled in schools in Page, 4 (12.9%) attend a private institution, while the remaining 27 (87.1%) are enrolled in public schools. The age group of 15 to 17 year olds has the highest likelihood of being enrolled in private schools, with 1 (100.0% in the age bracket) enrolled. Conversely, the age group of 10 to 14 year olds has the lowest likelihood of being enrolled in a private school, with 16 (100.0% in the age bracket) attending a public institution.
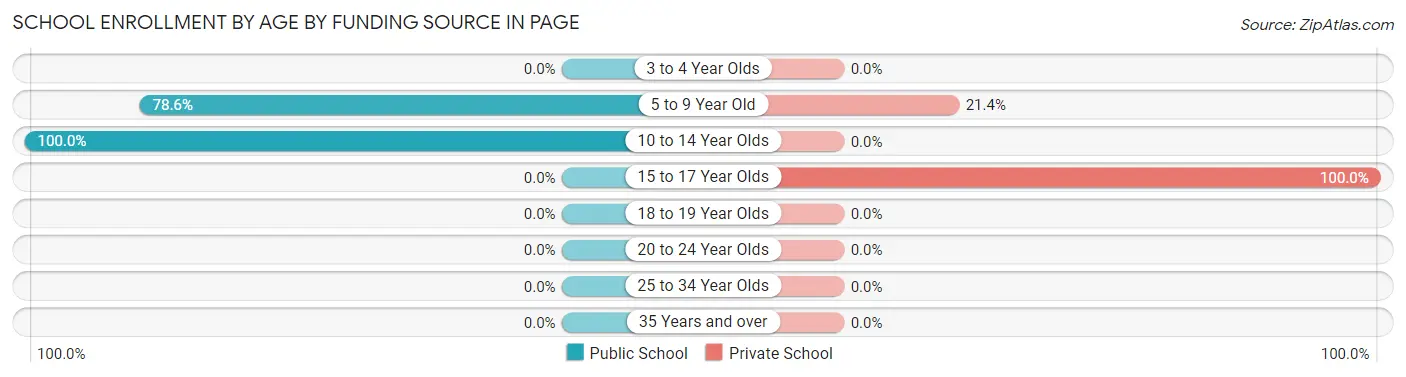
| Age Bracket | Public School | Private School |
| 3 to 4 Year Olds | 0 (0.0%) | 0 (0.0%) |
| 5 to 9 Year Old | 11 (78.6%) | 3 (21.4%) |
| 10 to 14 Year Olds | 16 (100.0%) | 0 (0.0%) |
| 15 to 17 Year Olds | 0 (0.0%) | 1 (100.0%) |
| 18 to 19 Year Olds | 0 (0.0%) | 0 (0.0%) |
| 20 to 24 Year Olds | 0 (0.0%) | 0 (0.0%) |
| 25 to 34 Year Olds | 0 (0.0%) | 0 (0.0%) |
| 35 Years and over | 0 (0.0%) | 0 (0.0%) |
| Total | 27 (87.1%) | 4 (12.9%) |
Educational Attainment by Field of Study in Page
Science & technology (7 | 25.0%), business (6 | 21.4%), literature & languages (5 | 17.9%), education (3 | 10.7%), and arts & humanities (3 | 10.7%) are the most common fields of study among 28 individuals in Page who have obtained a bachelor's degree or higher.
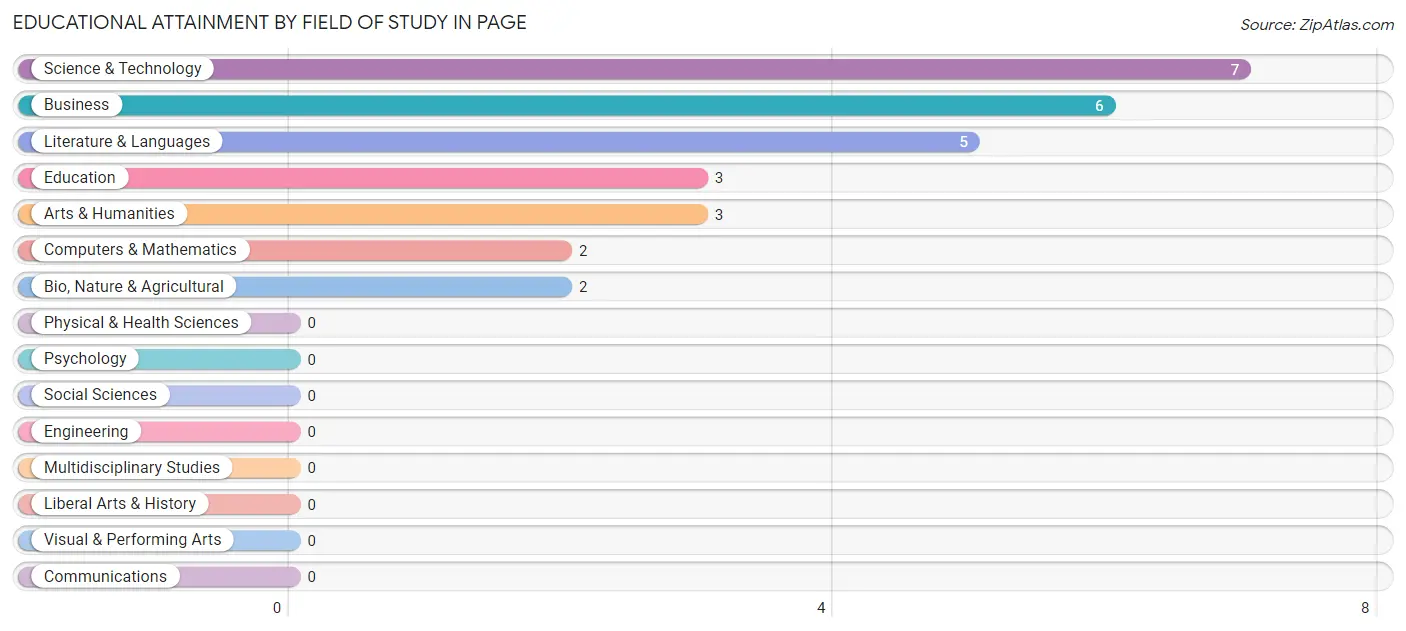
| Field of Study | # Graduates | % Graduates |
| Computers & Mathematics | 2 | 7.1% |
| Bio, Nature & Agricultural | 2 | 7.1% |
| Physical & Health Sciences | 0 | 0.0% |
| Psychology | 0 | 0.0% |
| Social Sciences | 0 | 0.0% |
| Engineering | 0 | 0.0% |
| Multidisciplinary Studies | 0 | 0.0% |
| Science & Technology | 7 | 25.0% |
| Business | 6 | 21.4% |
| Education | 3 | 10.7% |
| Literature & Languages | 5 | 17.9% |
| Liberal Arts & History | 0 | 0.0% |
| Visual & Performing Arts | 0 | 0.0% |
| Communications | 0 | 0.0% |
| Arts & Humanities | 3 | 10.7% |
| Total | 28 | 100.0% |
Transportation & Commute in Page
Vehicle Availability by Sex in Page
The most prevalent vehicle ownership categories in Page are males with 2 vehicles (23, accounting for 57.5%) and females with 2 vehicles (19, making up 88.5%).
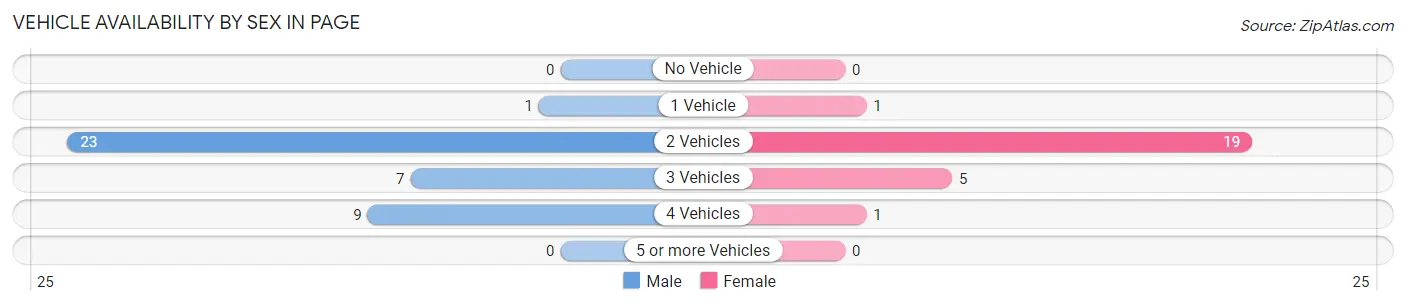
| Vehicles Available | Male | Female |
| No Vehicle | 0 (0.0%) | 0 (0.0%) |
| 1 Vehicle | 1 (2.5%) | 1 (3.8%) |
| 2 Vehicles | 23 (57.5%) | 19 (73.1%) |
| 3 Vehicles | 7 (17.5%) | 5 (19.2%) |
| 4 Vehicles | 9 (22.5%) | 1 (3.8%) |
| 5 or more Vehicles | 0 (0.0%) | 0 (0.0%) |
| Total | 40 (100.0%) | 26 (100.0%) |
Commute Time in Page
The most frequently occuring commute durations in Page are 20 to 24 minutes (30 commuters, 45.5%), 25 to 29 minutes (17 commuters, 25.8%), and 15 to 19 minutes (12 commuters, 18.2%).
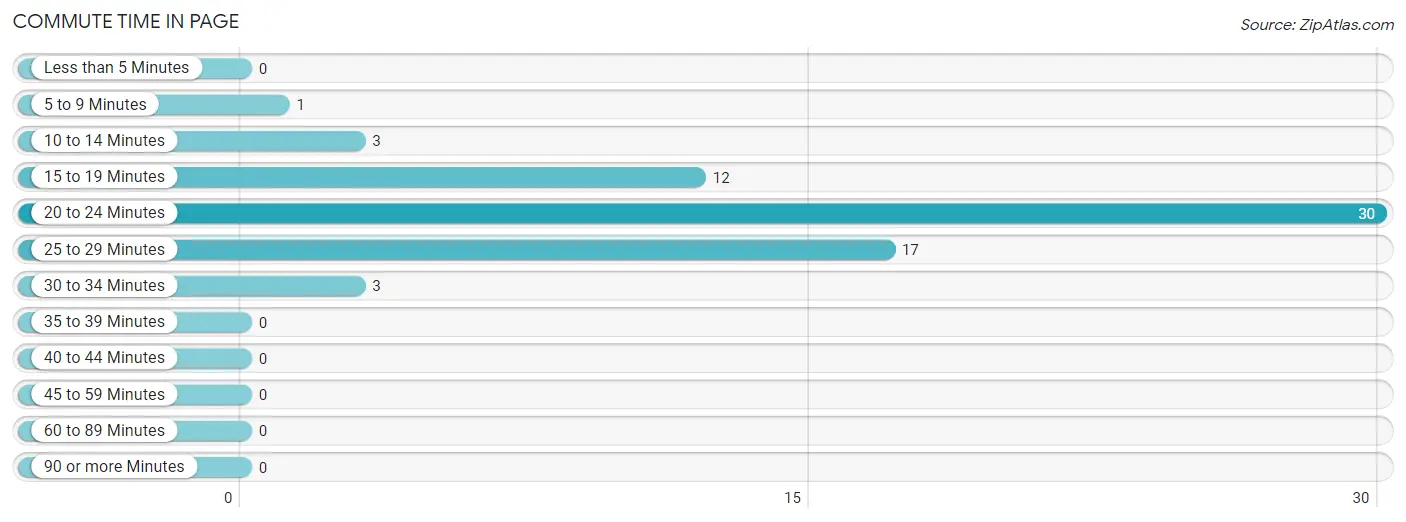
| Commute Time | # Commuters | % Commuters |
| Less than 5 Minutes | 0 | 0.0% |
| 5 to 9 Minutes | 1 | 1.5% |
| 10 to 14 Minutes | 3 | 4.5% |
| 15 to 19 Minutes | 12 | 18.2% |
| 20 to 24 Minutes | 30 | 45.5% |
| 25 to 29 Minutes | 17 | 25.8% |
| 30 to 34 Minutes | 3 | 4.5% |
| 35 to 39 Minutes | 0 | 0.0% |
| 40 to 44 Minutes | 0 | 0.0% |
| 45 to 59 Minutes | 0 | 0.0% |
| 60 to 89 Minutes | 0 | 0.0% |
| 90 or more Minutes | 0 | 0.0% |
Commute Time by Sex in Page
The most common commute times in Page are 20 to 24 minutes (19 commuters, 47.5%) for males and 25 to 29 minutes (12 commuters, 46.2%) for females.
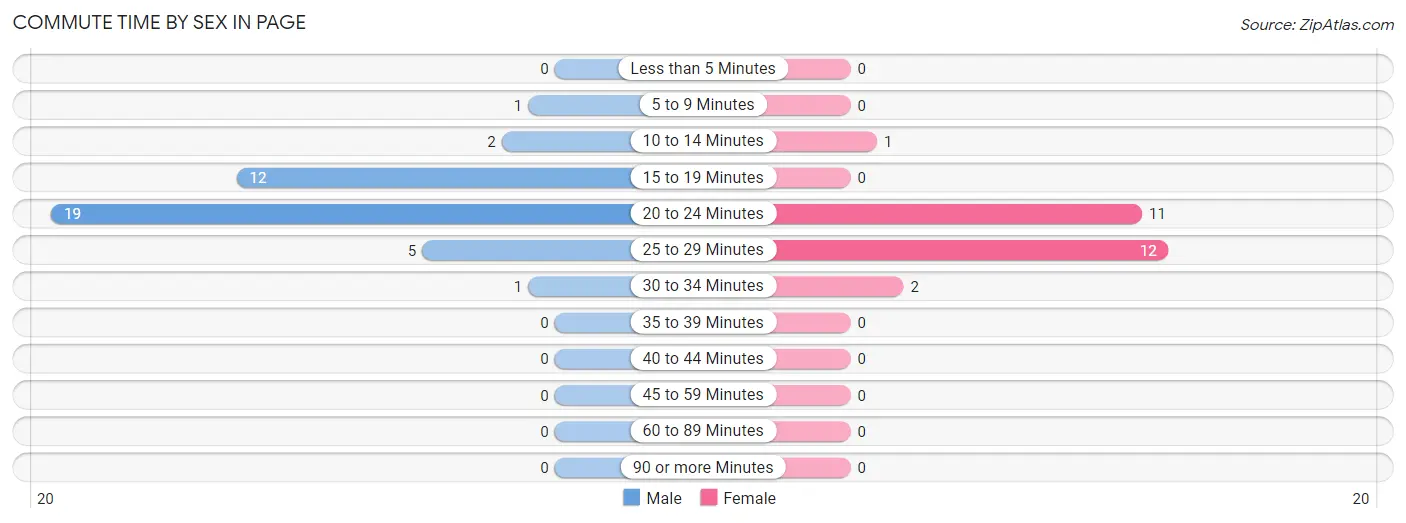
| Commute Time | Male | Female |
| Less than 5 Minutes | 0 (0.0%) | 0 (0.0%) |
| 5 to 9 Minutes | 1 (2.5%) | 0 (0.0%) |
| 10 to 14 Minutes | 2 (5.0%) | 1 (3.8%) |
| 15 to 19 Minutes | 12 (30.0%) | 0 (0.0%) |
| 20 to 24 Minutes | 19 (47.5%) | 11 (42.3%) |
| 25 to 29 Minutes | 5 (12.5%) | 12 (46.2%) |
| 30 to 34 Minutes | 1 (2.5%) | 2 (7.7%) |
| 35 to 39 Minutes | 0 (0.0%) | 0 (0.0%) |
| 40 to 44 Minutes | 0 (0.0%) | 0 (0.0%) |
| 45 to 59 Minutes | 0 (0.0%) | 0 (0.0%) |
| 60 to 89 Minutes | 0 (0.0%) | 0 (0.0%) |
| 90 or more Minutes | 0 (0.0%) | 0 (0.0%) |
Time of Departure to Work by Sex in Page
The most frequent times of departure to work in Page are 7:30 AM to 7:59 AM (18, 45.0%) for males and 8:00 AM to 8:29 AM (17, 65.4%) for females.
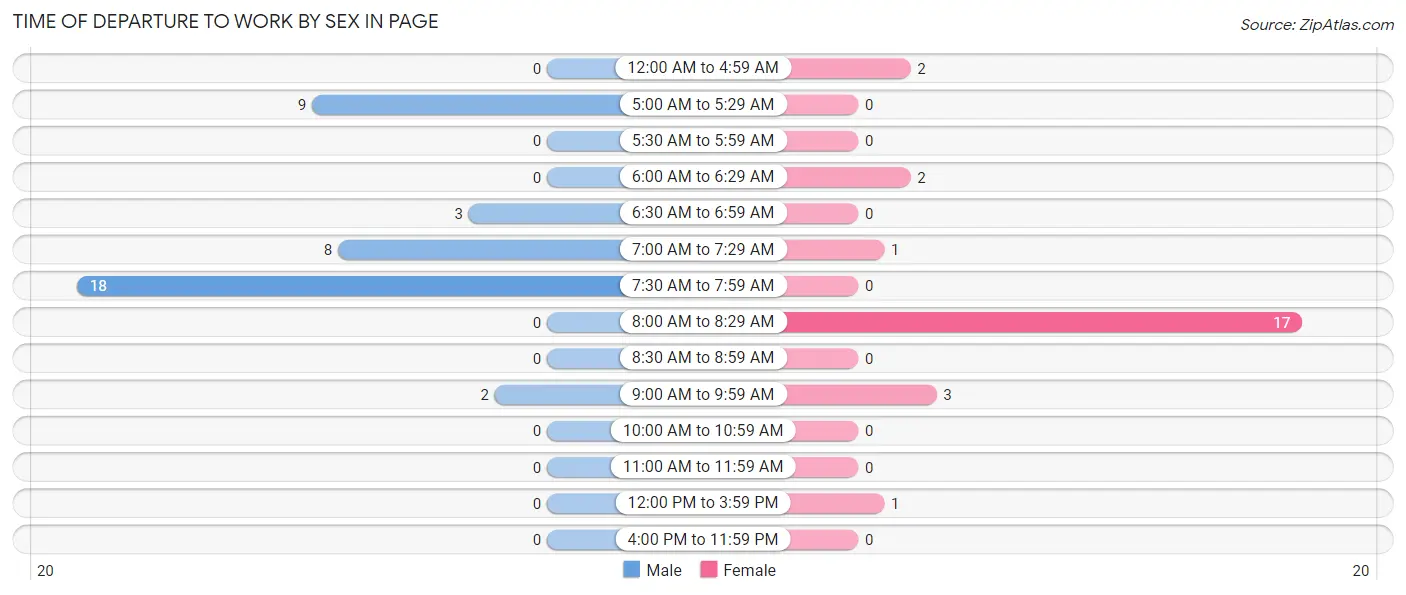
| Time of Departure | Male | Female |
| 12:00 AM to 4:59 AM | 0 (0.0%) | 2 (7.7%) |
| 5:00 AM to 5:29 AM | 9 (22.5%) | 0 (0.0%) |
| 5:30 AM to 5:59 AM | 0 (0.0%) | 0 (0.0%) |
| 6:00 AM to 6:29 AM | 0 (0.0%) | 2 (7.7%) |
| 6:30 AM to 6:59 AM | 3 (7.5%) | 0 (0.0%) |
| 7:00 AM to 7:29 AM | 8 (20.0%) | 1 (3.8%) |
| 7:30 AM to 7:59 AM | 18 (45.0%) | 0 (0.0%) |
| 8:00 AM to 8:29 AM | 0 (0.0%) | 17 (65.4%) |
| 8:30 AM to 8:59 AM | 0 (0.0%) | 0 (0.0%) |
| 9:00 AM to 9:59 AM | 2 (5.0%) | 3 (11.5%) |
| 10:00 AM to 10:59 AM | 0 (0.0%) | 0 (0.0%) |
| 11:00 AM to 11:59 AM | 0 (0.0%) | 0 (0.0%) |
| 12:00 PM to 3:59 PM | 0 (0.0%) | 1 (3.8%) |
| 4:00 PM to 11:59 PM | 0 (0.0%) | 0 (0.0%) |
| Total | 40 (100.0%) | 26 (100.0%) |
Housing Occupancy in Page
Occupancy by Ownership in Page
Of the total 53 dwellings in Page, owner-occupied units account for 53 (100.0%), while renter-occupied units make up 0 (0.0%).
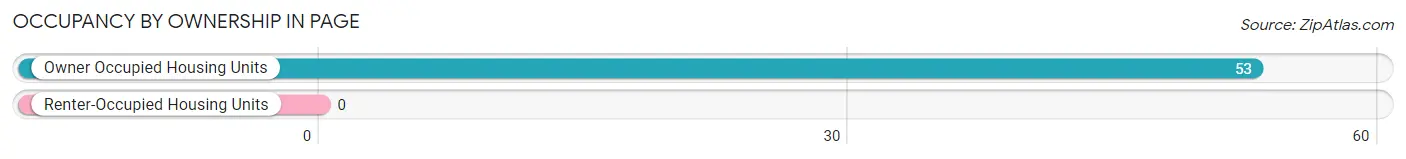
| Occupancy | # Housing Units | % Housing Units |
| Owner Occupied Housing Units | 53 | 100.0% |
| Renter-Occupied Housing Units | 0 | 0.0% |
| Total Occupied Housing Units | 53 | 100.0% |
Occupancy by Household Size in Page
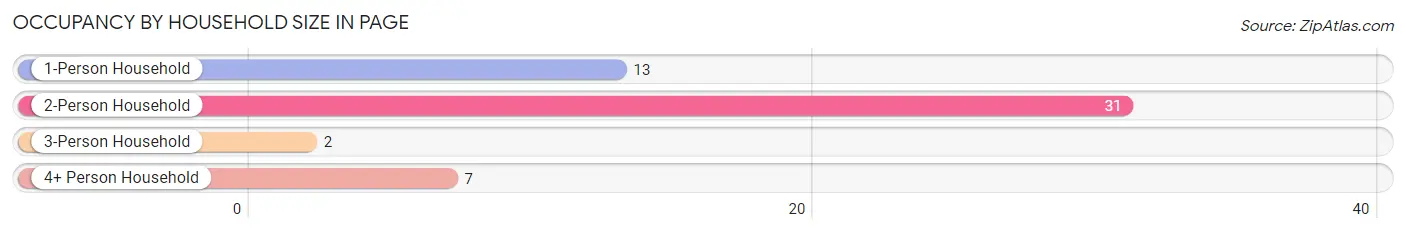
| Household Size | # Housing Units | % Housing Units |
| 1-Person Household | 13 | 24.5% |
| 2-Person Household | 31 | 58.5% |
| 3-Person Household | 2 | 3.8% |
| 4+ Person Household | 7 | 13.2% |
| Total Housing Units | 53 | 100.0% |
Occupancy by Ownership by Household Size in Page
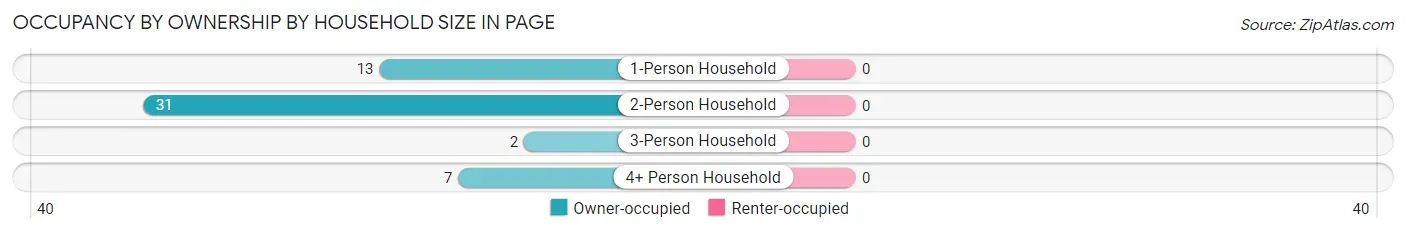
| Household Size | Owner-occupied | Renter-occupied |
| 1-Person Household | 13 (100.0%) | 0 (0.0%) |
| 2-Person Household | 31 (100.0%) | 0 (0.0%) |
| 3-Person Household | 2 (100.0%) | 0 (0.0%) |
| 4+ Person Household | 7 (100.0%) | 0 (0.0%) |
| Total Housing Units | 53 (100.0%) | 0 (0.0%) |
Occupancy by Educational Attainment in Page
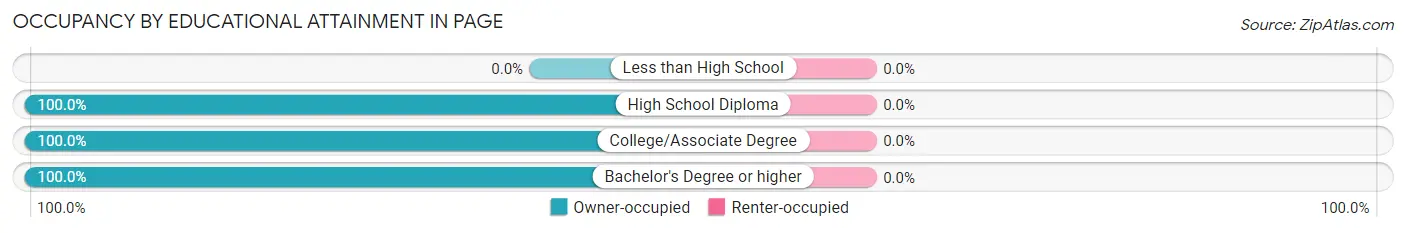
| Household Size | Owner-occupied | Renter-occupied |
| Less than High School | 0 (0.0%) | 0 (0.0%) |
| High School Diploma | 5 (100.0%) | 0 (0.0%) |
| College/Associate Degree | 27 (100.0%) | 0 (0.0%) |
| Bachelor's Degree or higher | 21 (100.0%) | 0 (0.0%) |
Occupancy by Age of Householder in Page
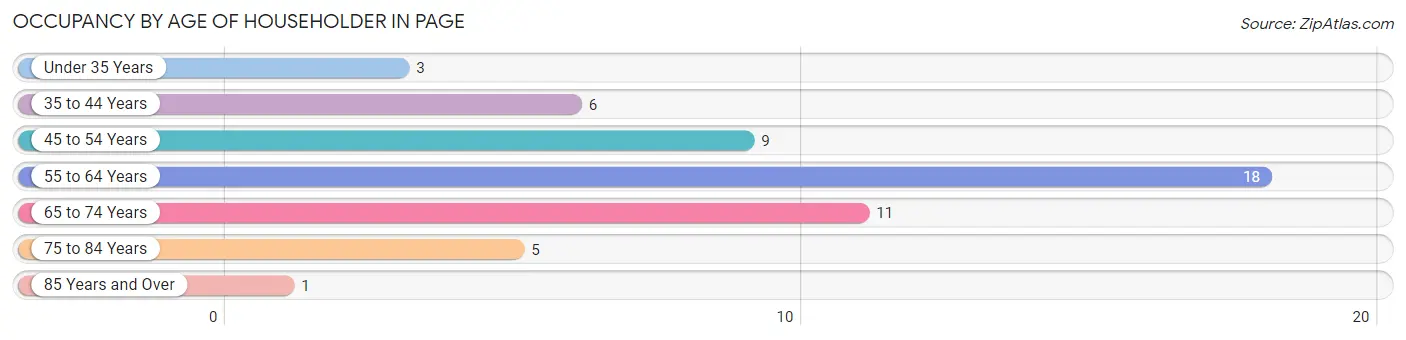
| Age Bracket | # Households | % Households |
| Under 35 Years | 3 | 5.7% |
| 35 to 44 Years | 6 | 11.3% |
| 45 to 54 Years | 9 | 17.0% |
| 55 to 64 Years | 18 | 34.0% |
| 65 to 74 Years | 11 | 20.7% |
| 75 to 84 Years | 5 | 9.4% |
| 85 Years and Over | 1 | 1.9% |
| Total | 53 | 100.0% |
Housing Finances in Page
Median Income by Occupancy in Page
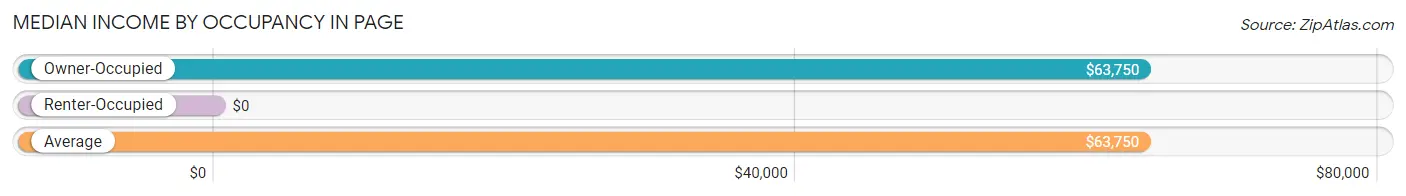
| Occupancy Type | # Households | Median Income |
| Owner-Occupied | 53 (100.0%) | $63,750 |
| Renter-Occupied | 0 (0.0%) | $0 |
| Average | 53 (100.0%) | $63,750 |
Occupancy by Householder Income Bracket in Page
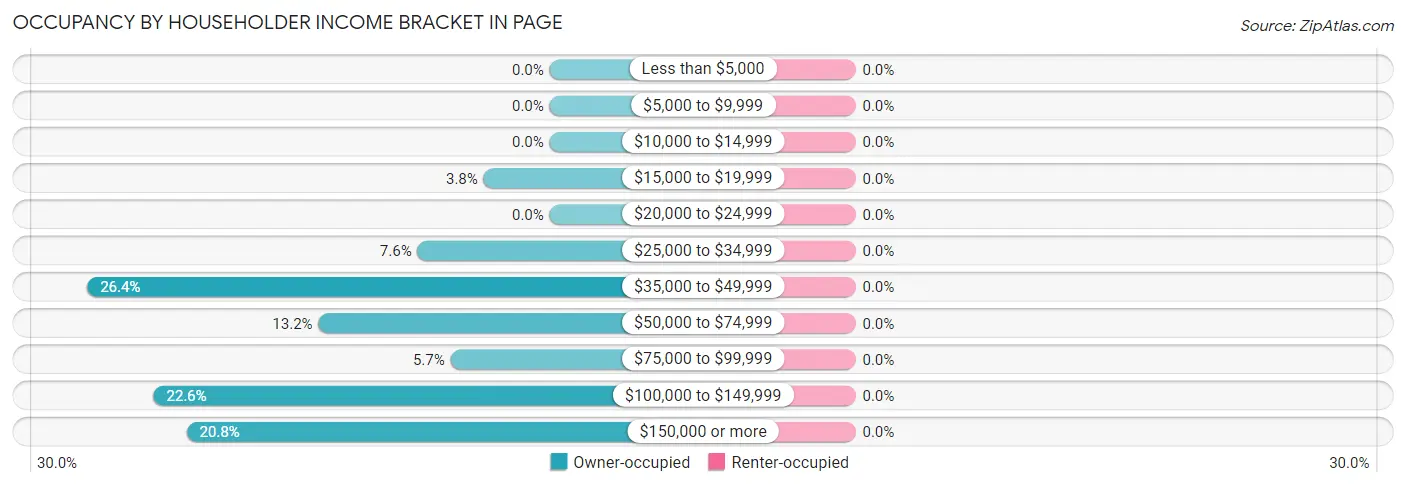
| Income Bracket | Owner-occupied | Renter-occupied |
| Less than $5,000 | 0 (0.0%) | 0 (0.0%) |
| $5,000 to $9,999 | 0 (0.0%) | 0 (0.0%) |
| $10,000 to $14,999 | 0 (0.0%) | 0 (0.0%) |
| $15,000 to $19,999 | 2 (3.8%) | 0 (0.0%) |
| $20,000 to $24,999 | 0 (0.0%) | 0 (0.0%) |
| $25,000 to $34,999 | 4 (7.5%) | 0 (0.0%) |
| $35,000 to $49,999 | 14 (26.4%) | 0 (0.0%) |
| $50,000 to $74,999 | 7 (13.2%) | 0 (0.0%) |
| $75,000 to $99,999 | 3 (5.7%) | 0 (0.0%) |
| $100,000 to $149,999 | 12 (22.6%) | 0 (0.0%) |
| $150,000 or more | 11 (20.7%) | 0 (0.0%) |
| Total | 53 (100.0%) | 0 (0.0%) |
Monthly Housing Cost Tiers in Page
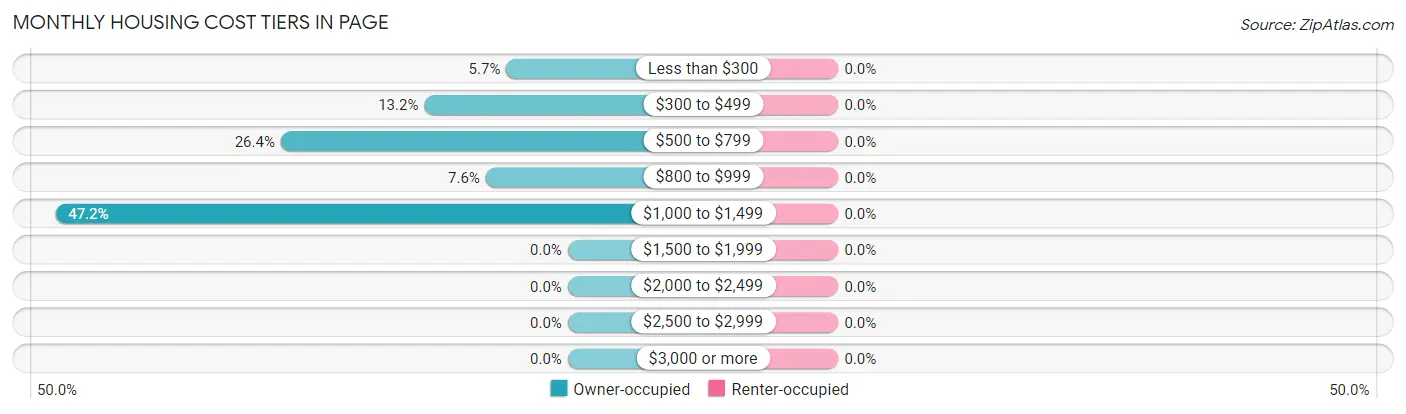
| Monthly Cost | Owner-occupied | Renter-occupied |
| Less than $300 | 3 (5.7%) | 0 (0.0%) |
| $300 to $499 | 7 (13.2%) | 0 (0.0%) |
| $500 to $799 | 14 (26.4%) | 0 (0.0%) |
| $800 to $999 | 4 (7.5%) | 0 (0.0%) |
| $1,000 to $1,499 | 25 (47.2%) | 0 (0.0%) |
| $1,500 to $1,999 | 0 (0.0%) | 0 (0.0%) |
| $2,000 to $2,499 | 0 (0.0%) | 0 (0.0%) |
| $2,500 to $2,999 | 0 (0.0%) | 0 (0.0%) |
| $3,000 or more | 0 (0.0%) | 0 (0.0%) |
| Total | 53 (100.0%) | 0 (0.0%) |
Physical Housing Characteristics in Page
Housing Structures in Page
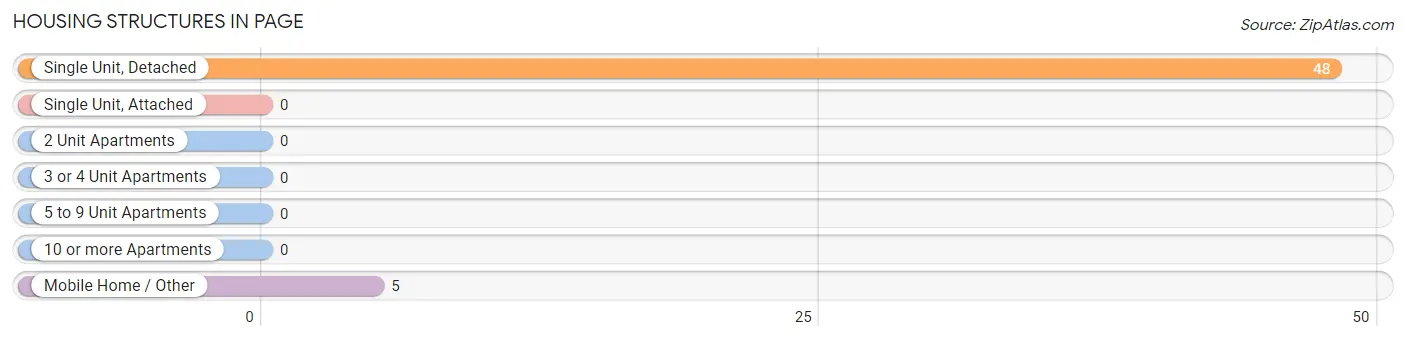
| Structure Type | # Housing Units | % Housing Units |
| Single Unit, Detached | 48 | 90.6% |
| Single Unit, Attached | 0 | 0.0% |
| 2 Unit Apartments | 0 | 0.0% |
| 3 or 4 Unit Apartments | 0 | 0.0% |
| 5 to 9 Unit Apartments | 0 | 0.0% |
| 10 or more Apartments | 0 | 0.0% |
| Mobile Home / Other | 5 | 9.4% |
| Total | 53 | 100.0% |
Housing Structures by Occupancy in Page
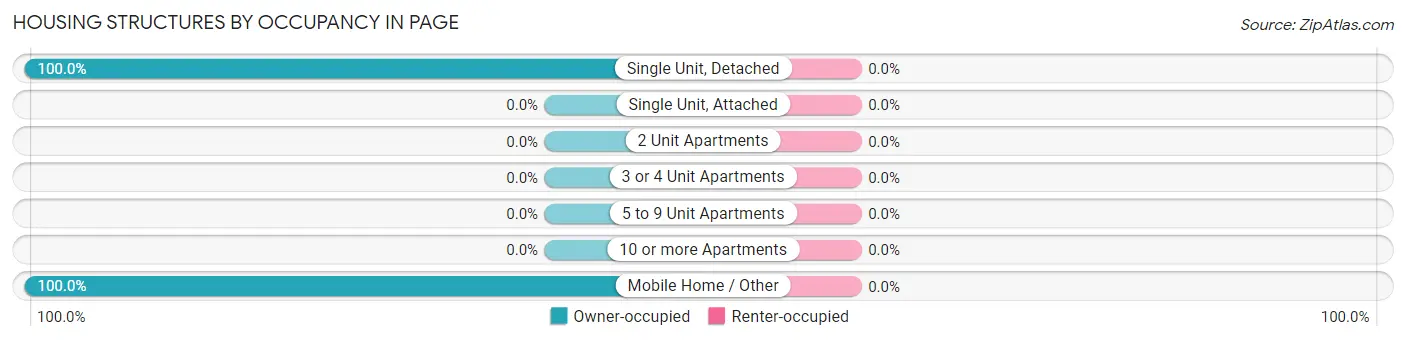
| Structure Type | Owner-occupied | Renter-occupied |
| Single Unit, Detached | 48 (100.0%) | 0 (0.0%) |
| Single Unit, Attached | 0 (0.0%) | 0 (0.0%) |
| 2 Unit Apartments | 0 (0.0%) | 0 (0.0%) |
| 3 or 4 Unit Apartments | 0 (0.0%) | 0 (0.0%) |
| 5 to 9 Unit Apartments | 0 (0.0%) | 0 (0.0%) |
| 10 or more Apartments | 0 (0.0%) | 0 (0.0%) |
| Mobile Home / Other | 5 (100.0%) | 0 (0.0%) |
| Total | 53 (100.0%) | 0 (0.0%) |
Housing Structures by Number of Rooms in Page
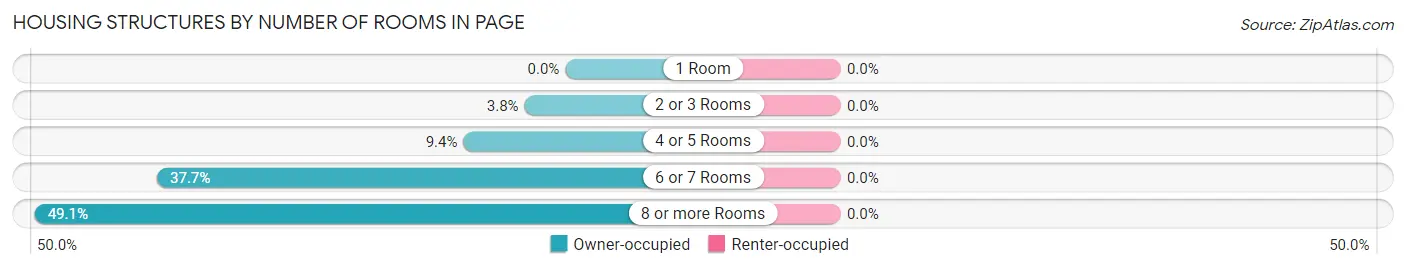
| Number of Rooms | Owner-occupied | Renter-occupied |
| 1 Room | 0 (0.0%) | 0 (0.0%) |
| 2 or 3 Rooms | 2 (3.8%) | 0 (0.0%) |
| 4 or 5 Rooms | 5 (9.4%) | 0 (0.0%) |
| 6 or 7 Rooms | 20 (37.7%) | 0 (0.0%) |
| 8 or more Rooms | 26 (49.1%) | 0 (0.0%) |
| Total | 53 (100.0%) | 0 (0.0%) |
Housing Structure by Heating Type in Page
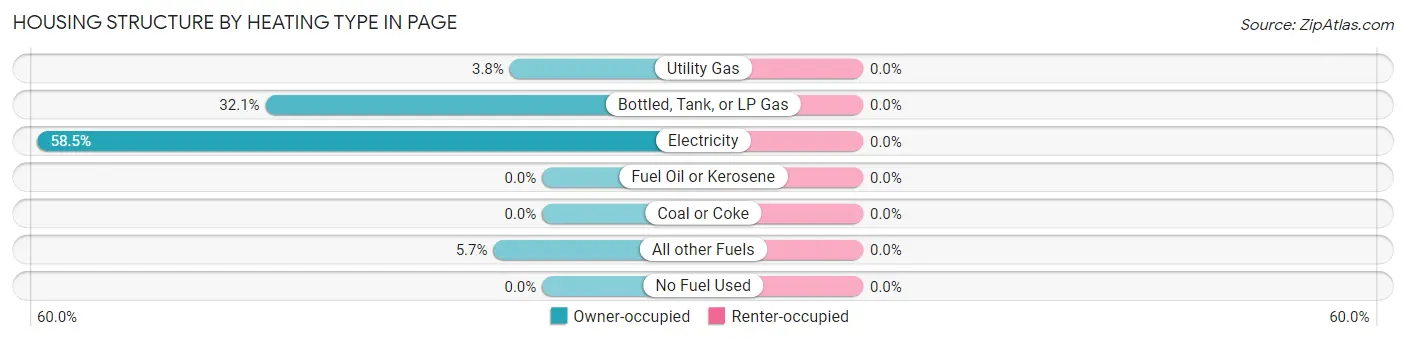
| Heating Type | Owner-occupied | Renter-occupied |
| Utility Gas | 2 (3.8%) | 0 (0.0%) |
| Bottled, Tank, or LP Gas | 17 (32.1%) | 0 (0.0%) |
| Electricity | 31 (58.5%) | 0 (0.0%) |
| Fuel Oil or Kerosene | 0 (0.0%) | 0 (0.0%) |
| Coal or Coke | 0 (0.0%) | 0 (0.0%) |
| All other Fuels | 3 (5.7%) | 0 (0.0%) |
| No Fuel Used | 0 (0.0%) | 0 (0.0%) |
| Total | 53 (100.0%) | 0 (0.0%) |
Household Vehicle Usage in Page
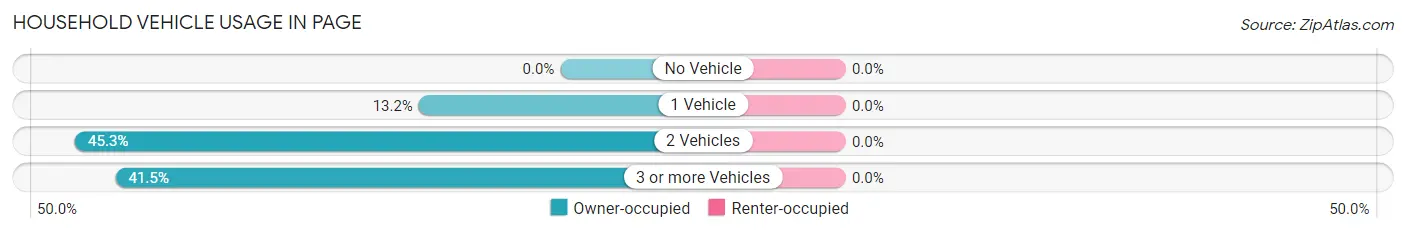
| Vehicles per Household | Owner-occupied | Renter-occupied |
| No Vehicle | 0 (0.0%) | 0 (0.0%) |
| 1 Vehicle | 7 (13.2%) | 0 (0.0%) |
| 2 Vehicles | 24 (45.3%) | 0 (0.0%) |
| 3 or more Vehicles | 22 (41.5%) | 0 (0.0%) |
| Total | 53 (100.0%) | 0 (0.0%) |
Real Estate & Mortgages in Page
Real Estate and Mortgage Overview in Page
| Characteristic | Without Mortgage | With Mortgage |
| Housing Units | 26 | 27 |
| Median Property Value | $75,000 | $108,000 |
| Median Household Income | $56,667 | $9 |
| Monthly Housing Costs | $600 | $0 |
| Real Estate Taxes | $1,214 | $1 |
Property Value by Mortgage Status in Page
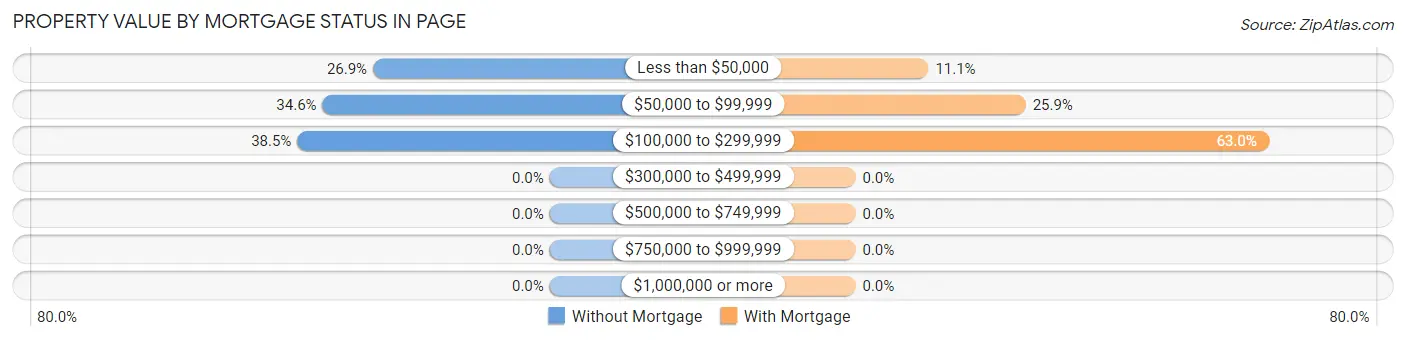
| Property Value | Without Mortgage | With Mortgage |
| Less than $50,000 | 7 (26.9%) | 3 (11.1%) |
| $50,000 to $99,999 | 9 (34.6%) | 7 (25.9%) |
| $100,000 to $299,999 | 10 (38.5%) | 17 (63.0%) |
| $300,000 to $499,999 | 0 (0.0%) | 0 (0.0%) |
| $500,000 to $749,999 | 0 (0.0%) | 0 (0.0%) |
| $750,000 to $999,999 | 0 (0.0%) | 0 (0.0%) |
| $1,000,000 or more | 0 (0.0%) | 0 (0.0%) |
| Total | 26 (100.0%) | 27 (100.0%) |
Household Income by Mortgage Status in Page
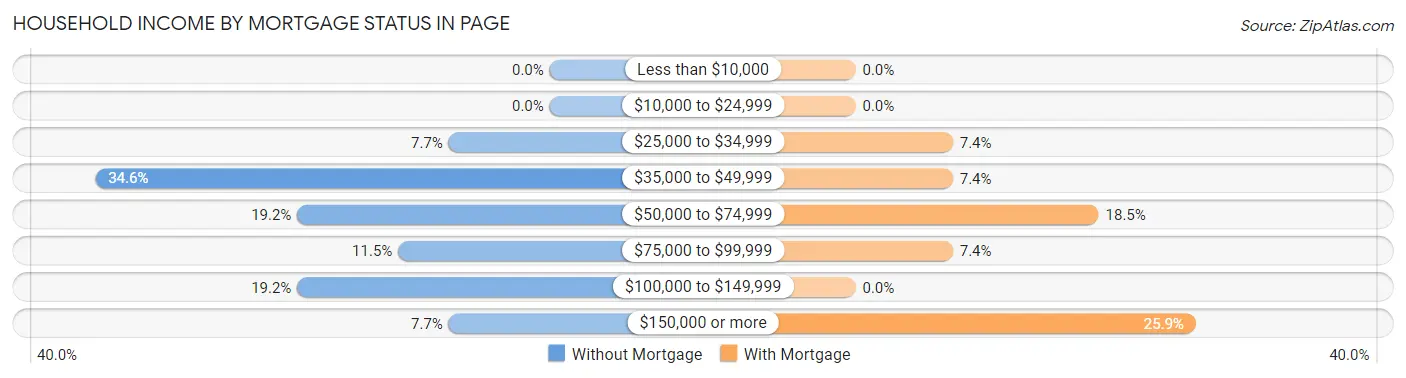
| Household Income | Without Mortgage | With Mortgage |
| Less than $10,000 | 0 (0.0%) | 0 (0.0%) |
| $10,000 to $24,999 | 0 (0.0%) | 0 (0.0%) |
| $25,000 to $34,999 | 2 (7.7%) | 2 (7.4%) |
| $35,000 to $49,999 | 9 (34.6%) | 2 (7.4%) |
| $50,000 to $74,999 | 5 (19.2%) | 5 (18.5%) |
| $75,000 to $99,999 | 3 (11.5%) | 2 (7.4%) |
| $100,000 to $149,999 | 5 (19.2%) | 0 (0.0%) |
| $150,000 or more | 2 (7.7%) | 7 (25.9%) |
| Total | 26 (100.0%) | 27 (100.0%) |
Property Value to Household Income Ratio in Page
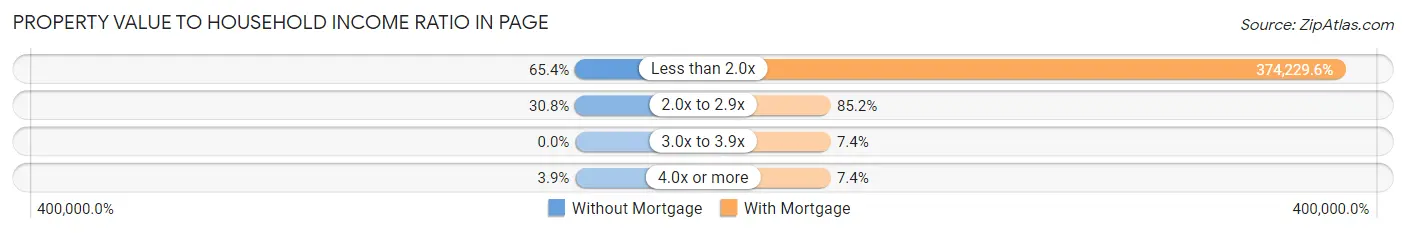
| Value-to-Income Ratio | Without Mortgage | With Mortgage |
| Less than 2.0x | 17 (65.4%) | 101,042 (374,229.6%) |
| 2.0x to 2.9x | 8 (30.8%) | 23 (85.2%) |
| 3.0x to 3.9x | 0 (0.0%) | 2 (7.4%) |
| 4.0x or more | 1 (3.8%) | 2 (7.4%) |
| Total | 26 (100.0%) | 27 (100.0%) |
Real Estate Taxes by Mortgage Status in Page
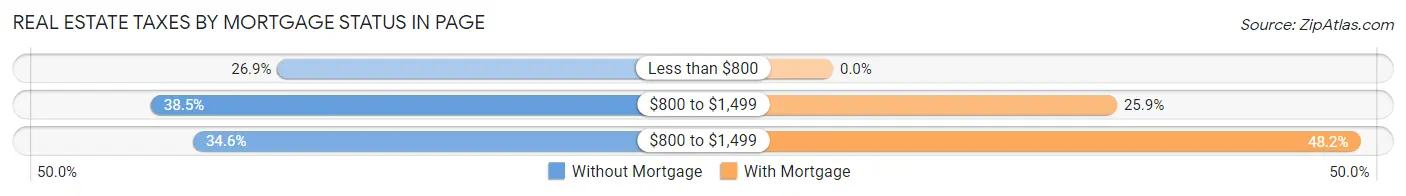
| Property Taxes | Without Mortgage | With Mortgage |
| Less than $800 | 7 (26.9%) | 0 (0.0%) |
| $800 to $1,499 | 10 (38.5%) | 7 (25.9%) |
| $800 to $1,499 | 9 (34.6%) | 13 (48.1%) |
| Total | 26 (100.0%) | 27 (100.0%) |
Health & Disability in Page
Health Insurance Coverage by Age in Page
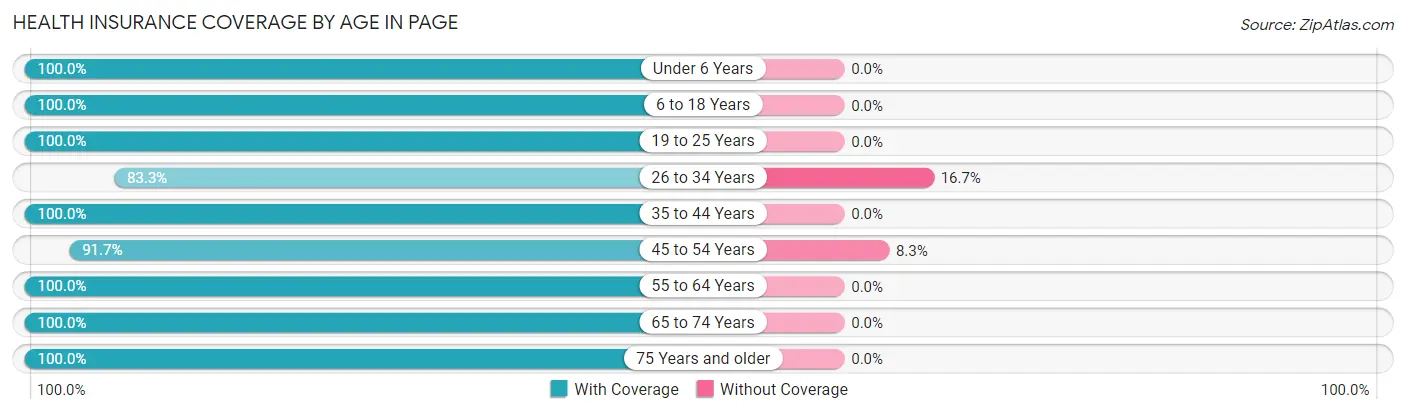
| Age Bracket | With Coverage | Without Coverage |
| Under 6 Years | 4 (100.0%) | 0 (0.0%) |
| 6 to 18 Years | 29 (100.0%) | 0 (0.0%) |
| 19 to 25 Years | 7 (100.0%) | 0 (0.0%) |
| 26 to 34 Years | 5 (83.3%) | 1 (16.7%) |
| 35 to 44 Years | 14 (100.0%) | 0 (0.0%) |
| 45 to 54 Years | 11 (91.7%) | 1 (8.3%) |
| 55 to 64 Years | 30 (100.0%) | 0 (0.0%) |
| 65 to 74 Years | 18 (100.0%) | 0 (0.0%) |
| 75 Years and older | 10 (100.0%) | 0 (0.0%) |
| Total | 128 (98.5%) | 2 (1.5%) |
Health Insurance Coverage by Citizenship Status in Page
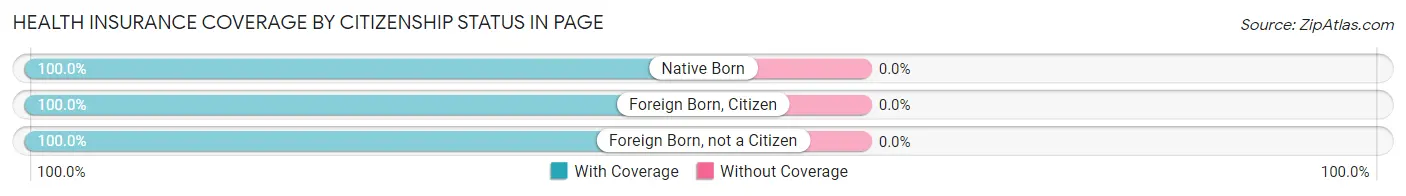
| Citizenship Status | With Coverage | Without Coverage |
| Native Born | 4 (100.0%) | 0 (0.0%) |
| Foreign Born, Citizen | 29 (100.0%) | 0 (0.0%) |
| Foreign Born, not a Citizen | 7 (100.0%) | 0 (0.0%) |
Health Insurance Coverage by Household Income in Page
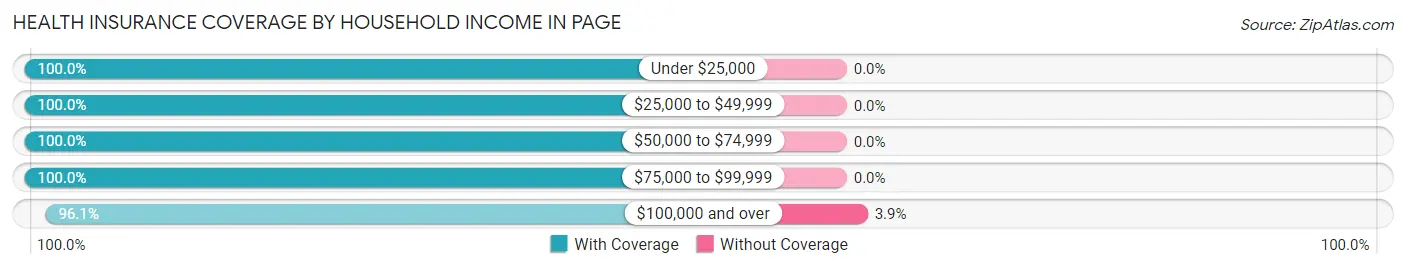
| Household Income | With Coverage | Without Coverage |
| Under $25,000 | 2 (100.0%) | 0 (0.0%) |
| $25,000 to $49,999 | 59 (100.0%) | 0 (0.0%) |
| $50,000 to $74,999 | 11 (100.0%) | 0 (0.0%) |
| $75,000 to $99,999 | 7 (100.0%) | 0 (0.0%) |
| $100,000 and over | 49 (96.1%) | 2 (3.9%) |
Public vs Private Health Insurance Coverage by Age in Page
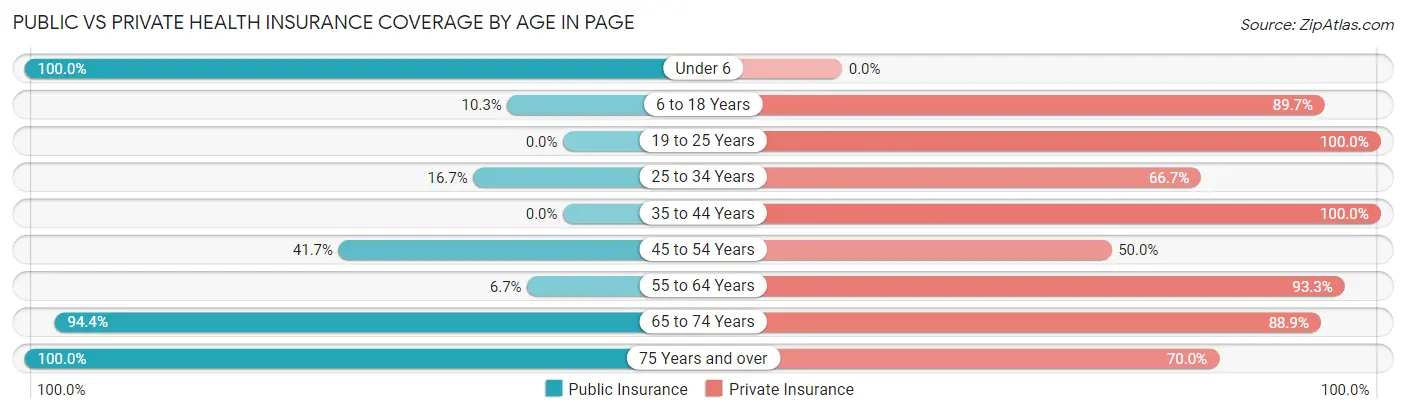
| Age Bracket | Public Insurance | Private Insurance |
| Under 6 | 4 (100.0%) | 0 (0.0%) |
| 6 to 18 Years | 3 (10.3%) | 26 (89.7%) |
| 19 to 25 Years | 0 (0.0%) | 7 (100.0%) |
| 25 to 34 Years | 1 (16.7%) | 4 (66.7%) |
| 35 to 44 Years | 0 (0.0%) | 14 (100.0%) |
| 45 to 54 Years | 5 (41.7%) | 6 (50.0%) |
| 55 to 64 Years | 2 (6.7%) | 28 (93.3%) |
| 65 to 74 Years | 17 (94.4%) | 16 (88.9%) |
| 75 Years and over | 10 (100.0%) | 7 (70.0%) |
| Total | 42 (32.3%) | 108 (83.1%) |
Disability Status by Sex by Age in Page
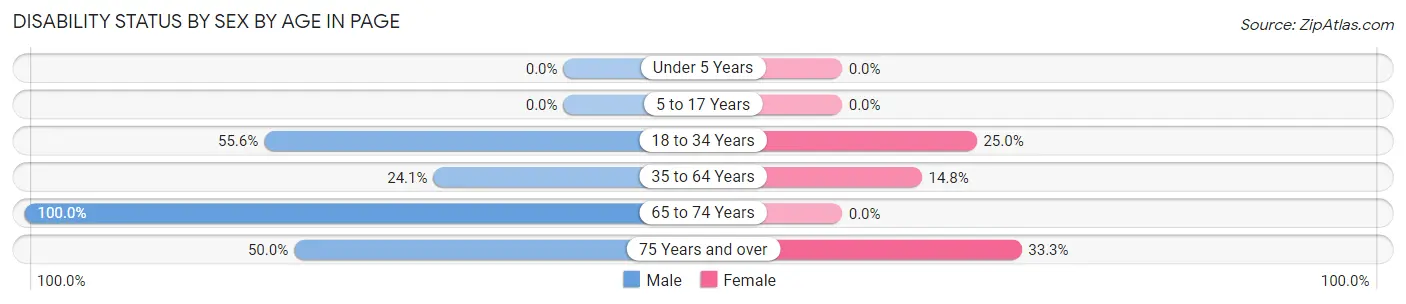
| Age Bracket | Male | Female |
| Under 5 Years | 0 (0.0%) | 0 (0.0%) |
| 5 to 17 Years | 0 (0.0%) | 0 (0.0%) |
| 18 to 34 Years | 5 (55.6%) | 1 (25.0%) |
| 35 to 64 Years | 7 (24.1%) | 4 (14.8%) |
| 65 to 74 Years | 6 (100.0%) | 0 (0.0%) |
| 75 Years and over | 2 (50.0%) | 2 (33.3%) |
Disability Class by Sex by Age in Page
Disability Class: Hearing Difficulty
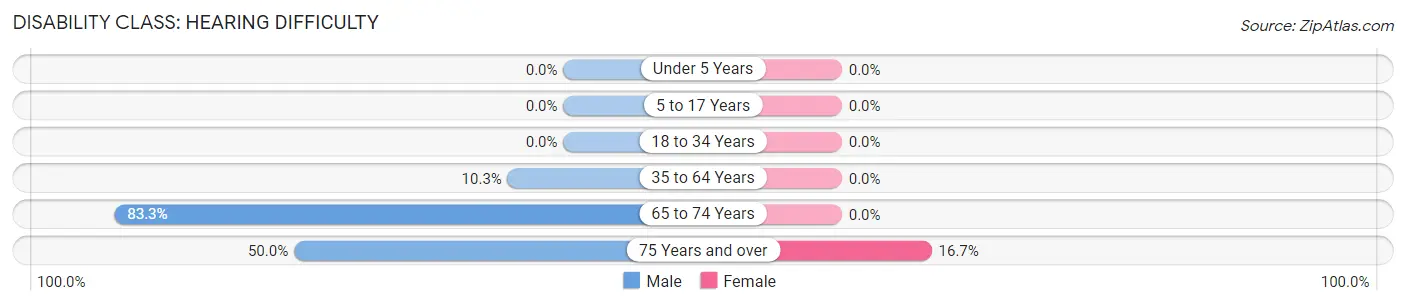
| Age Bracket | Male | Female |
| Under 5 Years | 0 (0.0%) | 0 (0.0%) |
| 5 to 17 Years | 0 (0.0%) | 0 (0.0%) |
| 18 to 34 Years | 0 (0.0%) | 0 (0.0%) |
| 35 to 64 Years | 3 (10.3%) | 0 (0.0%) |
| 65 to 74 Years | 5 (83.3%) | 0 (0.0%) |
| 75 Years and over | 2 (50.0%) | 1 (16.7%) |
Disability Class: Vision Difficulty
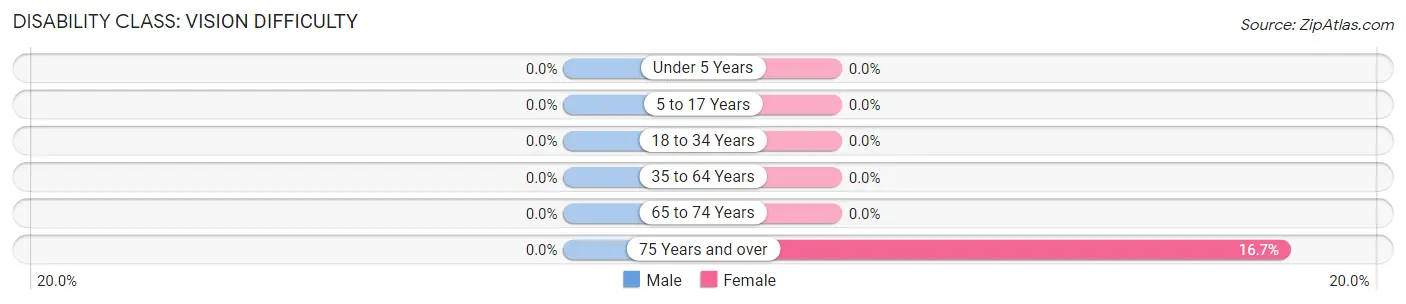
| Age Bracket | Male | Female |
| Under 5 Years | 0 (0.0%) | 0 (0.0%) |
| 5 to 17 Years | 0 (0.0%) | 0 (0.0%) |
| 18 to 34 Years | 0 (0.0%) | 0 (0.0%) |
| 35 to 64 Years | 0 (0.0%) | 0 (0.0%) |
| 65 to 74 Years | 0 (0.0%) | 0 (0.0%) |
| 75 Years and over | 0 (0.0%) | 1 (16.7%) |
Disability Class: Cognitive Difficulty
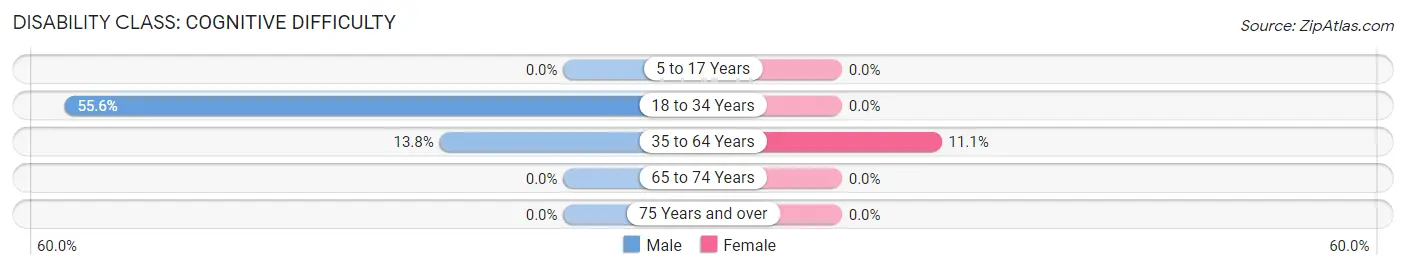
| Age Bracket | Male | Female |
| 5 to 17 Years | 0 (0.0%) | 0 (0.0%) |
| 18 to 34 Years | 5 (55.6%) | 0 (0.0%) |
| 35 to 64 Years | 4 (13.8%) | 3 (11.1%) |
| 65 to 74 Years | 0 (0.0%) | 0 (0.0%) |
| 75 Years and over | 0 (0.0%) | 0 (0.0%) |
Disability Class: Ambulatory Difficulty
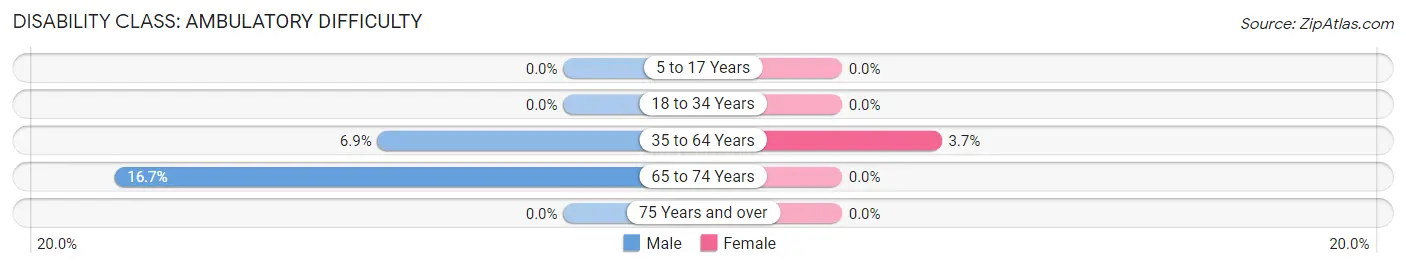
| Age Bracket | Male | Female |
| 5 to 17 Years | 0 (0.0%) | 0 (0.0%) |
| 18 to 34 Years | 0 (0.0%) | 0 (0.0%) |
| 35 to 64 Years | 2 (6.9%) | 1 (3.7%) |
| 65 to 74 Years | 1 (16.7%) | 0 (0.0%) |
| 75 Years and over | 0 (0.0%) | 0 (0.0%) |
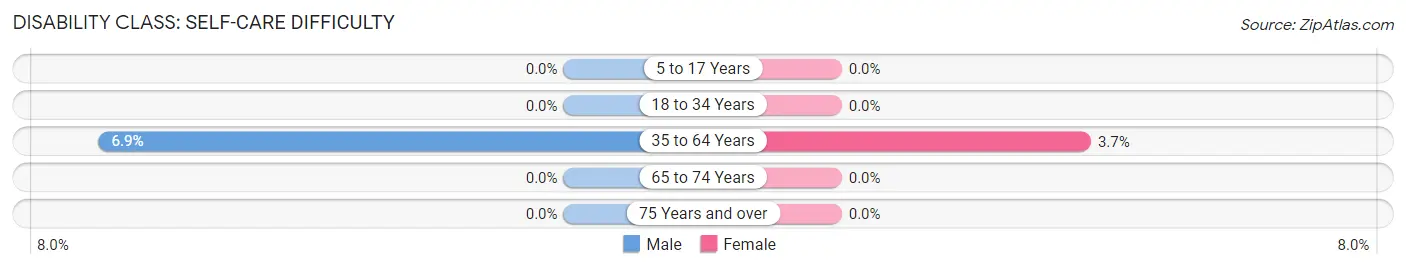
Disability Class: Self-Care Difficulty
| Age Bracket | Male | Female |
| 5 to 17 Years | 0 (0.0%) | 0 (0.0%) |
| 18 to 34 Years | 0 (0.0%) | 0 (0.0%) |
| 35 to 64 Years | 2 (6.9%) | 1 (3.7%) |
| 65 to 74 Years | 0 (0.0%) | 0 (0.0%) |
| 75 Years and over | 0 (0.0%) | 0 (0.0%) |
Technology Access in Page
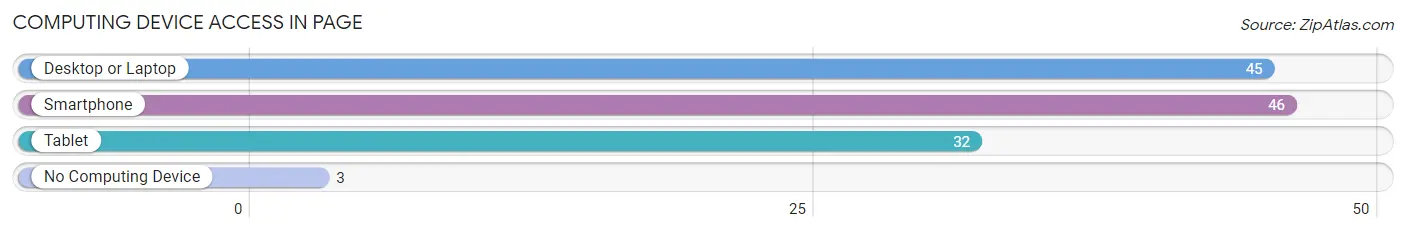
Computing Device Access in Page
| Device Type | # Households | % Households |
| Desktop or Laptop | 45 | 84.9% |
| Smartphone | 46 | 86.8% |
| Tablet | 32 | 60.4% |
| No Computing Device | 3 | 5.7% |
| Total | 53 | 100.0% |
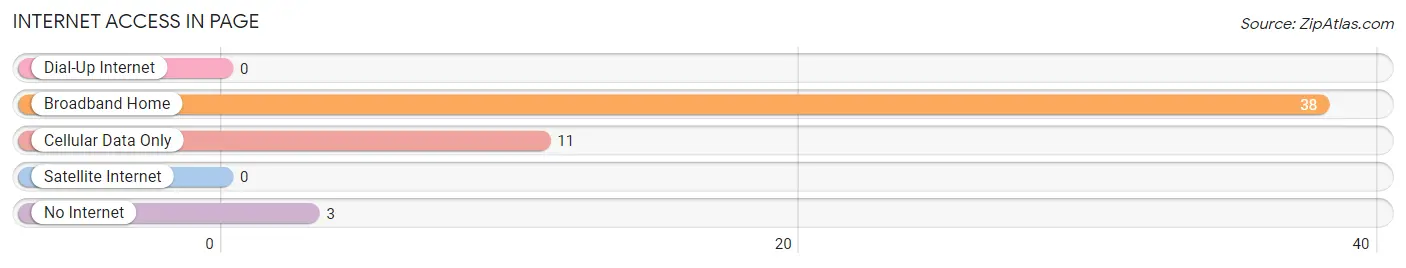
Internet Access in Page
| Internet Type | # Households | % Households |
| Dial-Up Internet | 0 | 0.0% |
| Broadband Home | 38 | 71.7% |
| Cellular Data Only | 11 | 20.7% |
| Satellite Internet | 0 | 0.0% |
| No Internet | 3 | 5.7% |
| Total | 53 | 100.0% |
Page Summary
The state of Nebraska is located in the Midwestern United States and is bordered by South Dakota to the north, Iowa and Missouri to the east, Kansas to the south, and Colorado to the west. Nebraska is the 16th largest state in the United States, with an area of 77,354 square miles, and the 37th most populous, with a population of 1,711,263 as of the 2010 census.
History
The area that is now Nebraska was first inhabited by Native American tribes, including the Omaha, Pawnee, and Otoe. The first Europeans to explore the area were French fur traders, who arrived in the late 17th century. The area was part of the Louisiana Purchase in 1803, and was organized as part of the Nebraska Territory in 1854. Nebraska became the 37th state in 1867.
During the 19th century, Nebraska was a major destination for settlers, particularly those from Europe. The Homestead Act of 1862 encouraged many to move to the state, and by the end of the century, Nebraska had become a major agricultural producer. The state also played an important role in the development of the transcontinental railroad, with the Union Pacific Railroad having its headquarters in Omaha.
Geography
Nebraska is located in the Great Plains region of the United States, and is bordered by South Dakota to the north, Iowa and Missouri to the east, Kansas to the south, and Colorado to the west. The state is divided into two distinct regions: the Dissected Till Plains in the east, and the Great Plains in the west. The eastern region is characterized by rolling hills and fertile soil, while the western region is characterized by flat prairies and grasslands.
The state is home to several major rivers, including the Platte, Niobrara, and Missouri. The Platte River is the longest river in the state, and is a major tributary of the Missouri River. The state also contains several large lakes, including Lake McConaughy, Harlan County Lake, and Lake Ogallala.
Economy
Nebraska has a diverse economy, with agriculture, manufacturing, and services being the three largest sectors. Agriculture is the state’s largest industry, and is responsible for over one-third of the state’s total economic output. The state is a major producer of corn, soybeans, wheat, and other crops.
Manufacturing is the second largest sector of the economy, and is responsible for over one-fifth of the state’s total economic output. The state is home to several major manufacturing companies, including ConAgra Foods, Union Pacific Railroad, and Berkshire Hathaway.
Services are the third largest sector of the economy, and are responsible for over one-sixth of the state’s total economic output. The state is home to several major service companies, including Mutual of Omaha, TD Ameritrade, and First National Bank of Omaha.
Demographics
As of the 2010 census, Nebraska had a population of 1,711,263. The state is predominantly white, with non-Hispanic whites making up 84.2% of the population. The state is also home to a large Hispanic population, with Hispanics making up 8.9% of the population. Other racial groups include African Americans (4.2%), Asians (2.2%), and Native Americans (1.2%).
The median household income in Nebraska is $53,906, and the median family income is $67,845. The state’s poverty rate is 11.2%, which is slightly lower than the national average of 13.5%. The state’s unemployment rate is 3.2%, which is lower than the national average of 3.7%.
Common Questions
What is Per Capita Income in Page?
Per Capita income in Page is $35,723.
What is the Median Family Income in Page?
Median Family Income in Page is $101,250.
What is the Median Household income in Page?
Median Household Income in Page is $63,750.
What is Inequality or Gini Index in Page?
Inequality or Gini Index in Page is 0.35.
What is the Total Population of Page?
Total Population of Page is 130.
What is the Total Male Population of Page?
Total Male Population of Page is 71.
What is the Total Female Population of Page?
Total Female Population of Page is 59.
What is the Ratio of Males per 100 Females in Page?
There are 120.34 Males per 100 Females in Page.
What is the Ratio of Females per 100 Males in Page?
There are 83.10 Females per 100 Males in Page.
What is the Median Population Age in Page?
Median Population Age in Page is 46.5 Years.
What is the Average Family Size in Page
Average Family Size in Page is 2.9 People.
What is the Average Household Size in Page
Average Household Size in Page is 2.5 People.
How Large is the Labor Force in Page?
There are 66 People in the Labor Forcein in Page.
What is the Percentage of People in the Labor Force in Page?
67.3% of People are in the Labor Force in Page.