Zip Codes with the Highest Percentage of Families with Income Above $100,000 in Kearney, NE
RELATED REPORTS & OPTIONS
Family Income | $100k+
Kearney
Compare Zip Codes
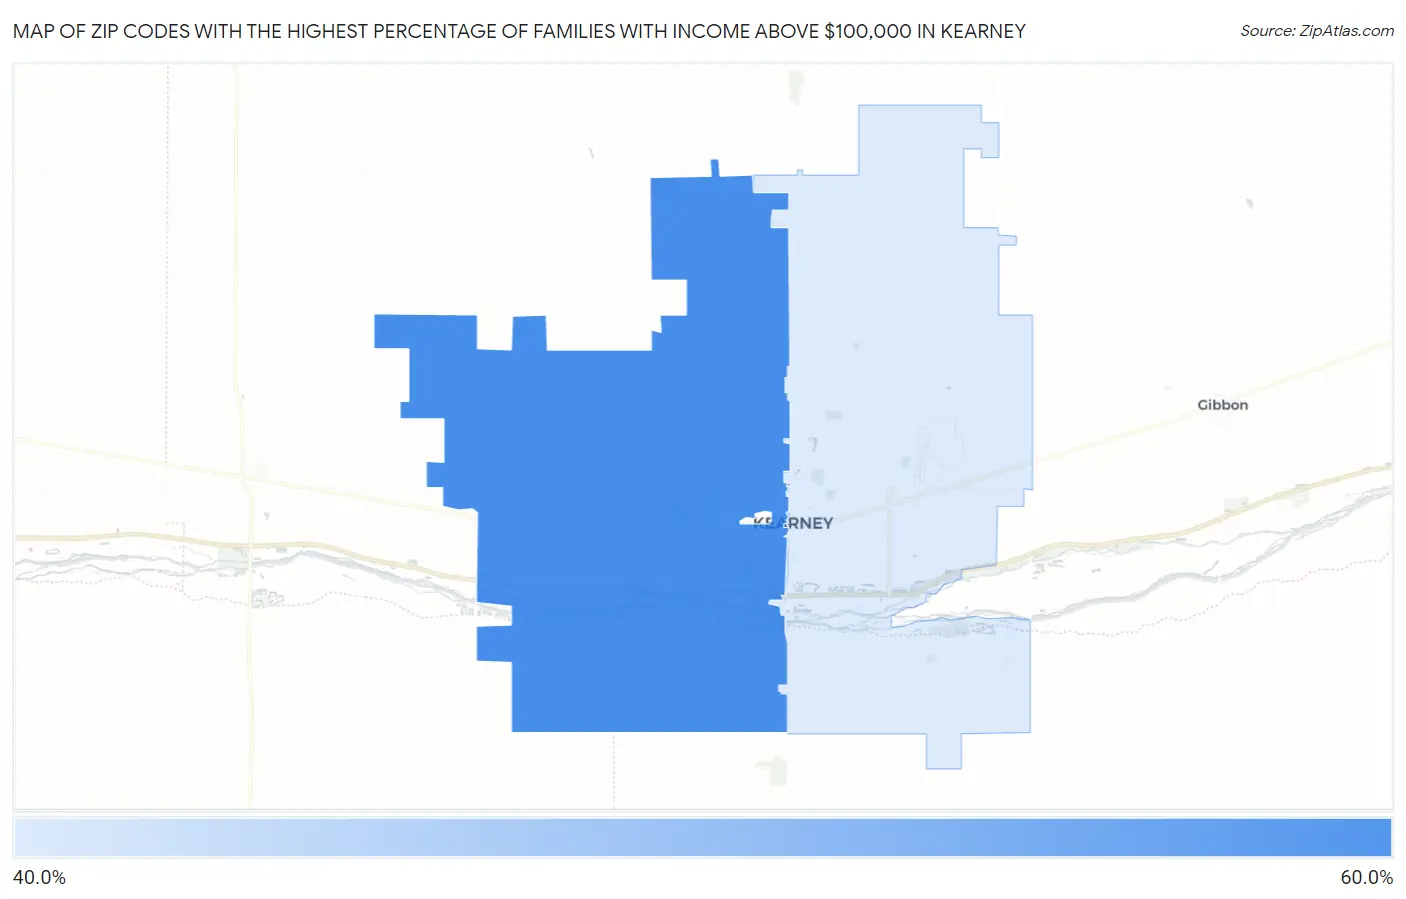
Map of Zip Codes with the Highest Percentage of Families with Income Above $100,000 in Kearney
41.0%
56.2%
Zip Codes with the Highest Percentage of Families with Income Above $100,000 in Kearney, NE
| Zip Code | Families with Income > $100k | vs State | vs National | |
| 1. | 68845 | 56.2% | 45.7%(+10.5)#85 | 46.1%(+10.1)#6,366 |
| 2. | 68847 | 41.0% | 45.7%(-4.70)#240 | 46.1%(-5.10)#13,721 |
1
Common Questions
What are the Top Zip Codes with the Highest Percentage of Families with Income Above $100,000 in Kearney, NE?
Top Zip Codes with the Highest Percentage of Families with Income Above $100,000 in Kearney, NE are:
What zip code has the Highest Percentage of Families with Income Above $100,000 in Kearney, NE?
68845 has the Highest Percentage of Families with Income Above $100,000 in Kearney, NE with 56.2%.
What is the Percentage of Families with Income Above $100,000 in Kearney, NE?
Percentage of Families with Income Above $100,000 in Kearney is 46.7%.
What is the Percentage of Families with Income Above $100,000 in Nebraska?
Percentage of Families with Income Above $100,000 in Nebraska is 45.7%.
What is the Percentage of Families with Income Above $100,000 in the United States?
Percentage of Families with Income Above $100,000 in the United States is 46.1%.