Hazard, NE Map & Demographics
Hazard Map
Hazard Overview
$29,959
PER CAPITA INCOME
$38,125
AVG HOUSEHOLD INCOME
47.4%
WAGE / INCOME GAP [ % ]
52.6¢/ $1
WAGE / INCOME GAP [ $ ]
0.44
INEQUALITY / GINI INDEX
49
TOTAL POPULATION
30
MALE POPULATION
19
FEMALE POPULATION
157.89
MALES / 100 FEMALES
63.33
FEMALES / 100 MALES
37.3
MEDIAN AGE
3.3
AVG FAMILY SIZE
2.0
AVG HOUSEHOLD SIZE
14
LABOR FORCE [ PEOPLE ]
37.8%
PERCENT IN LABOR FORCE
Hazard Zip Codes
Hazard Area Codes
Income in Hazard
Income Overview in Hazard
| Characteristic | Number | Measure |
| Per Capita Income | 49 | $29,959 |
| Median Family Income | 9 | $0 |
| Mean Family Income | 9 | $75,844 |
| Median Household Income | 25 | $38,125 |
| Mean Household Income | 25 | $55,184 |
| Income Deficit | 9 | $0 |
| Wage / Income Gap (%) | 49 | 47.42% |
| Wage / Income Gap ($) | 49 | 52.58¢ per $1 |
| Gini / Inequality Index | 49 | 0.44 |
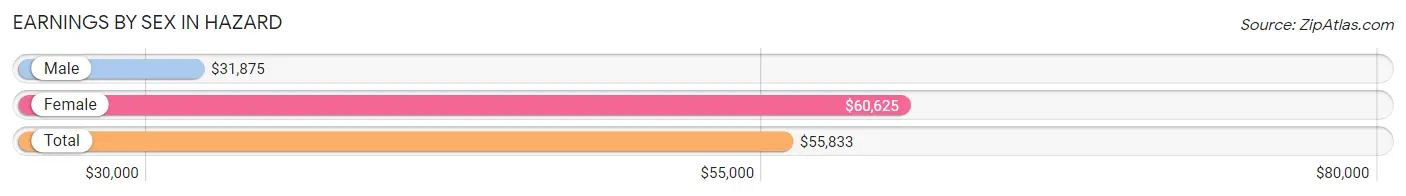
Earnings by Sex in Hazard
Average Earnings in Hazard are $55,833, $31,875 for men and $60,625 for women, a difference of 47.4%.
| Sex | Number | Average Earnings |
| Male | 11 (55.0%) | $31,875 |
| Female | 9 (45.0%) | $60,625 |
| Total | 20 (100.0%) | $55,833 |
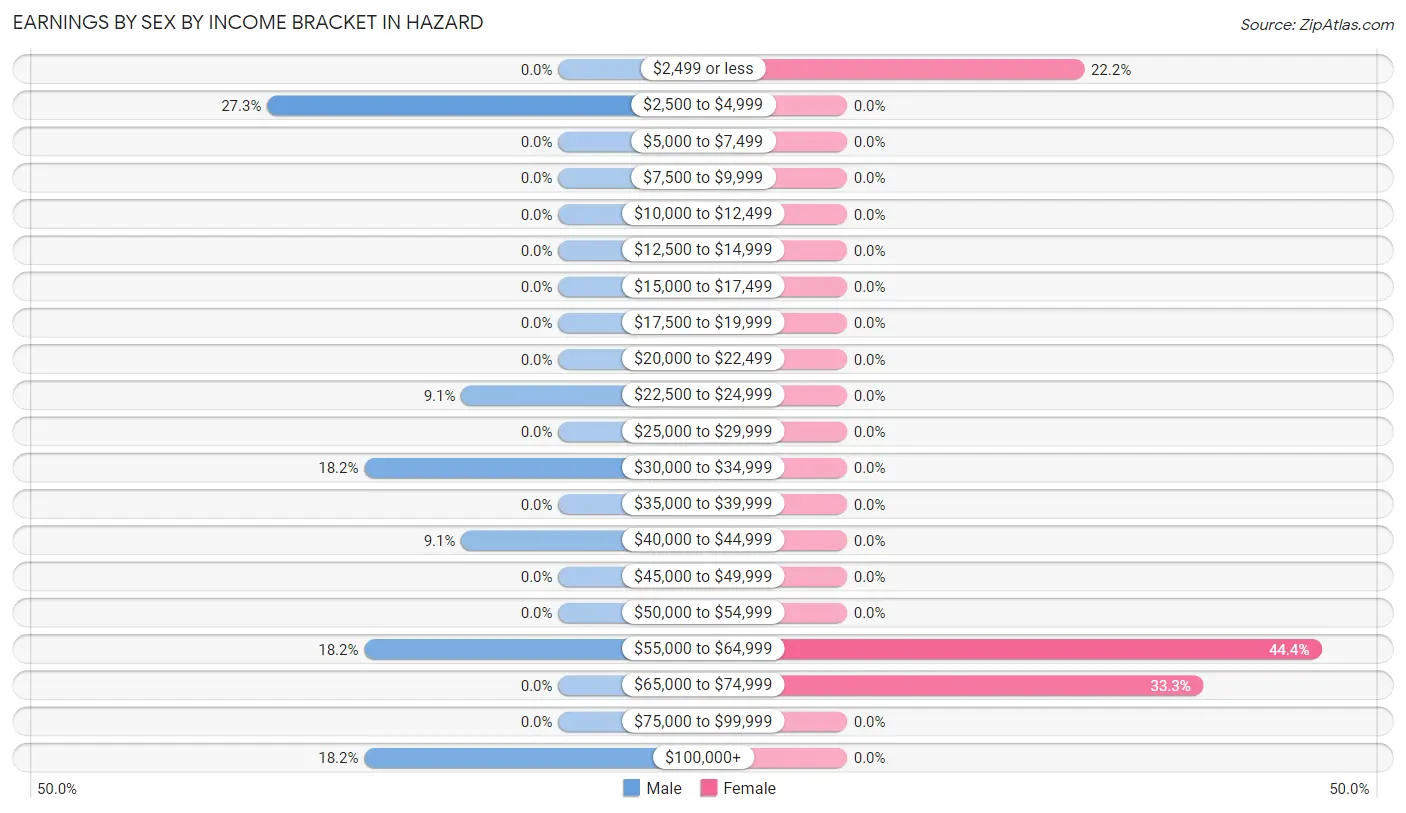
Earnings by Sex by Income Bracket in Hazard
The most common earnings brackets in Hazard are $2,500 to $4,999 for men (3 | 27.3%) and $55,000 to $64,999 for women (4 | 44.4%).
| Income | Male | Female |
| $2,499 or less | 0 (0.0%) | 2 (22.2%) |
| $2,500 to $4,999 | 3 (27.3%) | 0 (0.0%) |
| $5,000 to $7,499 | 0 (0.0%) | 0 (0.0%) |
| $7,500 to $9,999 | 0 (0.0%) | 0 (0.0%) |
| $10,000 to $12,499 | 0 (0.0%) | 0 (0.0%) |
| $12,500 to $14,999 | 0 (0.0%) | 0 (0.0%) |
| $15,000 to $17,499 | 0 (0.0%) | 0 (0.0%) |
| $17,500 to $19,999 | 0 (0.0%) | 0 (0.0%) |
| $20,000 to $22,499 | 0 (0.0%) | 0 (0.0%) |
| $22,500 to $24,999 | 1 (9.1%) | 0 (0.0%) |
| $25,000 to $29,999 | 0 (0.0%) | 0 (0.0%) |
| $30,000 to $34,999 | 2 (18.2%) | 0 (0.0%) |
| $35,000 to $39,999 | 0 (0.0%) | 0 (0.0%) |
| $40,000 to $44,999 | 1 (9.1%) | 0 (0.0%) |
| $45,000 to $49,999 | 0 (0.0%) | 0 (0.0%) |
| $50,000 to $54,999 | 0 (0.0%) | 0 (0.0%) |
| $55,000 to $64,999 | 2 (18.2%) | 4 (44.4%) |
| $65,000 to $74,999 | 0 (0.0%) | 3 (33.3%) |
| $75,000 to $99,999 | 0 (0.0%) | 0 (0.0%) |
| $100,000+ | 2 (18.2%) | 0 (0.0%) |
| Total | 11 (100.0%) | 9 (100.0%) |
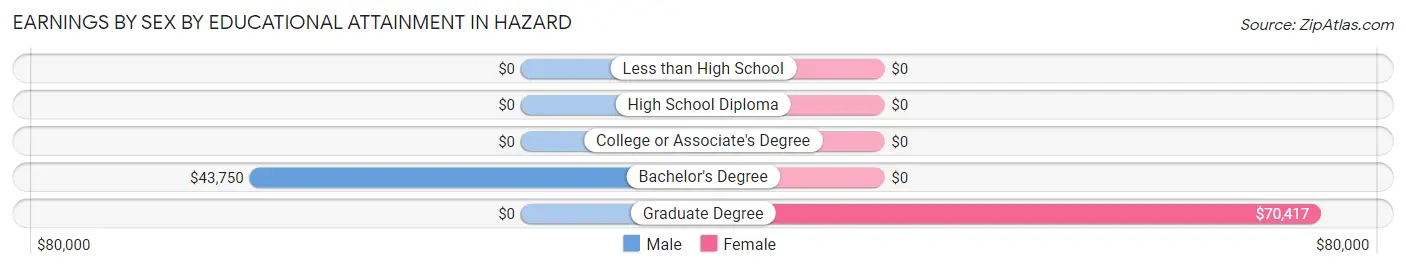
Earnings by Sex by Educational Attainment in Hazard
Average earnings in Hazard are $31,875 for men and $60,625 for women, a difference of 47.4%. Men with an educational attainment of bachelor's degree enjoy the highest average annual earnings of $43,750, while those with bachelor's degree education earn the least with $43,750. Women with an educational attainment of graduate degree earn the most with the average annual earnings of $70,417, while those with graduate degree education have the smallest earnings of $70,417.
| Educational Attainment | Male Income | Female Income |
| Less than High School | - | - |
| High School Diploma | - | - |
| College or Associate's Degree | - | - |
| Bachelor's Degree | $43,750 | $0 |
| Graduate Degree | - | - |
| Total | $31,875 | $60,625 |
Family Income in Hazard
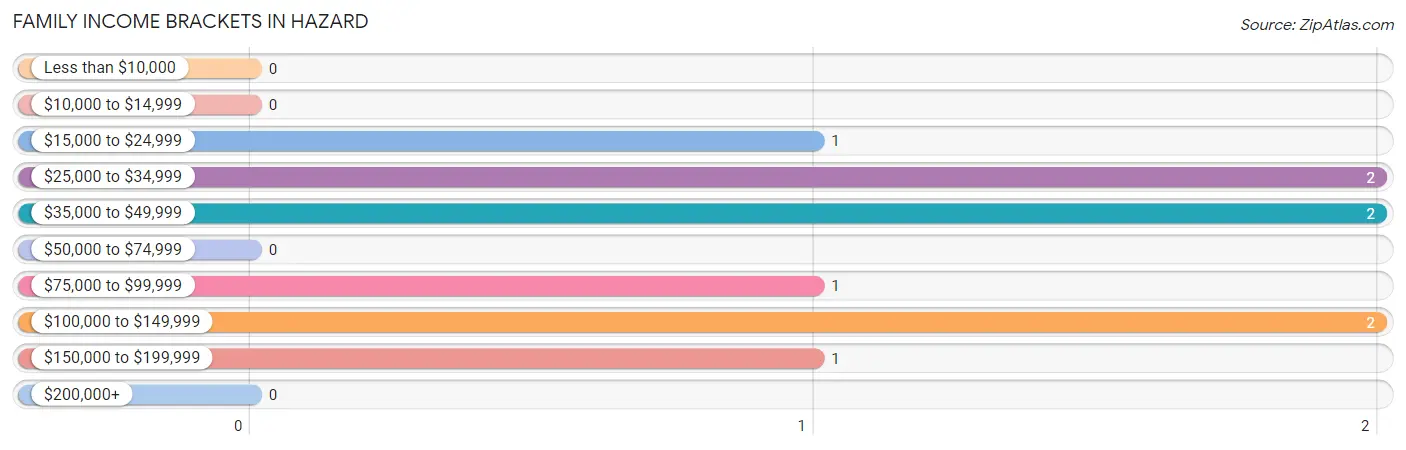
Family Income Brackets in Hazard
According to the Hazard family income data, there are 2 families falling into the $25,000 to $34,999 income range, which is the most common income bracket and makes up 22.2% of all families.
| Income Bracket | # Families | % Families |
| Less than $10,000 | 0 | 0.0% |
| $10,000 to $14,999 | 0 | 0.0% |
| $15,000 to $24,999 | 1 | 11.1% |
| $25,000 to $34,999 | 2 | 22.2% |
| $35,000 to $49,999 | 2 | 22.2% |
| $50,000 to $74,999 | 0 | 0.0% |
| $75,000 to $99,999 | 1 | 11.1% |
| $100,000 to $149,999 | 2 | 22.2% |
| $150,000 to $199,999 | 1 | 11.1% |
| $200,000+ | 0 | 0.0% |
Family Income by Famaliy Size in Hazard
| Income Bracket | # Families | Median Income |
| 2-Person Families | 6 (66.7%) | $0 |
| 3-Person Families | 1 (11.1%) | $0 |
| 4-Person Families | 0 (0.0%) | $0 |
| 5-Person Families | 2 (22.2%) | $0 |
| 6-Person Families | 0 (0.0%) | $0 |
| 7+ Person Families | 0 (0.0%) | $0 |
| Total | 9 (100.0%) | $0 |
Family Income by Number of Earners in Hazard
| Number of Earners | # Families | Median Income |
| No Earners | 2 (22.2%) | $0 |
| 1 Earner | 3 (33.3%) | $0 |
| 2 Earners | 4 (44.4%) | $0 |
| 3+ Earners | 0 (0.0%) | $0 |
| Total | 9 (100.0%) | $0 |
Household Income in Hazard
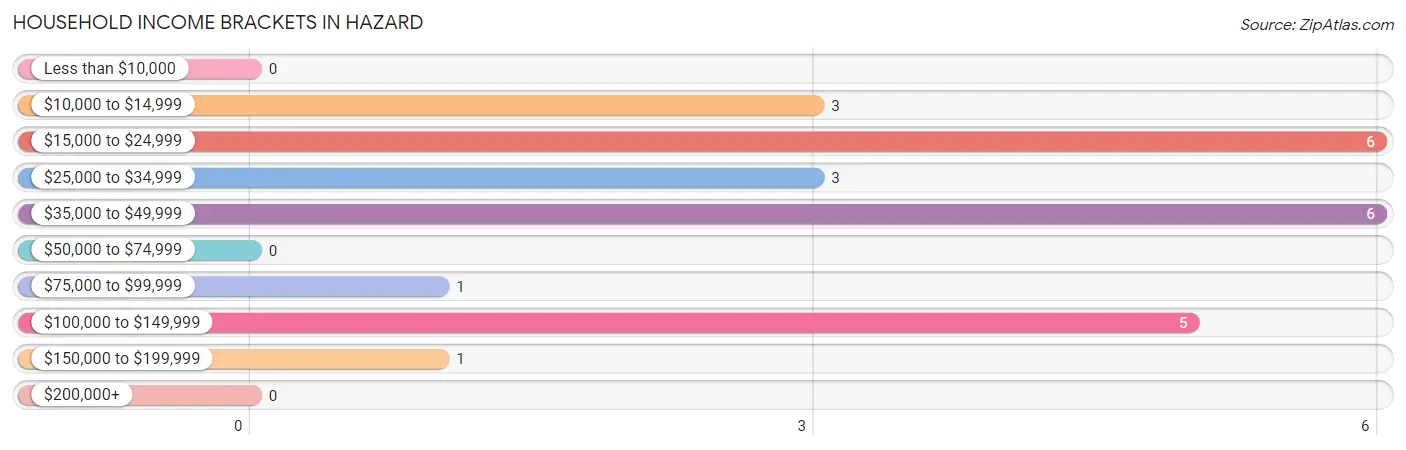
Household Income Brackets in Hazard
With 6 households falling in the category, the $15,000 to $24,999 income range is the most frequent in Hazard, accounting for 24.0% of all households.
| Income Bracket | # Households | % Households |
| Less than $10,000 | 0 | 0.0% |
| $10,000 to $14,999 | 3 | 12.0% |
| $15,000 to $24,999 | 6 | 24.0% |
| $25,000 to $34,999 | 3 | 12.0% |
| $35,000 to $49,999 | 6 | 24.0% |
| $50,000 to $74,999 | 0 | 0.0% |
| $75,000 to $99,999 | 1 | 4.0% |
| $100,000 to $149,999 | 5 | 20.0% |
| $150,000 to $199,999 | 1 | 4.0% |
| $200,000+ | 0 | 0.0% |
Household Income by Householder Age in Hazard
The median household income in Hazard is $38,125, with the highest median household income of $130,000 found in the 25 to 44 years age bracket for the primary householder. A total of 6 households (24.0%) fall into this category.
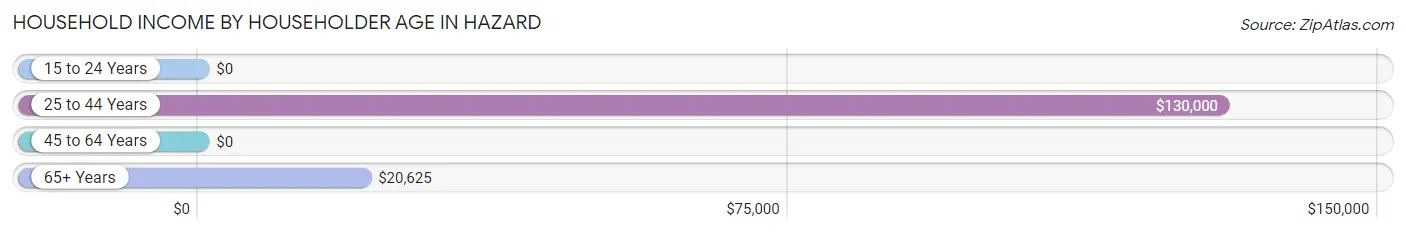
| Income Bracket | # Households | Median Income |
| 15 to 24 Years | 0 (0.0%) | $0 |
| 25 to 44 Years | 6 (24.0%) | $130,000 |
| 45 to 64 Years | 4 (16.0%) | $0 |
| 65+ Years | 15 (60.0%) | $20,625 |
| Total | 25 (100.0%) | $38,125 |
Poverty in Hazard
Income Below Poverty by Sex and Age in Hazard
With 46.7% poverty level for males and 15.8% for females among the residents of Hazard, under 5 year old males and 65 to 74 year old females are the most vulnerable to poverty, with 11 males (91.7%) and 1 females (100.0%) in their respective age groups living below the poverty level.
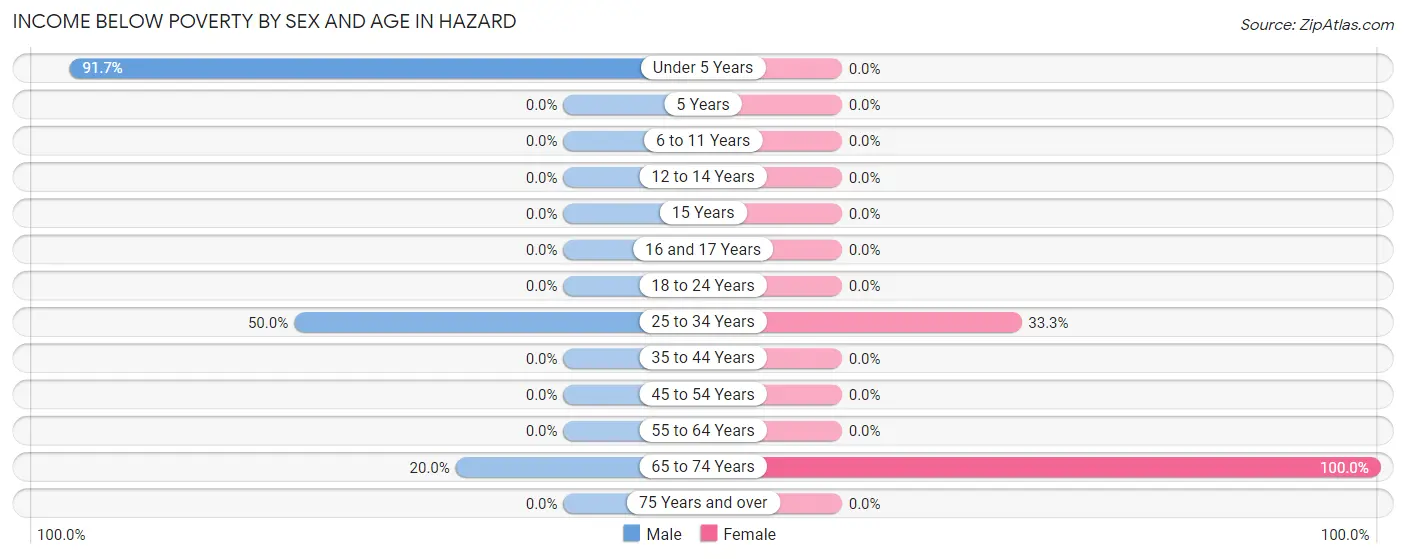
| Age Bracket | Male | Female |
| Under 5 Years | 11 (91.7%) | 0 (0.0%) |
| 5 Years | 0 (0.0%) | 0 (0.0%) |
| 6 to 11 Years | 0 (0.0%) | 0 (0.0%) |
| 12 to 14 Years | 0 (0.0%) | 0 (0.0%) |
| 15 Years | 0 (0.0%) | 0 (0.0%) |
| 16 and 17 Years | 0 (0.0%) | 0 (0.0%) |
| 18 to 24 Years | 0 (0.0%) | 0 (0.0%) |
| 25 to 34 Years | 2 (50.0%) | 2 (33.3%) |
| 35 to 44 Years | 0 (0.0%) | 0 (0.0%) |
| 45 to 54 Years | 0 (0.0%) | 0 (0.0%) |
| 55 to 64 Years | 0 (0.0%) | 0 (0.0%) |
| 65 to 74 Years | 1 (20.0%) | 1 (100.0%) |
| 75 Years and over | 0 (0.0%) | 0 (0.0%) |
| Total | 14 (46.7%) | 3 (15.8%) |
Income Above Poverty by Sex and Age in Hazard
According to the poverty statistics in Hazard, males aged 35 to 44 years and females aged 35 to 44 years are the age groups that are most secure financially, with 100.0% of males and 100.0% of females in these age groups living above the poverty line.
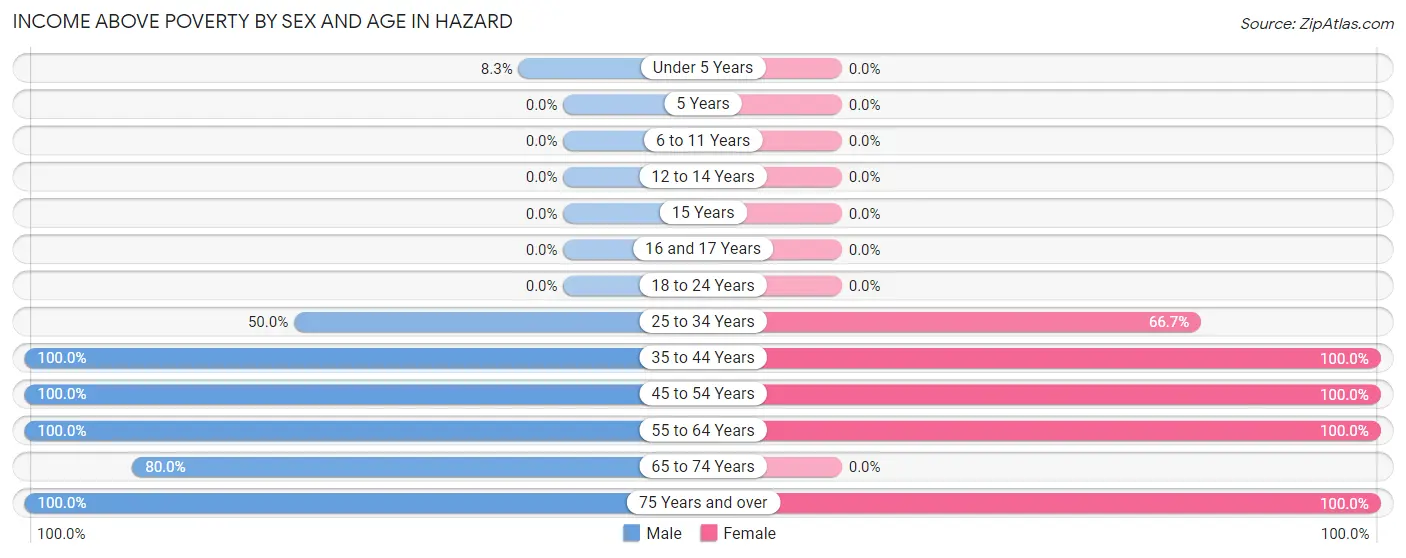
| Age Bracket | Male | Female |
| Under 5 Years | 1 (8.3%) | 0 (0.0%) |
| 5 Years | 0 (0.0%) | 0 (0.0%) |
| 6 to 11 Years | 0 (0.0%) | 0 (0.0%) |
| 12 to 14 Years | 0 (0.0%) | 0 (0.0%) |
| 15 Years | 0 (0.0%) | 0 (0.0%) |
| 16 and 17 Years | 0 (0.0%) | 0 (0.0%) |
| 18 to 24 Years | 0 (0.0%) | 0 (0.0%) |
| 25 to 34 Years | 2 (50.0%) | 4 (66.7%) |
| 35 to 44 Years | 2 (100.0%) | 2 (100.0%) |
| 45 to 54 Years | 1 (100.0%) | 2 (100.0%) |
| 55 to 64 Years | 1 (100.0%) | 2 (100.0%) |
| 65 to 74 Years | 4 (80.0%) | 0 (0.0%) |
| 75 Years and over | 5 (100.0%) | 6 (100.0%) |
| Total | 16 (53.3%) | 16 (84.2%) |
Income Below Poverty Among Married-Couple Families in Hazard
The poverty statistics for married-couple families in Hazard show that 22.2% or 2 of the total 9 families live below the poverty line. Families with 3 or 4 children have the highest poverty rate of 100.0%, comprising of 2 families. On the other hand, families with no children have the lowest poverty rate of 0.0%, which includes 0 families.
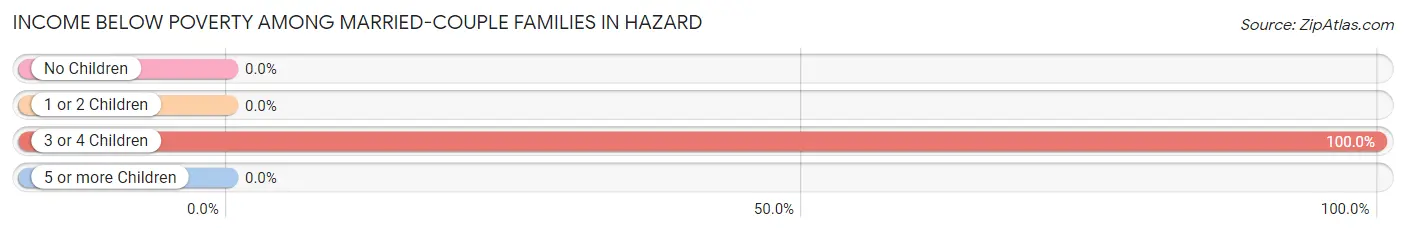
| Children | Above Poverty | Below Poverty |
| No Children | 6 (100.0%) | 0 (0.0%) |
| 1 or 2 Children | 1 (100.0%) | 0 (0.0%) |
| 3 or 4 Children | 0 (0.0%) | 2 (100.0%) |
| 5 or more Children | 0 (0.0%) | 0 (0.0%) |
| Total | 7 (77.8%) | 2 (22.2%) |
Income Below Poverty Among Single-Parent Households in Hazard
| Children | Single Father | Single Mother |
| No Children | 0 (0.0%) | 0 (0.0%) |
| 1 or 2 Children | 0 (0.0%) | 0 (0.0%) |
| 3 or 4 Children | 0 (0.0%) | 0 (0.0%) |
| 5 or more Children | 0 (0.0%) | 0 (0.0%) |
| Total | 0 (0.0%) | 0 (0.0%) |
Income Below Poverty Among Married-Couple vs Single-Parent Households in Hazard
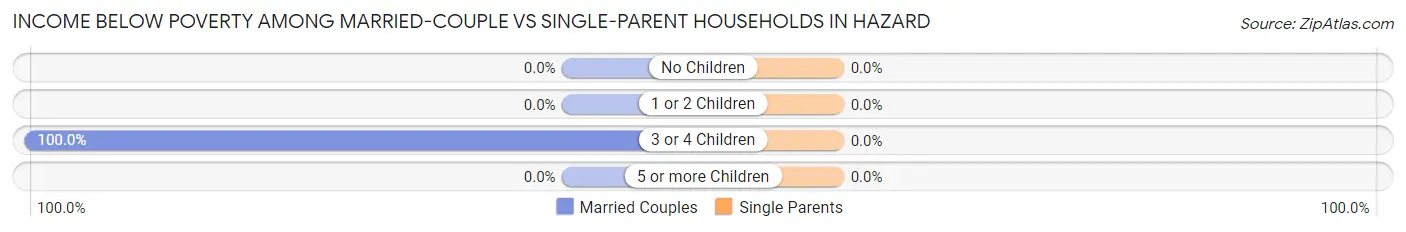
| Children | Married-Couple Families | Single-Parent Households |
| No Children | 0 (0.0%) | 0 (0.0%) |
| 1 or 2 Children | 0 (0.0%) | 0 (0.0%) |
| 3 or 4 Children | 2 (100.0%) | 0 (0.0%) |
| 5 or more Children | 0 (0.0%) | 0 (0.0%) |
| Total | 2 (22.2%) | 0 (0.0%) |
Race in Hazard
The most populous races in Hazard are White / Caucasian (49 | 100.0%), and Hispanic or Latino (3 | 6.1%).
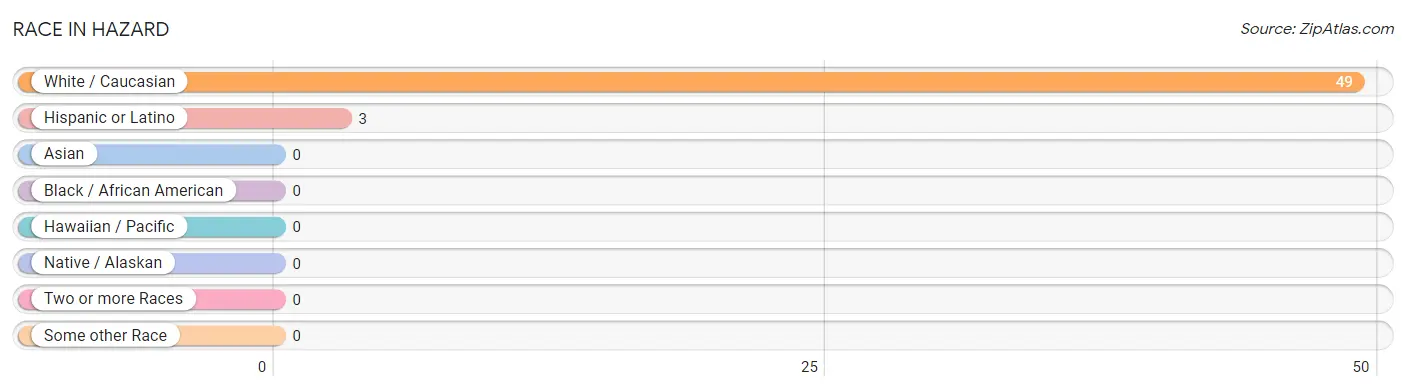
| Race | # Population | % Population |
| Asian | 0 | 0.0% |
| Black / African American | 0 | 0.0% |
| Hawaiian / Pacific | 0 | 0.0% |
| Hispanic or Latino | 3 | 6.1% |
| Native / Alaskan | 0 | 0.0% |
| White / Caucasian | 49 | 100.0% |
| Two or more Races | 0 | 0.0% |
| Some other Race | 0 | 0.0% |
| Total | 49 | 100.0% |
Ancestry in Hazard
The most populous ancestries reported in Hazard are German (14 | 28.6%), English (5 | 10.2%), Irish (4 | 8.2%), Czech (2 | 4.1%), and Mexican (2 | 4.1%), together accounting for 55.1% of all Hazard residents.
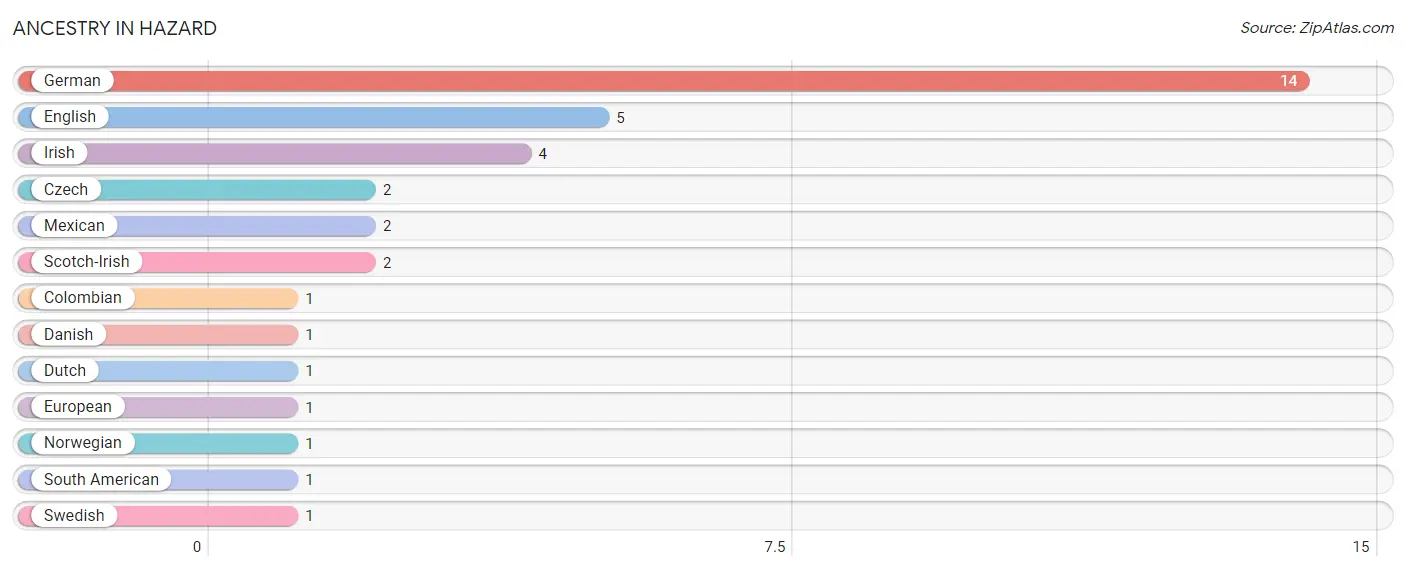
| Ancestry | # Population | % Population |
| Colombian | 1 | 2.0% |
| Czech | 2 | 4.1% |
| Danish | 1 | 2.0% |
| Dutch | 1 | 2.0% |
| English | 5 | 10.2% |
| European | 1 | 2.0% |
| German | 14 | 28.6% |
| Irish | 4 | 8.2% |
| Mexican | 2 | 4.1% |
| Norwegian | 1 | 2.0% |
| Scotch-Irish | 2 | 4.1% |
| South American | 1 | 2.0% |
| Swedish | 1 | 2.0% | View All 13 Rows |
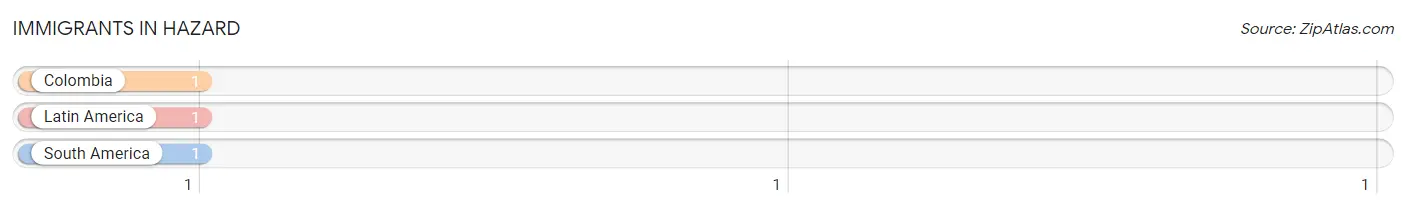
Immigrants in Hazard
The most numerous immigrant groups reported in Hazard came from Colombia (1 | 2.0%), Latin America (1 | 2.0%), and South America (1 | 2.0%), together accounting for 6.1% of all Hazard residents.
| Immigration Origin | # Population | % Population |
| Colombia | 1 | 2.0% |
| Latin America | 1 | 2.0% |
| South America | 1 | 2.0% | View All 3 Rows |
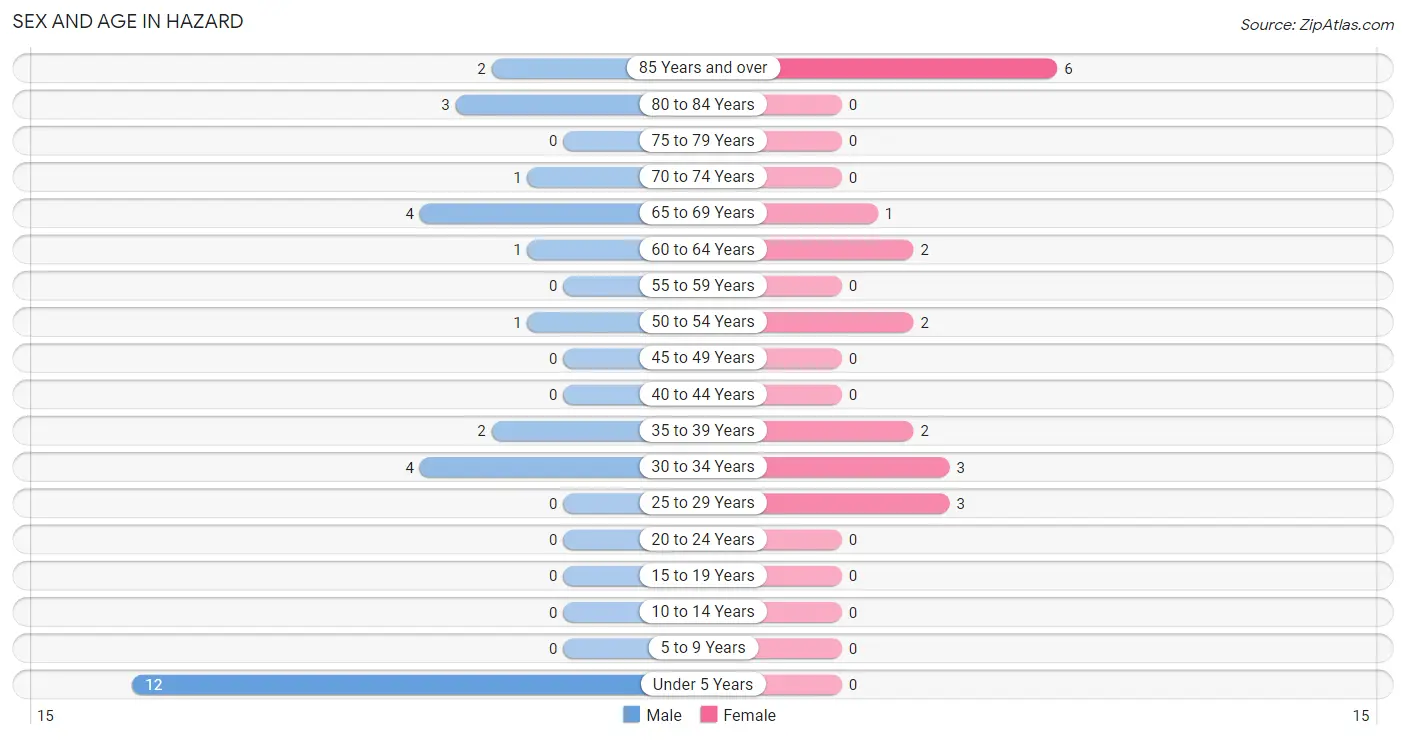
Sex and Age in Hazard
Sex and Age in Hazard
The most populous age groups in Hazard are Under 5 Years (12 | 40.0%) for men and 85 Years and over (6 | 31.6%) for women.
| Age Bracket | Male | Female |
| Under 5 Years | 12 (40.0%) | 0 (0.0%) |
| 5 to 9 Years | 0 (0.0%) | 0 (0.0%) |
| 10 to 14 Years | 0 (0.0%) | 0 (0.0%) |
| 15 to 19 Years | 0 (0.0%) | 0 (0.0%) |
| 20 to 24 Years | 0 (0.0%) | 0 (0.0%) |
| 25 to 29 Years | 0 (0.0%) | 3 (15.8%) |
| 30 to 34 Years | 4 (13.3%) | 3 (15.8%) |
| 35 to 39 Years | 2 (6.7%) | 2 (10.5%) |
| 40 to 44 Years | 0 (0.0%) | 0 (0.0%) |
| 45 to 49 Years | 0 (0.0%) | 0 (0.0%) |
| 50 to 54 Years | 1 (3.3%) | 2 (10.5%) |
| 55 to 59 Years | 0 (0.0%) | 0 (0.0%) |
| 60 to 64 Years | 1 (3.3%) | 2 (10.5%) |
| 65 to 69 Years | 4 (13.3%) | 1 (5.3%) |
| 70 to 74 Years | 1 (3.3%) | 0 (0.0%) |
| 75 to 79 Years | 0 (0.0%) | 0 (0.0%) |
| 80 to 84 Years | 3 (10.0%) | 0 (0.0%) |
| 85 Years and over | 2 (6.7%) | 6 (31.6%) |
| Total | 30 (100.0%) | 19 (100.0%) |
Families and Households in Hazard
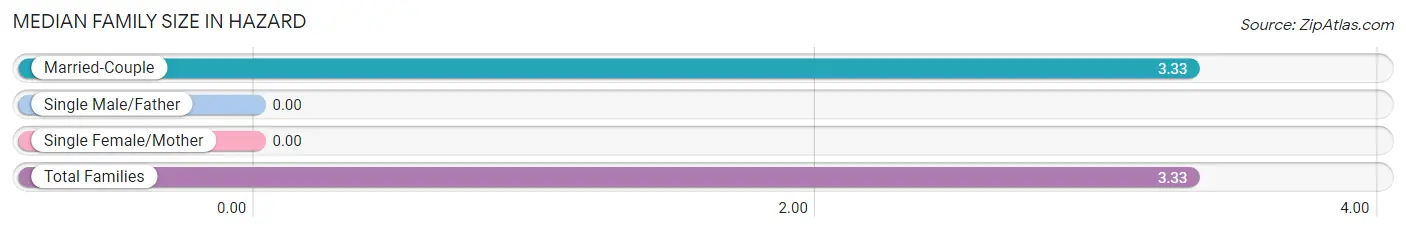
Median Family Size in Hazard
| Family Type | # Families | Family Size |
| Married-Couple | 9 (100.0%) | 3.33 |
| Single Male/Father | 0 (0.0%) | - |
| Single Female/Mother | 0 (0.0%) | - |
| Total Families | 9 (100.0%) | 3.33 |
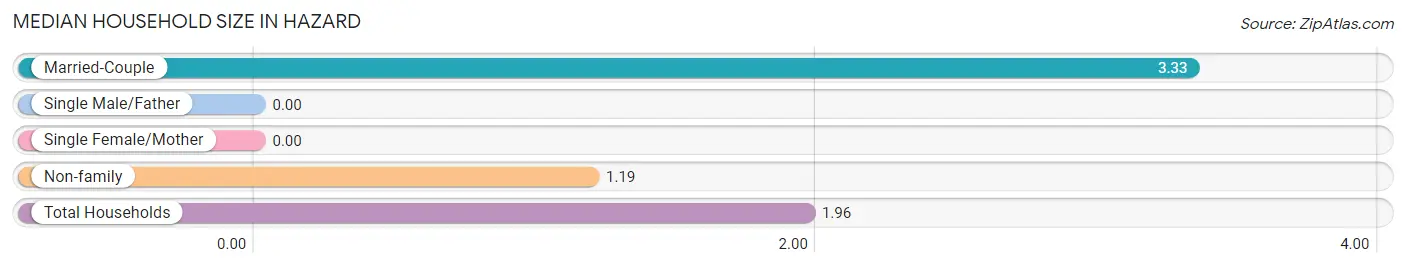
Median Household Size in Hazard
| Household Type | # Households | Household Size |
| Married-Couple | 9 (36.0%) | 3.33 |
| Single Male/Father | 0 (0.0%) | - |
| Single Female/Mother | 0 (0.0%) | - |
| Non-family | 16 (64.0%) | 1.19 |
| Total Households | 25 (100.0%) | 1.96 |
Household Size by Marriage Status in Hazard
Out of a total of 25 households in Hazard, 9 (36.0%) are family households, while 16 (64.0%) are nonfamily households. The most numerous type of family households are 2-person households, comprising 6, and the most common type of nonfamily households are 1-person households, comprising 14.
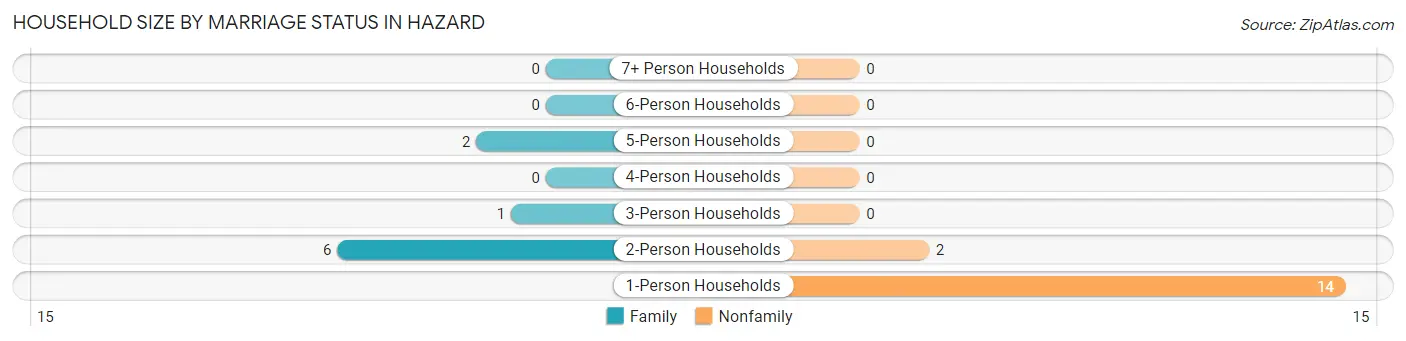
| Household Size | Family Households | Nonfamily Households |
| 1-Person Households | - | 14 (56.0%) |
| 2-Person Households | 6 (24.0%) | 2 (8.0%) |
| 3-Person Households | 1 (4.0%) | 0 (0.0%) |
| 4-Person Households | 0 (0.0%) | 0 (0.0%) |
| 5-Person Households | 2 (8.0%) | 0 (0.0%) |
| 6-Person Households | 0 (0.0%) | 0 (0.0%) |
| 7+ Person Households | 0 (0.0%) | 0 (0.0%) |
| Total | 9 (36.0%) | 16 (64.0%) |
Female Fertility in Hazard
Fertility by Age in Hazard
Average fertility rate in Hazard is 375.0 births per 1,000 women. Women in the age bracket of 20 to 34 years have the highest fertility rate with 500.0 births per 1,000 women. Women in the age bracket of 20 to 34 years acount for 100.0% of all women with births.
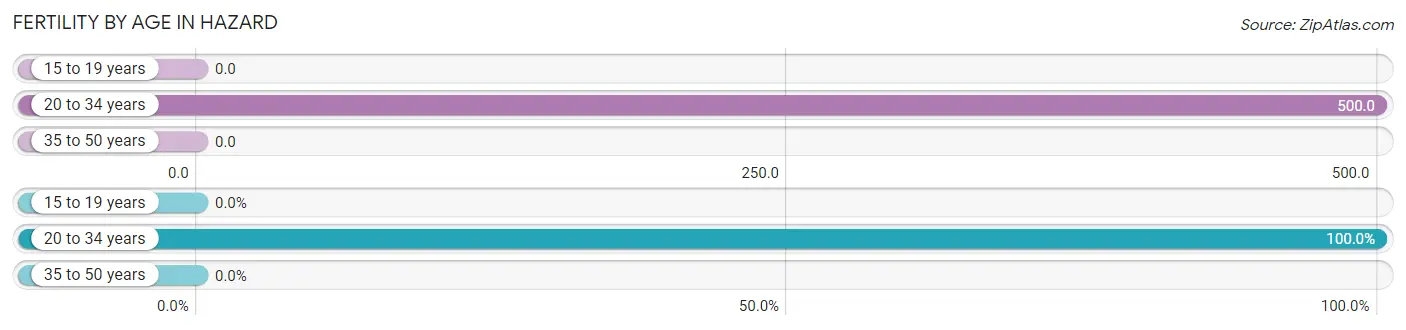
| Age Bracket | Women with Births | Births / 1,000 Women |
| 15 to 19 years | 0 (0.0%) | 0.0 |
| 20 to 34 years | 3 (100.0%) | 500.0 |
| 35 to 50 years | 0 (0.0%) | 0.0 |
| Total | 3 (100.0%) | 375.0 |
Fertility by Age by Marriage Status in Hazard
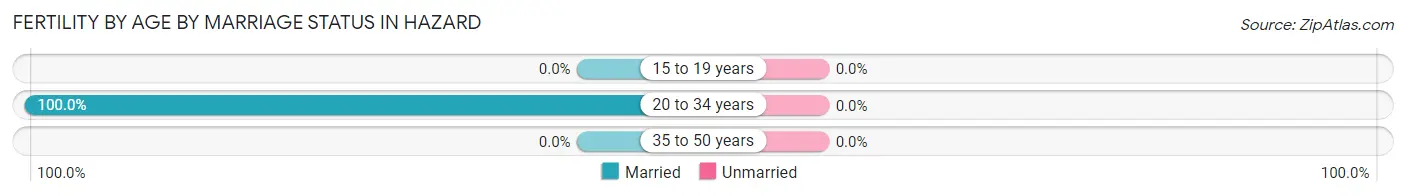
| Age Bracket | Married | Unmarried |
| 15 to 19 years | 0 (0.0%) | 0 (0.0%) |
| 20 to 34 years | 3 (100.0%) | 0 (0.0%) |
| 35 to 50 years | 0 (0.0%) | 0 (0.0%) |
| Total | 3 (100.0%) | 0 (0.0%) |
Fertility by Education in Hazard
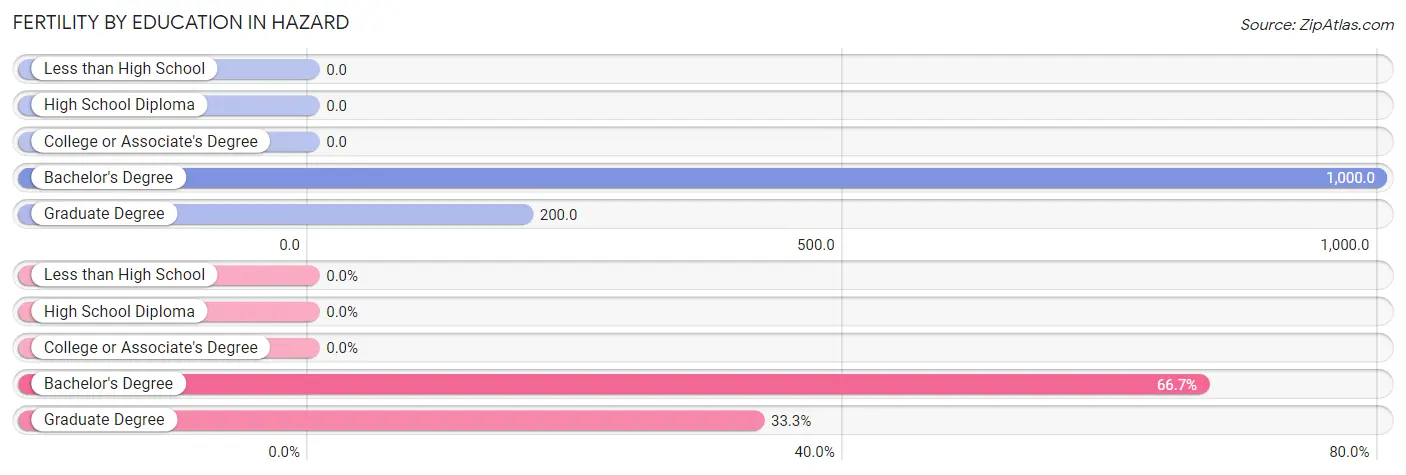
| Educational Attainment | Women with Births | Births / 1,000 Women |
| Less than High School | 0 (0.0%) | 0.0 |
| High School Diploma | 0 (0.0%) | 0.0 |
| College or Associate's Degree | 0 (0.0%) | 0.0 |
| Bachelor's Degree | 2 (66.7%) | 1,000.0 |
| Graduate Degree | 1 (33.3%) | 200.0 |
| Total | 3 (100.0%) | 375.0 |
Fertility by Education by Marriage Status in Hazard
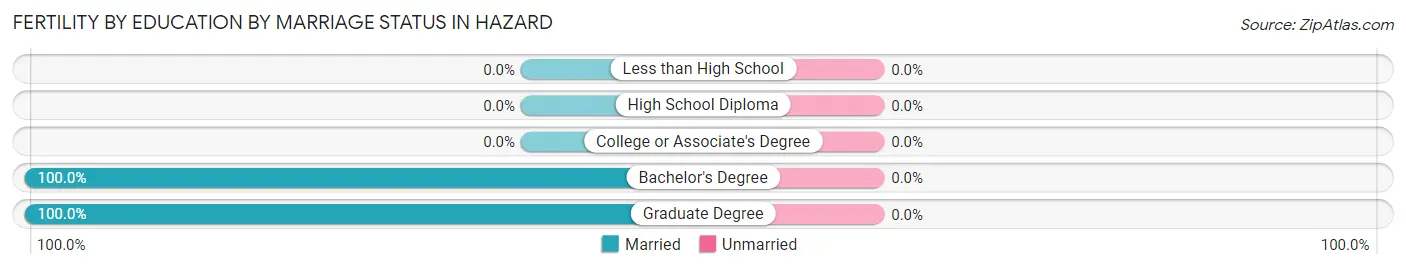
| Educational Attainment | Married | Unmarried |
| Less than High School | 0 (0.0%) | 0 (0.0%) |
| High School Diploma | 0 (0.0%) | 0 (0.0%) |
| College or Associate's Degree | 0 (0.0%) | 0 (0.0%) |
| Bachelor's Degree | 2 (100.0%) | 0 (0.0%) |
| Graduate Degree | 1 (100.0%) | 0 (0.0%) |
| Total | 3 (100.0%) | 0 (0.0%) |
Employment Characteristics in Hazard
Employment by Class of Employer in Hazard
Among the 14 employed individuals in Hazard, private company employees (7 | 50.0%), local government employees (5 | 35.7%), and not-for-profit organizations (2 | 14.3%) make up the most common classes of employment.
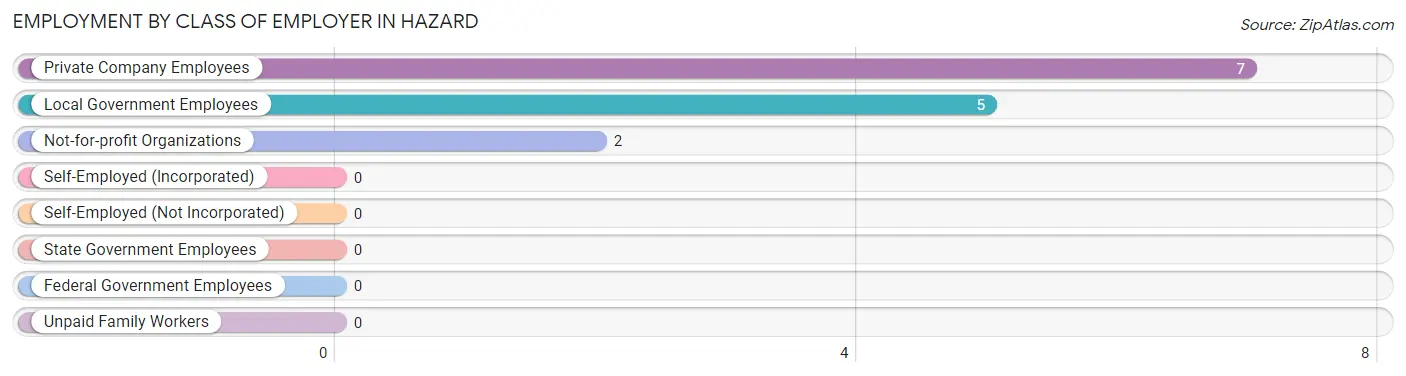
| Employer Class | # Employees | % Employees |
| Private Company Employees | 7 | 50.0% |
| Self-Employed (Incorporated) | 0 | 0.0% |
| Self-Employed (Not Incorporated) | 0 | 0.0% |
| Not-for-profit Organizations | 2 | 14.3% |
| Local Government Employees | 5 | 35.7% |
| State Government Employees | 0 | 0.0% |
| Federal Government Employees | 0 | 0.0% |
| Unpaid Family Workers | 0 | 0.0% |
| Total | 14 | 100.0% |
Employment Status by Age in Hazard
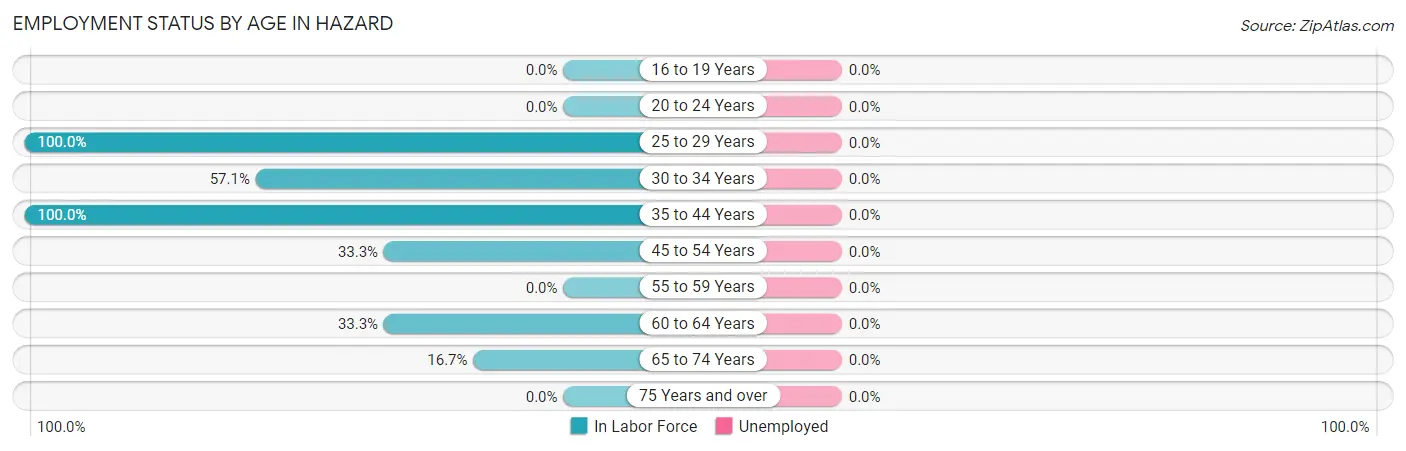
| Age Bracket | In Labor Force | Unemployed |
| 16 to 19 Years | 0 (0.0%) | 0 (0.0%) |
| 20 to 24 Years | 0 (0.0%) | 0 (0.0%) |
| 25 to 29 Years | 3 (100.0%) | 0 (0.0%) |
| 30 to 34 Years | 4 (57.1%) | 0 (0.0%) |
| 35 to 44 Years | 4 (100.0%) | 0 (0.0%) |
| 45 to 54 Years | 1 (33.3%) | 0 (0.0%) |
| 55 to 59 Years | 0 (0.0%) | 0 (0.0%) |
| 60 to 64 Years | 1 (33.3%) | 0 (0.0%) |
| 65 to 74 Years | 1 (16.7%) | 0 (0.0%) |
| 75 Years and over | 0 (0.0%) | 0 (0.0%) |
| Total | 14 (37.8%) | 0 (0.0%) |
Employment Status by Educational Attainment in Hazard
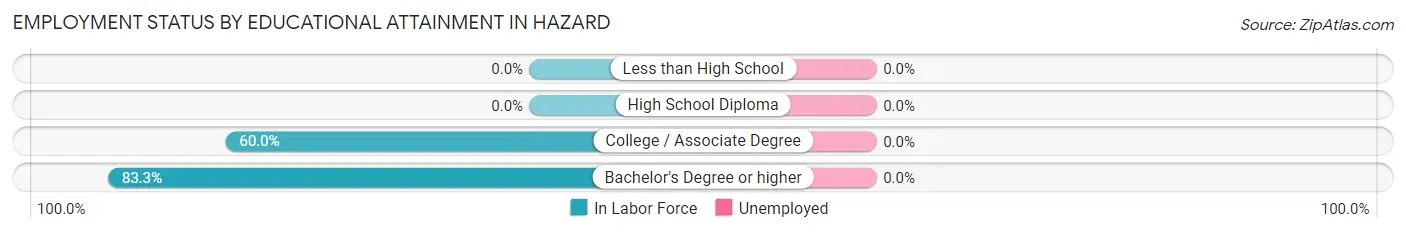
| Educational Attainment | In Labor Force | Unemployed |
| Less than High School | 0 (0.0%) | 0 (0.0%) |
| High School Diploma | 0 (0.0%) | 0 (0.0%) |
| College / Associate Degree | 3 (60.0%) | 0 (0.0%) |
| Bachelor's Degree or higher | 10 (83.3%) | 0 (0.0%) |
| Total | 13 (65.0%) | 0 (0.0%) |
Employment Occupations by Sex in Hazard
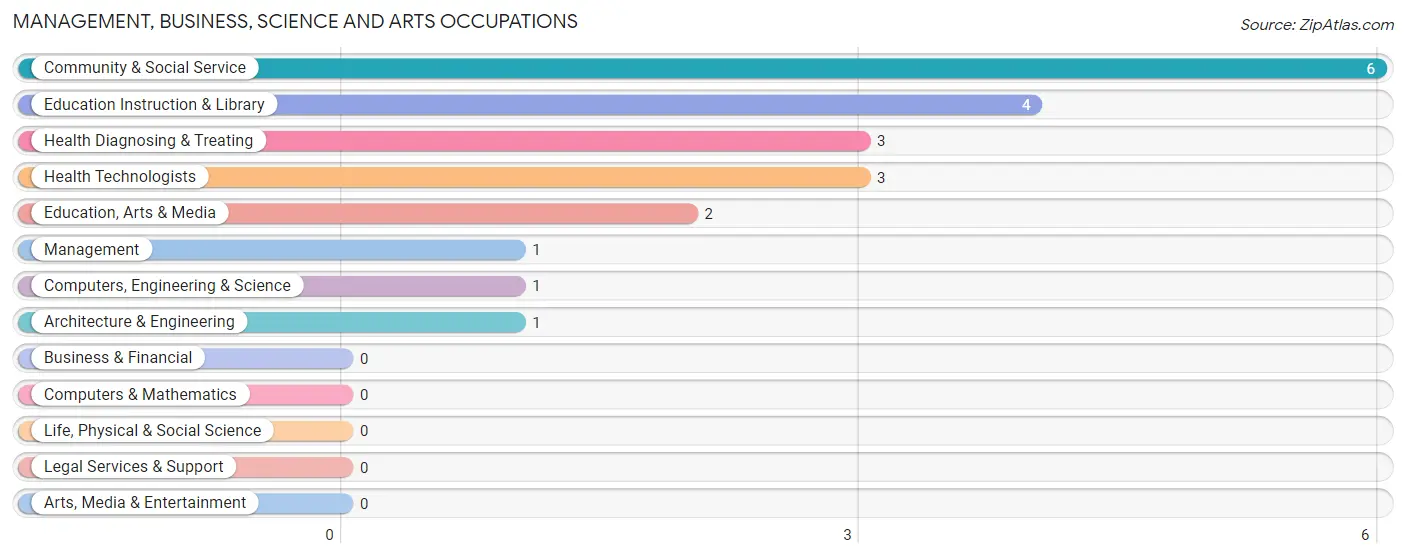
Management, Business, Science and Arts Occupations
The most common Management, Business, Science and Arts occupations in Hazard are Community & Social Service (6 | 42.9%), Education Instruction & Library (4 | 28.6%), Health Diagnosing & Treating (3 | 21.4%), Health Technologists (3 | 21.4%), and Education, Arts & Media (2 | 14.3%).
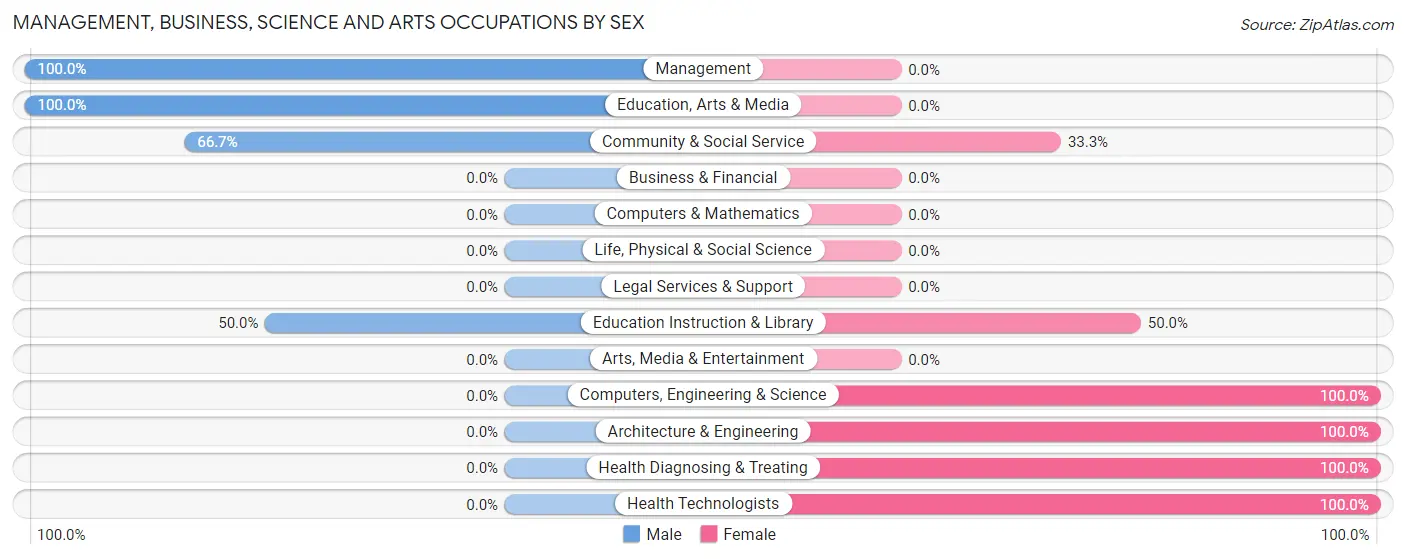
Management, Business, Science and Arts Occupations by Sex
Within the Management, Business, Science and Arts occupations in Hazard, the most male-oriented occupations are Management (100.0%), Education, Arts & Media (100.0%), and Community & Social Service (66.7%), while the most female-oriented occupations are Computers, Engineering & Science (100.0%), Architecture & Engineering (100.0%), and Health Diagnosing & Treating (100.0%).
| Occupation | Male | Female |
| Management | 1 (100.0%) | 0 (0.0%) |
| Business & Financial | 0 (0.0%) | 0 (0.0%) |
| Computers, Engineering & Science | 0 (0.0%) | 1 (100.0%) |
| Computers & Mathematics | 0 (0.0%) | 0 (0.0%) |
| Architecture & Engineering | 0 (0.0%) | 1 (100.0%) |
| Life, Physical & Social Science | 0 (0.0%) | 0 (0.0%) |
| Community & Social Service | 4 (66.7%) | 2 (33.3%) |
| Education, Arts & Media | 2 (100.0%) | 0 (0.0%) |
| Legal Services & Support | 0 (0.0%) | 0 (0.0%) |
| Education Instruction & Library | 2 (50.0%) | 2 (50.0%) |
| Arts, Media & Entertainment | 0 (0.0%) | 0 (0.0%) |
| Health Diagnosing & Treating | 0 (0.0%) | 3 (100.0%) |
| Health Technologists | 0 (0.0%) | 3 (100.0%) |
| Total (Category) | 5 (45.5%) | 6 (54.5%) |
| Total (Overall) | 8 (57.1%) | 6 (42.9%) |
Services Occupations
Services Occupations by Sex
| Occupation | Male | Female |
| Healthcare Support | 0 (0.0%) | 0 (0.0%) |
| Security & Protection | 0 (0.0%) | 0 (0.0%) |
| Firefighting & Prevention | 0 (0.0%) | 0 (0.0%) |
| Law Enforcement | 0 (0.0%) | 0 (0.0%) |
| Food Preparation & Serving | 0 (0.0%) | 0 (0.0%) |
| Cleaning & Maintenance | 0 (0.0%) | 0 (0.0%) |
| Personal Care & Service | 0 (0.0%) | 0 (0.0%) |
| Total (Category) | 0 (0.0%) | 0 (0.0%) |
| Total (Overall) | 8 (57.1%) | 6 (42.9%) |
Sales and Office Occupations
The most common Sales and Office occupations in Hazard are , and Sales & Related (1 | 7.1%).
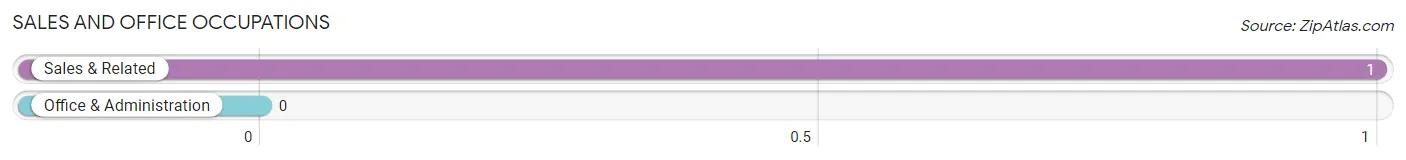
Sales and Office Occupations by Sex
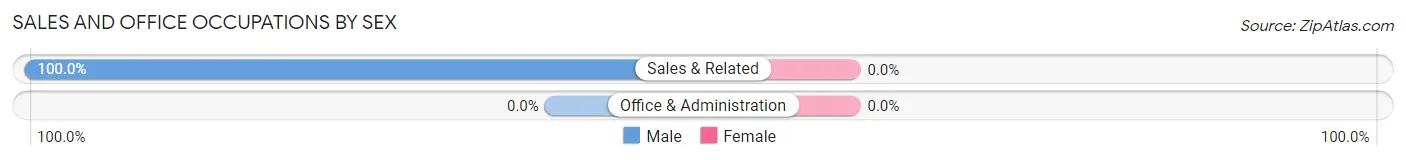
| Occupation | Male | Female |
| Sales & Related | 1 (100.0%) | 0 (0.0%) |
| Office & Administration | 0 (0.0%) | 0 (0.0%) |
| Total (Category) | 1 (100.0%) | 0 (0.0%) |
| Total (Overall) | 8 (57.1%) | 6 (42.9%) |
Natural Resources, Construction and Maintenance Occupations
Natural Resources, Construction and Maintenance Occupations by Sex
| Occupation | Male | Female |
| Farming, Fishing & Forestry | 0 (0.0%) | 0 (0.0%) |
| Construction & Extraction | 0 (0.0%) | 0 (0.0%) |
| Installation, Maintenance & Repair | 0 (0.0%) | 0 (0.0%) |
| Total (Category) | 0 (0.0%) | 0 (0.0%) |
| Total (Overall) | 8 (57.1%) | 6 (42.9%) |
Production, Transportation and Moving Occupations
The most common Production, Transportation and Moving occupations in Hazard are , and Transportation (2 | 14.3%).
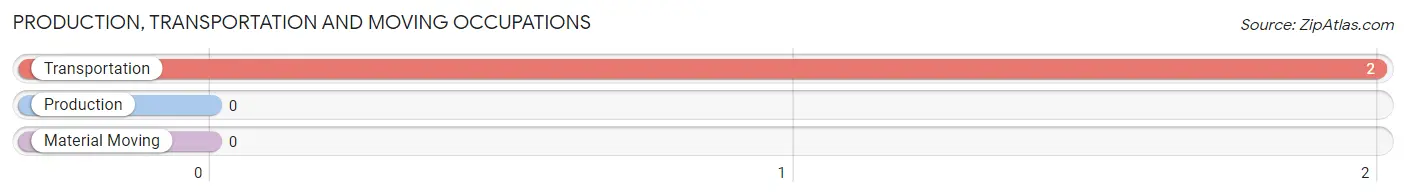
Production, Transportation and Moving Occupations by Sex
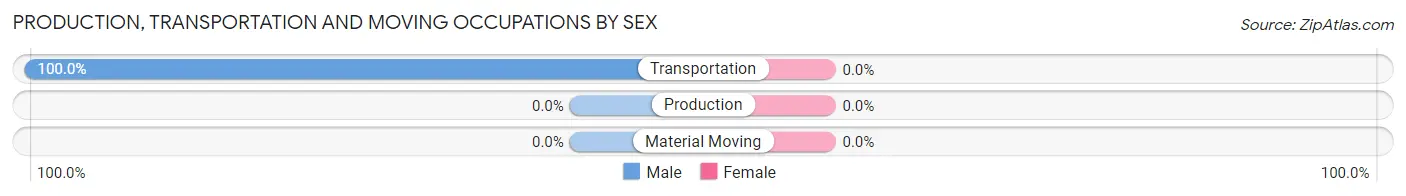
| Occupation | Male | Female |
| Production | 0 (0.0%) | 0 (0.0%) |
| Transportation | 2 (100.0%) | 0 (0.0%) |
| Material Moving | 0 (0.0%) | 0 (0.0%) |
| Total (Category) | 2 (100.0%) | 0 (0.0%) |
| Total (Overall) | 8 (57.1%) | 6 (42.9%) |
Employment Industries by Sex in Hazard
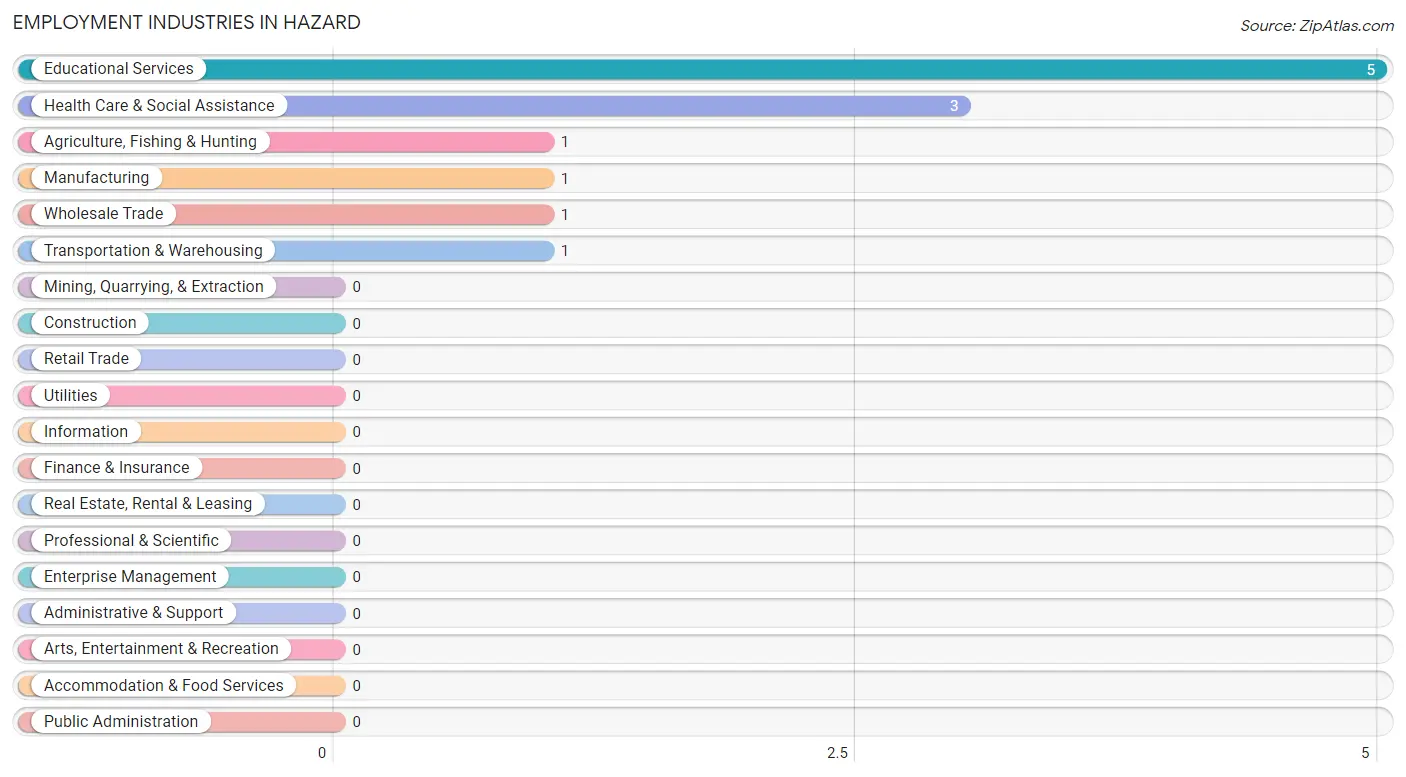
Employment Industries in Hazard
The major employment industries in Hazard include Educational Services (5 | 35.7%), Health Care & Social Assistance (3 | 21.4%), Agriculture, Fishing & Hunting (1 | 7.1%), Manufacturing (1 | 7.1%), and Wholesale Trade (1 | 7.1%).
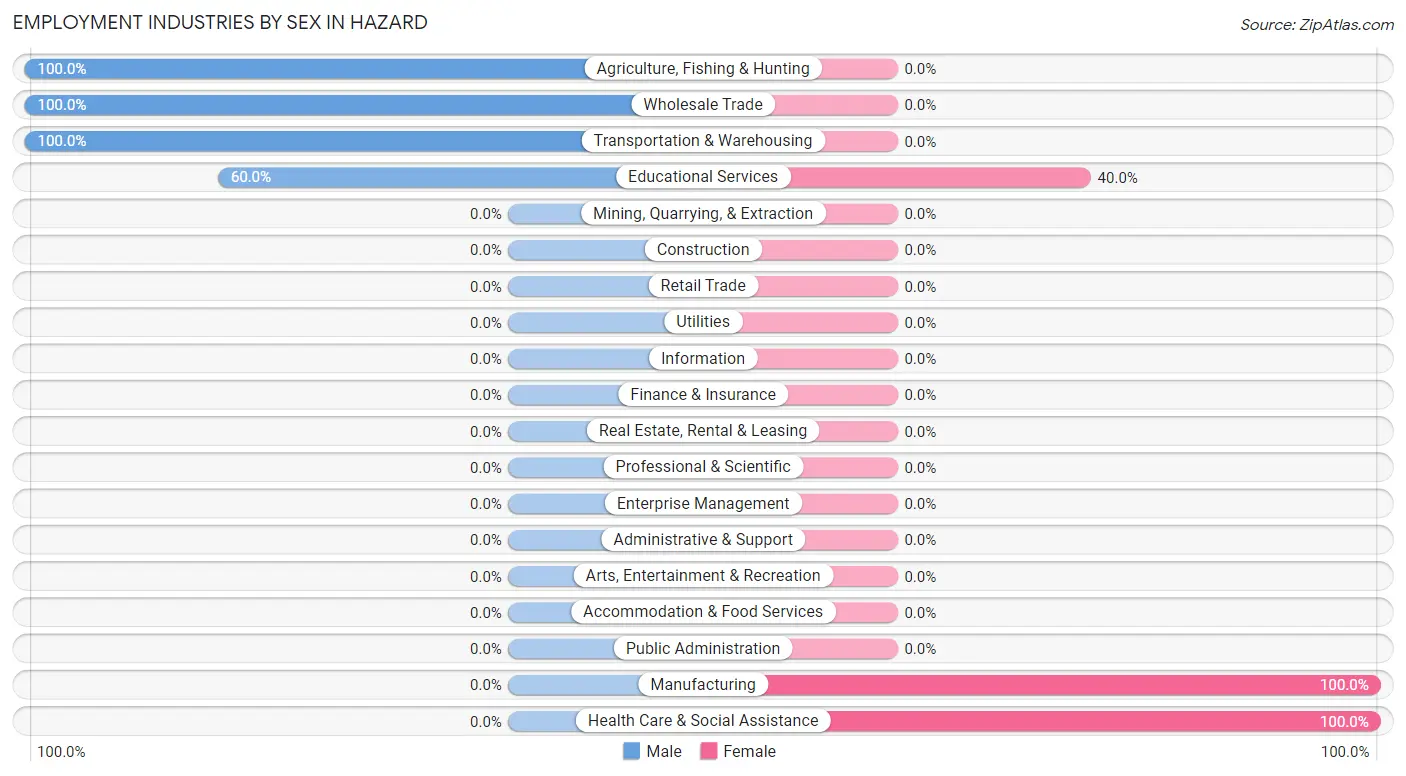
Employment Industries by Sex in Hazard
The Hazard industries that see more men than women are Agriculture, Fishing & Hunting (100.0%), Wholesale Trade (100.0%), and Transportation & Warehousing (100.0%), whereas the industries that tend to have a higher number of women are Manufacturing (100.0%), Health Care & Social Assistance (100.0%), and Educational Services (40.0%).
| Industry | Male | Female |
| Agriculture, Fishing & Hunting | 1 (100.0%) | 0 (0.0%) |
| Mining, Quarrying, & Extraction | 0 (0.0%) | 0 (0.0%) |
| Construction | 0 (0.0%) | 0 (0.0%) |
| Manufacturing | 0 (0.0%) | 1 (100.0%) |
| Wholesale Trade | 1 (100.0%) | 0 (0.0%) |
| Retail Trade | 0 (0.0%) | 0 (0.0%) |
| Transportation & Warehousing | 1 (100.0%) | 0 (0.0%) |
| Utilities | 0 (0.0%) | 0 (0.0%) |
| Information | 0 (0.0%) | 0 (0.0%) |
| Finance & Insurance | 0 (0.0%) | 0 (0.0%) |
| Real Estate, Rental & Leasing | 0 (0.0%) | 0 (0.0%) |
| Professional & Scientific | 0 (0.0%) | 0 (0.0%) |
| Enterprise Management | 0 (0.0%) | 0 (0.0%) |
| Administrative & Support | 0 (0.0%) | 0 (0.0%) |
| Educational Services | 3 (60.0%) | 2 (40.0%) |
| Health Care & Social Assistance | 0 (0.0%) | 3 (100.0%) |
| Arts, Entertainment & Recreation | 0 (0.0%) | 0 (0.0%) |
| Accommodation & Food Services | 0 (0.0%) | 0 (0.0%) |
| Public Administration | 0 (0.0%) | 0 (0.0%) |
| Total | 8 (57.1%) | 6 (42.9%) |
Education in Hazard
School Enrollment in Hazard
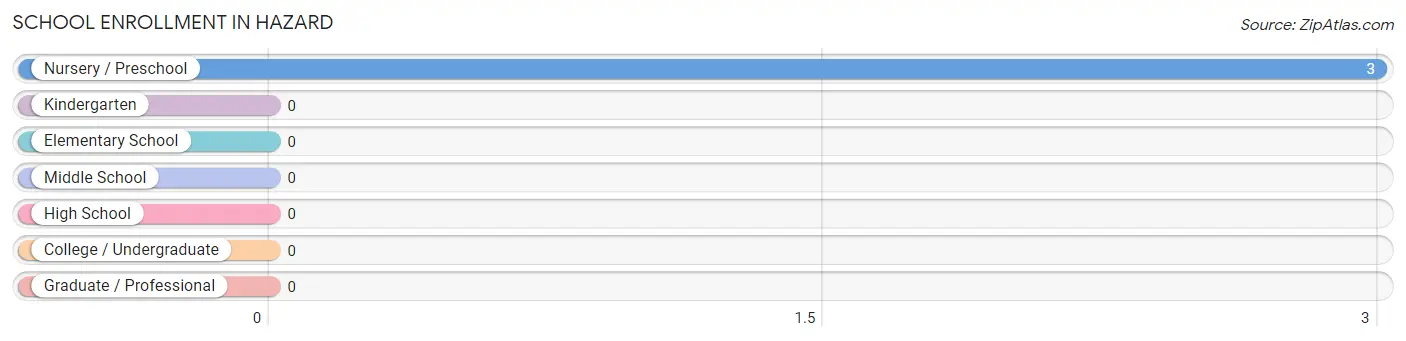
| School Level | # Students | % Students |
| Nursery / Preschool | 3 | 100.0% |
| Kindergarten | 0 | 0.0% |
| Elementary School | 0 | 0.0% |
| Middle School | 0 | 0.0% |
| High School | 0 | 0.0% |
| College / Undergraduate | 0 | 0.0% |
| Graduate / Professional | 0 | 0.0% |
| Total | 3 | 100.0% |
School Enrollment by Age by Funding Source in Hazard
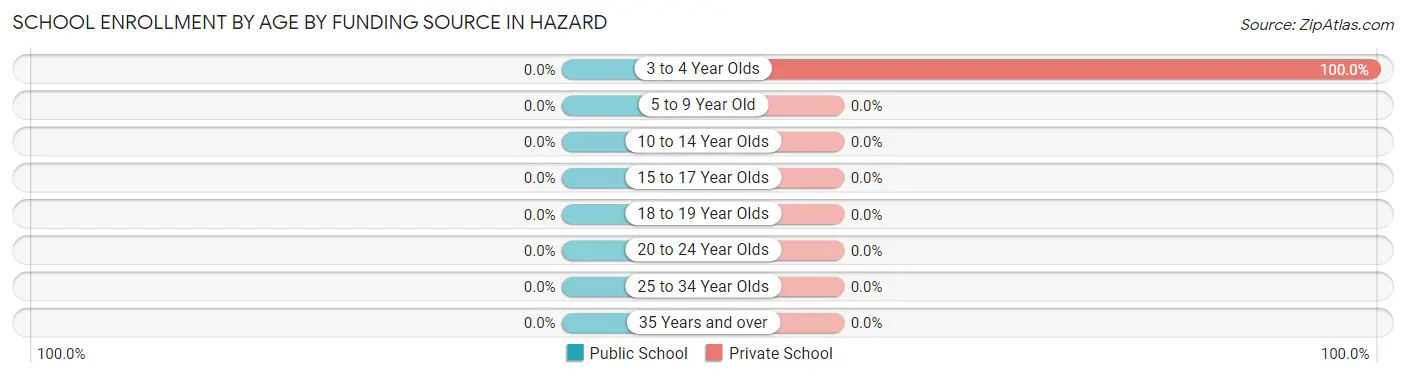
| Age Bracket | Public School | Private School |
| 3 to 4 Year Olds | 0 (0.0%) | 3 (100.0%) |
| 5 to 9 Year Old | 0 (0.0%) | 0 (0.0%) |
| 10 to 14 Year Olds | 0 (0.0%) | 0 (0.0%) |
| 15 to 17 Year Olds | 0 (0.0%) | 0 (0.0%) |
| 18 to 19 Year Olds | 0 (0.0%) | 0 (0.0%) |
| 20 to 24 Year Olds | 0 (0.0%) | 0 (0.0%) |
| 25 to 34 Year Olds | 0 (0.0%) | 0 (0.0%) |
| 35 Years and over | 0 (0.0%) | 0 (0.0%) |
| Total | 0 (0.0%) | 3 (100.0%) |
Educational Attainment by Field of Study in Hazard
Science & technology (6 | 42.9%), social sciences (3 | 21.4%), education (3 | 21.4%), and business (2 | 14.3%) are the most common fields of study among 14 individuals in Hazard who have obtained a bachelor's degree or higher.
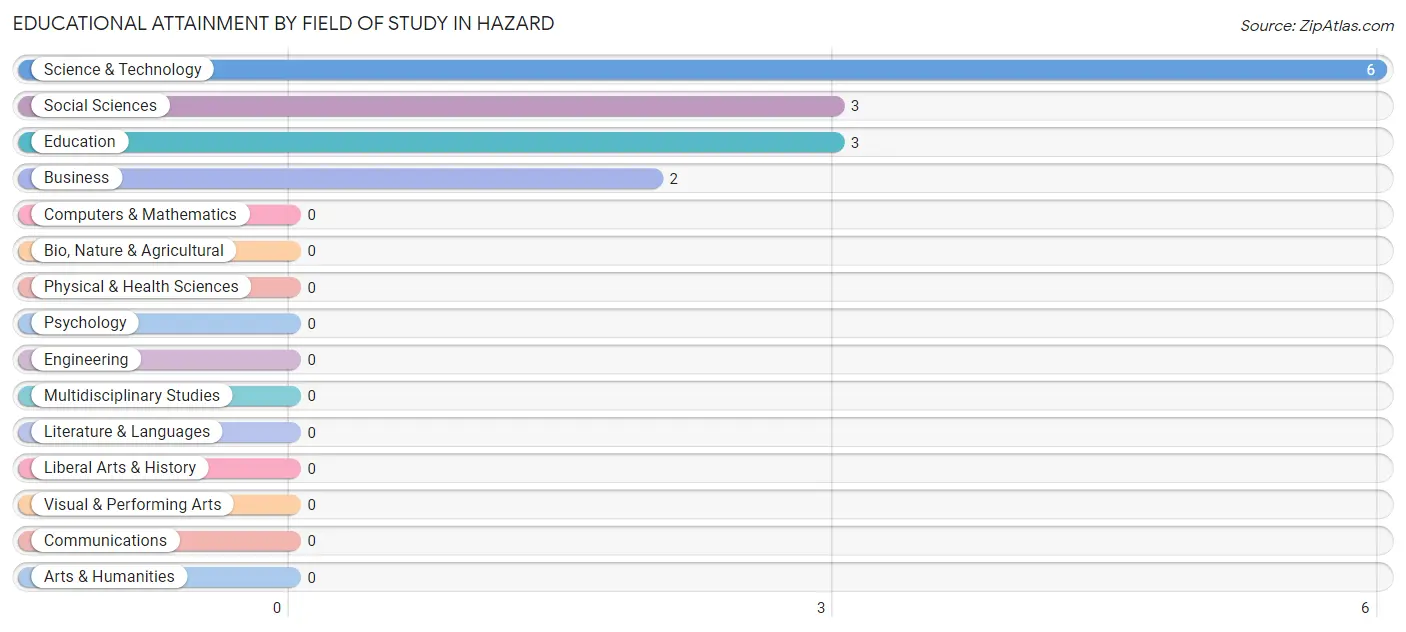
| Field of Study | # Graduates | % Graduates |
| Computers & Mathematics | 0 | 0.0% |
| Bio, Nature & Agricultural | 0 | 0.0% |
| Physical & Health Sciences | 0 | 0.0% |
| Psychology | 0 | 0.0% |
| Social Sciences | 3 | 21.4% |
| Engineering | 0 | 0.0% |
| Multidisciplinary Studies | 0 | 0.0% |
| Science & Technology | 6 | 42.9% |
| Business | 2 | 14.3% |
| Education | 3 | 21.4% |
| Literature & Languages | 0 | 0.0% |
| Liberal Arts & History | 0 | 0.0% |
| Visual & Performing Arts | 0 | 0.0% |
| Communications | 0 | 0.0% |
| Arts & Humanities | 0 | 0.0% |
| Total | 14 | 100.0% |
Transportation & Commute in Hazard
Vehicle Availability by Sex in Hazard
The most prevalent vehicle ownership categories in Hazard are males with 3 vehicles (6, accounting for 75.0%) and females with 3 vehicles (4, making up 100.0%).
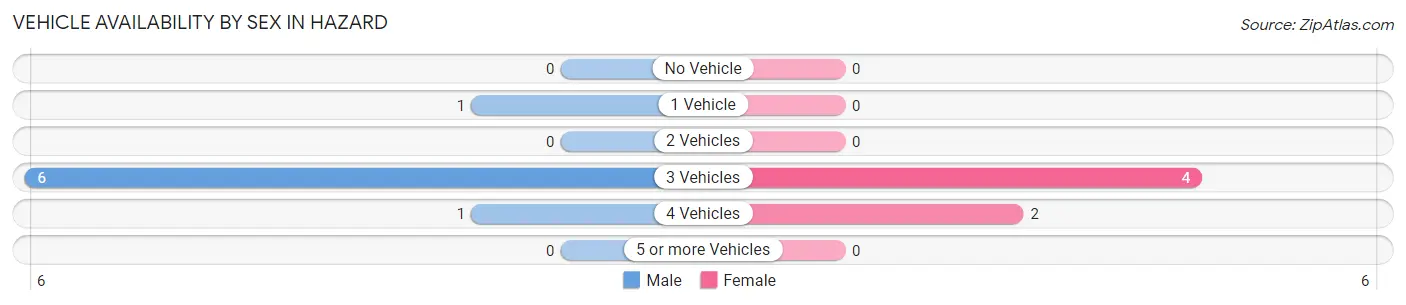
| Vehicles Available | Male | Female |
| No Vehicle | 0 (0.0%) | 0 (0.0%) |
| 1 Vehicle | 1 (12.5%) | 0 (0.0%) |
| 2 Vehicles | 0 (0.0%) | 0 (0.0%) |
| 3 Vehicles | 6 (75.0%) | 4 (66.7%) |
| 4 Vehicles | 1 (12.5%) | 2 (33.3%) |
| 5 or more Vehicles | 0 (0.0%) | 0 (0.0%) |
| Total | 8 (100.0%) | 6 (100.0%) |
Commute Time in Hazard
The most frequently occuring commute durations in Hazard are 15 to 19 minutes (3 commuters, 21.4%), 5 to 9 minutes (2 commuters, 14.3%), and 10 to 14 minutes (2 commuters, 14.3%).
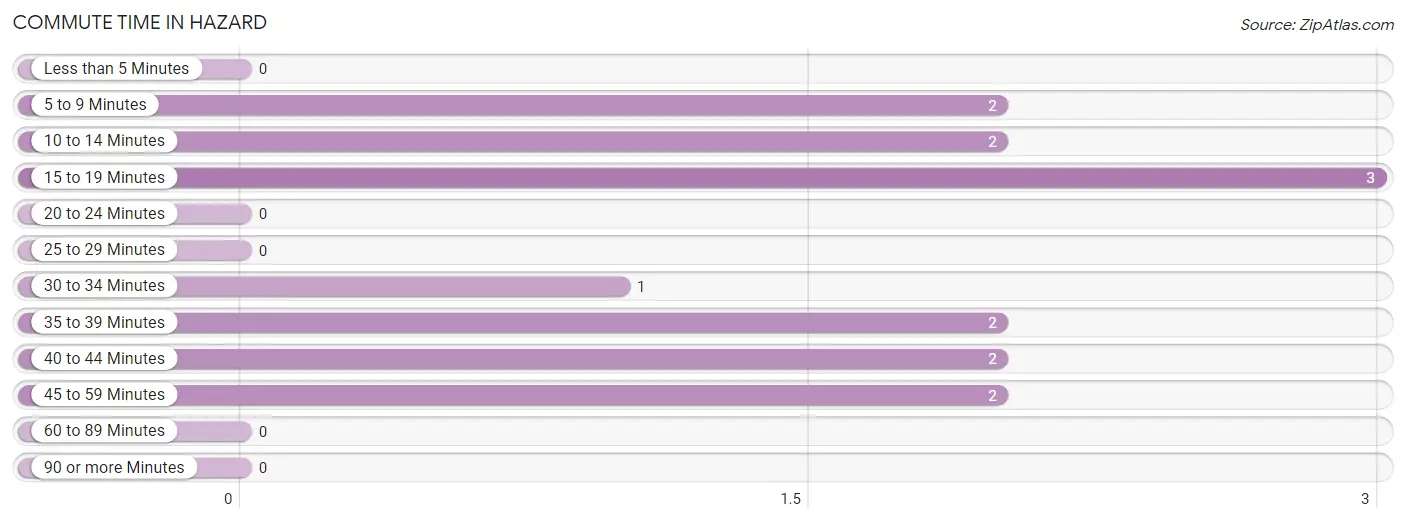
| Commute Time | # Commuters | % Commuters |
| Less than 5 Minutes | 0 | 0.0% |
| 5 to 9 Minutes | 2 | 14.3% |
| 10 to 14 Minutes | 2 | 14.3% |
| 15 to 19 Minutes | 3 | 21.4% |
| 20 to 24 Minutes | 0 | 0.0% |
| 25 to 29 Minutes | 0 | 0.0% |
| 30 to 34 Minutes | 1 | 7.1% |
| 35 to 39 Minutes | 2 | 14.3% |
| 40 to 44 Minutes | 2 | 14.3% |
| 45 to 59 Minutes | 2 | 14.3% |
| 60 to 89 Minutes | 0 | 0.0% |
| 90 or more Minutes | 0 | 0.0% |
Commute Time by Sex in Hazard
The most common commute times in Hazard are 15 to 19 minutes (3 commuters, 37.5%) for males and 10 to 14 minutes (2 commuters, 33.3%) for females.
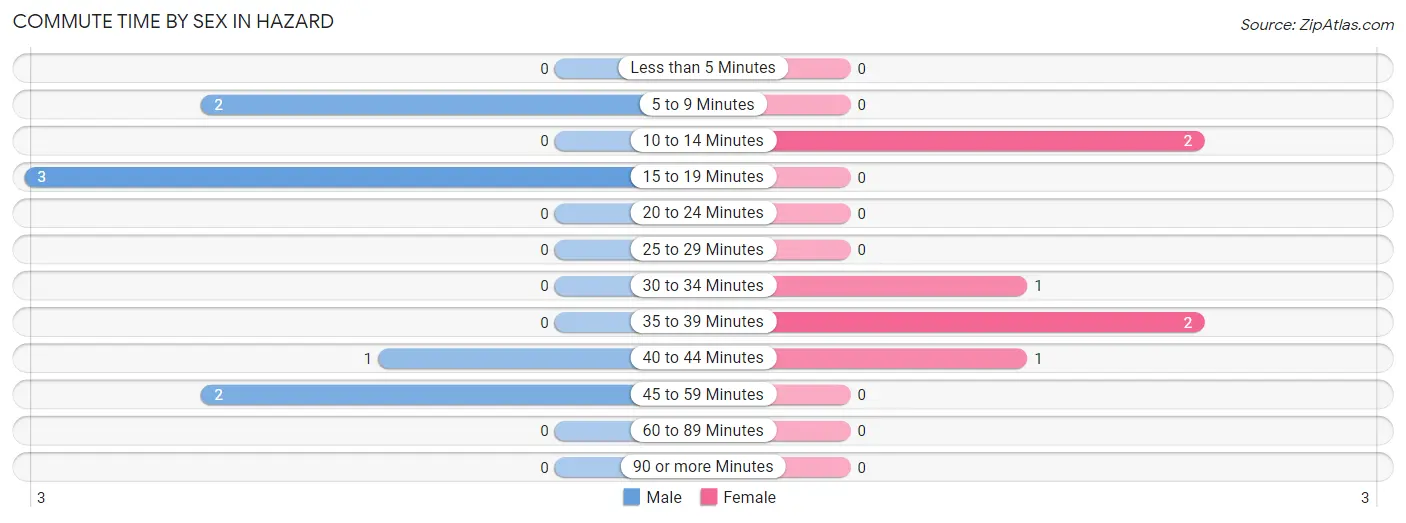
| Commute Time | Male | Female |
| Less than 5 Minutes | 0 (0.0%) | 0 (0.0%) |
| 5 to 9 Minutes | 2 (25.0%) | 0 (0.0%) |
| 10 to 14 Minutes | 0 (0.0%) | 2 (33.3%) |
| 15 to 19 Minutes | 3 (37.5%) | 0 (0.0%) |
| 20 to 24 Minutes | 0 (0.0%) | 0 (0.0%) |
| 25 to 29 Minutes | 0 (0.0%) | 0 (0.0%) |
| 30 to 34 Minutes | 0 (0.0%) | 1 (16.7%) |
| 35 to 39 Minutes | 0 (0.0%) | 2 (33.3%) |
| 40 to 44 Minutes | 1 (12.5%) | 1 (16.7%) |
| 45 to 59 Minutes | 2 (25.0%) | 0 (0.0%) |
| 60 to 89 Minutes | 0 (0.0%) | 0 (0.0%) |
| 90 or more Minutes | 0 (0.0%) | 0 (0.0%) |
Time of Departure to Work by Sex in Hazard
The most frequent times of departure to work in Hazard are 7:00 AM to 7:29 AM (2, 25.0%) for males and 7:00 AM to 7:29 AM (4, 66.7%) for females.
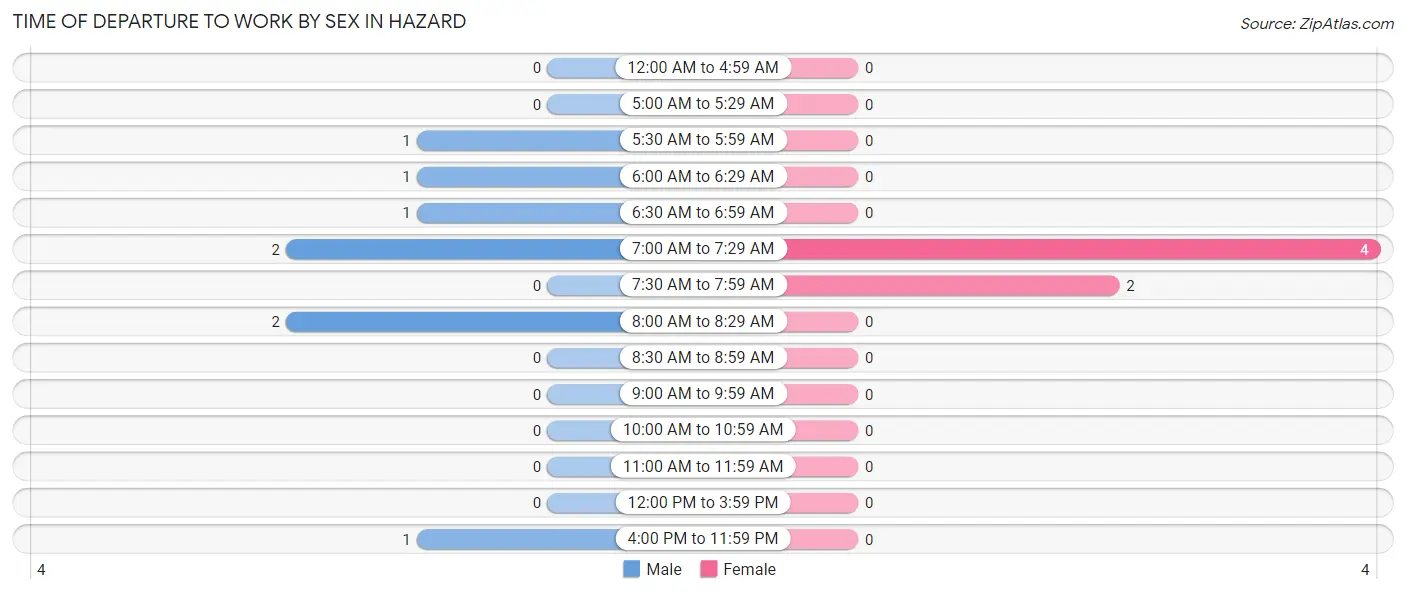
| Time of Departure | Male | Female |
| 12:00 AM to 4:59 AM | 0 (0.0%) | 0 (0.0%) |
| 5:00 AM to 5:29 AM | 0 (0.0%) | 0 (0.0%) |
| 5:30 AM to 5:59 AM | 1 (12.5%) | 0 (0.0%) |
| 6:00 AM to 6:29 AM | 1 (12.5%) | 0 (0.0%) |
| 6:30 AM to 6:59 AM | 1 (12.5%) | 0 (0.0%) |
| 7:00 AM to 7:29 AM | 2 (25.0%) | 4 (66.7%) |
| 7:30 AM to 7:59 AM | 0 (0.0%) | 2 (33.3%) |
| 8:00 AM to 8:29 AM | 2 (25.0%) | 0 (0.0%) |
| 8:30 AM to 8:59 AM | 0 (0.0%) | 0 (0.0%) |
| 9:00 AM to 9:59 AM | 0 (0.0%) | 0 (0.0%) |
| 10:00 AM to 10:59 AM | 0 (0.0%) | 0 (0.0%) |
| 11:00 AM to 11:59 AM | 0 (0.0%) | 0 (0.0%) |
| 12:00 PM to 3:59 PM | 0 (0.0%) | 0 (0.0%) |
| 4:00 PM to 11:59 PM | 1 (12.5%) | 0 (0.0%) |
| Total | 8 (100.0%) | 6 (100.0%) |
Housing Occupancy in Hazard
Occupancy by Ownership in Hazard
Of the total 25 dwellings in Hazard, owner-occupied units account for 22 (88.0%), while renter-occupied units make up 3 (12.0%).
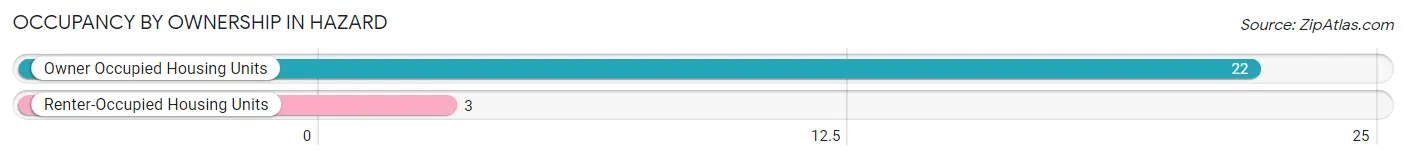
| Occupancy | # Housing Units | % Housing Units |
| Owner Occupied Housing Units | 22 | 88.0% |
| Renter-Occupied Housing Units | 3 | 12.0% |
| Total Occupied Housing Units | 25 | 100.0% |
Occupancy by Household Size in Hazard
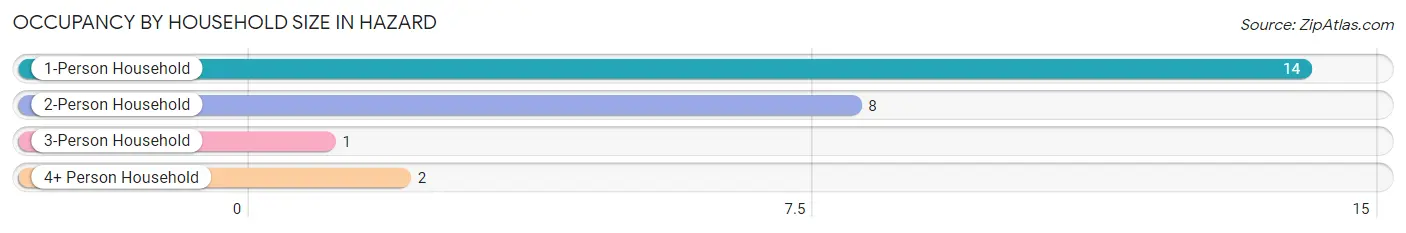
| Household Size | # Housing Units | % Housing Units |
| 1-Person Household | 14 | 56.0% |
| 2-Person Household | 8 | 32.0% |
| 3-Person Household | 1 | 4.0% |
| 4+ Person Household | 2 | 8.0% |
| Total Housing Units | 25 | 100.0% |
Occupancy by Ownership by Household Size in Hazard
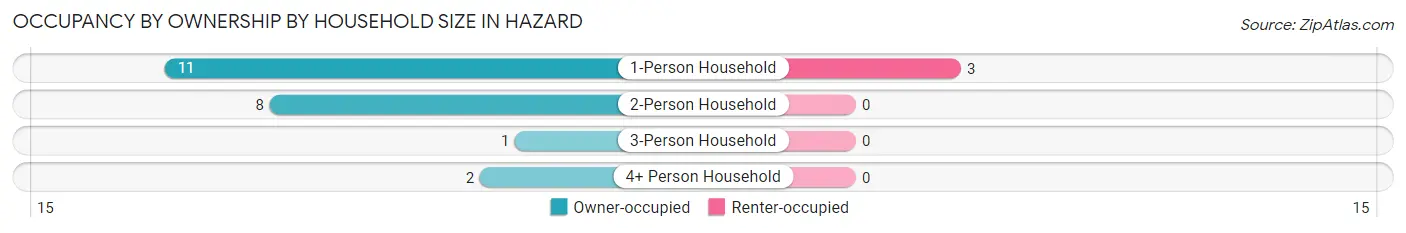
| Household Size | Owner-occupied | Renter-occupied |
| 1-Person Household | 11 (78.6%) | 3 (21.4%) |
| 2-Person Household | 8 (100.0%) | 0 (0.0%) |
| 3-Person Household | 1 (100.0%) | 0 (0.0%) |
| 4+ Person Household | 2 (100.0%) | 0 (0.0%) |
| Total Housing Units | 22 (88.0%) | 3 (12.0%) |
Occupancy by Educational Attainment in Hazard
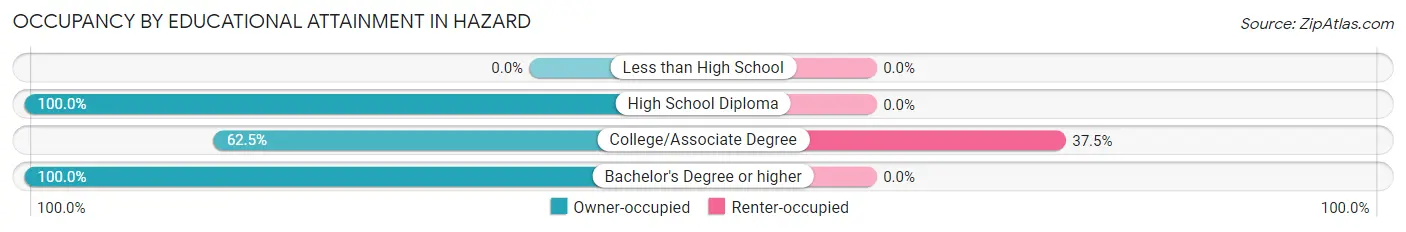
| Household Size | Owner-occupied | Renter-occupied |
| Less than High School | 0 (0.0%) | 0 (0.0%) |
| High School Diploma | 10 (100.0%) | 0 (0.0%) |
| College/Associate Degree | 5 (62.5%) | 3 (37.5%) |
| Bachelor's Degree or higher | 7 (100.0%) | 0 (0.0%) |
Occupancy by Age of Householder in Hazard
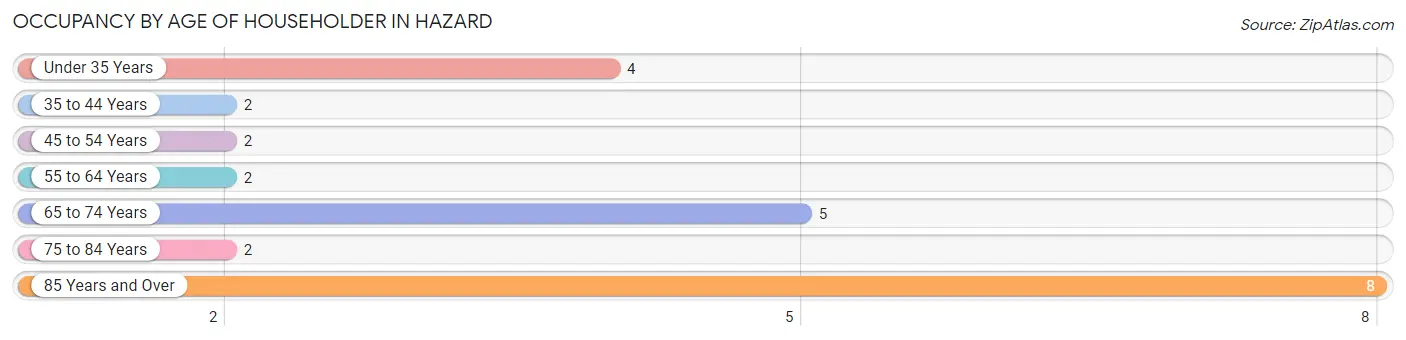
| Age Bracket | # Households | % Households |
| Under 35 Years | 4 | 16.0% |
| 35 to 44 Years | 2 | 8.0% |
| 45 to 54 Years | 2 | 8.0% |
| 55 to 64 Years | 2 | 8.0% |
| 65 to 74 Years | 5 | 20.0% |
| 75 to 84 Years | 2 | 8.0% |
| 85 Years and Over | 8 | 32.0% |
| Total | 25 | 100.0% |
Housing Finances in Hazard
Median Income by Occupancy in Hazard
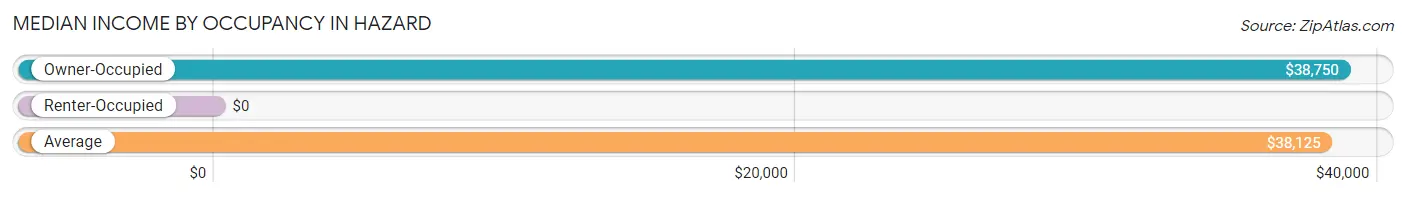
| Occupancy Type | # Households | Median Income |
| Owner-Occupied | 22 (88.0%) | $38,750 |
| Renter-Occupied | 3 (12.0%) | $0 |
| Average | 25 (100.0%) | $38,125 |
Occupancy by Householder Income Bracket in Hazard
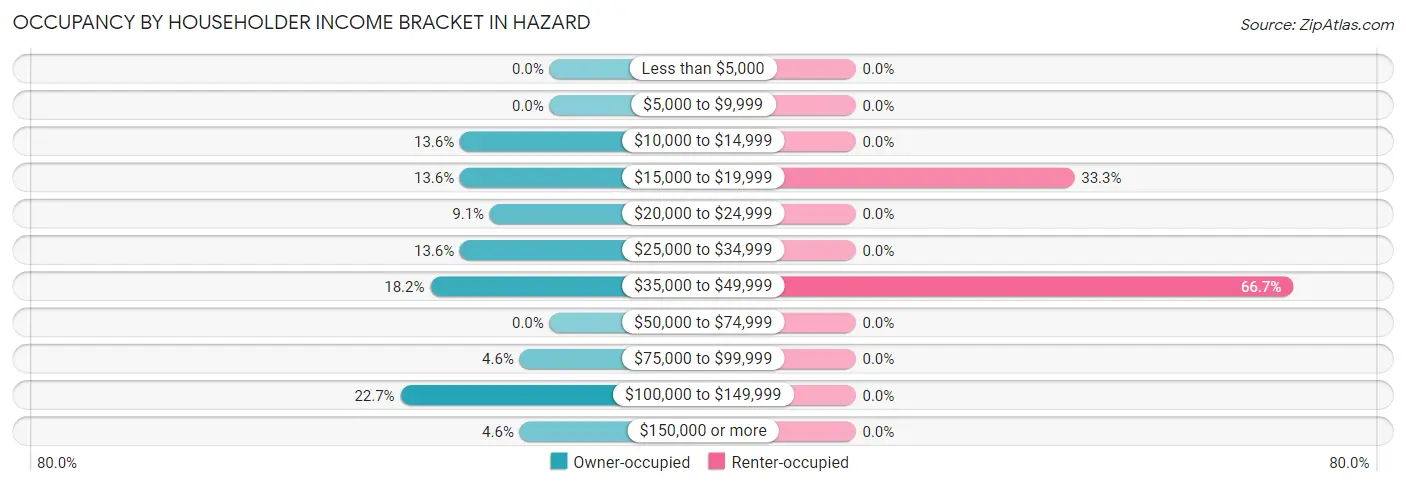
| Income Bracket | Owner-occupied | Renter-occupied |
| Less than $5,000 | 0 (0.0%) | 0 (0.0%) |
| $5,000 to $9,999 | 0 (0.0%) | 0 (0.0%) |
| $10,000 to $14,999 | 3 (13.6%) | 0 (0.0%) |
| $15,000 to $19,999 | 3 (13.6%) | 1 (33.3%) |
| $20,000 to $24,999 | 2 (9.1%) | 0 (0.0%) |
| $25,000 to $34,999 | 3 (13.6%) | 0 (0.0%) |
| $35,000 to $49,999 | 4 (18.2%) | 2 (66.7%) |
| $50,000 to $74,999 | 0 (0.0%) | 0 (0.0%) |
| $75,000 to $99,999 | 1 (4.5%) | 0 (0.0%) |
| $100,000 to $149,999 | 5 (22.7%) | 0 (0.0%) |
| $150,000 or more | 1 (4.5%) | 0 (0.0%) |
| Total | 22 (100.0%) | 3 (100.0%) |
Monthly Housing Cost Tiers in Hazard
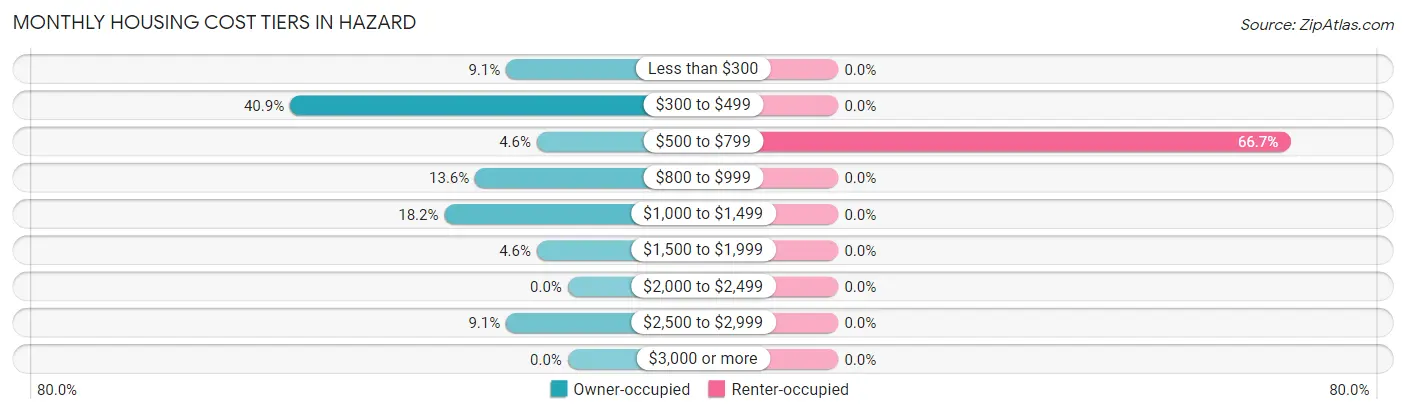
| Monthly Cost | Owner-occupied | Renter-occupied |
| Less than $300 | 2 (9.1%) | 0 (0.0%) |
| $300 to $499 | 9 (40.9%) | 0 (0.0%) |
| $500 to $799 | 1 (4.5%) | 2 (66.7%) |
| $800 to $999 | 3 (13.6%) | 0 (0.0%) |
| $1,000 to $1,499 | 4 (18.2%) | 0 (0.0%) |
| $1,500 to $1,999 | 1 (4.5%) | 0 (0.0%) |
| $2,000 to $2,499 | 0 (0.0%) | 0 (0.0%) |
| $2,500 to $2,999 | 2 (9.1%) | 0 (0.0%) |
| $3,000 or more | 0 (0.0%) | 0 (0.0%) |
| Total | 22 (100.0%) | 3 (100.0%) |
Physical Housing Characteristics in Hazard
Housing Structures in Hazard
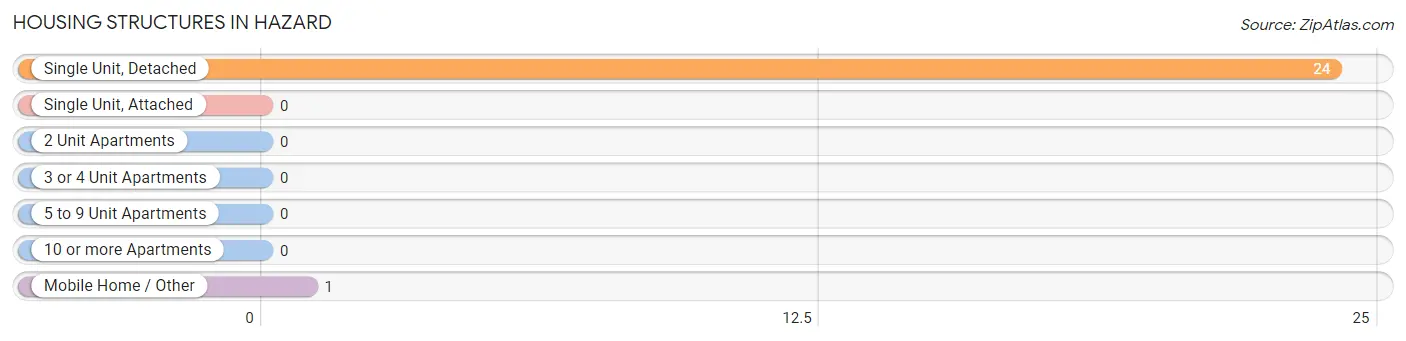
| Structure Type | # Housing Units | % Housing Units |
| Single Unit, Detached | 24 | 96.0% |
| Single Unit, Attached | 0 | 0.0% |
| 2 Unit Apartments | 0 | 0.0% |
| 3 or 4 Unit Apartments | 0 | 0.0% |
| 5 to 9 Unit Apartments | 0 | 0.0% |
| 10 or more Apartments | 0 | 0.0% |
| Mobile Home / Other | 1 | 4.0% |
| Total | 25 | 100.0% |
Housing Structures by Occupancy in Hazard
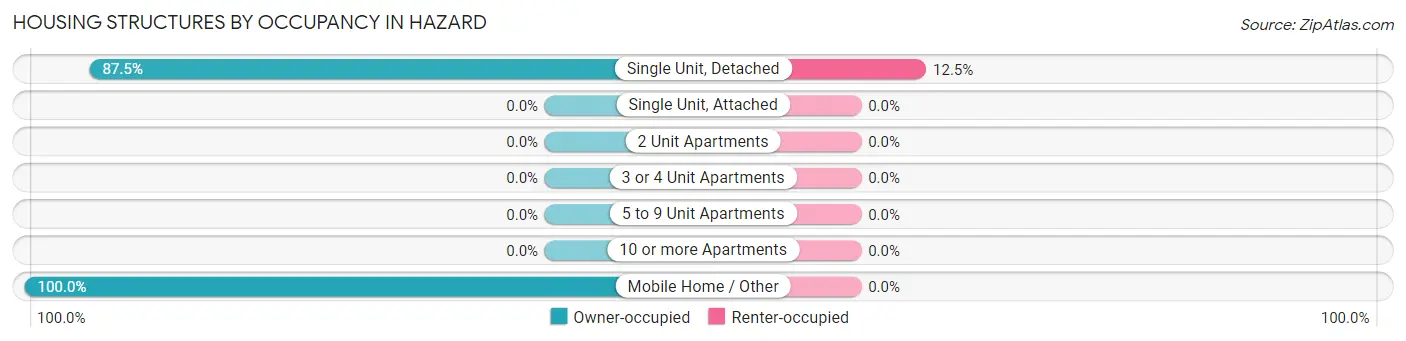
| Structure Type | Owner-occupied | Renter-occupied |
| Single Unit, Detached | 21 (87.5%) | 3 (12.5%) |
| Single Unit, Attached | 0 (0.0%) | 0 (0.0%) |
| 2 Unit Apartments | 0 (0.0%) | 0 (0.0%) |
| 3 or 4 Unit Apartments | 0 (0.0%) | 0 (0.0%) |
| 5 to 9 Unit Apartments | 0 (0.0%) | 0 (0.0%) |
| 10 or more Apartments | 0 (0.0%) | 0 (0.0%) |
| Mobile Home / Other | 1 (100.0%) | 0 (0.0%) |
| Total | 22 (88.0%) | 3 (12.0%) |
Housing Structures by Number of Rooms in Hazard
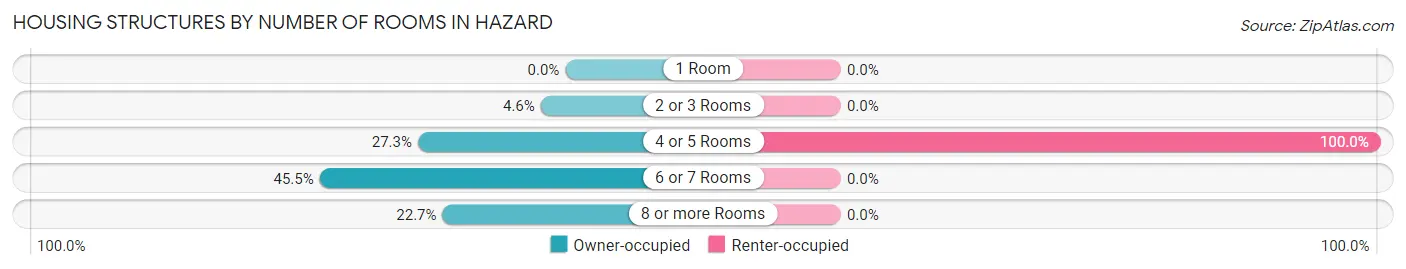
| Number of Rooms | Owner-occupied | Renter-occupied |
| 1 Room | 0 (0.0%) | 0 (0.0%) |
| 2 or 3 Rooms | 1 (4.5%) | 0 (0.0%) |
| 4 or 5 Rooms | 6 (27.3%) | 3 (100.0%) |
| 6 or 7 Rooms | 10 (45.5%) | 0 (0.0%) |
| 8 or more Rooms | 5 (22.7%) | 0 (0.0%) |
| Total | 22 (100.0%) | 3 (100.0%) |
Housing Structure by Heating Type in Hazard
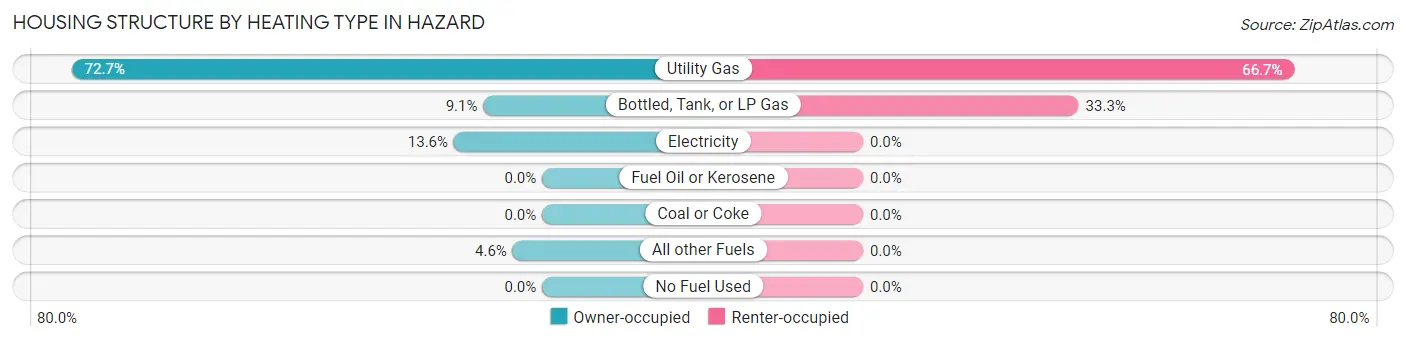
| Heating Type | Owner-occupied | Renter-occupied |
| Utility Gas | 16 (72.7%) | 2 (66.7%) |
| Bottled, Tank, or LP Gas | 2 (9.1%) | 1 (33.3%) |
| Electricity | 3 (13.6%) | 0 (0.0%) |
| Fuel Oil or Kerosene | 0 (0.0%) | 0 (0.0%) |
| Coal or Coke | 0 (0.0%) | 0 (0.0%) |
| All other Fuels | 1 (4.5%) | 0 (0.0%) |
| No Fuel Used | 0 (0.0%) | 0 (0.0%) |
| Total | 22 (100.0%) | 3 (100.0%) |
Household Vehicle Usage in Hazard
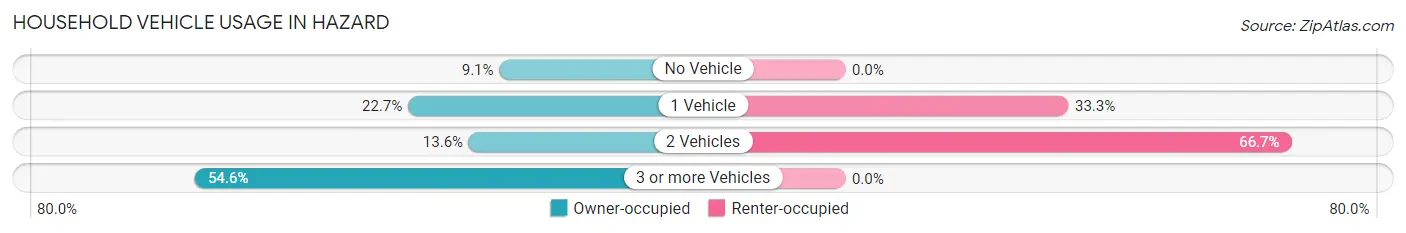
| Vehicles per Household | Owner-occupied | Renter-occupied |
| No Vehicle | 2 (9.1%) | 0 (0.0%) |
| 1 Vehicle | 5 (22.7%) | 1 (33.3%) |
| 2 Vehicles | 3 (13.6%) | 2 (66.7%) |
| 3 or more Vehicles | 12 (54.5%) | 0 (0.0%) |
| Total | 22 (100.0%) | 3 (100.0%) |
Real Estate & Mortgages in Hazard
Real Estate and Mortgage Overview in Hazard
| Characteristic | Without Mortgage | With Mortgage |
| Housing Units | 12 | 10 |
| Median Property Value | $85,000 | $150,000 |
| Median Household Income | $25,000 | $1 |
| Monthly Housing Costs | $350 | $0 |
| Real Estate Taxes | $775 | $0 |
Property Value by Mortgage Status in Hazard
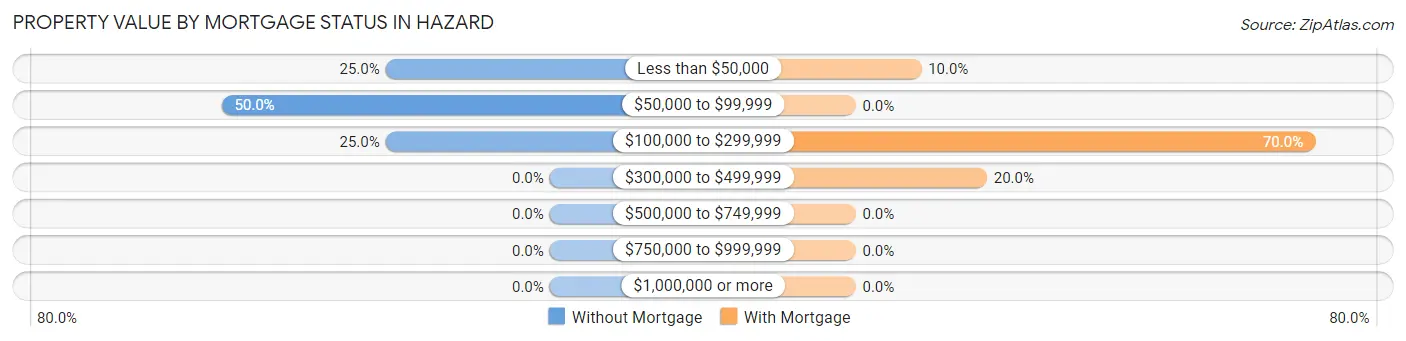
| Property Value | Without Mortgage | With Mortgage |
| Less than $50,000 | 3 (25.0%) | 1 (10.0%) |
| $50,000 to $99,999 | 6 (50.0%) | 0 (0.0%) |
| $100,000 to $299,999 | 3 (25.0%) | 7 (70.0%) |
| $300,000 to $499,999 | 0 (0.0%) | 2 (20.0%) |
| $500,000 to $749,999 | 0 (0.0%) | 0 (0.0%) |
| $750,000 to $999,999 | 0 (0.0%) | 0 (0.0%) |
| $1,000,000 or more | 0 (0.0%) | 0 (0.0%) |
| Total | 12 (100.0%) | 10 (100.0%) |
Household Income by Mortgage Status in Hazard
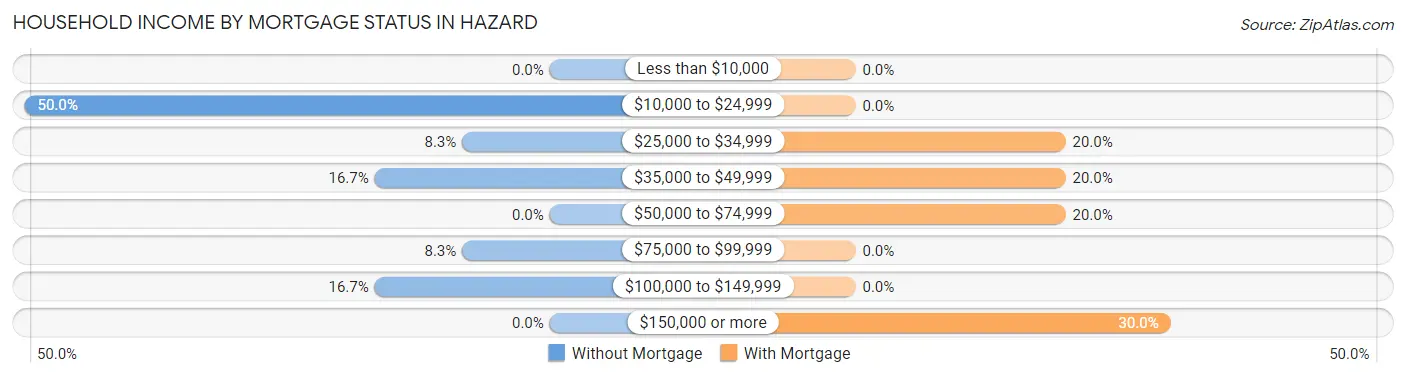
| Household Income | Without Mortgage | With Mortgage |
| Less than $10,000 | 0 (0.0%) | 0 (0.0%) |
| $10,000 to $24,999 | 6 (50.0%) | 0 (0.0%) |
| $25,000 to $34,999 | 1 (8.3%) | 2 (20.0%) |
| $35,000 to $49,999 | 2 (16.7%) | 2 (20.0%) |
| $50,000 to $74,999 | 0 (0.0%) | 2 (20.0%) |
| $75,000 to $99,999 | 1 (8.3%) | 0 (0.0%) |
| $100,000 to $149,999 | 2 (16.7%) | 0 (0.0%) |
| $150,000 or more | 0 (0.0%) | 3 (30.0%) |
| Total | 12 (100.0%) | 10 (100.0%) |
Property Value to Household Income Ratio in Hazard
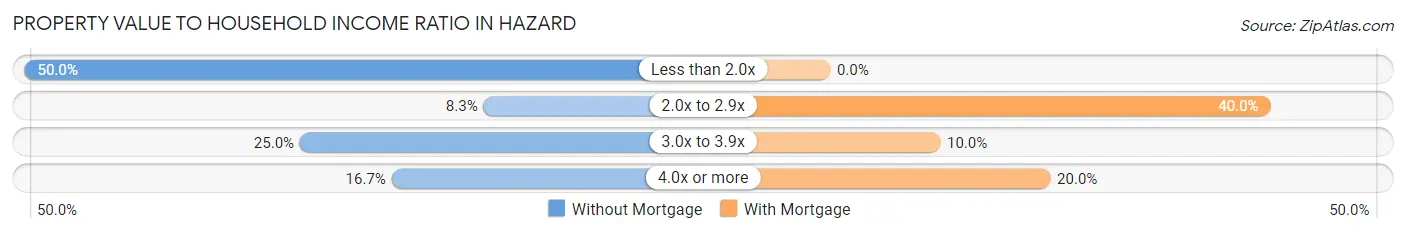
| Value-to-Income Ratio | Without Mortgage | With Mortgage |
| Less than 2.0x | 6 (50.0%) | 0 (0.0%) |
| 2.0x to 2.9x | 1 (8.3%) | 4 (40.0%) |
| 3.0x to 3.9x | 3 (25.0%) | 1 (10.0%) |
| 4.0x or more | 2 (16.7%) | 2 (20.0%) |
| Total | 12 (100.0%) | 10 (100.0%) |
Real Estate Taxes by Mortgage Status in Hazard
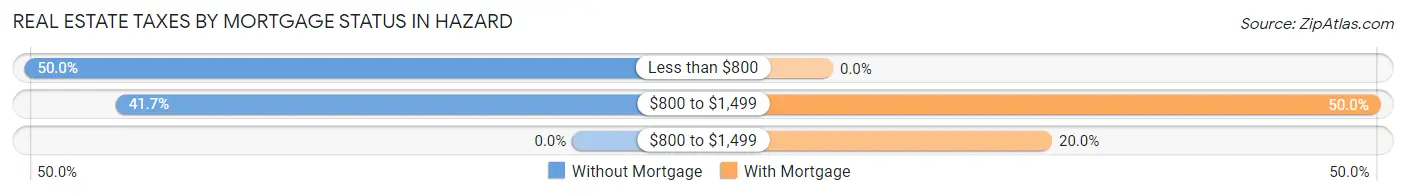
| Property Taxes | Without Mortgage | With Mortgage |
| Less than $800 | 6 (50.0%) | 0 (0.0%) |
| $800 to $1,499 | 5 (41.7%) | 5 (50.0%) |
| $800 to $1,499 | 0 (0.0%) | 2 (20.0%) |
| Total | 12 (100.0%) | 10 (100.0%) |
Health & Disability in Hazard
Health Insurance Coverage by Age in Hazard
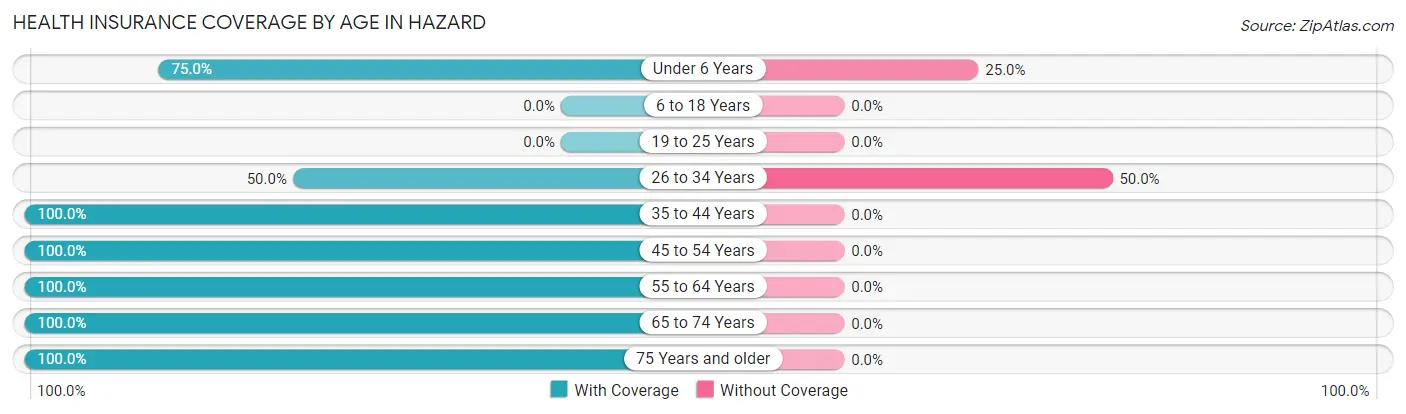
| Age Bracket | With Coverage | Without Coverage |
| Under 6 Years | 9 (75.0%) | 3 (25.0%) |
| 6 to 18 Years | 0 (0.0%) | 0 (0.0%) |
| 19 to 25 Years | 0 (0.0%) | 0 (0.0%) |
| 26 to 34 Years | 5 (50.0%) | 5 (50.0%) |
| 35 to 44 Years | 4 (100.0%) | 0 (0.0%) |
| 45 to 54 Years | 3 (100.0%) | 0 (0.0%) |
| 55 to 64 Years | 3 (100.0%) | 0 (0.0%) |
| 65 to 74 Years | 6 (100.0%) | 0 (0.0%) |
| 75 Years and older | 11 (100.0%) | 0 (0.0%) |
| Total | 41 (83.7%) | 8 (16.3%) |
Health Insurance Coverage by Citizenship Status in Hazard
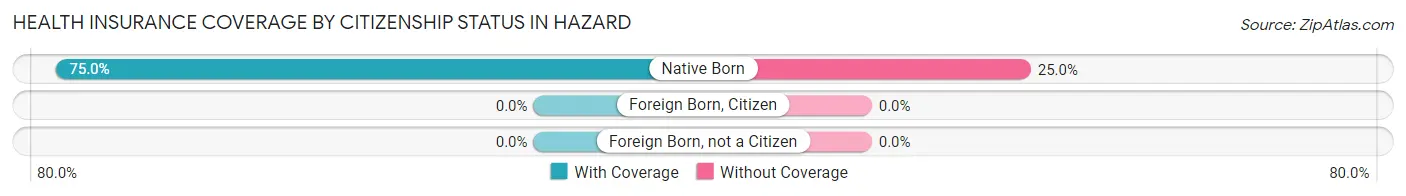
| Citizenship Status | With Coverage | Without Coverage |
| Native Born | 9 (75.0%) | 3 (25.0%) |
| Foreign Born, Citizen | 0 (0.0%) | 0 (0.0%) |
| Foreign Born, not a Citizen | 0 (0.0%) | 0 (0.0%) |
Health Insurance Coverage by Household Income in Hazard
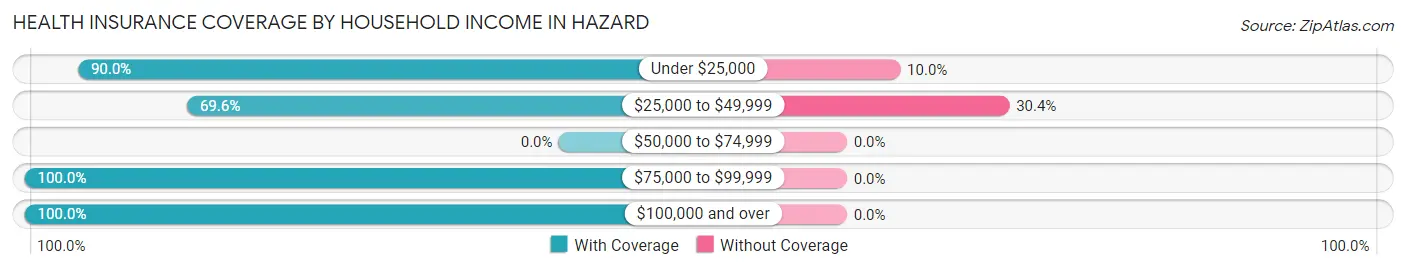
| Household Income | With Coverage | Without Coverage |
| Under $25,000 | 9 (90.0%) | 1 (10.0%) |
| $25,000 to $49,999 | 16 (69.6%) | 7 (30.4%) |
| $50,000 to $74,999 | 0 (0.0%) | 0 (0.0%) |
| $75,000 to $99,999 | 2 (100.0%) | 0 (0.0%) |
| $100,000 and over | 14 (100.0%) | 0 (0.0%) |
Public vs Private Health Insurance Coverage by Age in Hazard
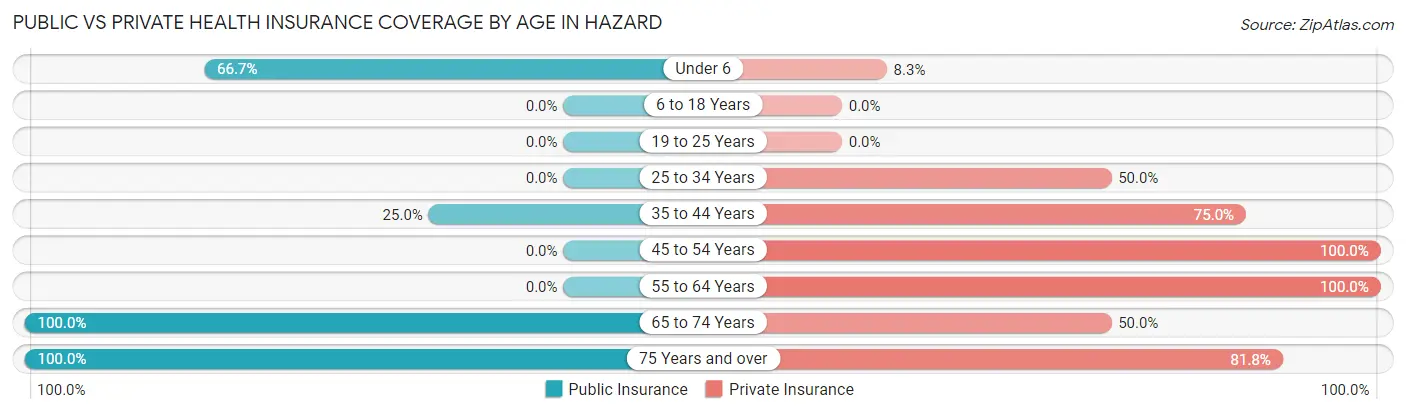
| Age Bracket | Public Insurance | Private Insurance |
| Under 6 | 8 (66.7%) | 1 (8.3%) |
| 6 to 18 Years | 0 (0.0%) | 0 (0.0%) |
| 19 to 25 Years | 0 (0.0%) | 0 (0.0%) |
| 25 to 34 Years | 0 (0.0%) | 5 (50.0%) |
| 35 to 44 Years | 1 (25.0%) | 3 (75.0%) |
| 45 to 54 Years | 0 (0.0%) | 3 (100.0%) |
| 55 to 64 Years | 0 (0.0%) | 3 (100.0%) |
| 65 to 74 Years | 6 (100.0%) | 3 (50.0%) |
| 75 Years and over | 11 (100.0%) | 9 (81.8%) |
| Total | 26 (53.1%) | 27 (55.1%) |
Disability Status by Sex by Age in Hazard
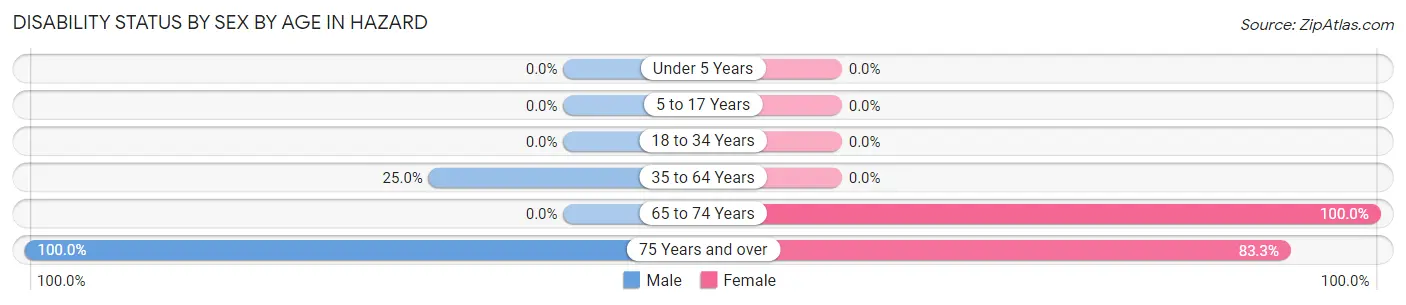
| Age Bracket | Male | Female |
| Under 5 Years | 0 (0.0%) | 0 (0.0%) |
| 5 to 17 Years | 0 (0.0%) | 0 (0.0%) |
| 18 to 34 Years | 0 (0.0%) | 0 (0.0%) |
| 35 to 64 Years | 1 (25.0%) | 0 (0.0%) |
| 65 to 74 Years | 0 (0.0%) | 1 (100.0%) |
| 75 Years and over | 5 (100.0%) | 5 (83.3%) |
Disability Class by Sex by Age in Hazard
Disability Class: Hearing Difficulty
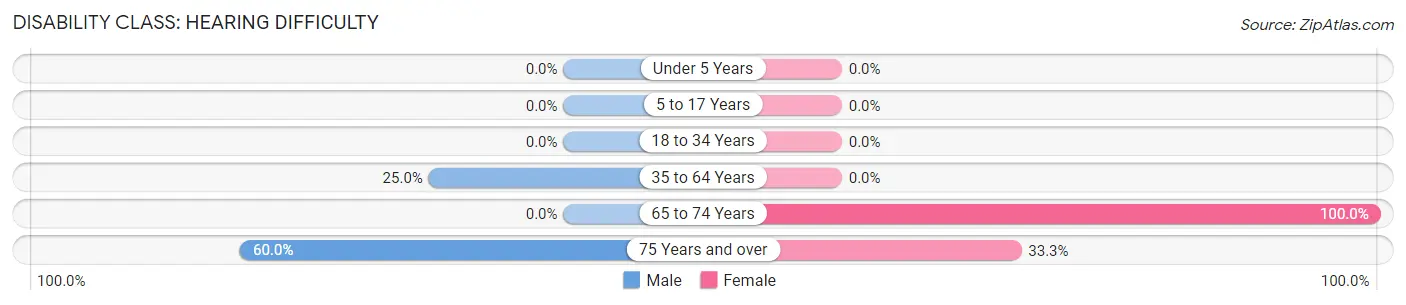
| Age Bracket | Male | Female |
| Under 5 Years | 0 (0.0%) | 0 (0.0%) |
| 5 to 17 Years | 0 (0.0%) | 0 (0.0%) |
| 18 to 34 Years | 0 (0.0%) | 0 (0.0%) |
| 35 to 64 Years | 1 (25.0%) | 0 (0.0%) |
| 65 to 74 Years | 0 (0.0%) | 1 (100.0%) |
| 75 Years and over | 3 (60.0%) | 2 (33.3%) |
Disability Class: Vision Difficulty
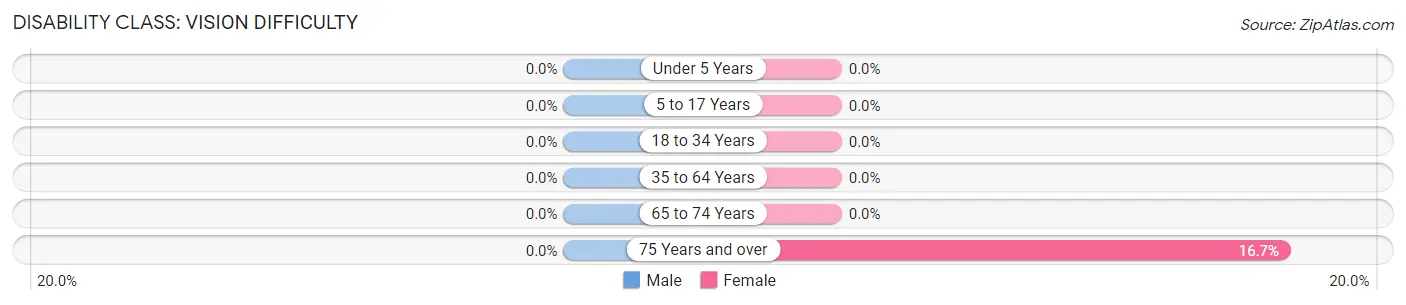
| Age Bracket | Male | Female |
| Under 5 Years | 0 (0.0%) | 0 (0.0%) |
| 5 to 17 Years | 0 (0.0%) | 0 (0.0%) |
| 18 to 34 Years | 0 (0.0%) | 0 (0.0%) |
| 35 to 64 Years | 0 (0.0%) | 0 (0.0%) |
| 65 to 74 Years | 0 (0.0%) | 0 (0.0%) |
| 75 Years and over | 0 (0.0%) | 1 (16.7%) |
Disability Class: Cognitive Difficulty
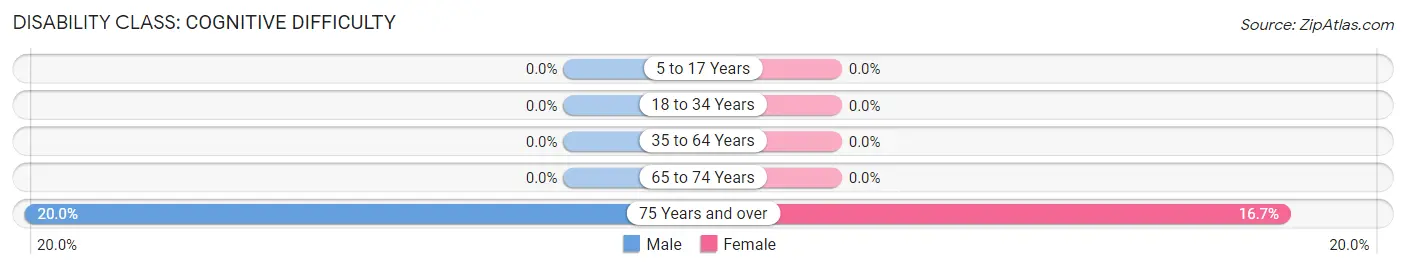
| Age Bracket | Male | Female |
| 5 to 17 Years | 0 (0.0%) | 0 (0.0%) |
| 18 to 34 Years | 0 (0.0%) | 0 (0.0%) |
| 35 to 64 Years | 0 (0.0%) | 0 (0.0%) |
| 65 to 74 Years | 0 (0.0%) | 0 (0.0%) |
| 75 Years and over | 1 (20.0%) | 1 (16.7%) |
Disability Class: Ambulatory Difficulty
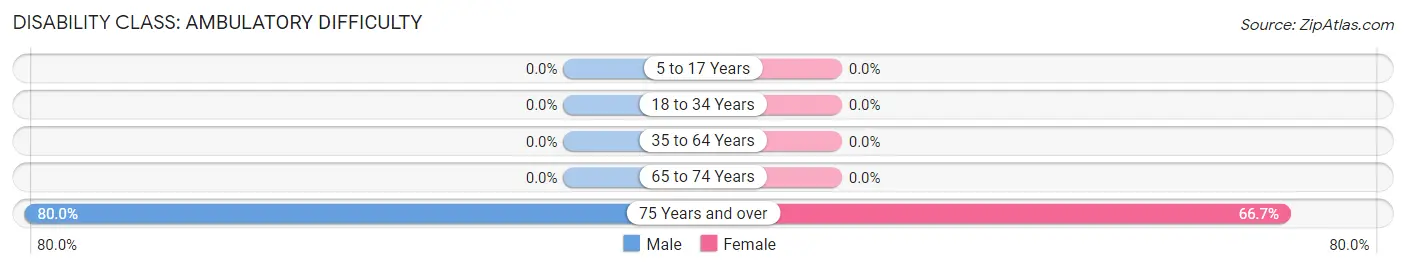
| Age Bracket | Male | Female |
| 5 to 17 Years | 0 (0.0%) | 0 (0.0%) |
| 18 to 34 Years | 0 (0.0%) | 0 (0.0%) |
| 35 to 64 Years | 0 (0.0%) | 0 (0.0%) |
| 65 to 74 Years | 0 (0.0%) | 0 (0.0%) |
| 75 Years and over | 4 (80.0%) | 4 (66.7%) |
Disability Class: Self-Care Difficulty
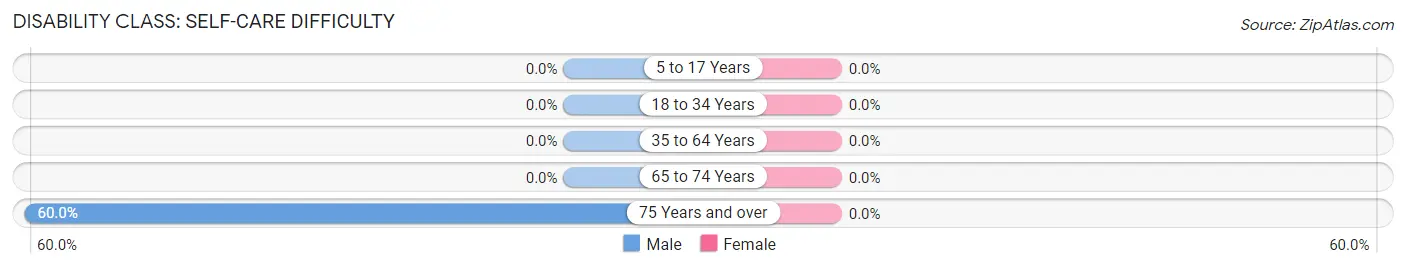
| Age Bracket | Male | Female |
| 5 to 17 Years | 0 (0.0%) | 0 (0.0%) |
| 18 to 34 Years | 0 (0.0%) | 0 (0.0%) |
| 35 to 64 Years | 0 (0.0%) | 0 (0.0%) |
| 65 to 74 Years | 0 (0.0%) | 0 (0.0%) |
| 75 Years and over | 3 (60.0%) | 0 (0.0%) |
Technology Access in Hazard
Computing Device Access in Hazard
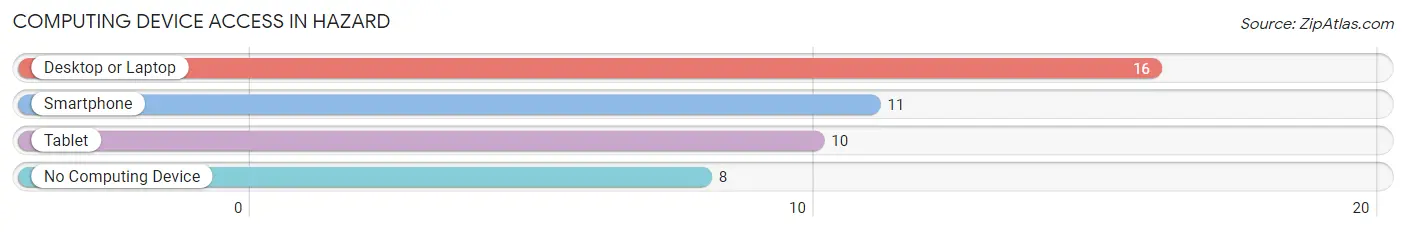
| Device Type | # Households | % Households |
| Desktop or Laptop | 16 | 64.0% |
| Smartphone | 11 | 44.0% |
| Tablet | 10 | 40.0% |
| No Computing Device | 8 | 32.0% |
| Total | 25 | 100.0% |
Internet Access in Hazard
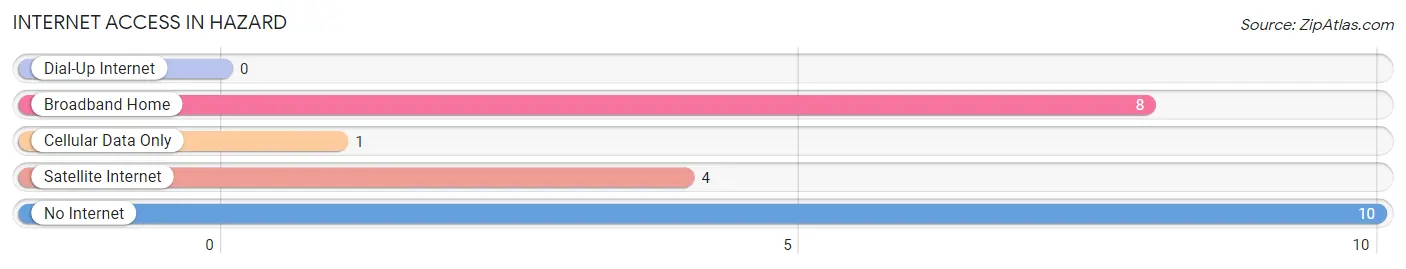
| Internet Type | # Households | % Households |
| Dial-Up Internet | 0 | 0.0% |
| Broadband Home | 8 | 32.0% |
| Cellular Data Only | 1 | 4.0% |
| Satellite Internet | 4 | 16.0% |
| No Internet | 10 | 40.0% |
| Total | 25 | 100.0% |
Hazard Summary
Hazard, Nebraska is a small town located in the southeastern corner of the state. It is situated in the heart of the Sandhills region, an area of rolling hills and grasslands that stretches across the state. The town was founded in 1887 and has a population of just over 500 people.
Hazard is located in the Nebraska panhandle, which is bordered by South Dakota to the north and Wyoming to the west. The town is situated in the middle of the Sandhills region, which is characterized by rolling hills and grasslands. The area is known for its rich soil and abundant wildlife. The town is also located near the Niobrara River, which provides a source of recreation for the locals.
The economy of Hazard is largely based on agriculture. The town is home to several farms and ranches, which produce a variety of crops and livestock. The town also has a few small businesses, including a grocery store, a hardware store, and a few restaurants.
The demographics of Hazard are largely homogeneous. The majority of the population is white, with a small percentage of African Americans and Hispanics. The median household income is around $35,000, and the median age is around 40 years old.
Hazard is served by the Hazard-Dundy County School District, which consists of two elementary schools, one middle school, and one high school. The town also has a public library and a few churches.
Hazard is a small town with a rich history and a unique culture. The town is known for its friendly people and its laid-back atmosphere. It is a great place to live and raise a family, and it is a great place to visit.
Common Questions
What is Per Capita Income in Hazard?
Per Capita income in Hazard is $29,959.
What is the Median Household income in Hazard?
Median Household Income in Hazard is $38,125.
What is Income or Wage Gap in Hazard?
Income or Wage Gap in Hazard is 47.4%.
Women in Hazard earn 52.6 cents for every dollar earned by a man.
What is Inequality or Gini Index in Hazard?
Inequality or Gini Index in Hazard is 0.44.
What is the Total Population of Hazard?
Total Population of Hazard is 49.
What is the Total Male Population of Hazard?
Total Male Population of Hazard is 30.
What is the Total Female Population of Hazard?
Total Female Population of Hazard is 19.
What is the Ratio of Males per 100 Females in Hazard?
There are 157.89 Males per 100 Females in Hazard.
What is the Ratio of Females per 100 Males in Hazard?
There are 63.33 Females per 100 Males in Hazard.
What is the Median Population Age in Hazard?
Median Population Age in Hazard is 37.3 Years.
What is the Average Family Size in Hazard
Average Family Size in Hazard is 3.3 People.
What is the Average Household Size in Hazard
Average Household Size in Hazard is 2.0 People.
How Large is the Labor Force in Hazard?
There are 14 People in the Labor Forcein in Hazard.
What is the Percentage of People in the Labor Force in Hazard?
37.8% of People are in the Labor Force in Hazard.