Naper, NE Map & Demographics
Naper Map
Naper Overview
$19,251
PER CAPITA INCOME
$32,500
AVG FAMILY INCOME
$27,083
AVG HOUSEHOLD INCOME
31.4%
WAGE / INCOME GAP [ % ]
68.6¢/ $1
WAGE / INCOME GAP [ $ ]
0.40
INEQUALITY / GINI INDEX
156
TOTAL POPULATION
88
MALE POPULATION
68
FEMALE POPULATION
129.41
MALES / 100 FEMALES
77.27
FEMALES / 100 MALES
45.0
MEDIAN AGE
3.2
AVG FAMILY SIZE
2.2
AVG HOUSEHOLD SIZE
42
LABOR FORCE [ PEOPLE ]
37.2%
PERCENT IN LABOR FORCE
Naper Zip Codes
Naper Area Codes
Income in Naper
Income Overview in Naper
Per Capita Income in Naper is $19,251, while median incomes of families and households are $32,500 and $27,083 respectively.
| Characteristic | Number | Measure |
| Per Capita Income | 156 | $19,251 |
| Median Family Income | 36 | $32,500 |
| Mean Family Income | 36 | $55,547 |
| Median Household Income | 71 | $27,083 |
| Mean Household Income | 71 | $43,466 |
| Income Deficit | 36 | $0 |
| Wage / Income Gap (%) | 156 | 31.41% |
| Wage / Income Gap ($) | 156 | 68.59¢ per $1 |
| Gini / Inequality Index | 156 | 0.40 |
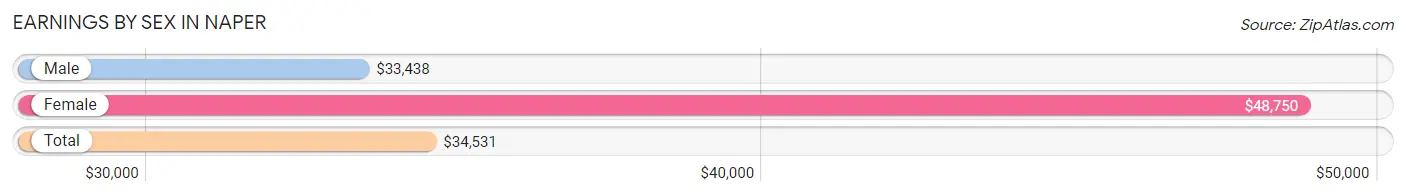
Earnings by Sex in Naper
Average Earnings in Naper are $34,531, $33,438 for men and $48,750 for women, a difference of 31.4%.
| Sex | Number | Average Earnings |
| Male | 30 (69.8%) | $33,438 |
| Female | 13 (30.2%) | $48,750 |
| Total | 43 (100.0%) | $34,531 |
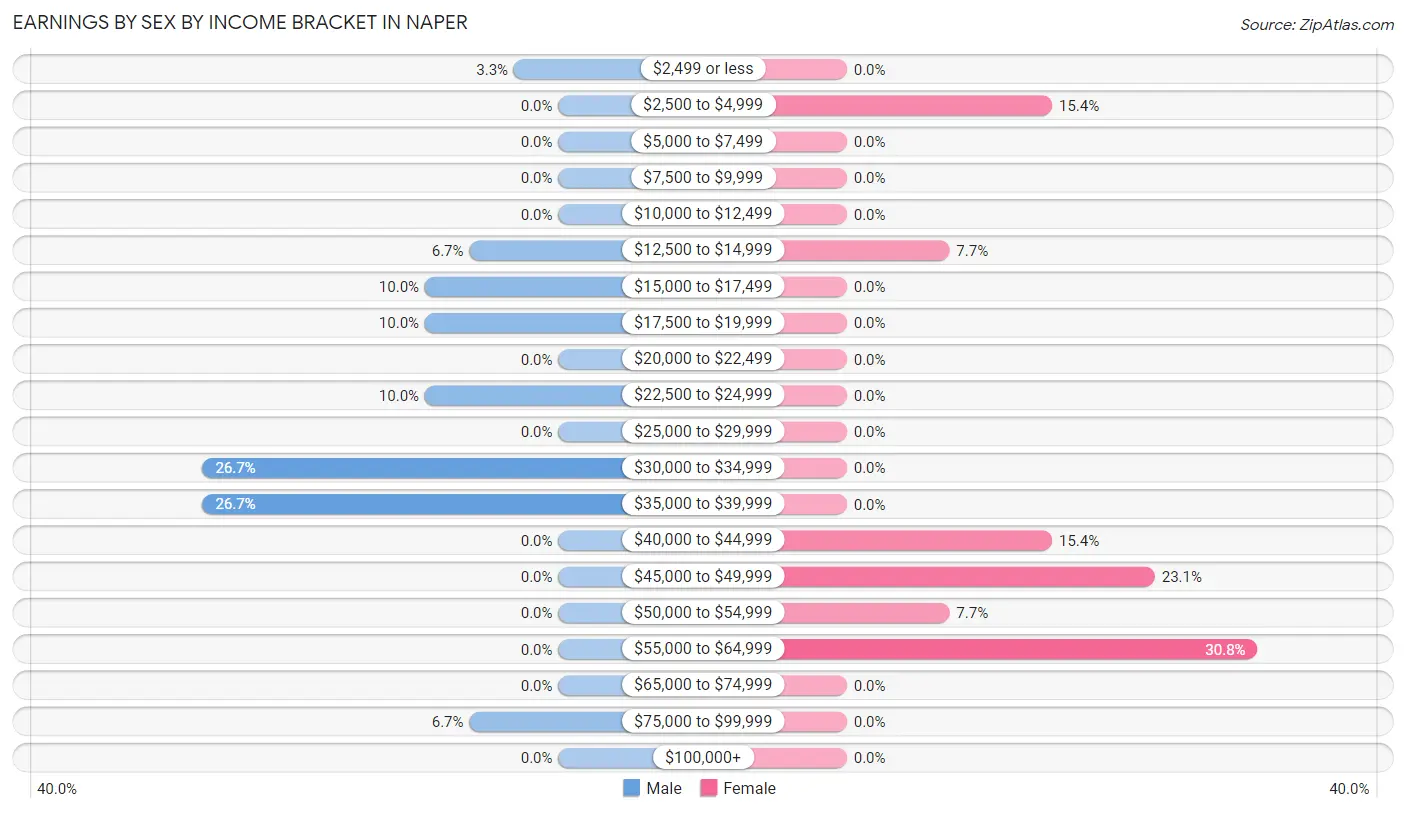
Earnings by Sex by Income Bracket in Naper
The most common earnings brackets in Naper are $30,000 to $34,999 for men (8 | 26.7%) and $55,000 to $64,999 for women (4 | 30.8%).
| Income | Male | Female |
| $2,499 or less | 1 (3.3%) | 0 (0.0%) |
| $2,500 to $4,999 | 0 (0.0%) | 2 (15.4%) |
| $5,000 to $7,499 | 0 (0.0%) | 0 (0.0%) |
| $7,500 to $9,999 | 0 (0.0%) | 0 (0.0%) |
| $10,000 to $12,499 | 0 (0.0%) | 0 (0.0%) |
| $12,500 to $14,999 | 2 (6.7%) | 1 (7.7%) |
| $15,000 to $17,499 | 3 (10.0%) | 0 (0.0%) |
| $17,500 to $19,999 | 3 (10.0%) | 0 (0.0%) |
| $20,000 to $22,499 | 0 (0.0%) | 0 (0.0%) |
| $22,500 to $24,999 | 3 (10.0%) | 0 (0.0%) |
| $25,000 to $29,999 | 0 (0.0%) | 0 (0.0%) |
| $30,000 to $34,999 | 8 (26.7%) | 0 (0.0%) |
| $35,000 to $39,999 | 8 (26.7%) | 0 (0.0%) |
| $40,000 to $44,999 | 0 (0.0%) | 2 (15.4%) |
| $45,000 to $49,999 | 0 (0.0%) | 3 (23.1%) |
| $50,000 to $54,999 | 0 (0.0%) | 1 (7.7%) |
| $55,000 to $64,999 | 0 (0.0%) | 4 (30.8%) |
| $65,000 to $74,999 | 0 (0.0%) | 0 (0.0%) |
| $75,000 to $99,999 | 2 (6.7%) | 0 (0.0%) |
| $100,000+ | 0 (0.0%) | 0 (0.0%) |
| Total | 30 (100.0%) | 13 (100.0%) |
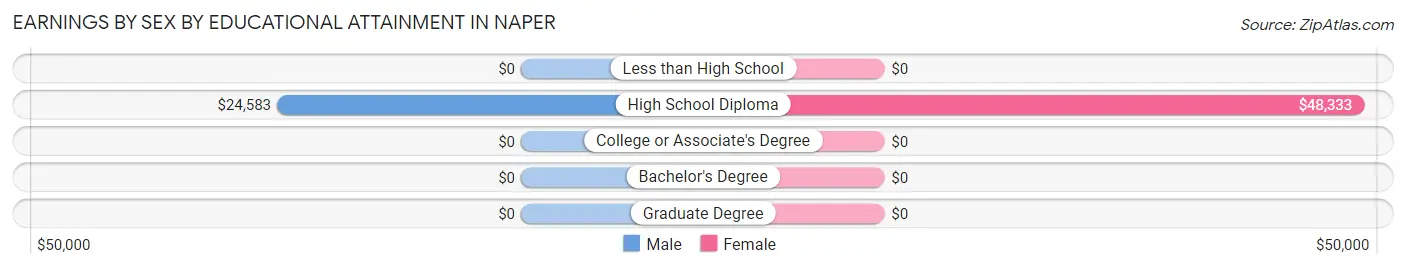
Earnings by Sex by Educational Attainment in Naper
Average earnings in Naper are $33,438 for men and $48,750 for women, a difference of 31.4%. Men with an educational attainment of high school diploma enjoy the highest average annual earnings of $24,583, while those with high school diploma education earn the least with $24,583. Women with an educational attainment of high school diploma earn the most with the average annual earnings of $48,333, while those with high school diploma education have the smallest earnings of $48,333.
| Educational Attainment | Male Income | Female Income |
| Less than High School | - | - |
| High School Diploma | $24,583 | $48,333 |
| College or Associate's Degree | - | - |
| Bachelor's Degree | - | - |
| Graduate Degree | - | - |
| Total | $33,438 | $48,750 |
Family Income in Naper
Family Income Brackets in Naper
According to the Naper family income data, there are 13 families falling into the $25,000 to $34,999 income range, which is the most common income bracket and makes up 36.1% of all families.
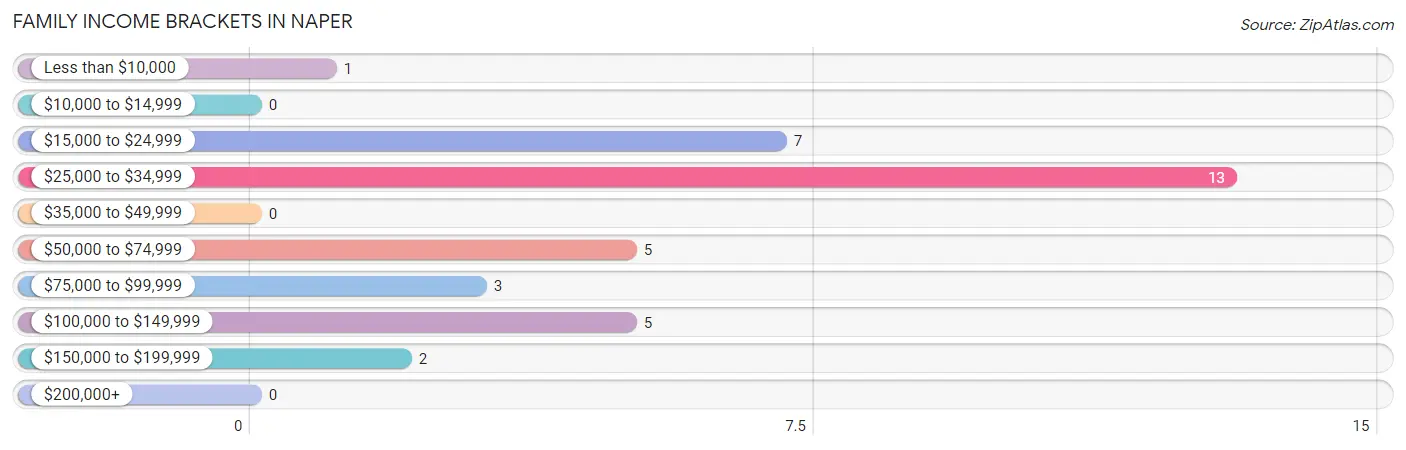
| Income Bracket | # Families | % Families |
| Less than $10,000 | 1 | 2.8% |
| $10,000 to $14,999 | 0 | 0.0% |
| $15,000 to $24,999 | 7 | 19.4% |
| $25,000 to $34,999 | 13 | 36.1% |
| $35,000 to $49,999 | 0 | 0.0% |
| $50,000 to $74,999 | 5 | 13.9% |
| $75,000 to $99,999 | 3 | 8.3% |
| $100,000 to $149,999 | 5 | 13.9% |
| $150,000 to $199,999 | 2 | 5.6% |
| $200,000+ | 0 | 0.0% |
Family Income by Famaliy Size in Naper
2-person families (27 | 75.0%) account for the highest median family income in Naper with $30,313 per family, while 2-person families (27 | 75.0%) have the highest median income of $15,156 per family member.
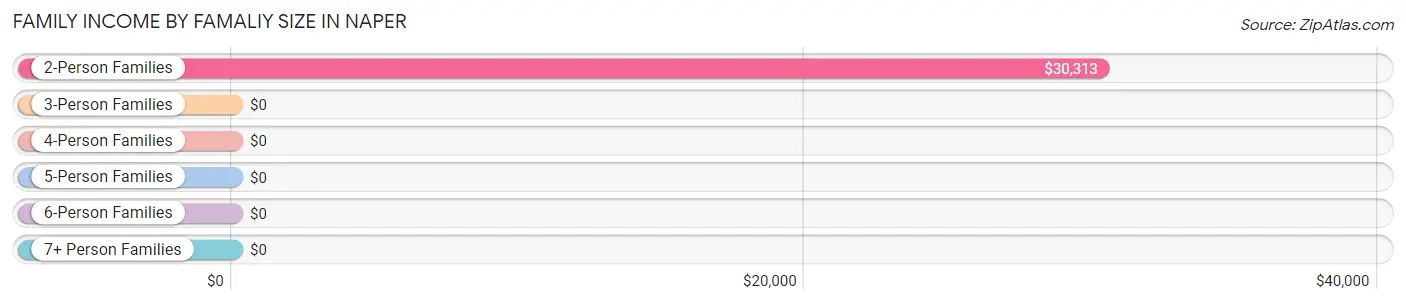
| Income Bracket | # Families | Median Income |
| 2-Person Families | 27 (75.0%) | $30,313 |
| 3-Person Families | 1 (2.8%) | $0 |
| 4-Person Families | 0 (0.0%) | $0 |
| 5-Person Families | 3 (8.3%) | $0 |
| 6-Person Families | 0 (0.0%) | $0 |
| 7+ Person Families | 5 (13.9%) | $0 |
| Total | 36 (100.0%) | $32,500 |
Family Income by Number of Earners in Naper
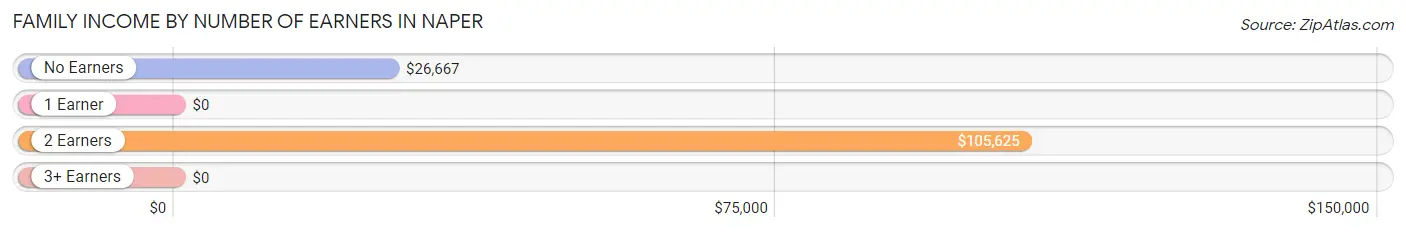
| Number of Earners | # Families | Median Income |
| No Earners | 18 (50.0%) | $26,667 |
| 1 Earner | 5 (13.9%) | $0 |
| 2 Earners | 13 (36.1%) | $105,625 |
| 3+ Earners | 0 (0.0%) | $0 |
| Total | 36 (100.0%) | $32,500 |
Household Income in Naper
Household Income Brackets in Naper
With 24 households falling in the category, the $15,000 to $24,999 income range is the most frequent in Naper, accounting for 33.8% of all households.
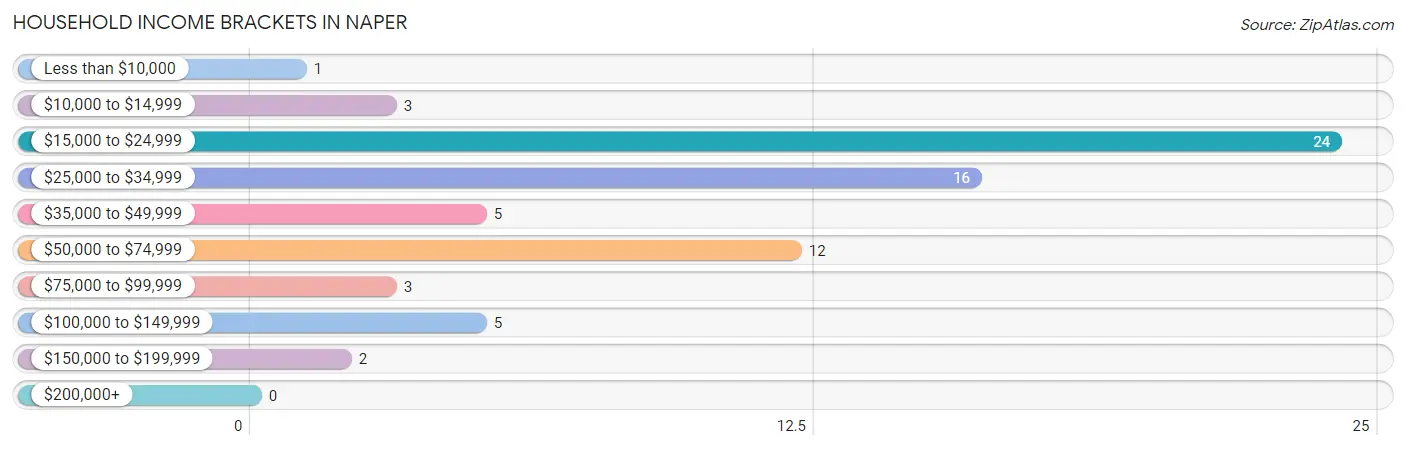
| Income Bracket | # Households | % Households |
| Less than $10,000 | 1 | 1.4% |
| $10,000 to $14,999 | 3 | 4.2% |
| $15,000 to $24,999 | 24 | 33.8% |
| $25,000 to $34,999 | 16 | 22.5% |
| $35,000 to $49,999 | 5 | 7.0% |
| $50,000 to $74,999 | 12 | 16.9% |
| $75,000 to $99,999 | 3 | 4.2% |
| $100,000 to $149,999 | 5 | 7.0% |
| $150,000 to $199,999 | 2 | 2.8% |
| $200,000+ | 0 | 0.0% |
Household Income by Householder Age in Naper
The median household income in Naper is $27,083, with the highest median household income of $36,250 found in the 25 to 44 years age bracket for the primary householder. A total of 14 households (19.7%) fall into this category.
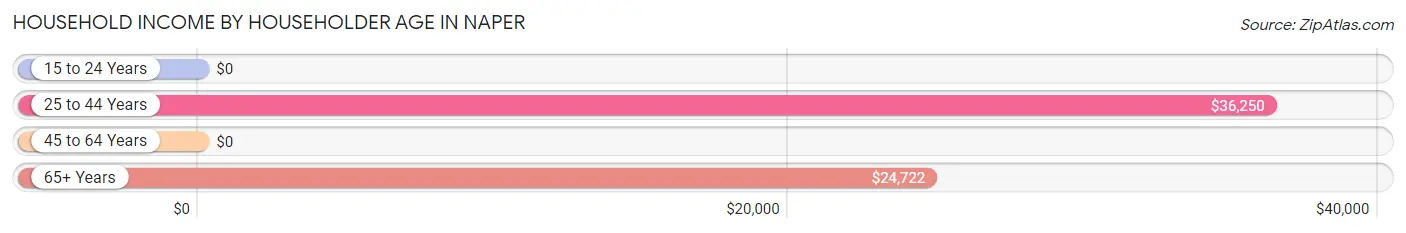
| Income Bracket | # Households | Median Income |
| 15 to 24 Years | 0 (0.0%) | $0 |
| 25 to 44 Years | 14 (19.7%) | $36,250 |
| 45 to 64 Years | 15 (21.1%) | $0 |
| 65+ Years | 42 (59.2%) | $24,722 |
| Total | 71 (100.0%) | $27,083 |
Poverty in Naper
Income Below Poverty by Sex and Age in Naper
With 5.7% poverty level for males and 20.6% for females among the residents of Naper, 15 year old males and 35 to 44 year old females are the most vulnerable to poverty, with 1 males (100.0%) and 4 females (57.1%) in their respective age groups living below the poverty level.
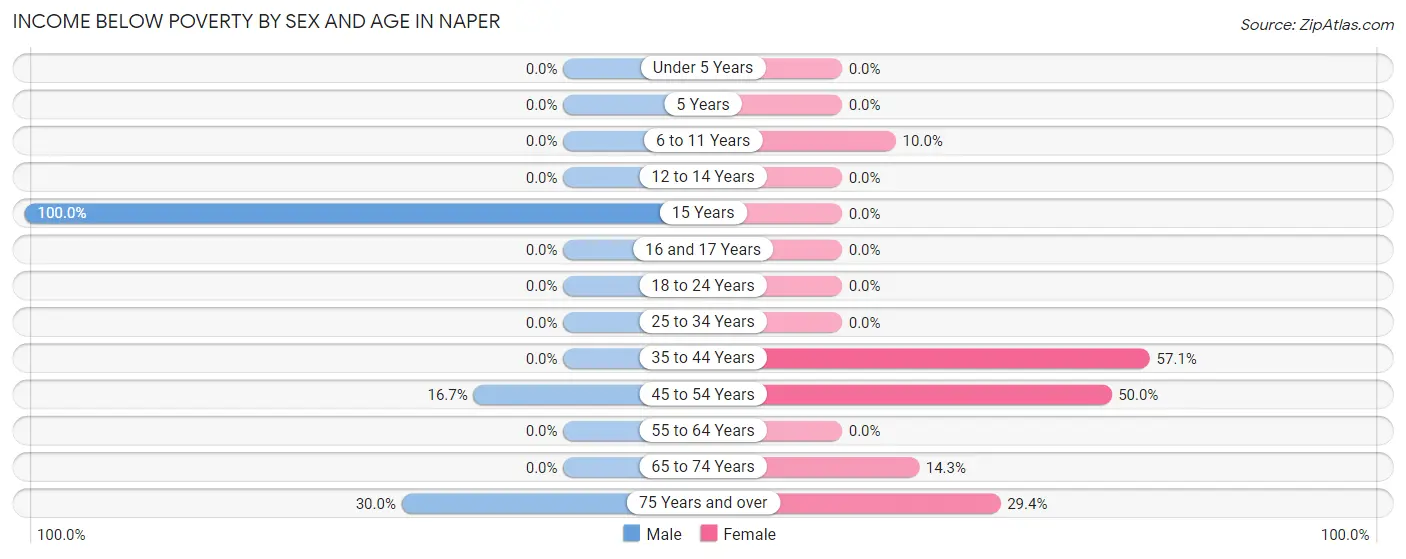
| Age Bracket | Male | Female |
| Under 5 Years | 0 (0.0%) | 0 (0.0%) |
| 5 Years | 0 (0.0%) | 0 (0.0%) |
| 6 to 11 Years | 0 (0.0%) | 1 (10.0%) |
| 12 to 14 Years | 0 (0.0%) | 0 (0.0%) |
| 15 Years | 1 (100.0%) | 0 (0.0%) |
| 16 and 17 Years | 0 (0.0%) | 0 (0.0%) |
| 18 to 24 Years | 0 (0.0%) | 0 (0.0%) |
| 25 to 34 Years | 0 (0.0%) | 0 (0.0%) |
| 35 to 44 Years | 0 (0.0%) | 4 (57.1%) |
| 45 to 54 Years | 1 (16.7%) | 1 (50.0%) |
| 55 to 64 Years | 0 (0.0%) | 0 (0.0%) |
| 65 to 74 Years | 0 (0.0%) | 3 (14.3%) |
| 75 Years and over | 3 (30.0%) | 5 (29.4%) |
| Total | 5 (5.7%) | 14 (20.6%) |
Income Above Poverty by Sex and Age in Naper
According to the poverty statistics in Naper, males aged under 5 years and females aged 12 to 14 years are the age groups that are most secure financially, with 100.0% of males and 100.0% of females in these age groups living above the poverty line.
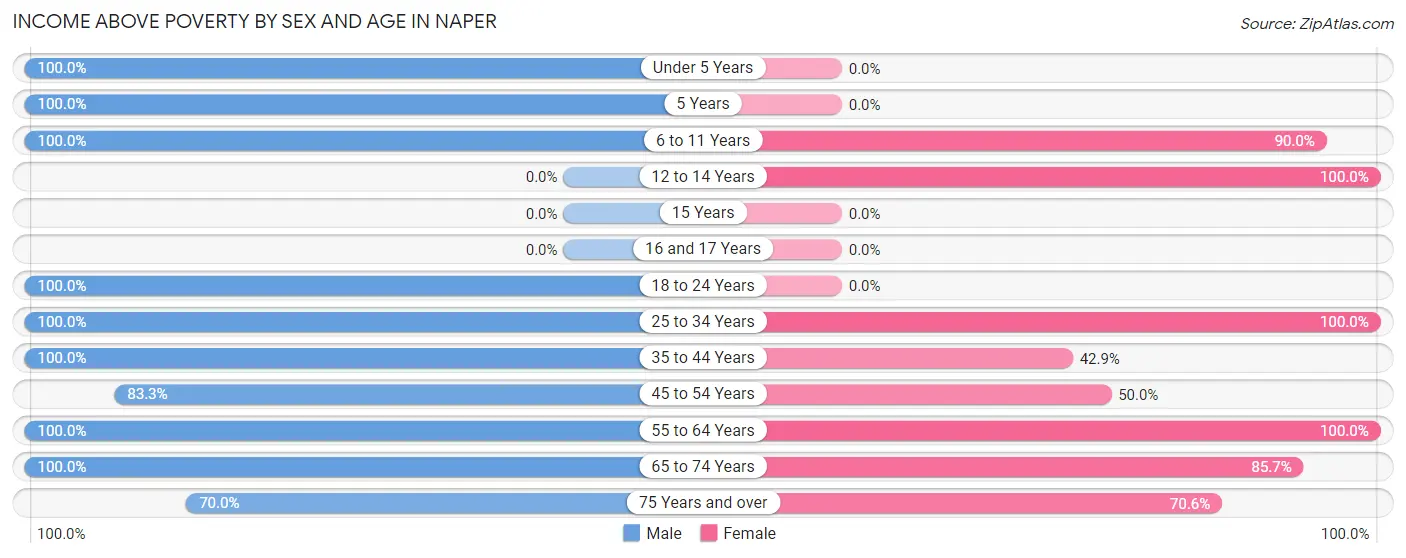
| Age Bracket | Male | Female |
| Under 5 Years | 8 (100.0%) | 0 (0.0%) |
| 5 Years | 9 (100.0%) | 0 (0.0%) |
| 6 to 11 Years | 11 (100.0%) | 9 (90.0%) |
| 12 to 14 Years | 0 (0.0%) | 4 (100.0%) |
| 15 Years | 0 (0.0%) | 0 (0.0%) |
| 16 and 17 Years | 0 (0.0%) | 0 (0.0%) |
| 18 to 24 Years | 5 (100.0%) | 0 (0.0%) |
| 25 to 34 Years | 9 (100.0%) | 5 (100.0%) |
| 35 to 44 Years | 9 (100.0%) | 3 (42.9%) |
| 45 to 54 Years | 5 (83.3%) | 1 (50.0%) |
| 55 to 64 Years | 11 (100.0%) | 2 (100.0%) |
| 65 to 74 Years | 9 (100.0%) | 18 (85.7%) |
| 75 Years and over | 7 (70.0%) | 12 (70.6%) |
| Total | 83 (94.3%) | 54 (79.4%) |
Income Below Poverty Among Married-Couple Families in Naper
The poverty statistics for married-couple families in Naper show that 24.0% or 6 of the total 25 families live below the poverty line. Families with 1 or 2 children have the highest poverty rate of 100.0%, comprising of 1 families. On the other hand, families with 3 or 4 children have the lowest poverty rate of 0.0%, which includes 0 families.
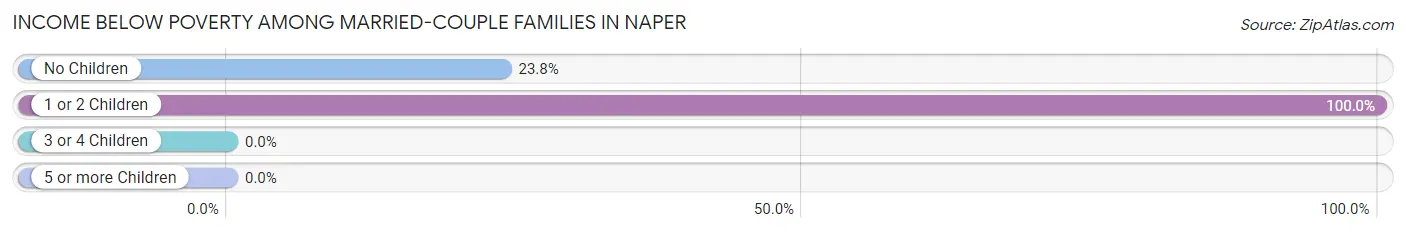
| Children | Above Poverty | Below Poverty |
| No Children | 16 (76.2%) | 5 (23.8%) |
| 1 or 2 Children | 0 (0.0%) | 1 (100.0%) |
| 3 or 4 Children | 3 (100.0%) | 0 (0.0%) |
| 5 or more Children | 0 (0.0%) | 0 (0.0%) |
| Total | 19 (76.0%) | 6 (24.0%) |
Income Below Poverty Among Single-Parent Households in Naper
| Children | Single Father | Single Mother |
| No Children | 0 (0.0%) | 0 (0.0%) |
| 1 or 2 Children | 0 (0.0%) | 0 (0.0%) |
| 3 or 4 Children | 0 (0.0%) | 0 (0.0%) |
| 5 or more Children | 0 (0.0%) | 0 (0.0%) |
| Total | 0 (0.0%) | 0 (0.0%) |
Income Below Poverty Among Married-Couple vs Single-Parent Households in Naper
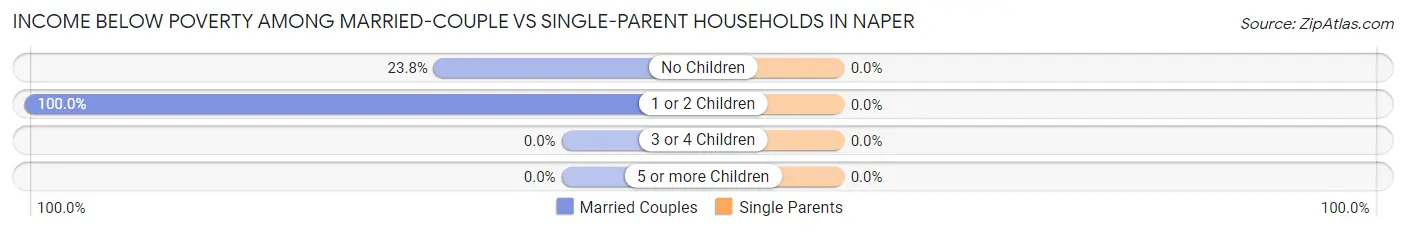
| Children | Married-Couple Families | Single-Parent Households |
| No Children | 5 (23.8%) | 0 (0.0%) |
| 1 or 2 Children | 1 (100.0%) | 0 (0.0%) |
| 3 or 4 Children | 0 (0.0%) | 0 (0.0%) |
| 5 or more Children | 0 (0.0%) | 0 (0.0%) |
| Total | 6 (24.0%) | 0 (0.0%) |
Race in Naper
The most populous races in Naper are White / Caucasian (115 | 73.7%), Native / Alaskan (40 | 25.6%), and Hispanic or Latino (1 | 0.6%).
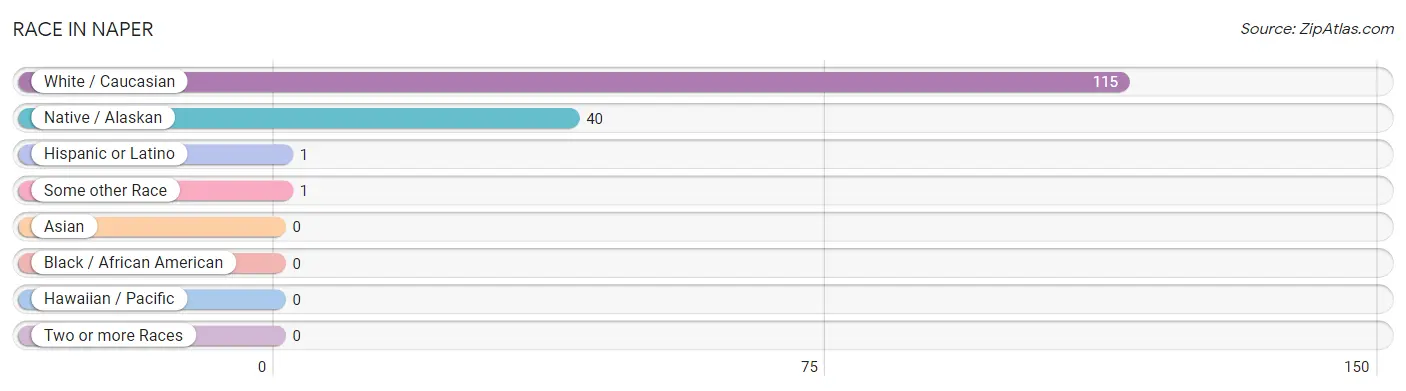
| Race | # Population | % Population |
| Asian | 0 | 0.0% |
| Black / African American | 0 | 0.0% |
| Hawaiian / Pacific | 0 | 0.0% |
| Hispanic or Latino | 1 | 0.6% |
| Native / Alaskan | 40 | 25.6% |
| White / Caucasian | 115 | 73.7% |
| Two or more Races | 0 | 0.0% |
| Some other Race | 1 | 0.6% |
| Total | 156 | 100.0% |
Ancestry in Naper
The most populous ancestries reported in Naper are German (71 | 45.5%), Sioux (40 | 25.6%), Irish (33 | 21.1%), Russian (11 | 7.0%), and Norwegian (9 | 5.8%), together accounting for 105.1% of all Naper residents.
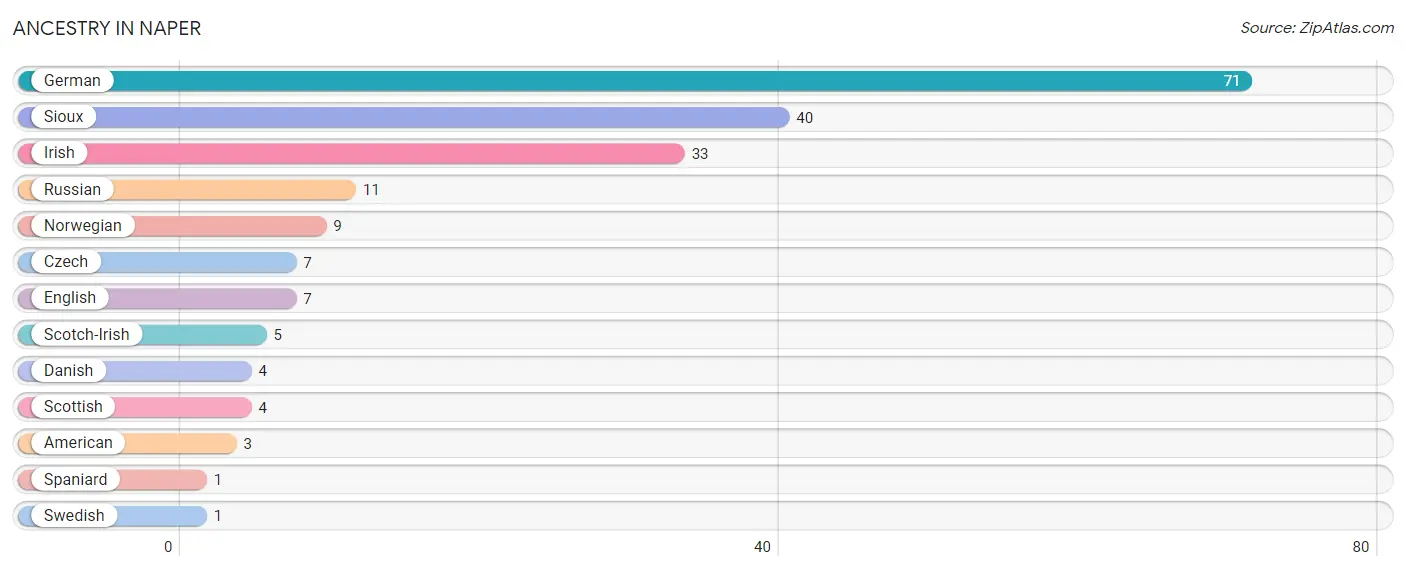
| Ancestry | # Population | % Population |
| American | 3 | 1.9% |
| Czech | 7 | 4.5% |
| Danish | 4 | 2.6% |
| English | 7 | 4.5% |
| German | 71 | 45.5% |
| Irish | 33 | 21.1% |
| Norwegian | 9 | 5.8% |
| Russian | 11 | 7.0% |
| Scotch-Irish | 5 | 3.2% |
| Scottish | 4 | 2.6% |
| Sioux | 40 | 25.6% |
| Spaniard | 1 | 0.6% |
| Swedish | 1 | 0.6% | View All 13 Rows |
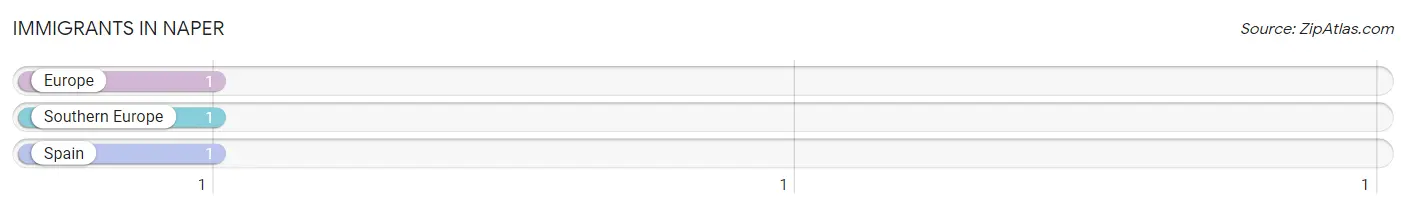
Immigrants in Naper
The most numerous immigrant groups reported in Naper came from Europe (1 | 0.6%), Southern Europe (1 | 0.6%), and Spain (1 | 0.6%), together accounting for 1.9% of all Naper residents.
| Immigration Origin | # Population | % Population |
| Europe | 1 | 0.6% |
| Southern Europe | 1 | 0.6% |
| Spain | 1 | 0.6% | View All 3 Rows |
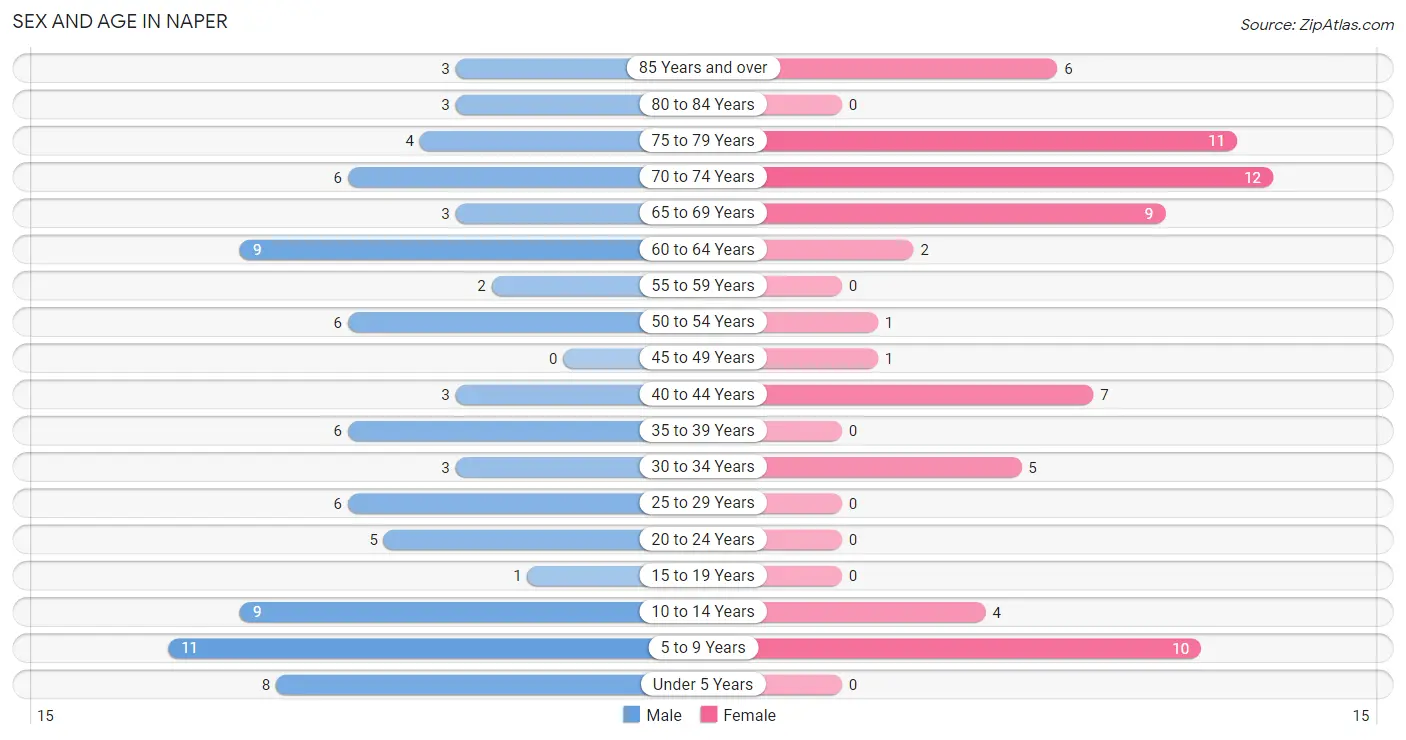
Sex and Age in Naper
Sex and Age in Naper
The most populous age groups in Naper are 5 to 9 Years (11 | 12.5%) for men and 70 to 74 Years (12 | 17.6%) for women.
| Age Bracket | Male | Female |
| Under 5 Years | 8 (9.1%) | 0 (0.0%) |
| 5 to 9 Years | 11 (12.5%) | 10 (14.7%) |
| 10 to 14 Years | 9 (10.2%) | 4 (5.9%) |
| 15 to 19 Years | 1 (1.1%) | 0 (0.0%) |
| 20 to 24 Years | 5 (5.7%) | 0 (0.0%) |
| 25 to 29 Years | 6 (6.8%) | 0 (0.0%) |
| 30 to 34 Years | 3 (3.4%) | 5 (7.3%) |
| 35 to 39 Years | 6 (6.8%) | 0 (0.0%) |
| 40 to 44 Years | 3 (3.4%) | 7 (10.3%) |
| 45 to 49 Years | 0 (0.0%) | 1 (1.5%) |
| 50 to 54 Years | 6 (6.8%) | 1 (1.5%) |
| 55 to 59 Years | 2 (2.3%) | 0 (0.0%) |
| 60 to 64 Years | 9 (10.2%) | 2 (2.9%) |
| 65 to 69 Years | 3 (3.4%) | 9 (13.2%) |
| 70 to 74 Years | 6 (6.8%) | 12 (17.6%) |
| 75 to 79 Years | 4 (4.5%) | 11 (16.2%) |
| 80 to 84 Years | 3 (3.4%) | 0 (0.0%) |
| 85 Years and over | 3 (3.4%) | 6 (8.8%) |
| Total | 88 (100.0%) | 68 (100.0%) |
Families and Households in Naper
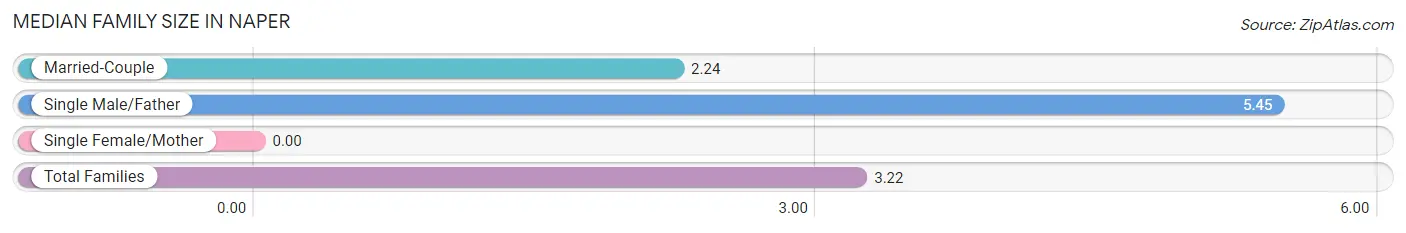
Median Family Size in Naper
| Family Type | # Families | Family Size |
| Married-Couple | 25 (69.4%) | 2.24 |
| Single Male/Father | 11 (30.6%) | 5.45 |
| Single Female/Mother | 0 (0.0%) | - |
| Total Families | 36 (100.0%) | 3.22 |
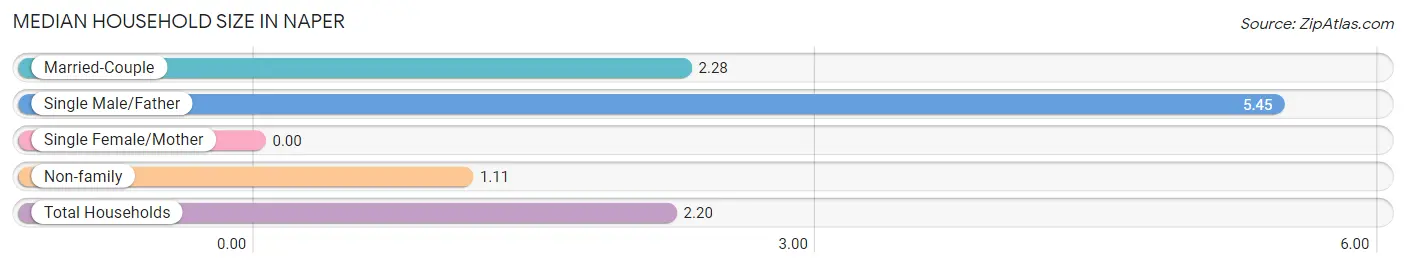
Median Household Size in Naper
| Household Type | # Households | Household Size |
| Married-Couple | 25 (35.2%) | 2.28 |
| Single Male/Father | 11 (15.5%) | 5.45 |
| Single Female/Mother | 0 (0.0%) | - |
| Non-family | 35 (49.3%) | 1.11 |
| Total Households | 71 (100.0%) | 2.20 |
Household Size by Marriage Status in Naper
Out of a total of 71 households in Naper, 36 (50.7%) are family households, while 35 (49.3%) are nonfamily households. The most numerous type of family households are 2-person households, comprising 27, and the most common type of nonfamily households are 1-person households, comprising 32.
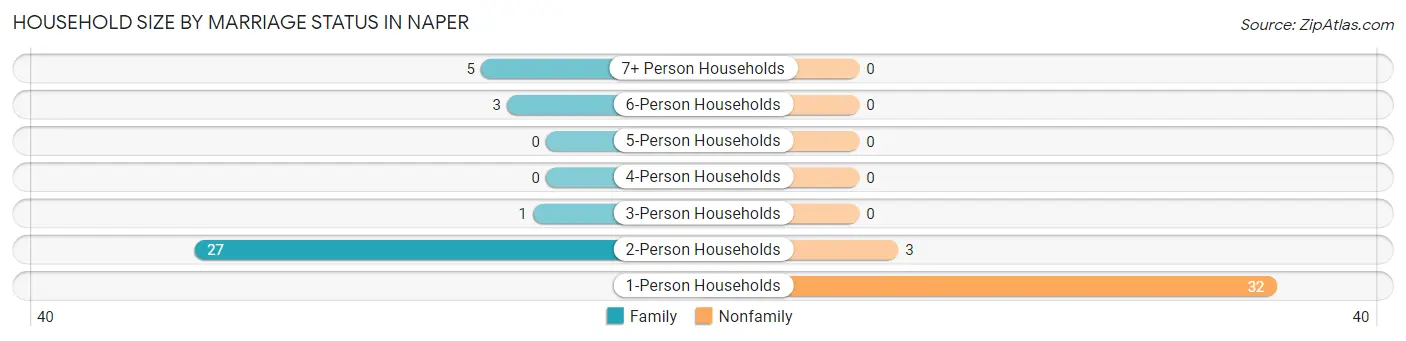
| Household Size | Family Households | Nonfamily Households |
| 1-Person Households | - | 32 (45.1%) |
| 2-Person Households | 27 (38.0%) | 3 (4.2%) |
| 3-Person Households | 1 (1.4%) | 0 (0.0%) |
| 4-Person Households | 0 (0.0%) | 0 (0.0%) |
| 5-Person Households | 0 (0.0%) | 0 (0.0%) |
| 6-Person Households | 3 (4.2%) | 0 (0.0%) |
| 7+ Person Households | 5 (7.0%) | 0 (0.0%) |
| Total | 36 (50.7%) | 35 (49.3%) |
Female Fertility in Naper
Fertility by Age in Naper
| Age Bracket | Women with Births | Births / 1,000 Women |
| 15 to 19 years | 0 (0.0%) | 0.0 |
| 20 to 34 years | 0 (0.0%) | 0.0 |
| 35 to 50 years | 0 (0.0%) | 0.0 |
| Total | 0 (0.0%) | 0.0 |
Fertility by Age by Marriage Status in Naper
| Age Bracket | Married | Unmarried |
| 15 to 19 years | 0 (0.0%) | 0 (0.0%) |
| 20 to 34 years | 0 (0.0%) | 0 (0.0%) |
| 35 to 50 years | 0 (0.0%) | 0 (0.0%) |
| Total | 0 (0.0%) | 0 (0.0%) |
Fertility by Education in Naper
| Educational Attainment | Women with Births | Births / 1,000 Women |
| Less than High School | 0 (0.0%) | 0.0 |
| High School Diploma | 0 (0.0%) | 0.0 |
| College or Associate's Degree | 0 (0.0%) | 0.0 |
| Bachelor's Degree | 0 (0.0%) | 0.0 |
| Graduate Degree | 0 (0.0%) | 0.0 |
| Total | 0 (0.0%) | 0.0 |
Fertility by Education by Marriage Status in Naper
| Educational Attainment | Married | Unmarried |
| Less than High School | 0 (0.0%) | 0 (0.0%) |
| High School Diploma | 0 (0.0%) | 0 (0.0%) |
| College or Associate's Degree | 0 (0.0%) | 0 (0.0%) |
| Bachelor's Degree | 0 (0.0%) | 0 (0.0%) |
| Graduate Degree | 0 (0.0%) | 0 (0.0%) |
| Total | 0 (0.0%) | 0 (0.0%) |
Employment Characteristics in Naper
Employment by Class of Employer in Naper
Among the 42 employed individuals in Naper, private company employees (22 | 52.4%), self-employed (incorporated) (8 | 19.1%), and federal government employees (6 | 14.3%) make up the most common classes of employment.
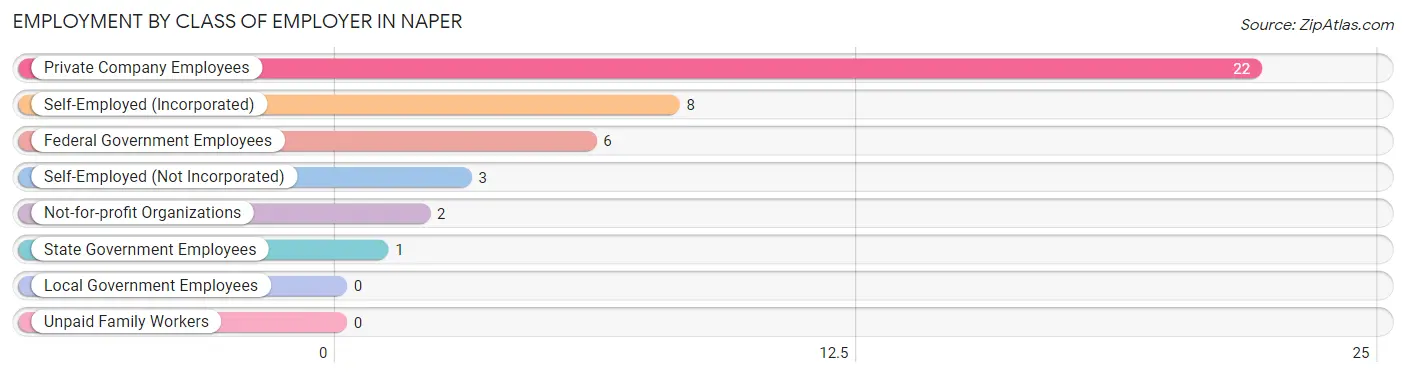
| Employer Class | # Employees | % Employees |
| Private Company Employees | 22 | 52.4% |
| Self-Employed (Incorporated) | 8 | 19.1% |
| Self-Employed (Not Incorporated) | 3 | 7.1% |
| Not-for-profit Organizations | 2 | 4.8% |
| Local Government Employees | 0 | 0.0% |
| State Government Employees | 1 | 2.4% |
| Federal Government Employees | 6 | 14.3% |
| Unpaid Family Workers | 0 | 0.0% |
| Total | 42 | 100.0% |
Employment Status by Age in Naper
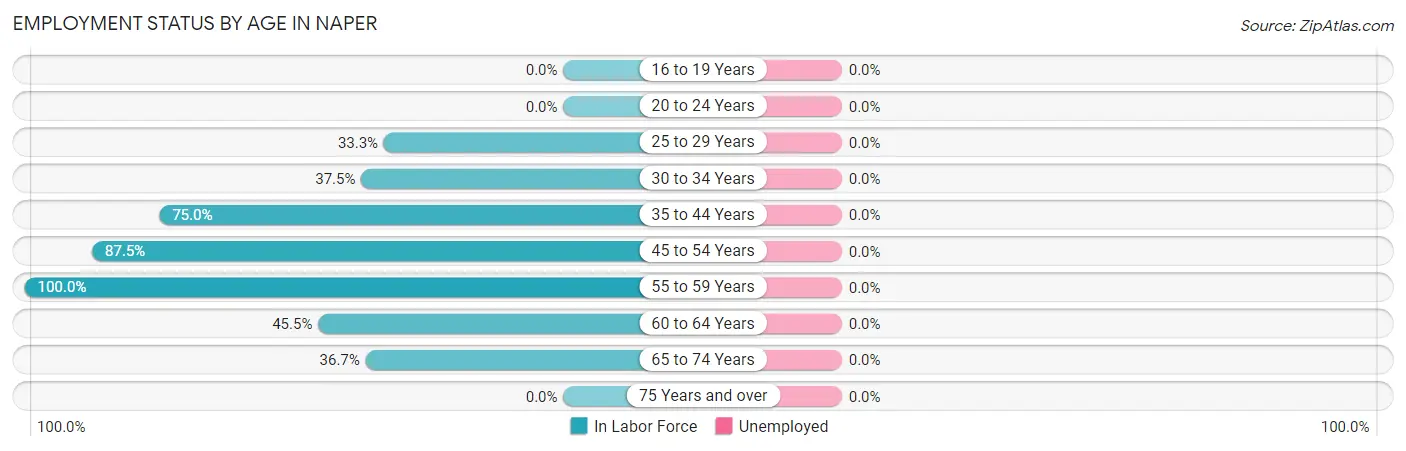
| Age Bracket | In Labor Force | Unemployed |
| 16 to 19 Years | 0 (0.0%) | 0 (0.0%) |
| 20 to 24 Years | 0 (0.0%) | 0 (0.0%) |
| 25 to 29 Years | 2 (33.3%) | 0 (0.0%) |
| 30 to 34 Years | 3 (37.5%) | 0 (0.0%) |
| 35 to 44 Years | 12 (75.0%) | 0 (0.0%) |
| 45 to 54 Years | 7 (87.5%) | 0 (0.0%) |
| 55 to 59 Years | 2 (100.0%) | 0 (0.0%) |
| 60 to 64 Years | 5 (45.5%) | 0 (0.0%) |
| 65 to 74 Years | 11 (36.7%) | 0 (0.0%) |
| 75 Years and over | 0 (0.0%) | 0 (0.0%) |
| Total | 42 (37.2%) | 0 (0.0%) |
Employment Status by Educational Attainment in Naper
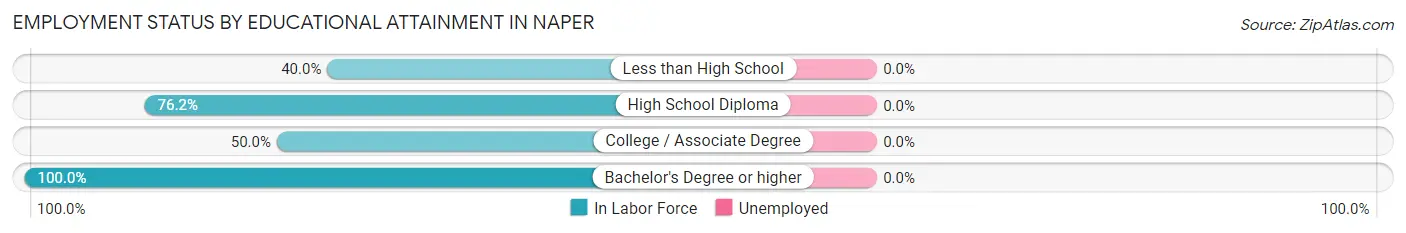
| Educational Attainment | In Labor Force | Unemployed |
| Less than High School | 6 (40.0%) | 0 (0.0%) |
| High School Diploma | 16 (76.2%) | 0 (0.0%) |
| College / Associate Degree | 6 (50.0%) | 0 (0.0%) |
| Bachelor's Degree or higher | 3 (100.0%) | 0 (0.0%) |
| Total | 31 (60.8%) | 0 (0.0%) |
Employment Occupations by Sex in Naper
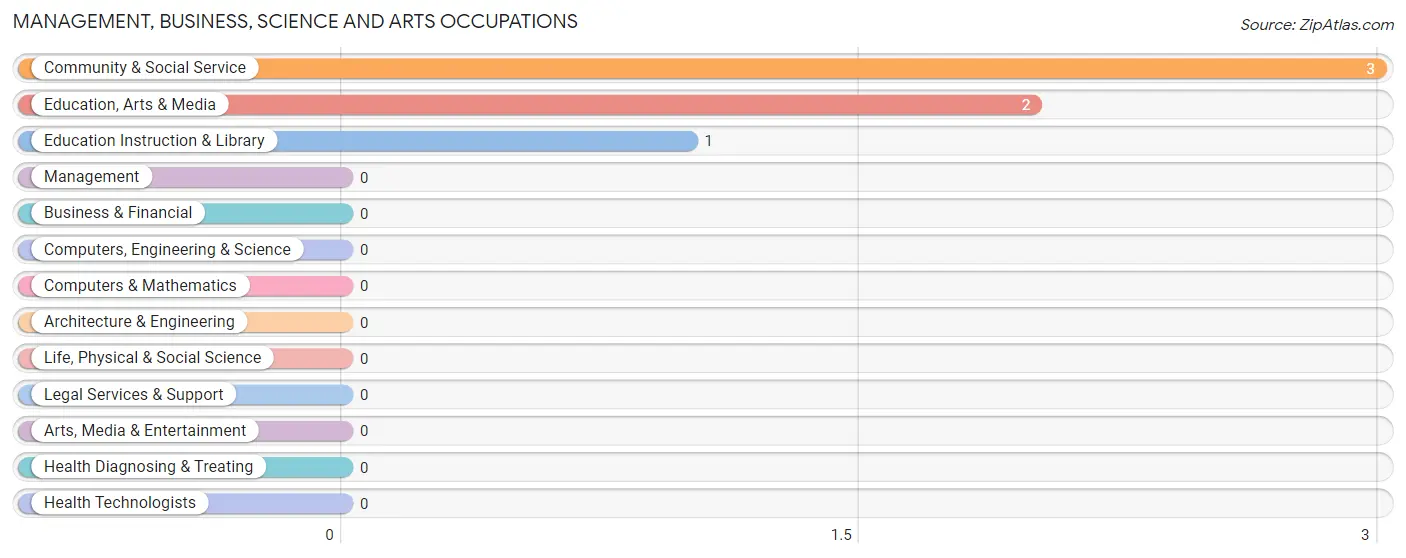
Management, Business, Science and Arts Occupations
The most common Management, Business, Science and Arts occupations in Naper are Community & Social Service (3 | 7.1%), Education, Arts & Media (2 | 4.8%), and Education Instruction & Library (1 | 2.4%).
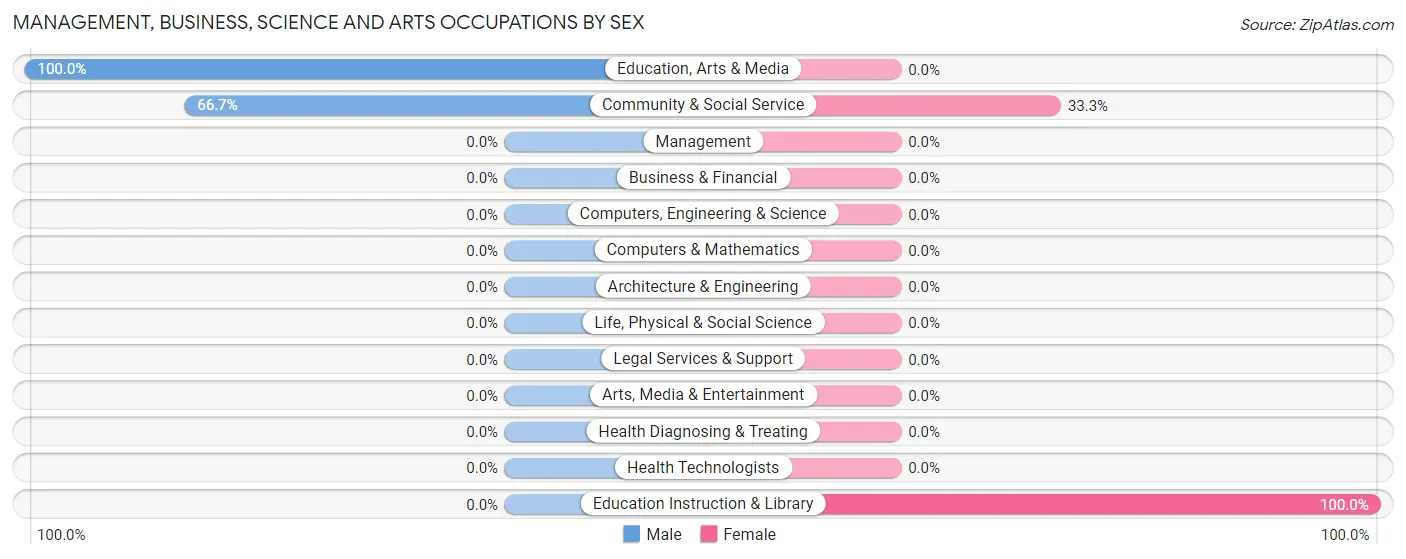
Management, Business, Science and Arts Occupations by Sex
Within the Management, Business, Science and Arts occupations in Naper, the most male-oriented occupations are Education, Arts & Media (100.0%), and Community & Social Service (66.7%), while the most female-oriented occupations are Education Instruction & Library (100.0%), and Community & Social Service (33.3%).
| Occupation | Male | Female |
| Management | 0 (0.0%) | 0 (0.0%) |
| Business & Financial | 0 (0.0%) | 0 (0.0%) |
| Computers, Engineering & Science | 0 (0.0%) | 0 (0.0%) |
| Computers & Mathematics | 0 (0.0%) | 0 (0.0%) |
| Architecture & Engineering | 0 (0.0%) | 0 (0.0%) |
| Life, Physical & Social Science | 0 (0.0%) | 0 (0.0%) |
| Community & Social Service | 2 (66.7%) | 1 (33.3%) |
| Education, Arts & Media | 2 (100.0%) | 0 (0.0%) |
| Legal Services & Support | 0 (0.0%) | 0 (0.0%) |
| Education Instruction & Library | 0 (0.0%) | 1 (100.0%) |
| Arts, Media & Entertainment | 0 (0.0%) | 0 (0.0%) |
| Health Diagnosing & Treating | 0 (0.0%) | 0 (0.0%) |
| Health Technologists | 0 (0.0%) | 0 (0.0%) |
| Total (Category) | 2 (66.7%) | 1 (33.3%) |
| Total (Overall) | 29 (69.1%) | 13 (30.9%) |
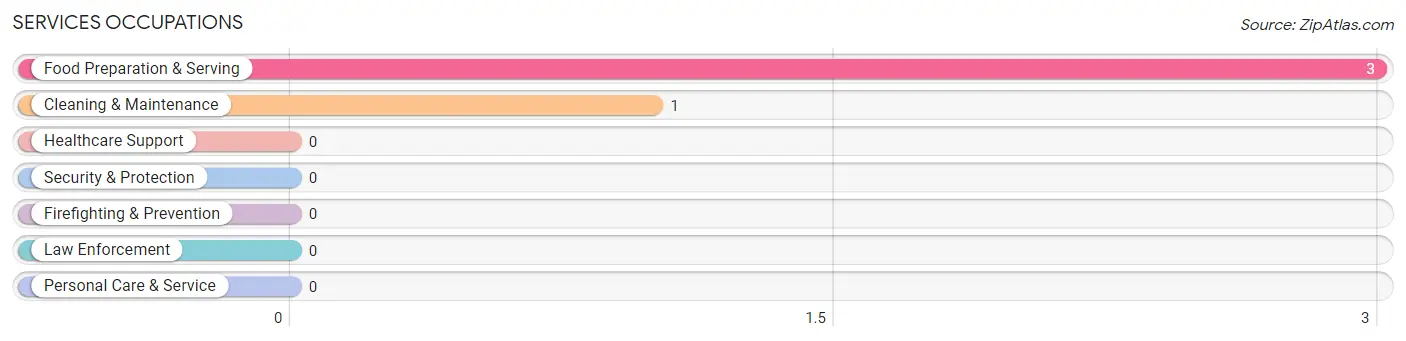
Services Occupations
The most common Services occupations in Naper are Food Preparation & Serving (3 | 7.1%), and Cleaning & Maintenance (1 | 2.4%).
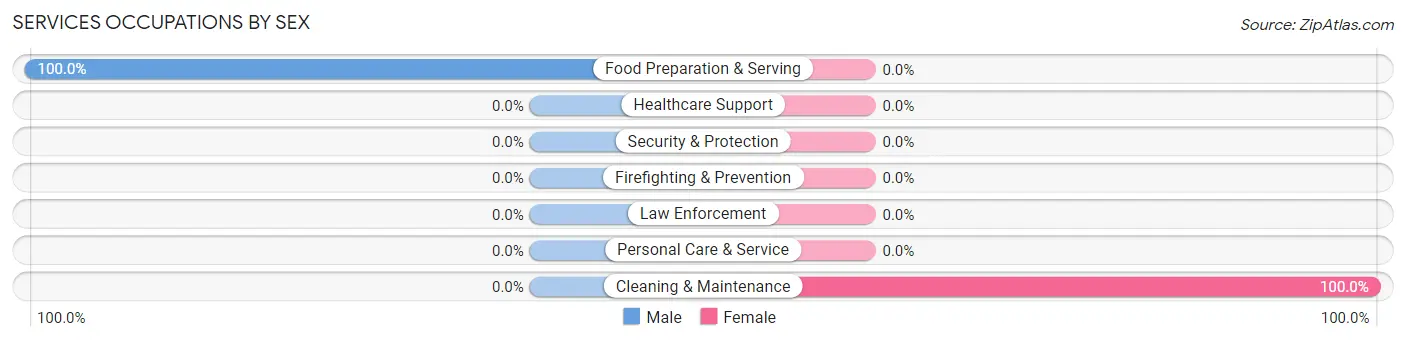
Services Occupations by Sex
| Occupation | Male | Female |
| Healthcare Support | 0 (0.0%) | 0 (0.0%) |
| Security & Protection | 0 (0.0%) | 0 (0.0%) |
| Firefighting & Prevention | 0 (0.0%) | 0 (0.0%) |
| Law Enforcement | 0 (0.0%) | 0 (0.0%) |
| Food Preparation & Serving | 3 (100.0%) | 0 (0.0%) |
| Cleaning & Maintenance | 0 (0.0%) | 1 (100.0%) |
| Personal Care & Service | 0 (0.0%) | 0 (0.0%) |
| Total (Category) | 3 (75.0%) | 1 (25.0%) |
| Total (Overall) | 29 (69.1%) | 13 (30.9%) |
Sales and Office Occupations
The most common Sales and Office occupations in Naper are Office & Administration (9 | 21.4%), and Sales & Related (8 | 19.1%).
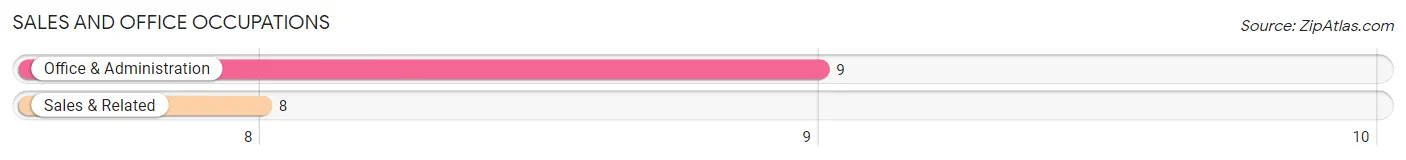
Sales and Office Occupations by Sex

| Occupation | Male | Female |
| Sales & Related | 8 (100.0%) | 0 (0.0%) |
| Office & Administration | 0 (0.0%) | 9 (100.0%) |
| Total (Category) | 8 (47.1%) | 9 (52.9%) |
| Total (Overall) | 29 (69.1%) | 13 (30.9%) |
Natural Resources, Construction and Maintenance Occupations
The most common Natural Resources, Construction and Maintenance occupations in Naper are , and Farming, Fishing & Forestry (6 | 14.3%).
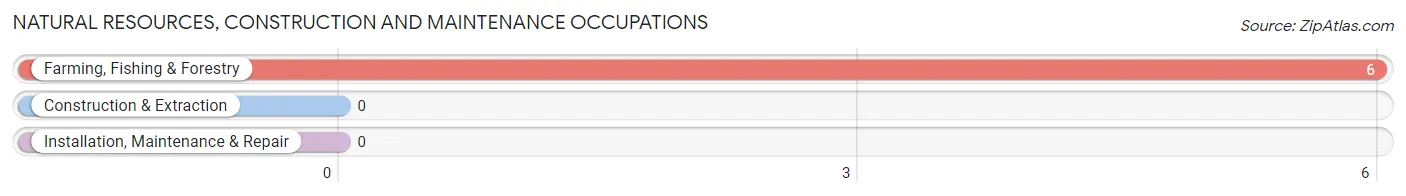
Natural Resources, Construction and Maintenance Occupations by Sex
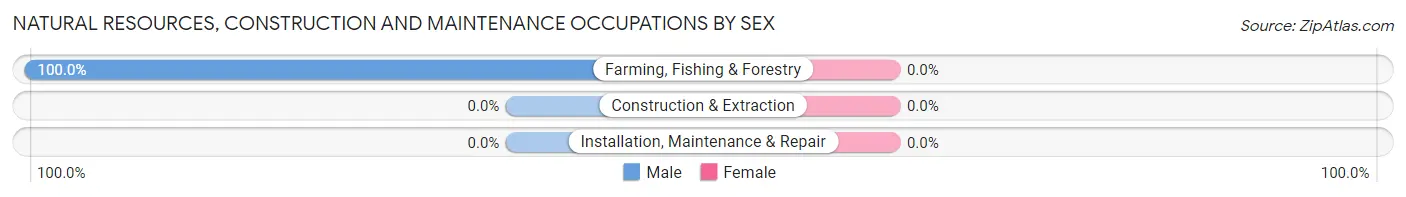
| Occupation | Male | Female |
| Farming, Fishing & Forestry | 6 (100.0%) | 0 (0.0%) |
| Construction & Extraction | 0 (0.0%) | 0 (0.0%) |
| Installation, Maintenance & Repair | 0 (0.0%) | 0 (0.0%) |
| Total (Category) | 6 (100.0%) | 0 (0.0%) |
| Total (Overall) | 29 (69.1%) | 13 (30.9%) |
Production, Transportation and Moving Occupations
The most common Production, Transportation and Moving occupations in Naper are Transportation (10 | 23.8%), and Production (2 | 4.8%).
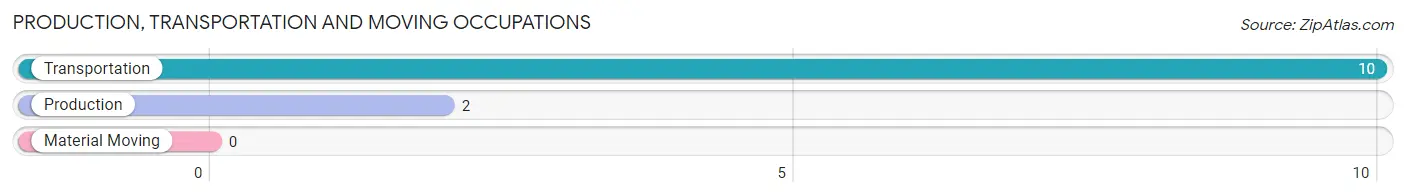
Production, Transportation and Moving Occupations by Sex
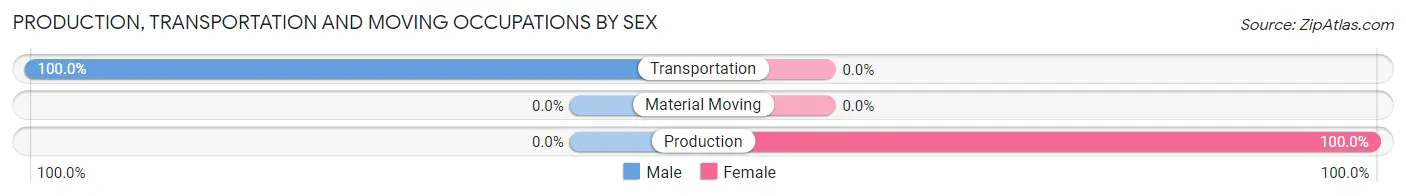
| Occupation | Male | Female |
| Production | 0 (0.0%) | 2 (100.0%) |
| Transportation | 10 (100.0%) | 0 (0.0%) |
| Material Moving | 0 (0.0%) | 0 (0.0%) |
| Total (Category) | 10 (83.3%) | 2 (16.7%) |
| Total (Overall) | 29 (69.1%) | 13 (30.9%) |
Employment Industries by Sex in Naper
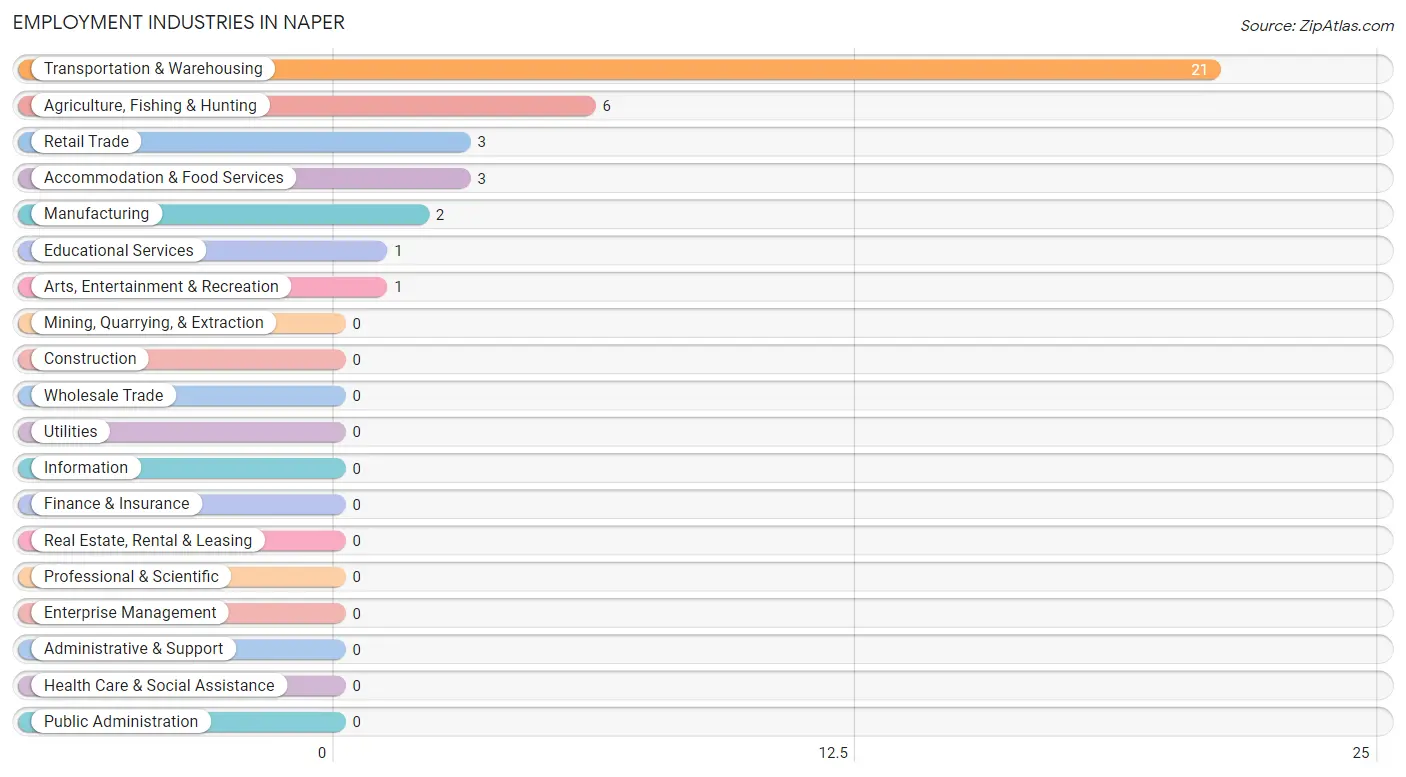
Employment Industries in Naper
The major employment industries in Naper include Transportation & Warehousing (21 | 50.0%), Agriculture, Fishing & Hunting (6 | 14.3%), Retail Trade (3 | 7.1%), Accommodation & Food Services (3 | 7.1%), and Manufacturing (2 | 4.8%).
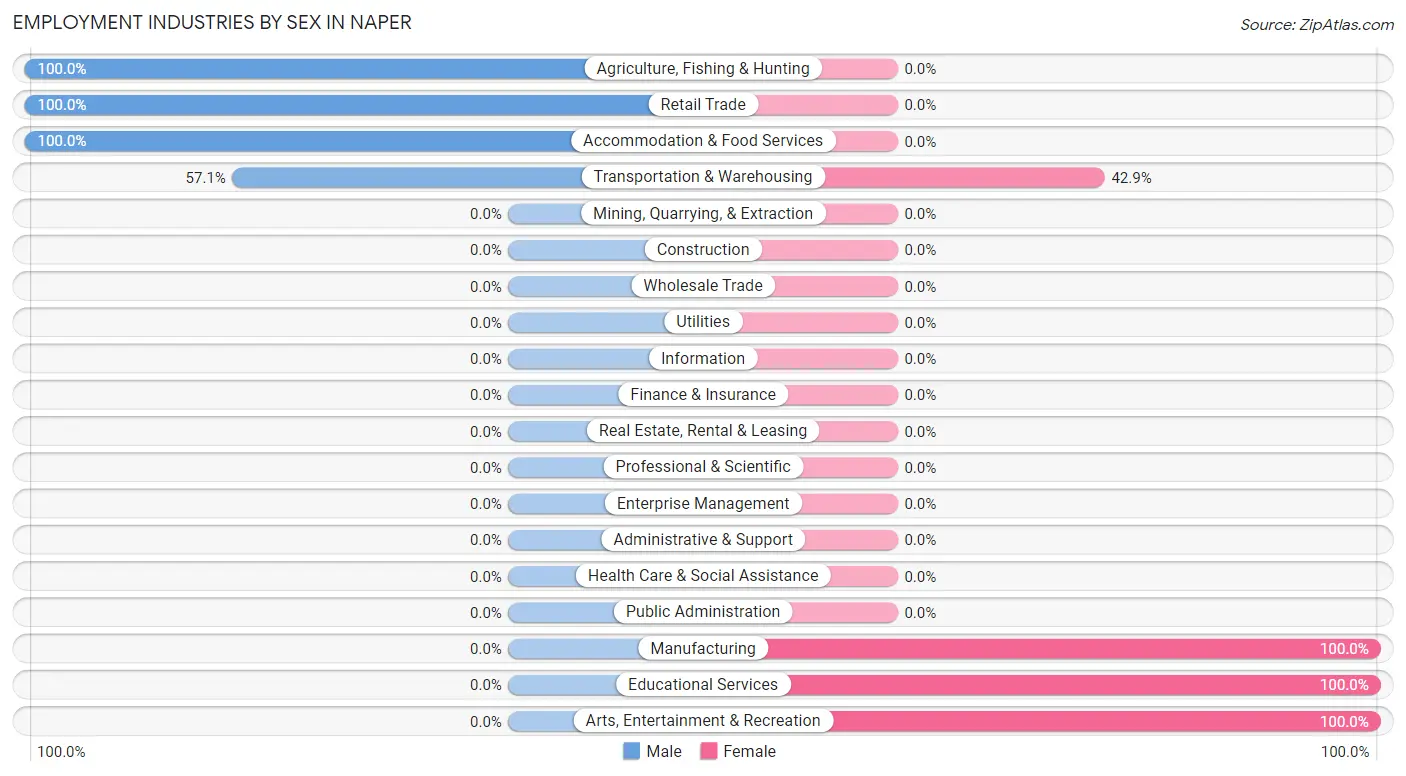
Employment Industries by Sex in Naper
The Naper industries that see more men than women are Agriculture, Fishing & Hunting (100.0%), Retail Trade (100.0%), and Accommodation & Food Services (100.0%), whereas the industries that tend to have a higher number of women are Manufacturing (100.0%), Educational Services (100.0%), and Arts, Entertainment & Recreation (100.0%).
| Industry | Male | Female |
| Agriculture, Fishing & Hunting | 6 (100.0%) | 0 (0.0%) |
| Mining, Quarrying, & Extraction | 0 (0.0%) | 0 (0.0%) |
| Construction | 0 (0.0%) | 0 (0.0%) |
| Manufacturing | 0 (0.0%) | 2 (100.0%) |
| Wholesale Trade | 0 (0.0%) | 0 (0.0%) |
| Retail Trade | 3 (100.0%) | 0 (0.0%) |
| Transportation & Warehousing | 12 (57.1%) | 9 (42.9%) |
| Utilities | 0 (0.0%) | 0 (0.0%) |
| Information | 0 (0.0%) | 0 (0.0%) |
| Finance & Insurance | 0 (0.0%) | 0 (0.0%) |
| Real Estate, Rental & Leasing | 0 (0.0%) | 0 (0.0%) |
| Professional & Scientific | 0 (0.0%) | 0 (0.0%) |
| Enterprise Management | 0 (0.0%) | 0 (0.0%) |
| Administrative & Support | 0 (0.0%) | 0 (0.0%) |
| Educational Services | 0 (0.0%) | 1 (100.0%) |
| Health Care & Social Assistance | 0 (0.0%) | 0 (0.0%) |
| Arts, Entertainment & Recreation | 0 (0.0%) | 1 (100.0%) |
| Accommodation & Food Services | 3 (100.0%) | 0 (0.0%) |
| Public Administration | 0 (0.0%) | 0 (0.0%) |
| Total | 29 (69.1%) | 13 (30.9%) |
Education in Naper
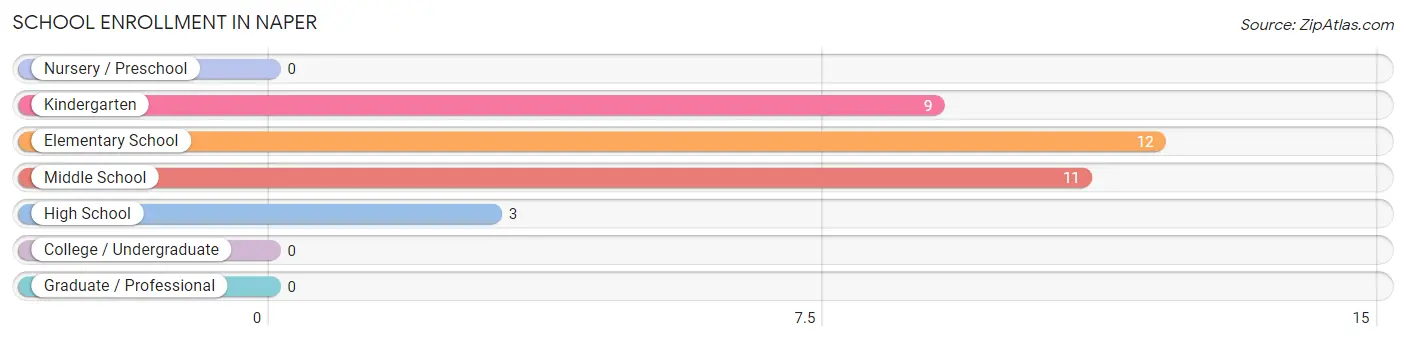
School Enrollment in Naper
The most common levels of schooling among the 35 students in Naper are elementary school (12 | 34.3%), middle school (11 | 31.4%), and kindergarten (9 | 25.7%).
| School Level | # Students | % Students |
| Nursery / Preschool | 0 | 0.0% |
| Kindergarten | 9 | 25.7% |
| Elementary School | 12 | 34.3% |
| Middle School | 11 | 31.4% |
| High School | 3 | 8.6% |
| College / Undergraduate | 0 | 0.0% |
| Graduate / Professional | 0 | 0.0% |
| Total | 35 | 100.0% |
School Enrollment by Age by Funding Source in Naper
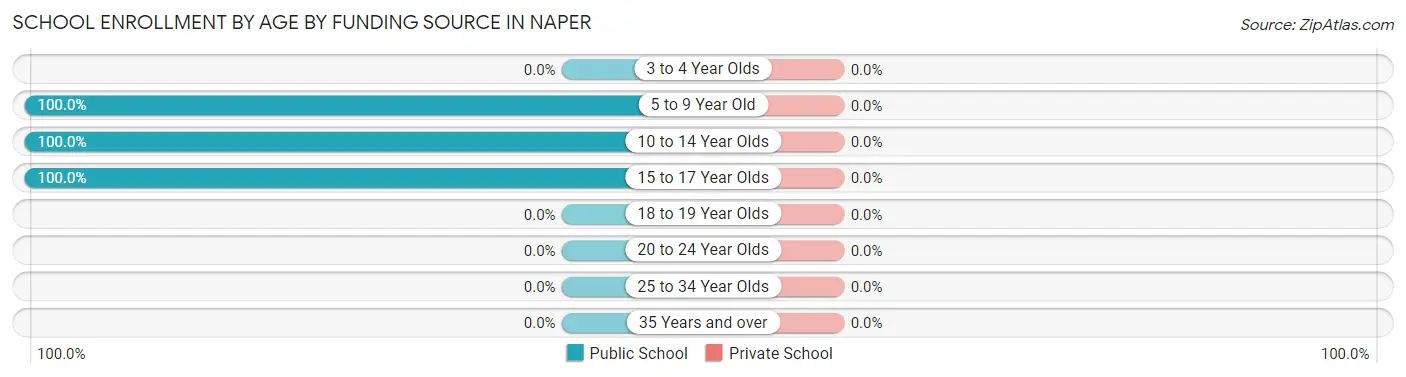
| Age Bracket | Public School | Private School |
| 3 to 4 Year Olds | 0 (0.0%) | 0 (0.0%) |
| 5 to 9 Year Old | 21 (100.0%) | 0 (0.0%) |
| 10 to 14 Year Olds | 13 (100.0%) | 0 (0.0%) |
| 15 to 17 Year Olds | 1 (100.0%) | 0 (0.0%) |
| 18 to 19 Year Olds | 0 (0.0%) | 0 (0.0%) |
| 20 to 24 Year Olds | 0 (0.0%) | 0 (0.0%) |
| 25 to 34 Year Olds | 0 (0.0%) | 0 (0.0%) |
| 35 Years and over | 0 (0.0%) | 0 (0.0%) |
| Total | 35 (100.0%) | 0 (0.0%) |
Educational Attainment by Field of Study in Naper
Education (3 | 60.0%), and literature & languages (2 | 40.0%) are the most common fields of study among 5 individuals in Naper who have obtained a bachelor's degree or higher.
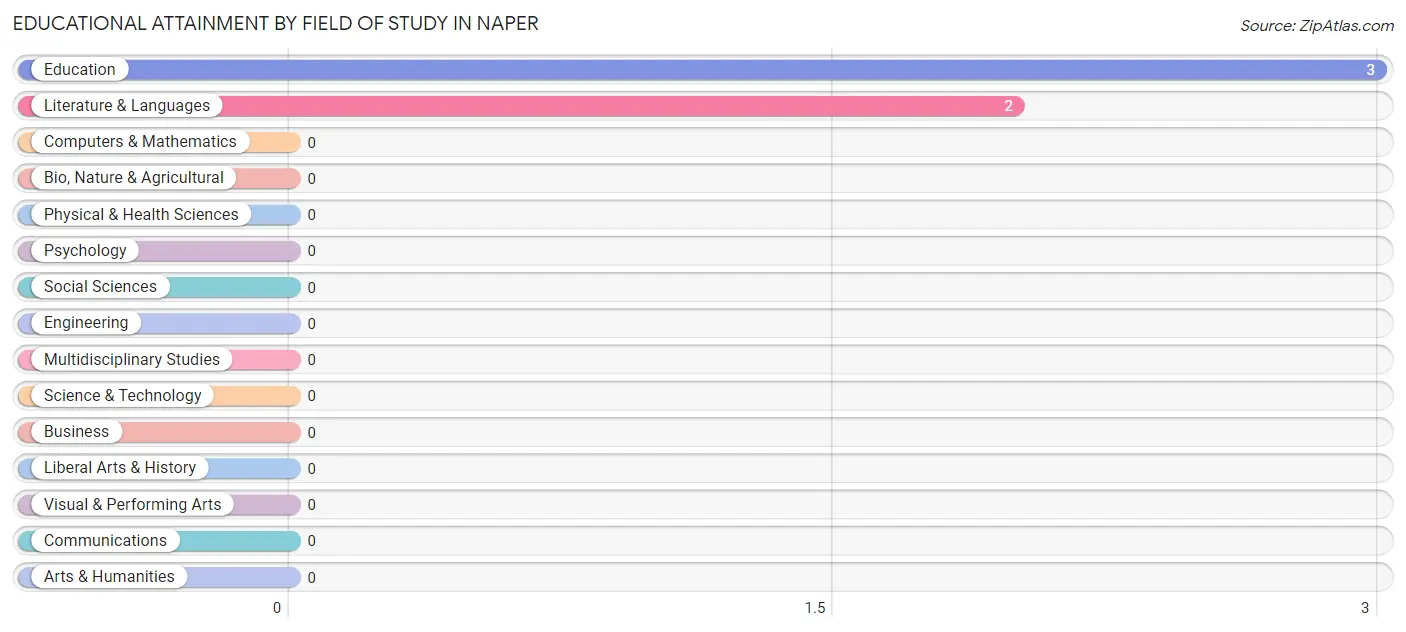
| Field of Study | # Graduates | % Graduates |
| Computers & Mathematics | 0 | 0.0% |
| Bio, Nature & Agricultural | 0 | 0.0% |
| Physical & Health Sciences | 0 | 0.0% |
| Psychology | 0 | 0.0% |
| Social Sciences | 0 | 0.0% |
| Engineering | 0 | 0.0% |
| Multidisciplinary Studies | 0 | 0.0% |
| Science & Technology | 0 | 0.0% |
| Business | 0 | 0.0% |
| Education | 3 | 60.0% |
| Literature & Languages | 2 | 40.0% |
| Liberal Arts & History | 0 | 0.0% |
| Visual & Performing Arts | 0 | 0.0% |
| Communications | 0 | 0.0% |
| Arts & Humanities | 0 | 0.0% |
| Total | 5 | 100.0% |
Transportation & Commute in Naper
Vehicle Availability by Sex in Naper
The most prevalent vehicle ownership categories in Naper are males with 1 vehicle (13, accounting for 44.8%) and females with 1 vehicle (0, making up 100.0%).
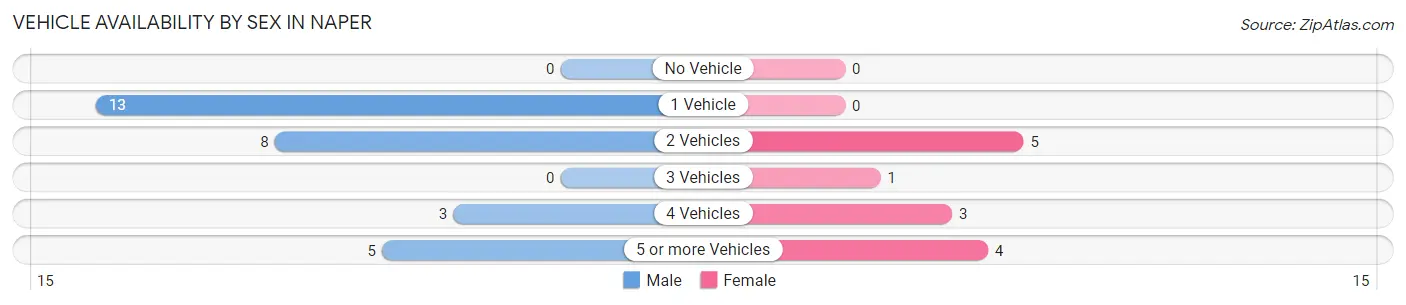
| Vehicles Available | Male | Female |
| No Vehicle | 0 (0.0%) | 0 (0.0%) |
| 1 Vehicle | 13 (44.8%) | 0 (0.0%) |
| 2 Vehicles | 8 (27.6%) | 5 (38.5%) |
| 3 Vehicles | 0 (0.0%) | 1 (7.7%) |
| 4 Vehicles | 3 (10.3%) | 3 (23.1%) |
| 5 or more Vehicles | 5 (17.2%) | 4 (30.8%) |
| Total | 29 (100.0%) | 13 (100.0%) |
Commute Time in Naper
The most frequently occuring commute durations in Naper are 5 to 9 minutes (16 commuters, 42.1%), 40 to 44 minutes (5 commuters, 13.2%), and 10 to 14 minutes (3 commuters, 7.9%).
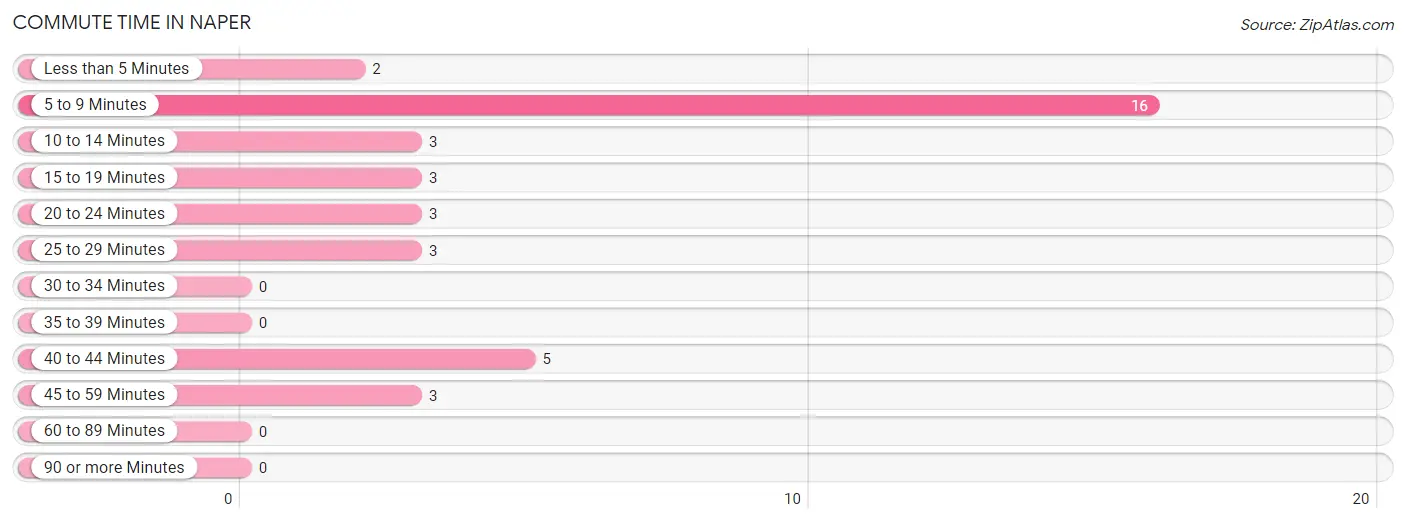
| Commute Time | # Commuters | % Commuters |
| Less than 5 Minutes | 2 | 5.3% |
| 5 to 9 Minutes | 16 | 42.1% |
| 10 to 14 Minutes | 3 | 7.9% |
| 15 to 19 Minutes | 3 | 7.9% |
| 20 to 24 Minutes | 3 | 7.9% |
| 25 to 29 Minutes | 3 | 7.9% |
| 30 to 34 Minutes | 0 | 0.0% |
| 35 to 39 Minutes | 0 | 0.0% |
| 40 to 44 Minutes | 5 | 13.2% |
| 45 to 59 Minutes | 3 | 7.9% |
| 60 to 89 Minutes | 0 | 0.0% |
| 90 or more Minutes | 0 | 0.0% |
Commute Time by Sex in Naper
The most common commute times in Naper are 5 to 9 minutes (11 commuters, 40.7%) for males and 5 to 9 minutes (5 commuters, 45.5%) for females.
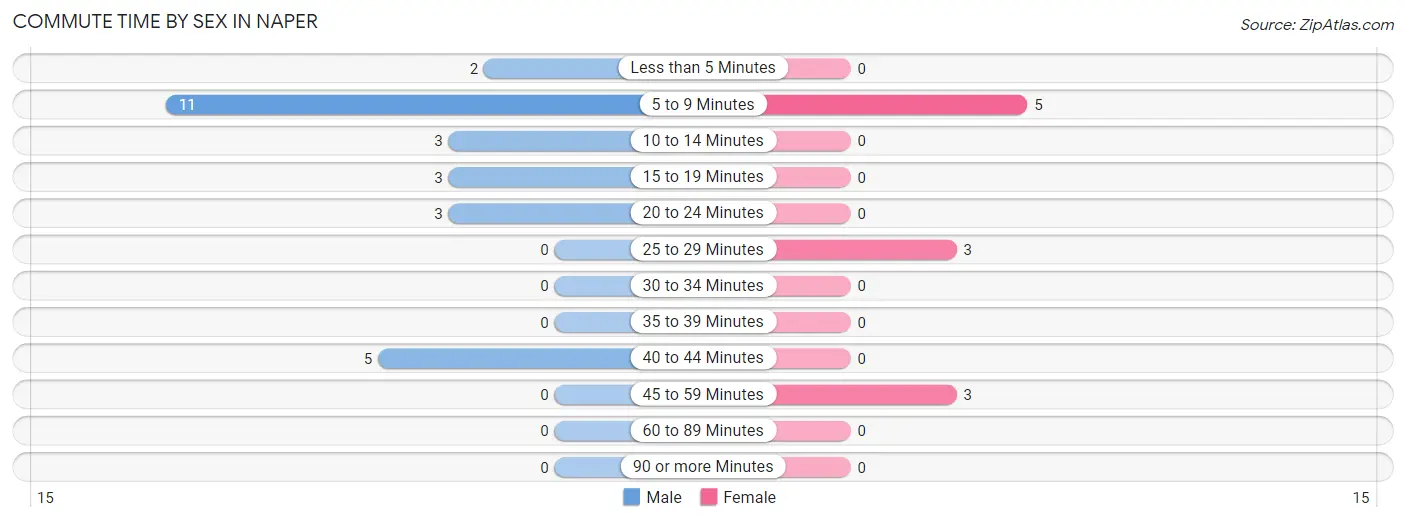
| Commute Time | Male | Female |
| Less than 5 Minutes | 2 (7.4%) | 0 (0.0%) |
| 5 to 9 Minutes | 11 (40.7%) | 5 (45.5%) |
| 10 to 14 Minutes | 3 (11.1%) | 0 (0.0%) |
| 15 to 19 Minutes | 3 (11.1%) | 0 (0.0%) |
| 20 to 24 Minutes | 3 (11.1%) | 0 (0.0%) |
| 25 to 29 Minutes | 0 (0.0%) | 3 (27.3%) |
| 30 to 34 Minutes | 0 (0.0%) | 0 (0.0%) |
| 35 to 39 Minutes | 0 (0.0%) | 0 (0.0%) |
| 40 to 44 Minutes | 5 (18.5%) | 0 (0.0%) |
| 45 to 59 Minutes | 0 (0.0%) | 3 (27.3%) |
| 60 to 89 Minutes | 0 (0.0%) | 0 (0.0%) |
| 90 or more Minutes | 0 (0.0%) | 0 (0.0%) |
Time of Departure to Work by Sex in Naper
The most frequent times of departure to work in Naper are 8:00 AM to 8:29 AM (8, 29.6%) for males and 7:00 AM to 7:29 AM (8, 72.7%) for females.
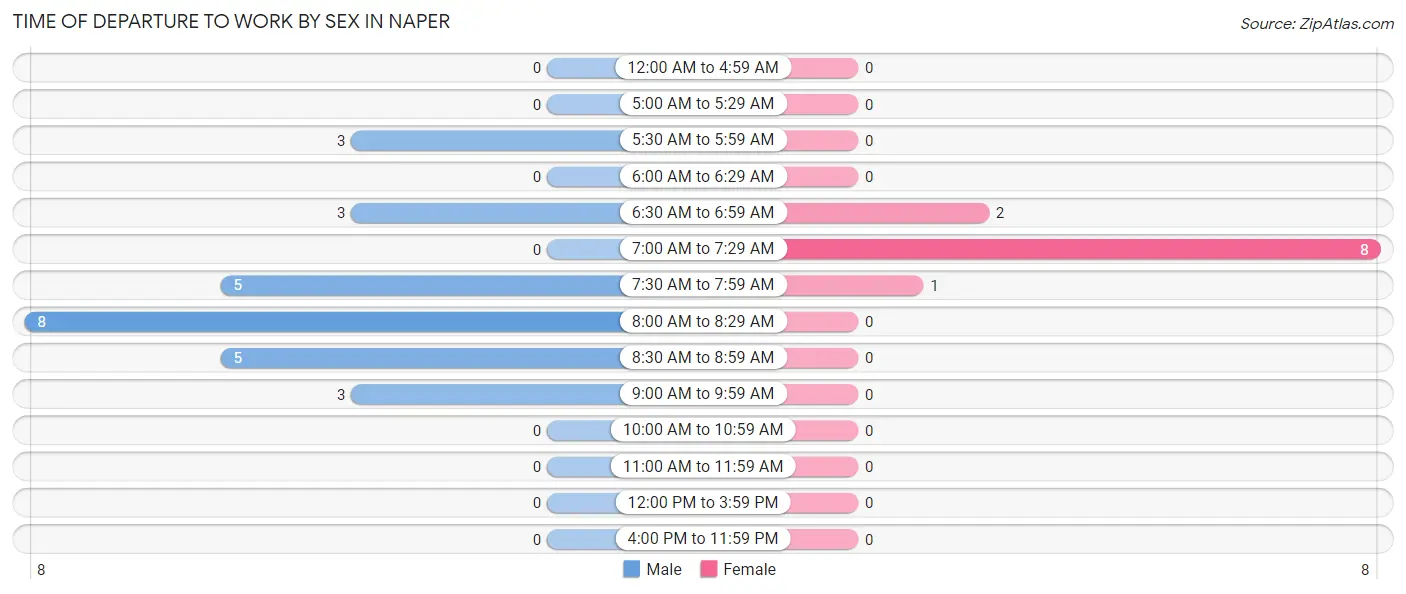
| Time of Departure | Male | Female |
| 12:00 AM to 4:59 AM | 0 (0.0%) | 0 (0.0%) |
| 5:00 AM to 5:29 AM | 0 (0.0%) | 0 (0.0%) |
| 5:30 AM to 5:59 AM | 3 (11.1%) | 0 (0.0%) |
| 6:00 AM to 6:29 AM | 0 (0.0%) | 0 (0.0%) |
| 6:30 AM to 6:59 AM | 3 (11.1%) | 2 (18.2%) |
| 7:00 AM to 7:29 AM | 0 (0.0%) | 8 (72.7%) |
| 7:30 AM to 7:59 AM | 5 (18.5%) | 1 (9.1%) |
| 8:00 AM to 8:29 AM | 8 (29.6%) | 0 (0.0%) |
| 8:30 AM to 8:59 AM | 5 (18.5%) | 0 (0.0%) |
| 9:00 AM to 9:59 AM | 3 (11.1%) | 0 (0.0%) |
| 10:00 AM to 10:59 AM | 0 (0.0%) | 0 (0.0%) |
| 11:00 AM to 11:59 AM | 0 (0.0%) | 0 (0.0%) |
| 12:00 PM to 3:59 PM | 0 (0.0%) | 0 (0.0%) |
| 4:00 PM to 11:59 PM | 0 (0.0%) | 0 (0.0%) |
| Total | 27 (100.0%) | 11 (100.0%) |
Housing Occupancy in Naper
Occupancy by Ownership in Naper
Of the total 71 dwellings in Naper, owner-occupied units account for 65 (91.5%), while renter-occupied units make up 6 (8.5%).
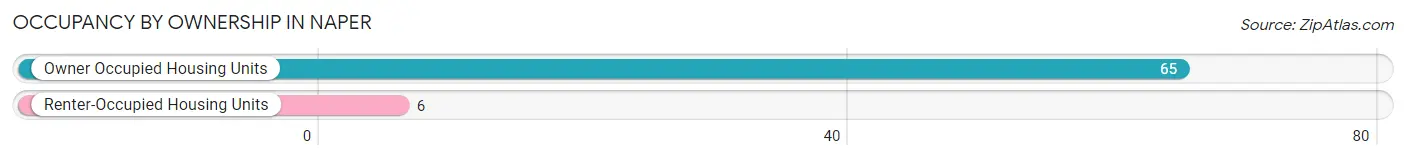
| Occupancy | # Housing Units | % Housing Units |
| Owner Occupied Housing Units | 65 | 91.5% |
| Renter-Occupied Housing Units | 6 | 8.5% |
| Total Occupied Housing Units | 71 | 100.0% |
Occupancy by Household Size in Naper
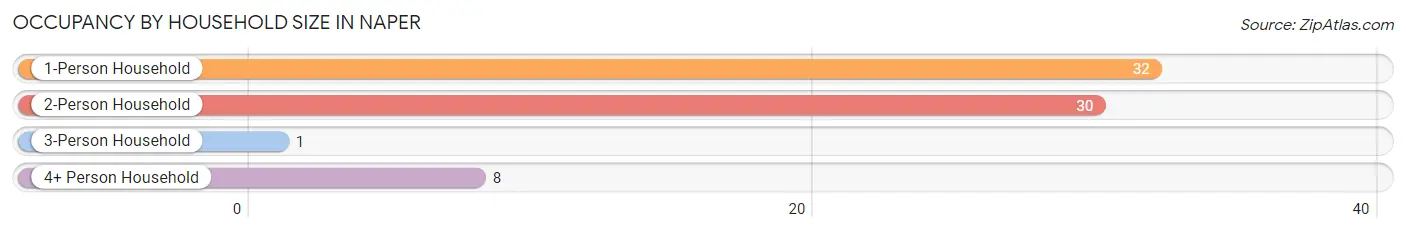
| Household Size | # Housing Units | % Housing Units |
| 1-Person Household | 32 | 45.1% |
| 2-Person Household | 30 | 42.2% |
| 3-Person Household | 1 | 1.4% |
| 4+ Person Household | 8 | 11.3% |
| Total Housing Units | 71 | 100.0% |
Occupancy by Ownership by Household Size in Naper
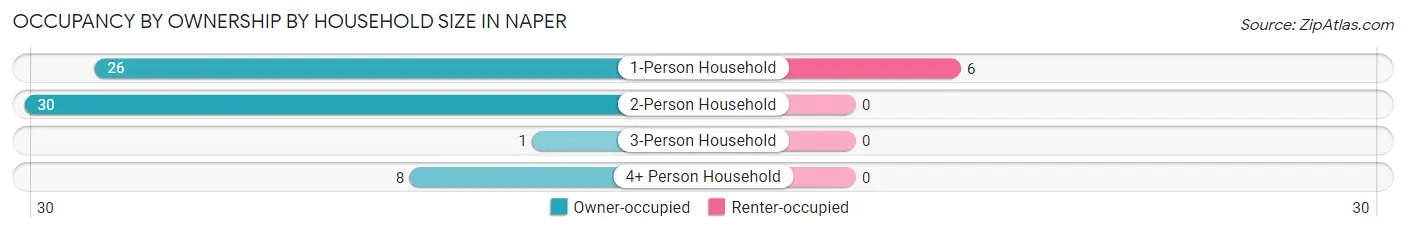
| Household Size | Owner-occupied | Renter-occupied |
| 1-Person Household | 26 (81.2%) | 6 (18.8%) |
| 2-Person Household | 30 (100.0%) | 0 (0.0%) |
| 3-Person Household | 1 (100.0%) | 0 (0.0%) |
| 4+ Person Household | 8 (100.0%) | 0 (0.0%) |
| Total Housing Units | 65 (91.5%) | 6 (8.5%) |
Occupancy by Educational Attainment in Naper
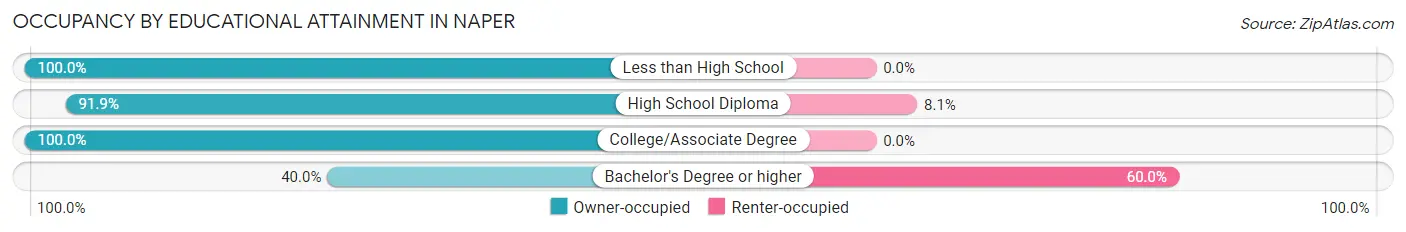
| Household Size | Owner-occupied | Renter-occupied |
| Less than High School | 5 (100.0%) | 0 (0.0%) |
| High School Diploma | 34 (91.9%) | 3 (8.1%) |
| College/Associate Degree | 24 (100.0%) | 0 (0.0%) |
| Bachelor's Degree or higher | 2 (40.0%) | 3 (60.0%) |
Occupancy by Age of Householder in Naper
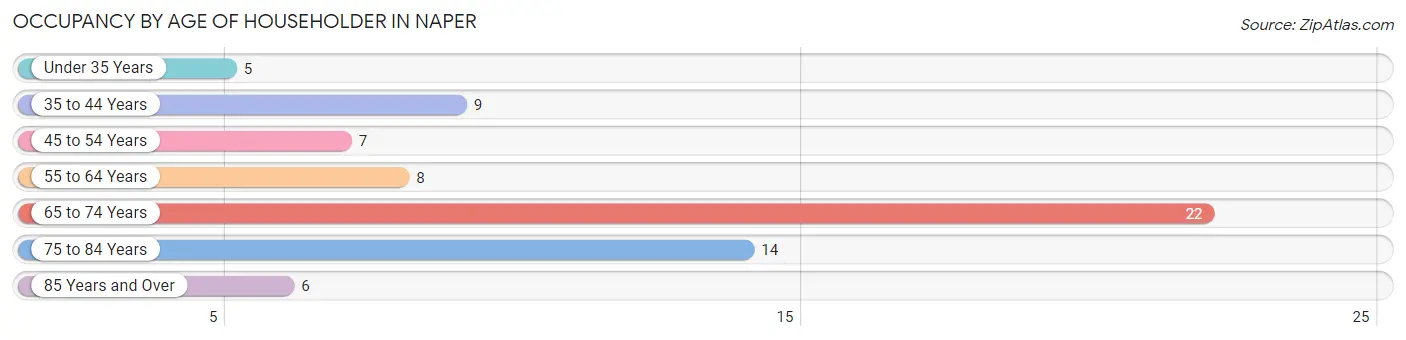
| Age Bracket | # Households | % Households |
| Under 35 Years | 5 | 7.0% |
| 35 to 44 Years | 9 | 12.7% |
| 45 to 54 Years | 7 | 9.9% |
| 55 to 64 Years | 8 | 11.3% |
| 65 to 74 Years | 22 | 31.0% |
| 75 to 84 Years | 14 | 19.7% |
| 85 Years and Over | 6 | 8.5% |
| Total | 71 | 100.0% |
Housing Finances in Naper
Median Income by Occupancy in Naper
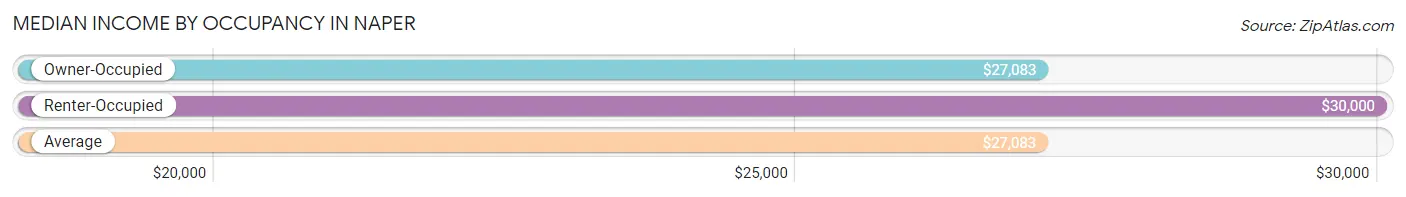
| Occupancy Type | # Households | Median Income |
| Owner-Occupied | 65 (91.5%) | $27,083 |
| Renter-Occupied | 6 (8.5%) | $30,000 |
| Average | 71 (100.0%) | $27,083 |
Occupancy by Householder Income Bracket in Naper
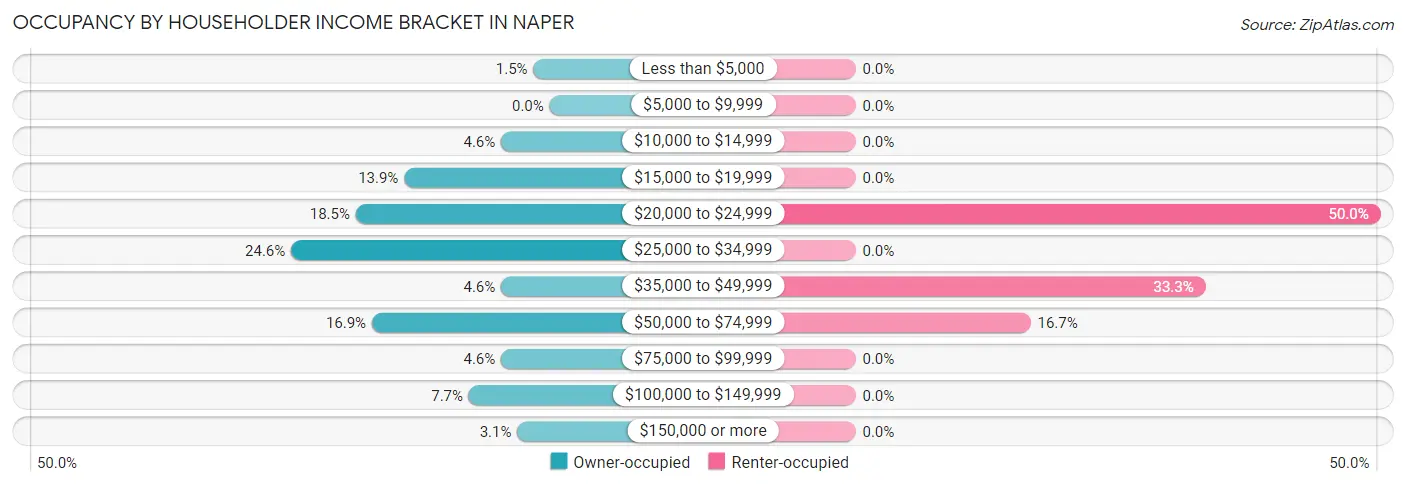
| Income Bracket | Owner-occupied | Renter-occupied |
| Less than $5,000 | 1 (1.5%) | 0 (0.0%) |
| $5,000 to $9,999 | 0 (0.0%) | 0 (0.0%) |
| $10,000 to $14,999 | 3 (4.6%) | 0 (0.0%) |
| $15,000 to $19,999 | 9 (13.9%) | 0 (0.0%) |
| $20,000 to $24,999 | 12 (18.5%) | 3 (50.0%) |
| $25,000 to $34,999 | 16 (24.6%) | 0 (0.0%) |
| $35,000 to $49,999 | 3 (4.6%) | 2 (33.3%) |
| $50,000 to $74,999 | 11 (16.9%) | 1 (16.7%) |
| $75,000 to $99,999 | 3 (4.6%) | 0 (0.0%) |
| $100,000 to $149,999 | 5 (7.7%) | 0 (0.0%) |
| $150,000 or more | 2 (3.1%) | 0 (0.0%) |
| Total | 65 (100.0%) | 6 (100.0%) |
Monthly Housing Cost Tiers in Naper
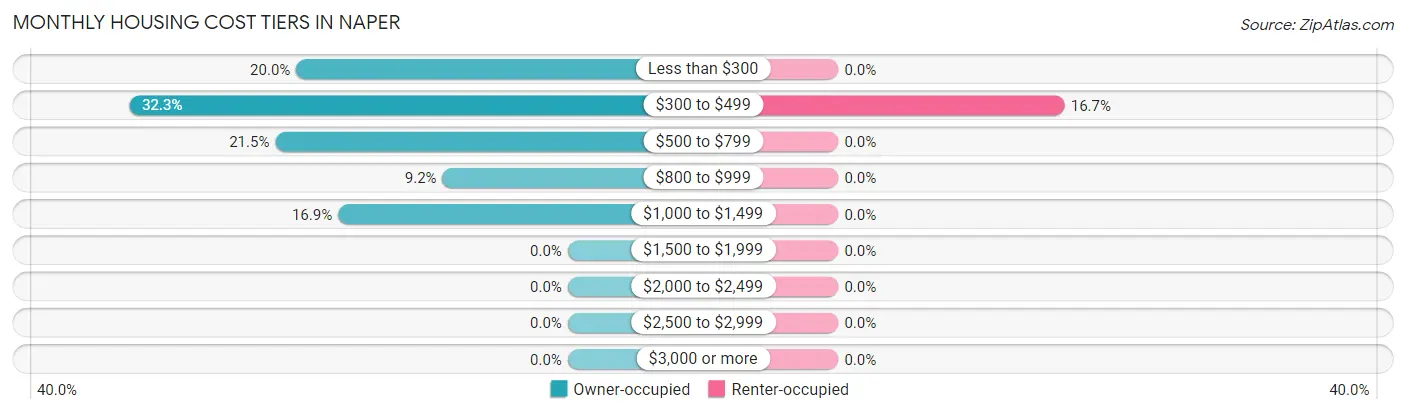
| Monthly Cost | Owner-occupied | Renter-occupied |
| Less than $300 | 13 (20.0%) | 0 (0.0%) |
| $300 to $499 | 21 (32.3%) | 1 (16.7%) |
| $500 to $799 | 14 (21.5%) | 0 (0.0%) |
| $800 to $999 | 6 (9.2%) | 0 (0.0%) |
| $1,000 to $1,499 | 11 (16.9%) | 0 (0.0%) |
| $1,500 to $1,999 | 0 (0.0%) | 0 (0.0%) |
| $2,000 to $2,499 | 0 (0.0%) | 0 (0.0%) |
| $2,500 to $2,999 | 0 (0.0%) | 0 (0.0%) |
| $3,000 or more | 0 (0.0%) | 0 (0.0%) |
| Total | 65 (100.0%) | 6 (100.0%) |
Physical Housing Characteristics in Naper
Housing Structures in Naper
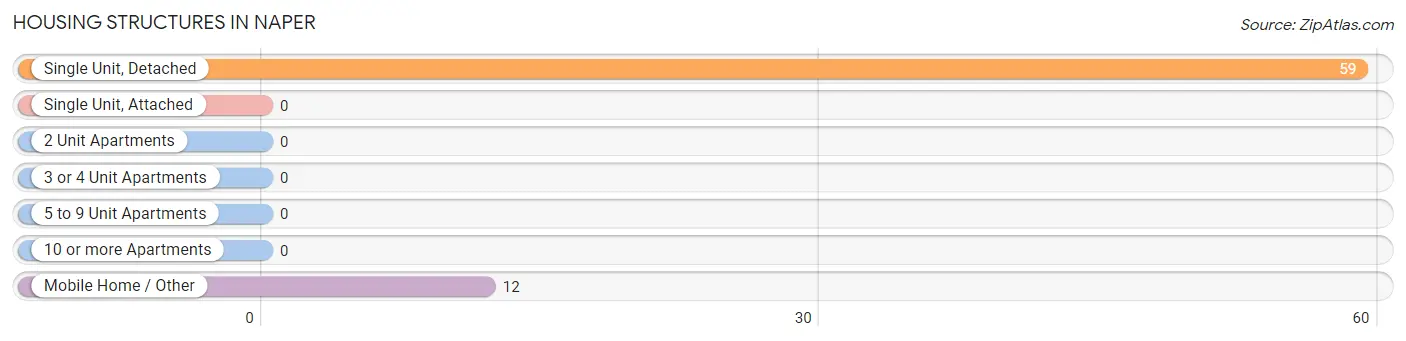
| Structure Type | # Housing Units | % Housing Units |
| Single Unit, Detached | 59 | 83.1% |
| Single Unit, Attached | 0 | 0.0% |
| 2 Unit Apartments | 0 | 0.0% |
| 3 or 4 Unit Apartments | 0 | 0.0% |
| 5 to 9 Unit Apartments | 0 | 0.0% |
| 10 or more Apartments | 0 | 0.0% |
| Mobile Home / Other | 12 | 16.9% |
| Total | 71 | 100.0% |
Housing Structures by Occupancy in Naper
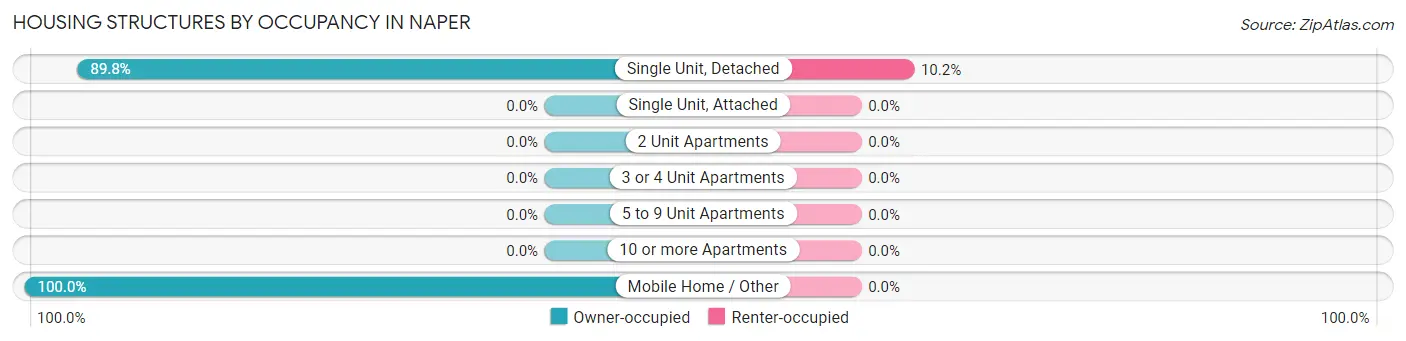
| Structure Type | Owner-occupied | Renter-occupied |
| Single Unit, Detached | 53 (89.8%) | 6 (10.2%) |
| Single Unit, Attached | 0 (0.0%) | 0 (0.0%) |
| 2 Unit Apartments | 0 (0.0%) | 0 (0.0%) |
| 3 or 4 Unit Apartments | 0 (0.0%) | 0 (0.0%) |
| 5 to 9 Unit Apartments | 0 (0.0%) | 0 (0.0%) |
| 10 or more Apartments | 0 (0.0%) | 0 (0.0%) |
| Mobile Home / Other | 12 (100.0%) | 0 (0.0%) |
| Total | 65 (91.5%) | 6 (8.5%) |
Housing Structures by Number of Rooms in Naper
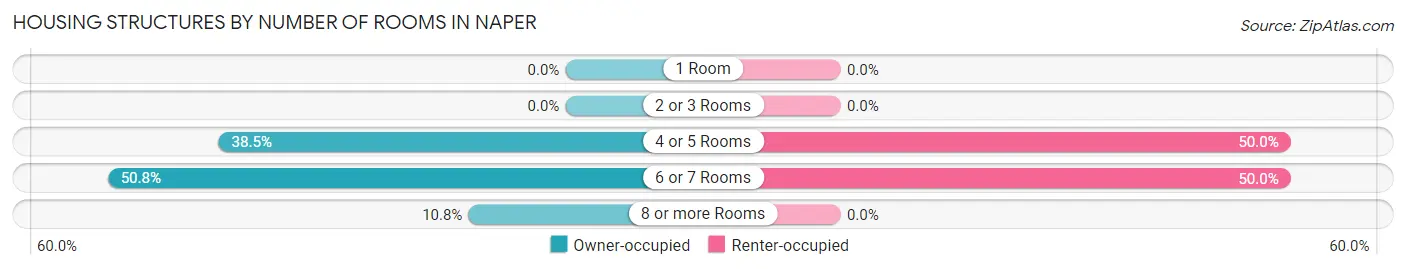
| Number of Rooms | Owner-occupied | Renter-occupied |
| 1 Room | 0 (0.0%) | 0 (0.0%) |
| 2 or 3 Rooms | 0 (0.0%) | 0 (0.0%) |
| 4 or 5 Rooms | 25 (38.5%) | 3 (50.0%) |
| 6 or 7 Rooms | 33 (50.8%) | 3 (50.0%) |
| 8 or more Rooms | 7 (10.8%) | 0 (0.0%) |
| Total | 65 (100.0%) | 6 (100.0%) |
Housing Structure by Heating Type in Naper
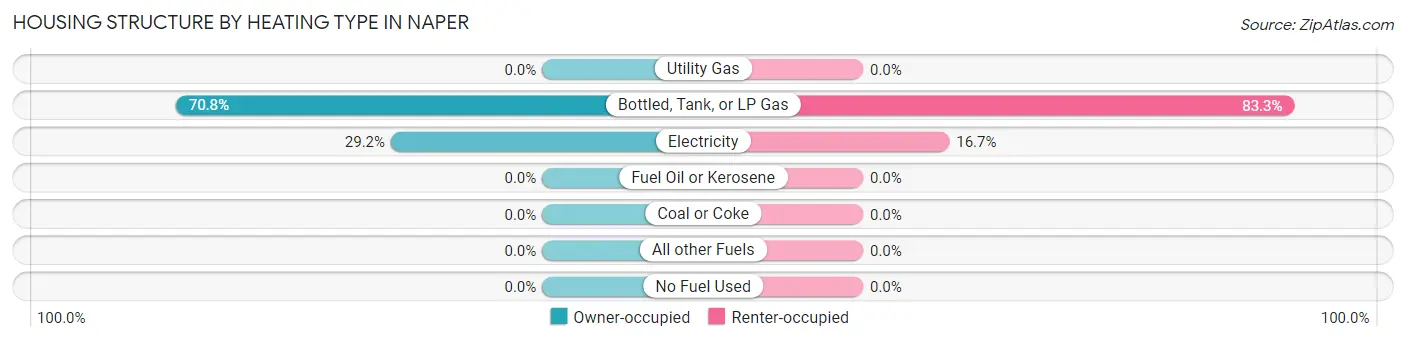
| Heating Type | Owner-occupied | Renter-occupied |
| Utility Gas | 0 (0.0%) | 0 (0.0%) |
| Bottled, Tank, or LP Gas | 46 (70.8%) | 5 (83.3%) |
| Electricity | 19 (29.2%) | 1 (16.7%) |
| Fuel Oil or Kerosene | 0 (0.0%) | 0 (0.0%) |
| Coal or Coke | 0 (0.0%) | 0 (0.0%) |
| All other Fuels | 0 (0.0%) | 0 (0.0%) |
| No Fuel Used | 0 (0.0%) | 0 (0.0%) |
| Total | 65 (100.0%) | 6 (100.0%) |
Household Vehicle Usage in Naper
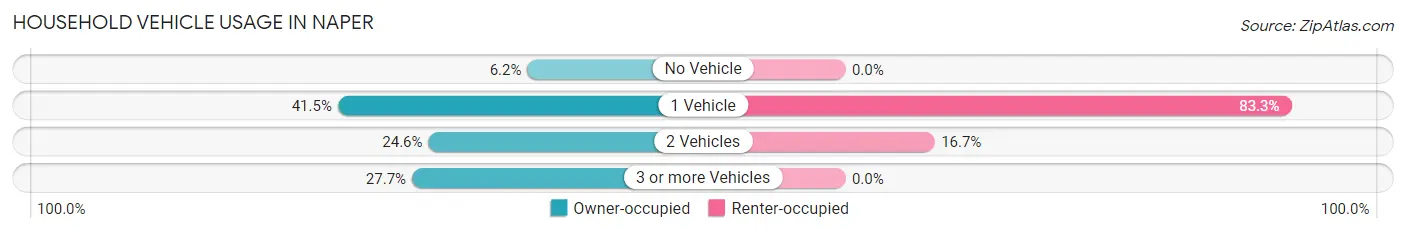
| Vehicles per Household | Owner-occupied | Renter-occupied |
| No Vehicle | 4 (6.1%) | 0 (0.0%) |
| 1 Vehicle | 27 (41.5%) | 5 (83.3%) |
| 2 Vehicles | 16 (24.6%) | 1 (16.7%) |
| 3 or more Vehicles | 18 (27.7%) | 0 (0.0%) |
| Total | 65 (100.0%) | 6 (100.0%) |
Real Estate & Mortgages in Naper
Real Estate and Mortgage Overview in Naper
| Characteristic | Without Mortgage | With Mortgage |
| Housing Units | 61 | 4 |
| Median Property Value | $21,300 | $0 |
| Median Household Income | $26,806 | $0 |
| Monthly Housing Costs | $461 | $0 |
| Real Estate Taxes | $517 | $1 |
Property Value by Mortgage Status in Naper
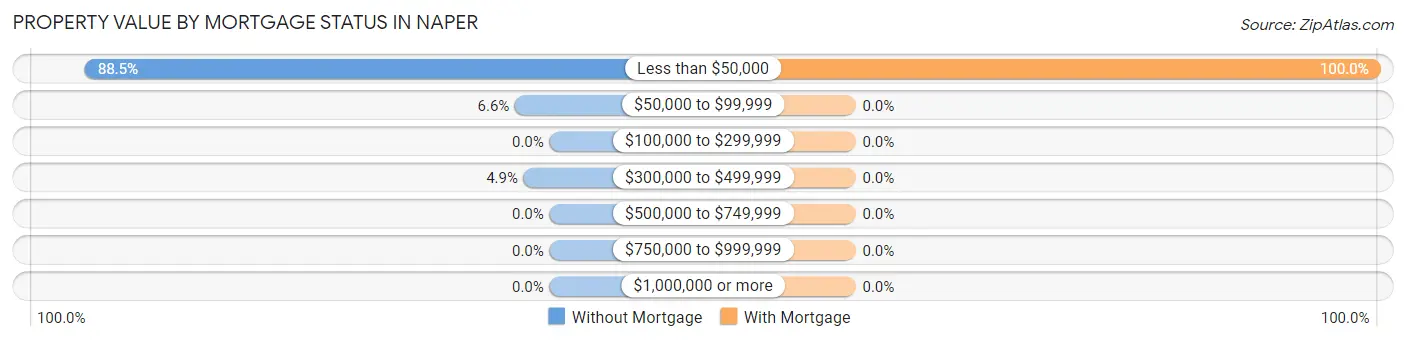
| Property Value | Without Mortgage | With Mortgage |
| Less than $50,000 | 54 (88.5%) | 4 (100.0%) |
| $50,000 to $99,999 | 4 (6.6%) | 0 (0.0%) |
| $100,000 to $299,999 | 0 (0.0%) | 0 (0.0%) |
| $300,000 to $499,999 | 3 (4.9%) | 0 (0.0%) |
| $500,000 to $749,999 | 0 (0.0%) | 0 (0.0%) |
| $750,000 to $999,999 | 0 (0.0%) | 0 (0.0%) |
| $1,000,000 or more | 0 (0.0%) | 0 (0.0%) |
| Total | 61 (100.0%) | 4 (100.0%) |
Household Income by Mortgage Status in Naper
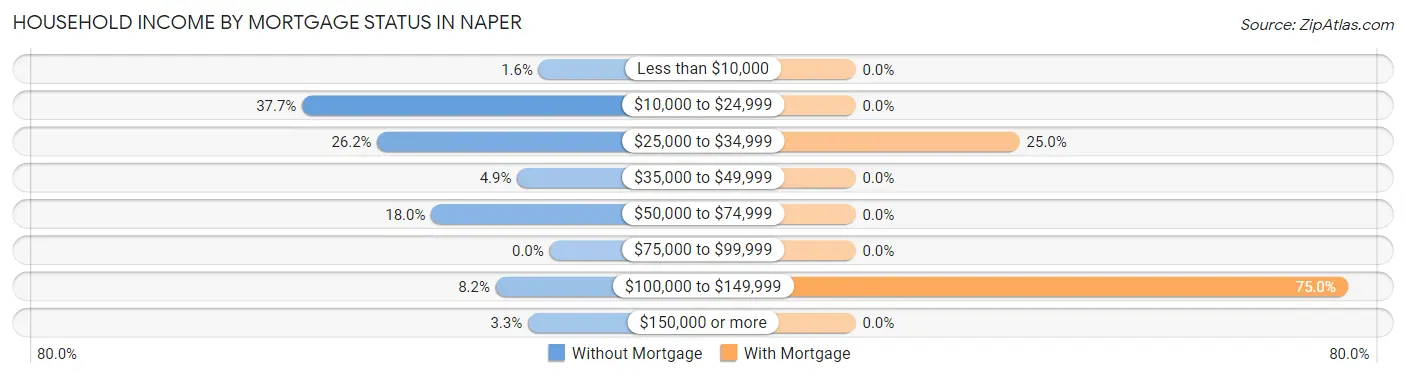
| Household Income | Without Mortgage | With Mortgage |
| Less than $10,000 | 1 (1.6%) | 0 (0.0%) |
| $10,000 to $24,999 | 23 (37.7%) | 0 (0.0%) |
| $25,000 to $34,999 | 16 (26.2%) | 1 (25.0%) |
| $35,000 to $49,999 | 3 (4.9%) | 0 (0.0%) |
| $50,000 to $74,999 | 11 (18.0%) | 0 (0.0%) |
| $75,000 to $99,999 | 0 (0.0%) | 0 (0.0%) |
| $100,000 to $149,999 | 5 (8.2%) | 3 (75.0%) |
| $150,000 or more | 2 (3.3%) | 0 (0.0%) |
| Total | 61 (100.0%) | 4 (100.0%) |
Property Value to Household Income Ratio in Naper
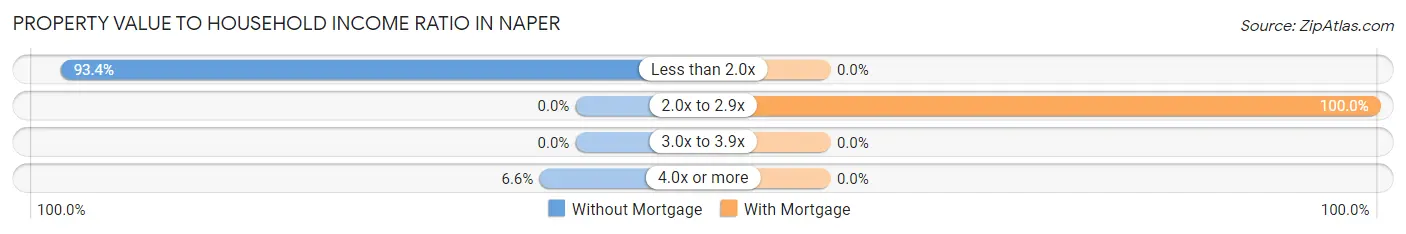
| Value-to-Income Ratio | Without Mortgage | With Mortgage |
| Less than 2.0x | 57 (93.4%) | 0 (0.0%) |
| 2.0x to 2.9x | 0 (0.0%) | 4 (100.0%) |
| 3.0x to 3.9x | 0 (0.0%) | 0 (0.0%) |
| 4.0x or more | 4 (6.6%) | 0 (0.0%) |
| Total | 61 (100.0%) | 4 (100.0%) |
Real Estate Taxes by Mortgage Status in Naper
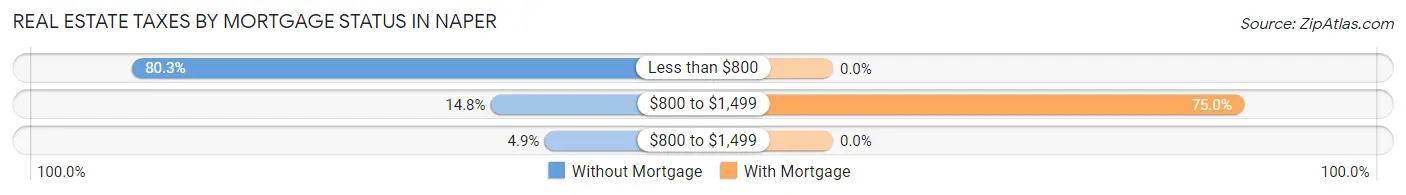
| Property Taxes | Without Mortgage | With Mortgage |
| Less than $800 | 49 (80.3%) | 0 (0.0%) |
| $800 to $1,499 | 9 (14.7%) | 3 (75.0%) |
| $800 to $1,499 | 3 (4.9%) | 0 (0.0%) |
| Total | 61 (100.0%) | 4 (100.0%) |
Health & Disability in Naper
Health Insurance Coverage by Age in Naper
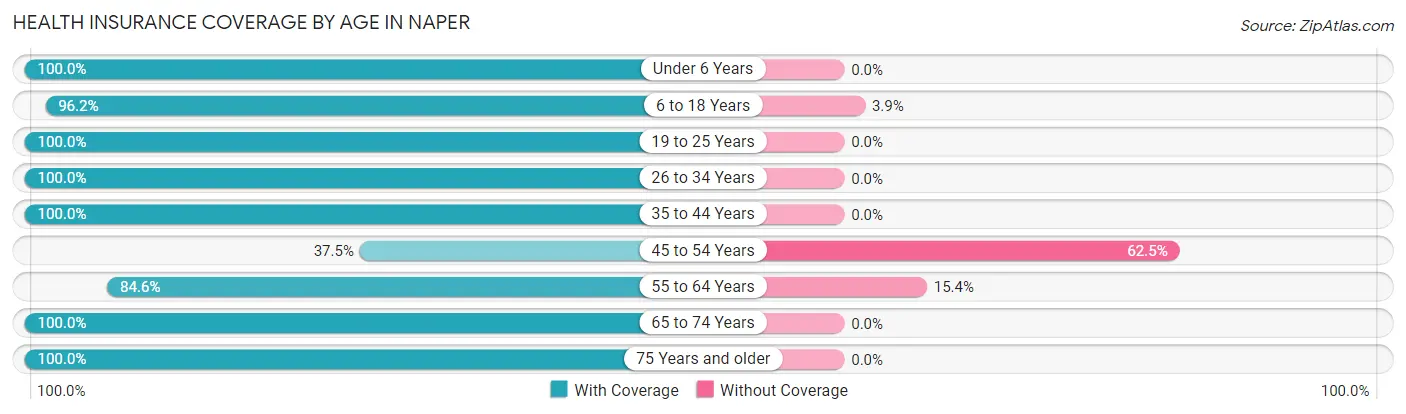
| Age Bracket | With Coverage | Without Coverage |
| Under 6 Years | 17 (100.0%) | 0 (0.0%) |
| 6 to 18 Years | 25 (96.2%) | 1 (3.8%) |
| 19 to 25 Years | 5 (100.0%) | 0 (0.0%) |
| 26 to 34 Years | 14 (100.0%) | 0 (0.0%) |
| 35 to 44 Years | 16 (100.0%) | 0 (0.0%) |
| 45 to 54 Years | 3 (37.5%) | 5 (62.5%) |
| 55 to 64 Years | 11 (84.6%) | 2 (15.4%) |
| 65 to 74 Years | 30 (100.0%) | 0 (0.0%) |
| 75 Years and older | 27 (100.0%) | 0 (0.0%) |
| Total | 148 (94.9%) | 8 (5.1%) |
Health Insurance Coverage by Citizenship Status in Naper
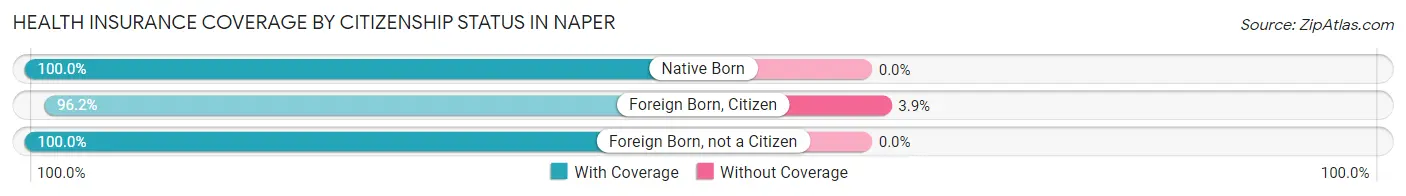
| Citizenship Status | With Coverage | Without Coverage |
| Native Born | 17 (100.0%) | 0 (0.0%) |
| Foreign Born, Citizen | 25 (96.2%) | 1 (3.8%) |
| Foreign Born, not a Citizen | 5 (100.0%) | 0 (0.0%) |
Health Insurance Coverage by Household Income in Naper
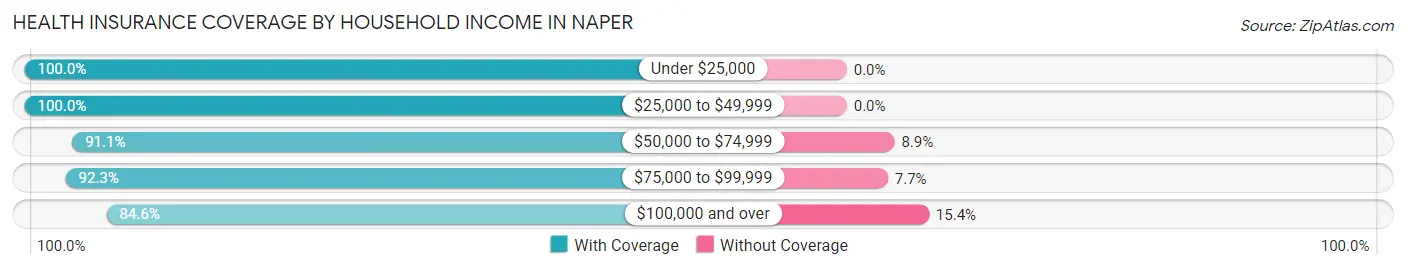
| Household Income | With Coverage | Without Coverage |
| Under $25,000 | 36 (100.0%) | 0 (0.0%) |
| $25,000 to $49,999 | 38 (100.0%) | 0 (0.0%) |
| $50,000 to $74,999 | 51 (91.1%) | 5 (8.9%) |
| $75,000 to $99,999 | 12 (92.3%) | 1 (7.7%) |
| $100,000 and over | 11 (84.6%) | 2 (15.4%) |
Public vs Private Health Insurance Coverage by Age in Naper
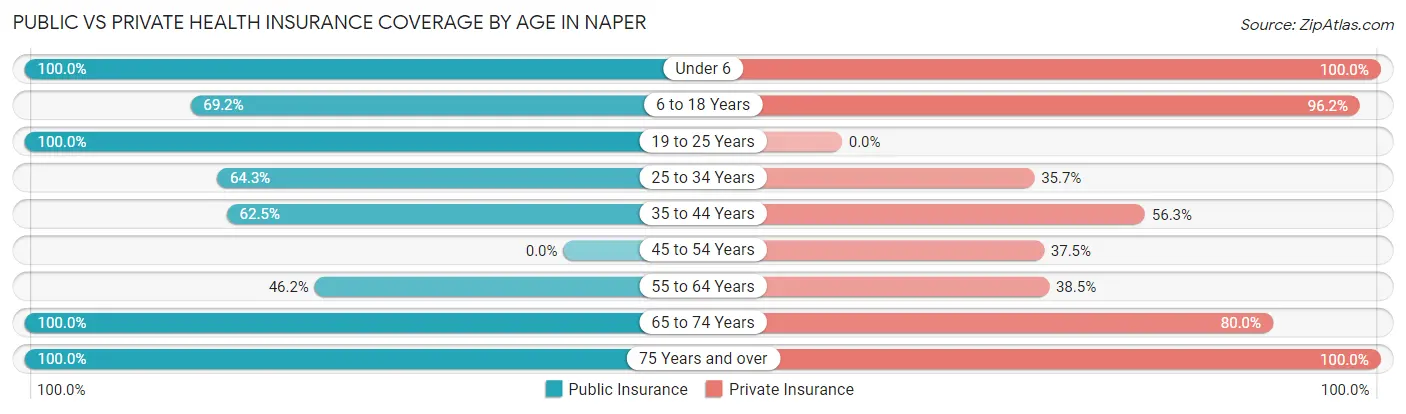
| Age Bracket | Public Insurance | Private Insurance |
| Under 6 | 17 (100.0%) | 17 (100.0%) |
| 6 to 18 Years | 18 (69.2%) | 25 (96.2%) |
| 19 to 25 Years | 5 (100.0%) | 0 (0.0%) |
| 25 to 34 Years | 9 (64.3%) | 5 (35.7%) |
| 35 to 44 Years | 10 (62.5%) | 9 (56.2%) |
| 45 to 54 Years | 0 (0.0%) | 3 (37.5%) |
| 55 to 64 Years | 6 (46.2%) | 5 (38.5%) |
| 65 to 74 Years | 30 (100.0%) | 24 (80.0%) |
| 75 Years and over | 27 (100.0%) | 27 (100.0%) |
| Total | 122 (78.2%) | 115 (73.7%) |
Disability Status by Sex by Age in Naper
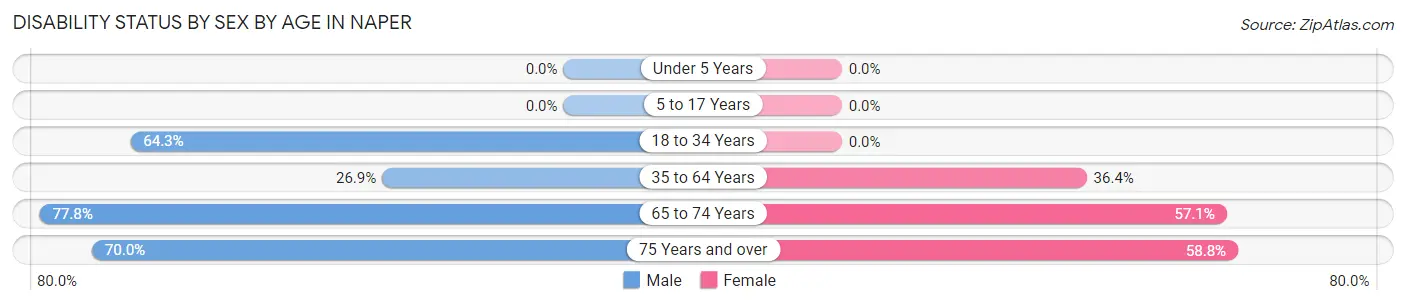
| Age Bracket | Male | Female |
| Under 5 Years | 0 (0.0%) | 0 (0.0%) |
| 5 to 17 Years | 0 (0.0%) | 0 (0.0%) |
| 18 to 34 Years | 9 (64.3%) | 0 (0.0%) |
| 35 to 64 Years | 7 (26.9%) | 4 (36.4%) |
| 65 to 74 Years | 7 (77.8%) | 12 (57.1%) |
| 75 Years and over | 7 (70.0%) | 10 (58.8%) |
Disability Class by Sex by Age in Naper
Disability Class: Hearing Difficulty
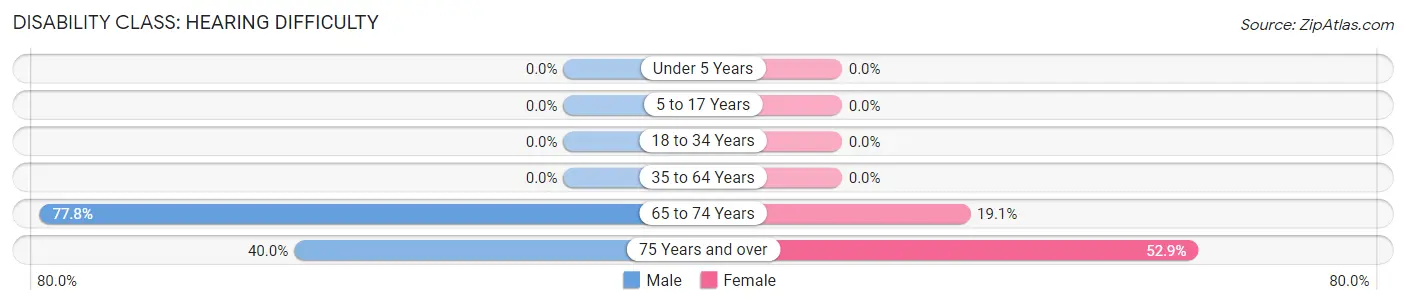
| Age Bracket | Male | Female |
| Under 5 Years | 0 (0.0%) | 0 (0.0%) |
| 5 to 17 Years | 0 (0.0%) | 0 (0.0%) |
| 18 to 34 Years | 0 (0.0%) | 0 (0.0%) |
| 35 to 64 Years | 0 (0.0%) | 0 (0.0%) |
| 65 to 74 Years | 7 (77.8%) | 4 (19.1%) |
| 75 Years and over | 4 (40.0%) | 9 (52.9%) |
Disability Class: Vision Difficulty
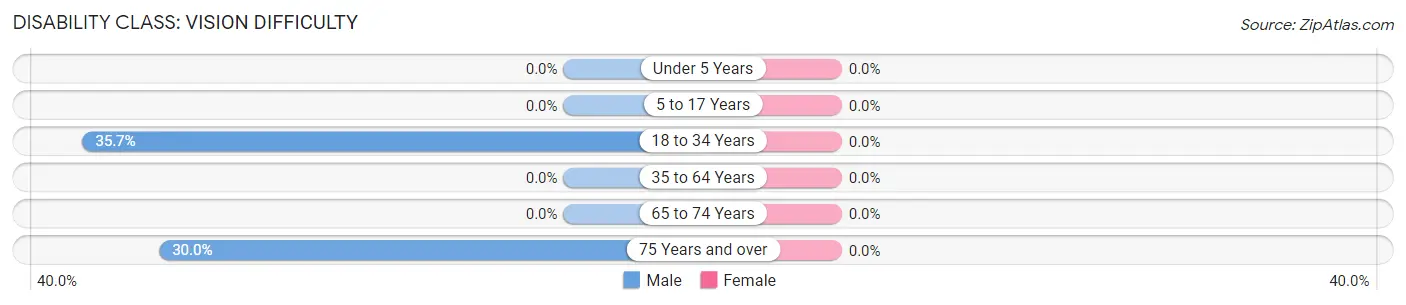
| Age Bracket | Male | Female |
| Under 5 Years | 0 (0.0%) | 0 (0.0%) |
| 5 to 17 Years | 0 (0.0%) | 0 (0.0%) |
| 18 to 34 Years | 5 (35.7%) | 0 (0.0%) |
| 35 to 64 Years | 0 (0.0%) | 0 (0.0%) |
| 65 to 74 Years | 0 (0.0%) | 0 (0.0%) |
| 75 Years and over | 3 (30.0%) | 0 (0.0%) |
Disability Class: Cognitive Difficulty
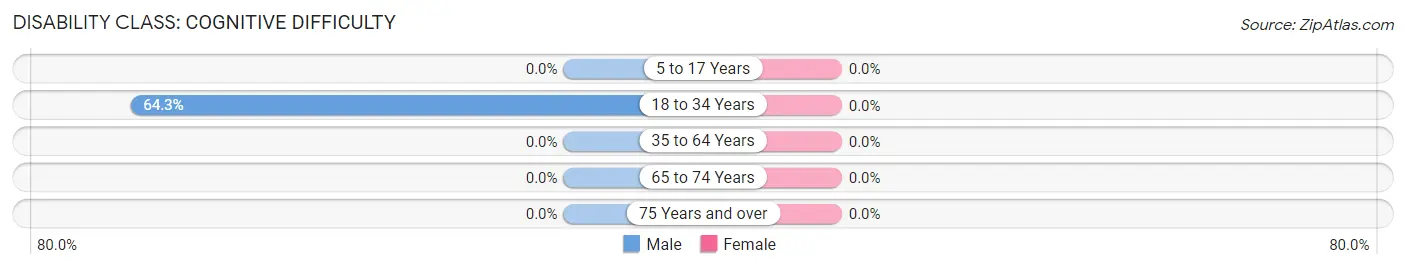
| Age Bracket | Male | Female |
| 5 to 17 Years | 0 (0.0%) | 0 (0.0%) |
| 18 to 34 Years | 9 (64.3%) | 0 (0.0%) |
| 35 to 64 Years | 0 (0.0%) | 0 (0.0%) |
| 65 to 74 Years | 0 (0.0%) | 0 (0.0%) |
| 75 Years and over | 0 (0.0%) | 0 (0.0%) |
Disability Class: Ambulatory Difficulty
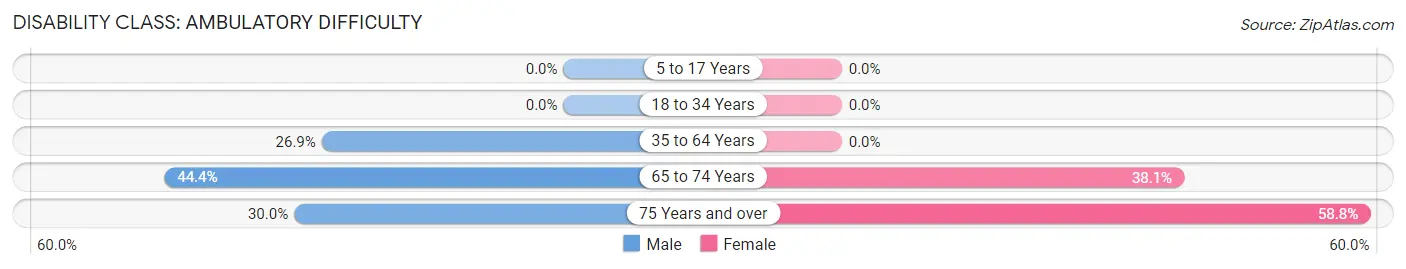
| Age Bracket | Male | Female |
| 5 to 17 Years | 0 (0.0%) | 0 (0.0%) |
| 18 to 34 Years | 0 (0.0%) | 0 (0.0%) |
| 35 to 64 Years | 7 (26.9%) | 0 (0.0%) |
| 65 to 74 Years | 4 (44.4%) | 8 (38.1%) |
| 75 Years and over | 3 (30.0%) | 10 (58.8%) |
Disability Class: Self-Care Difficulty
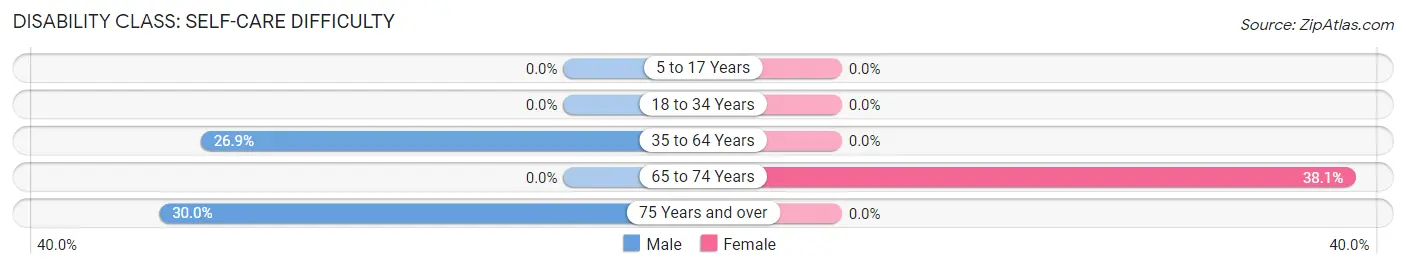
| Age Bracket | Male | Female |
| 5 to 17 Years | 0 (0.0%) | 0 (0.0%) |
| 18 to 34 Years | 0 (0.0%) | 0 (0.0%) |
| 35 to 64 Years | 7 (26.9%) | 0 (0.0%) |
| 65 to 74 Years | 0 (0.0%) | 8 (38.1%) |
| 75 Years and over | 3 (30.0%) | 0 (0.0%) |
Technology Access in Naper
Computing Device Access in Naper
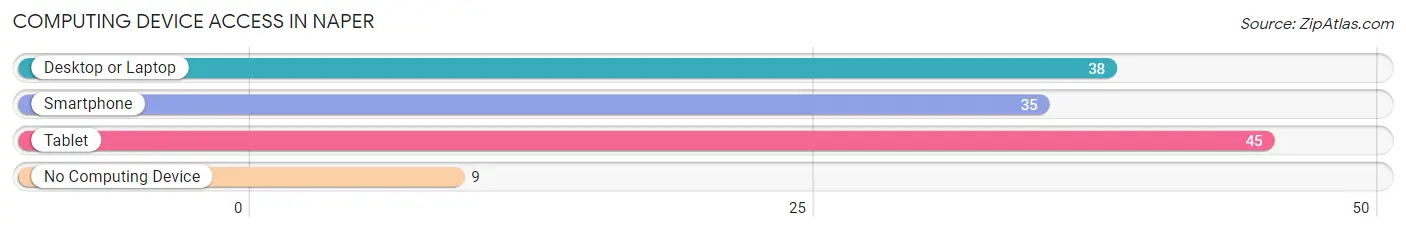
| Device Type | # Households | % Households |
| Desktop or Laptop | 38 | 53.5% |
| Smartphone | 35 | 49.3% |
| Tablet | 45 | 63.4% |
| No Computing Device | 9 | 12.7% |
| Total | 71 | 100.0% |
Internet Access in Naper
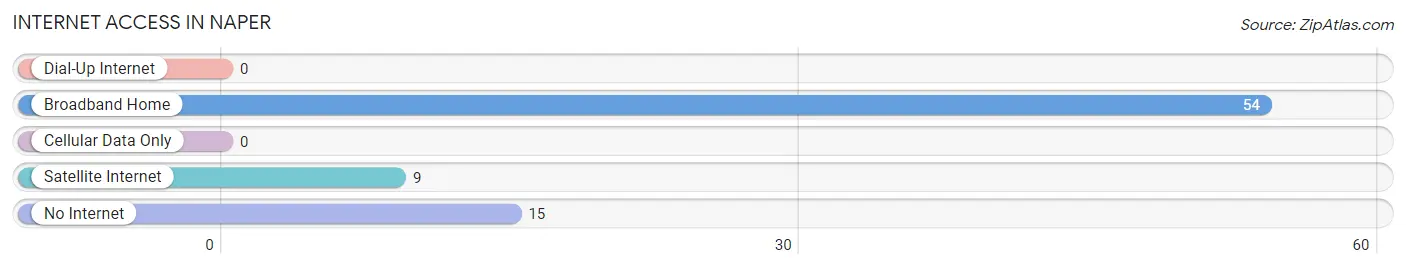
| Internet Type | # Households | % Households |
| Dial-Up Internet | 0 | 0.0% |
| Broadband Home | 54 | 76.1% |
| Cellular Data Only | 0 | 0.0% |
| Satellite Internet | 9 | 12.7% |
| No Internet | 15 | 21.1% |
| Total | 71 | 100.0% |
Naper Summary
Naper, Nebraska is a small town located in the southeastern corner of the state. It is situated in the heart of the Nebraska Sandhills, a region of rolling hills and grasslands that covers much of the state. The town was founded in 1887 and has a population of just over 500 people.
Naper is located in the Nebraska Panhandle, a region of the state that is bordered by South Dakota to the north and Wyoming to the west. The town is situated in the middle of the Sandhills, which are characterized by their rolling hills and grasslands. The area is known for its wide open spaces and is home to a variety of wildlife, including pronghorn antelope, mule deer, and wild turkeys.
The economy of Naper is largely based on agriculture. The town is home to several large farms, which produce a variety of crops, including corn, soybeans, and wheat. The town also has a small manufacturing sector, which produces a variety of products, including furniture, clothing, and food products.
The geography of Naper is characterized by its rolling hills and grasslands. The town is located in the middle of the Sandhills, which are characterized by their wide open spaces and abundant wildlife. The town is also located near the Niobrara River, which is a popular destination for fishing and boating.
The demographics of Naper are largely homogeneous. The town is predominantly white, with a small Hispanic population. The median household income in Naper is slightly below the state average, and the town has a higher than average poverty rate.
Naper is a small town with a rich history and a unique geography. The town is home to a variety of wildlife and is situated in the middle of the Nebraska Sandhills. The town has a largely agricultural economy, and its demographics are largely homogeneous. Despite its small size, Naper is a vibrant community with a strong sense of identity and pride.
Common Questions
What is Per Capita Income in Naper?
Per Capita income in Naper is $19,251.
What is the Median Family Income in Naper?
Median Family Income in Naper is $32,500.
What is the Median Household income in Naper?
Median Household Income in Naper is $27,083.
What is Income or Wage Gap in Naper?
Income or Wage Gap in Naper is 31.4%.
Women in Naper earn 68.6 cents for every dollar earned by a man.
What is Inequality or Gini Index in Naper?
Inequality or Gini Index in Naper is 0.40.
What is the Total Population of Naper?
Total Population of Naper is 156.
What is the Total Male Population of Naper?
Total Male Population of Naper is 88.
What is the Total Female Population of Naper?
Total Female Population of Naper is 68.
What is the Ratio of Males per 100 Females in Naper?
There are 129.41 Males per 100 Females in Naper.
What is the Ratio of Females per 100 Males in Naper?
There are 77.27 Females per 100 Males in Naper.
What is the Median Population Age in Naper?
Median Population Age in Naper is 45.0 Years.
What is the Average Family Size in Naper
Average Family Size in Naper is 3.2 People.
What is the Average Household Size in Naper
Average Household Size in Naper is 2.2 People.
How Large is the Labor Force in Naper?
There are 42 People in the Labor Forcein in Naper.
What is the Percentage of People in the Labor Force in Naper?
37.2% of People are in the Labor Force in Naper.