Area Code 218 Map & Demographics
Area Code 218 Map
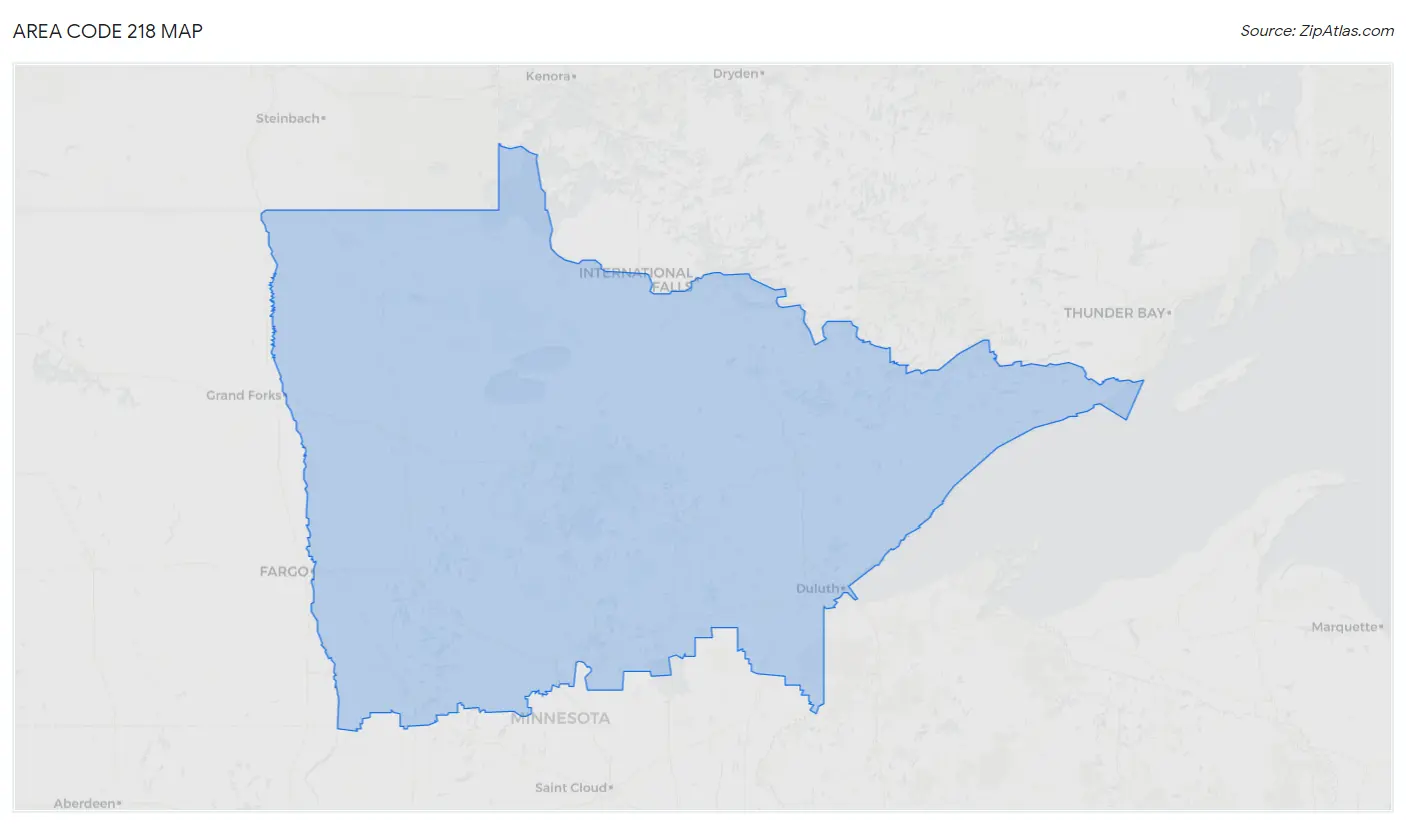
Area Code 218 Overview
$35,220
PER CAPITA INCOME
$83,832
AVG FAMILY INCOME
$66,438
AVG HOUSEHOLD INCOME
31.5%
WAGE / INCOME GAP [ % ]
68.5¢/ $1
WAGE / INCOME GAP [ $ ]
$10,141
FAMILY INCOME DEFICIT
115.23
INEQUALITY / GINI INDEX
794,247
TOTAL POPULATION
402,947
MALE POPULATION
391,300
FEMALE POPULATION
102.98
MALES / 100 FEMALES
97.11
FEMALES / 100 MALES
46.7
MEDIAN AGE
2.9
AVG FAMILY SIZE
2.4
AVG HOUSEHOLD SIZE
379,051
LABOR FORCE [ PEOPLE ]
58.9%
PERCENT IN LABOR FORCE
5.6%
UNEMPLOYMENT RATE
Income in Area Code 218
Income Overview in Area Code 218
Per Capita Income in Area Code 218 is $35,220, while median incomes of families and households are $83,832 and $66,438 respectively.
| Characteristic | Number | Measure |
| Per Capita Income | 794,247 | $35,220 |
| Median Family Income | 201,781 | $83,832 |
| Mean Family Income | 201,781 | $27,711,054 |
| Median Household Income | 327,427 | $66,438 |
| Mean Household Income | 327,427 | $23,346,043 |
| Income Deficit | 201,781 | $10,141 |
| Wage / Income Gap (%) | 794,247 | 31.50% |
| Wage / Income Gap ($) | 794,247 | 68.50¢ per $1 |
| Gini / Inequality Index | 794,247 | 115.23 |
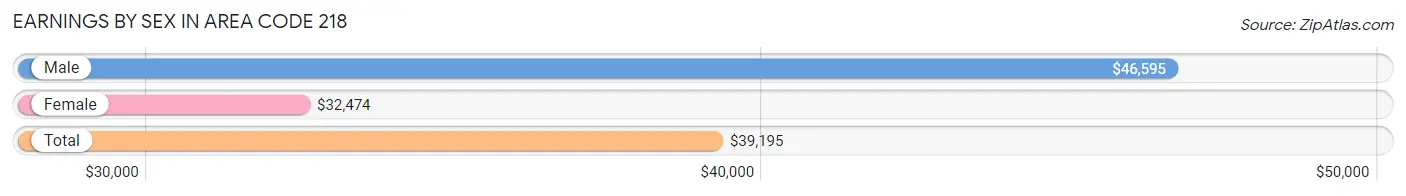
Earnings by Sex in Area Code 218
Average Earnings in Area Code 218 are $39,195, $46,595 for men and $32,474 for women, a difference of 30.3%.
| Sex | Number | Average Earnings |
| Male | 224,820 (53.0%) | $46,595 |
| Female | 199,670 (47.0%) | $32,474 |
| Total | 424,490 (100.0%) | $39,195 |
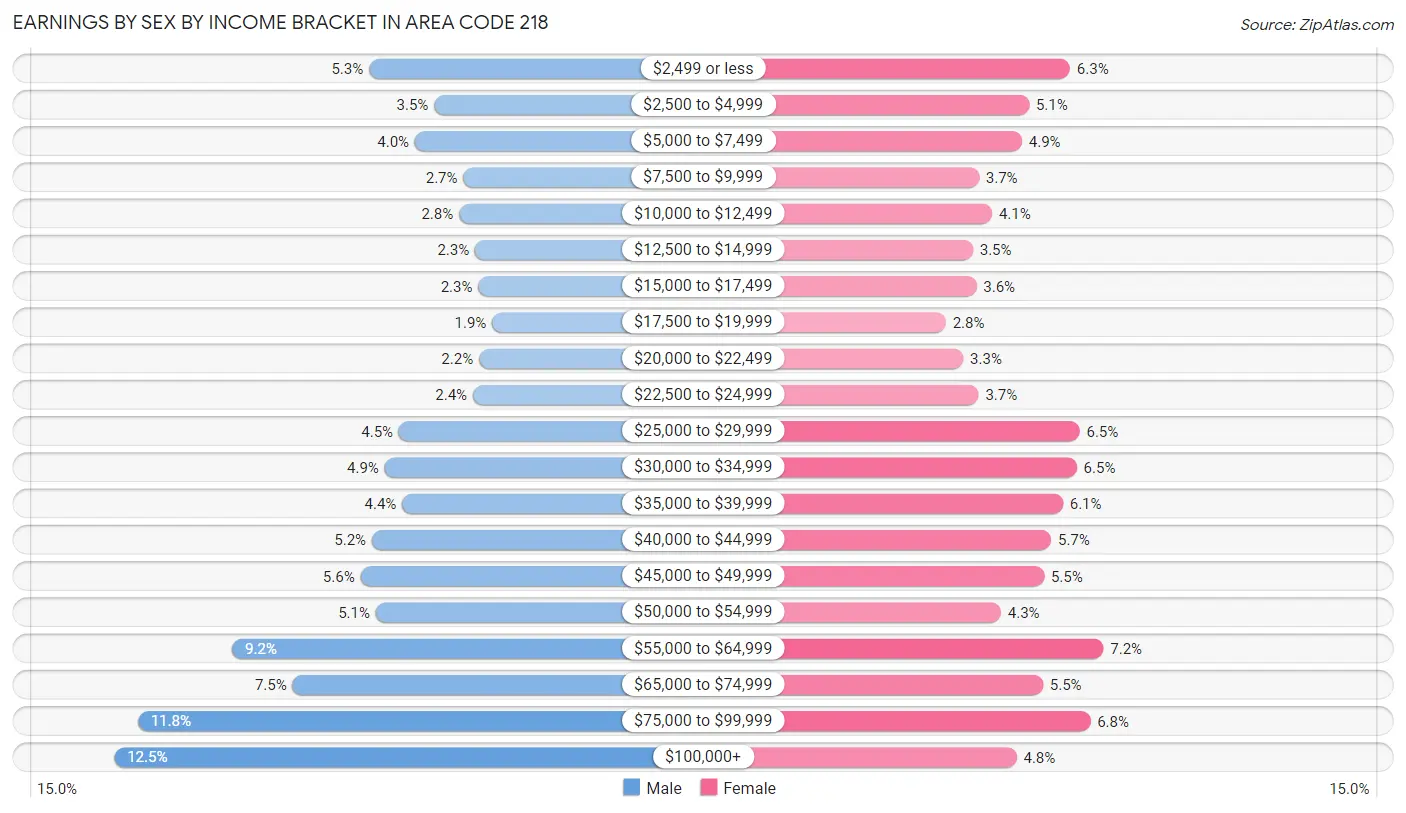
Earnings by Sex by Income Bracket in Area Code 218
The most common earnings brackets in Area Code 218 are $100,000+ for men (28,057 | 12.5%) and $55,000 to $64,999 for women (14,406 | 7.2%).
| Income | Male | Female |
| $2,499 or less | 11,952 (5.3%) | 12,514 (6.3%) |
| $2,500 to $4,999 | 7,843 (3.5%) | 10,222 (5.1%) |
| $5,000 to $7,499 | 9,069 (4.0%) | 9,816 (4.9%) |
| $7,500 to $9,999 | 6,010 (2.7%) | 7,410 (3.7%) |
| $10,000 to $12,499 | 6,281 (2.8%) | 8,141 (4.1%) |
| $12,500 to $14,999 | 5,258 (2.3%) | 7,062 (3.5%) |
| $15,000 to $17,499 | 5,055 (2.2%) | 7,261 (3.6%) |
| $17,500 to $19,999 | 4,177 (1.9%) | 5,548 (2.8%) |
| $20,000 to $22,499 | 5,022 (2.2%) | 6,538 (3.3%) |
| $22,500 to $24,999 | 5,403 (2.4%) | 7,382 (3.7%) |
| $25,000 to $29,999 | 10,065 (4.5%) | 13,056 (6.5%) |
| $30,000 to $34,999 | 10,964 (4.9%) | 12,889 (6.5%) |
| $35,000 to $39,999 | 9,866 (4.4%) | 12,111 (6.1%) |
| $40,000 to $44,999 | 11,780 (5.2%) | 11,455 (5.7%) |
| $45,000 to $49,999 | 12,495 (5.6%) | 11,057 (5.5%) |
| $50,000 to $54,999 | 11,524 (5.1%) | 8,637 (4.3%) |
| $55,000 to $64,999 | 20,612 (9.2%) | 14,406 (7.2%) |
| $65,000 to $74,999 | 16,804 (7.5%) | 10,997 (5.5%) |
| $75,000 to $99,999 | 26,583 (11.8%) | 13,649 (6.8%) |
| $100,000+ | 28,057 (12.5%) | 9,519 (4.8%) |
| Total | 224,820 (100.0%) | 199,670 (100.0%) |
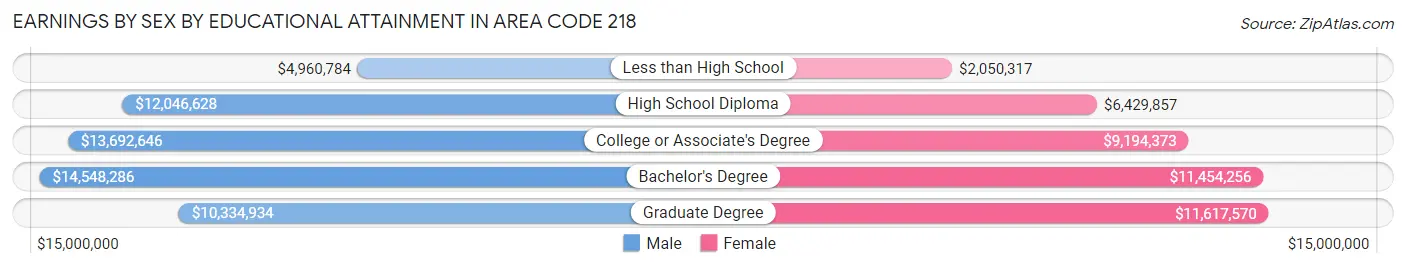
Earnings by Sex by Educational Attainment in Area Code 218
Average earnings in Area Code 218 are $14,059,738 for men and $9,725,769 for women, a difference of 30.8%. Men with an educational attainment of bachelor's degree enjoy the highest average annual earnings of $14,548,286, while those with less than high school education earn the least with $4,960,784. Women with an educational attainment of graduate degree earn the most with the average annual earnings of $11,617,570, while those with less than high school education have the smallest earnings of $2,050,317.
| Educational Attainment | Male Income | Female Income |
| Less than High School | $4,960,784 | $2,050,317 |
| High School Diploma | $12,046,628 | $6,429,857 |
| College or Associate's Degree | $13,692,646 | $9,194,373 |
| Bachelor's Degree | $14,548,286 | $11,454,256 |
| Graduate Degree | $10,334,934 | $11,617,570 |
| Total | $14,059,738 | $9,725,769 |
Family Income in Area Code 218
Family Income Brackets in Area Code 218
According to the Area Code 218 family income data, there are 12,564,903 families falling into the $100,000 to $149,999 income range, which is the most common income bracket and makes up 6,227.0% of all families. Conversely, the $10,000 to $14,999 income bracket is the least frequent group with only 947,967 families (469.8%) belonging to this category.
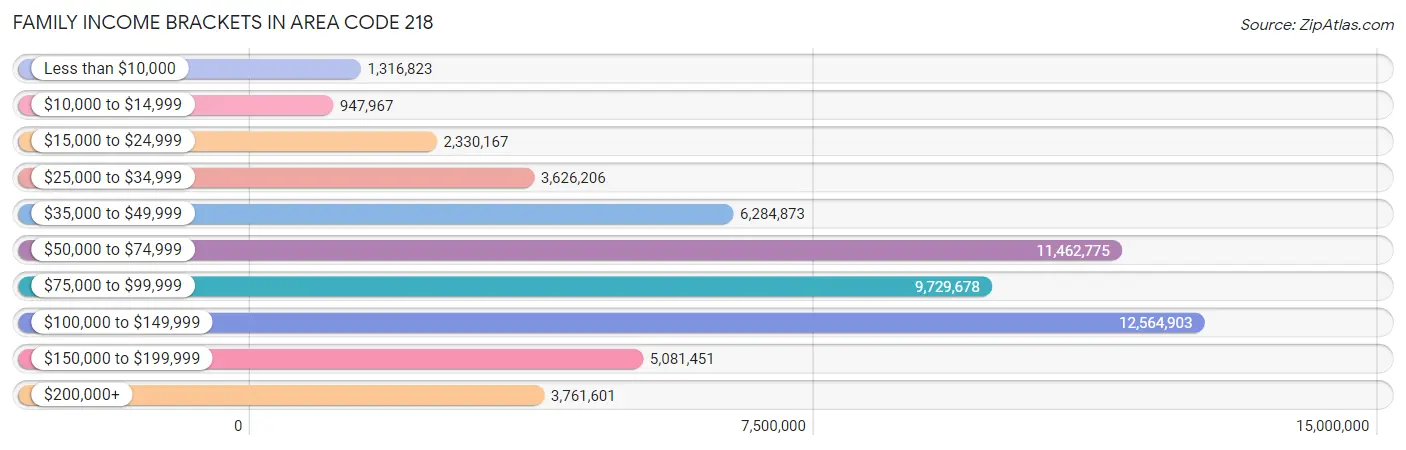
| Income Bracket | # Families | % Families |
| Less than $10,000 | 1,316,823 | 652.6% |
| $10,000 to $14,999 | 947,967 | 469.8% |
| $15,000 to $24,999 | 2,330,167 | 1,154.8% |
| $25,000 to $34,999 | 3,626,206 | 1,797.1% |
| $35,000 to $49,999 | 6,284,873 | 3,114.7% |
| $50,000 to $74,999 | 11,462,775 | 5,680.8% |
| $75,000 to $99,999 | 9,729,678 | 4,821.9% |
| $100,000 to $149,999 | 12,564,903 | 6,227.0% |
| $150,000 to $199,999 | 5,081,451 | 2,518.3% |
| $200,000+ | 3,761,601 | 1,864.2% |
Family Income by Famaliy Size in Area Code 218
7+ person families (3,367 | 1.7%) account for the highest median family income in Area Code 218 with $121,598 per family, while 2-person families (112,914 | 56.0%) have the highest median income of $37,617 per family member.
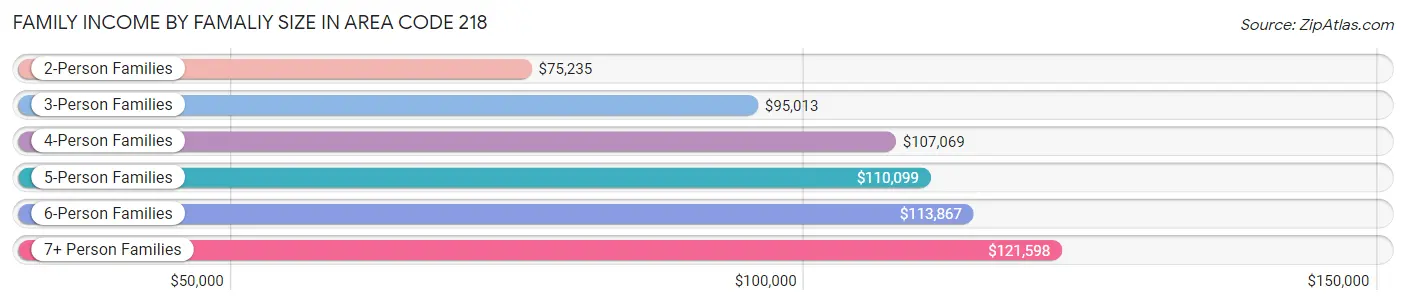
| Income Bracket | # Families | Median Income |
| 2-Person Families | 112,914 (56.0%) | $75,235 |
| 3-Person Families | 36,115 (17.9%) | $95,013 |
| 4-Person Families | 30,418 (15.1%) | $107,069 |
| 5-Person Families | 14,323 (7.1%) | $110,099 |
| 6-Person Families | 4,644 (2.3%) | $113,867 |
| 7+ Person Families | 3,367 (1.7%) | $121,598 |
| Total | 201,781 (100.0%) | $83,832 |
Family Income by Number of Earners in Area Code 218
The median family income in Area Code 218 is $83,832, with families comprising 3+ earners (20,553) having the highest median family income of $138,451, while families with no earners (37,859) have the lowest median family income of $55,731, accounting for 10.2% and 18.8% of families, respectively.
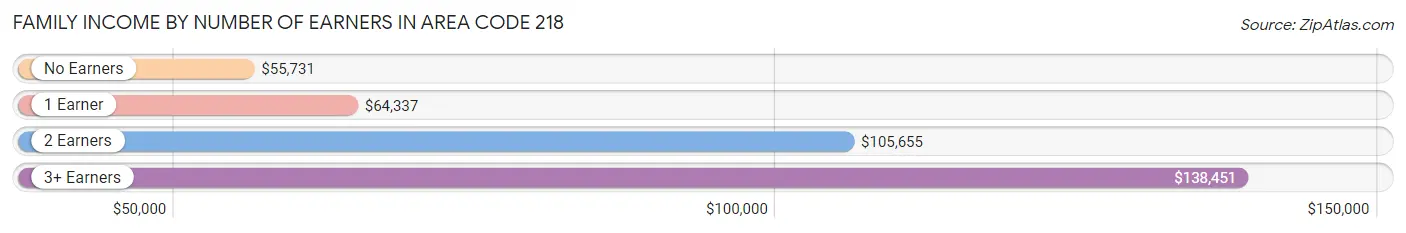
| Number of Earners | # Families | Median Income |
| No Earners | 37,859 (18.8%) | $55,731 |
| 1 Earner | 57,400 (28.4%) | $64,337 |
| 2 Earners | 85,969 (42.6%) | $105,655 |
| 3+ Earners | 20,553 (10.2%) | $138,451 |
| Total | 201,781 (100.0%) | $83,832 |
Household Income in Area Code 218
Household Income Brackets in Area Code 218
With 18,241,940 households falling in the category, the $50,000 to $74,999 income range is the most frequent in Area Code 218, accounting for 5,571.3% of all households. In contrast, only 4,232,321 households (1,292.6%) fall into the $10,000 to $14,999 income bracket, making it the least populous group.
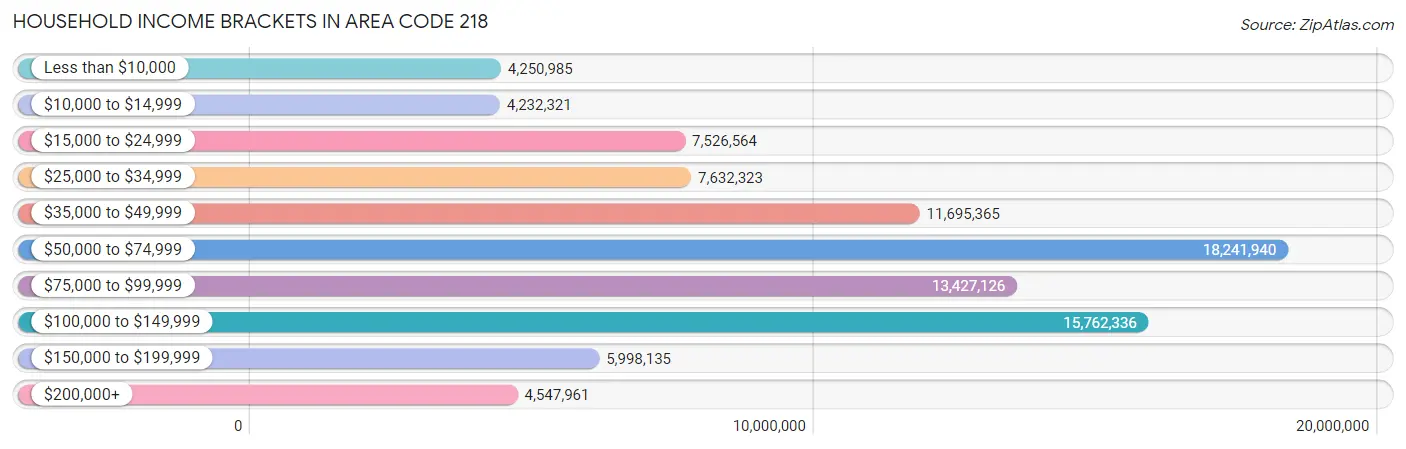
| Income Bracket | # Households | % Households |
| Less than $10,000 | 4,250,985 | 1,298.3% |
| $10,000 to $14,999 | 4,232,321 | 1,292.6% |
| $15,000 to $24,999 | 7,526,564 | 2,298.7% |
| $25,000 to $34,999 | 7,632,323 | 2,331.0% |
| $35,000 to $49,999 | 11,695,365 | 3,571.9% |
| $50,000 to $74,999 | 18,241,940 | 5,571.3% |
| $75,000 to $99,999 | 13,427,126 | 4,100.8% |
| $100,000 to $149,999 | 15,762,336 | 4,814.0% |
| $150,000 to $199,999 | 5,998,135 | 1,831.9% |
| $200,000+ | 4,547,961 | 1,389.0% |
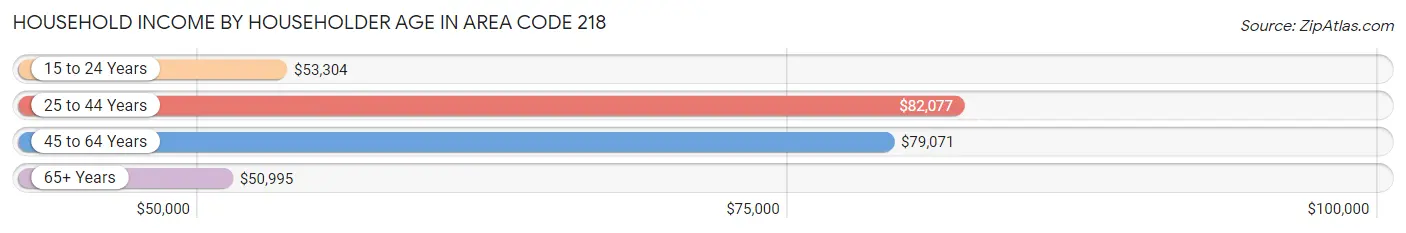
Household Income by Householder Age in Area Code 218
The median household income in Area Code 218 is $66,438, with the highest median household income of $82,077 found in the 25 to 44 years age bracket for the primary householder. A total of 89,682 households (27.4%) fall into this category. Meanwhile, the 65+ years age bracket for the primary householder has the lowest median household income of $50,995, with 104,499 households (31.9%) in this group.
| Income Bracket | # Households | Median Income |
| 15 to 24 Years | 16,450 (5.0%) | $53,304 |
| 25 to 44 Years | 89,682 (27.4%) | $82,077 |
| 45 to 64 Years | 116,796 (35.7%) | $79,071 |
| 65+ Years | 104,499 (31.9%) | $50,995 |
| Total | 327,427 (100.0%) | $66,438 |
Poverty in Area Code 218
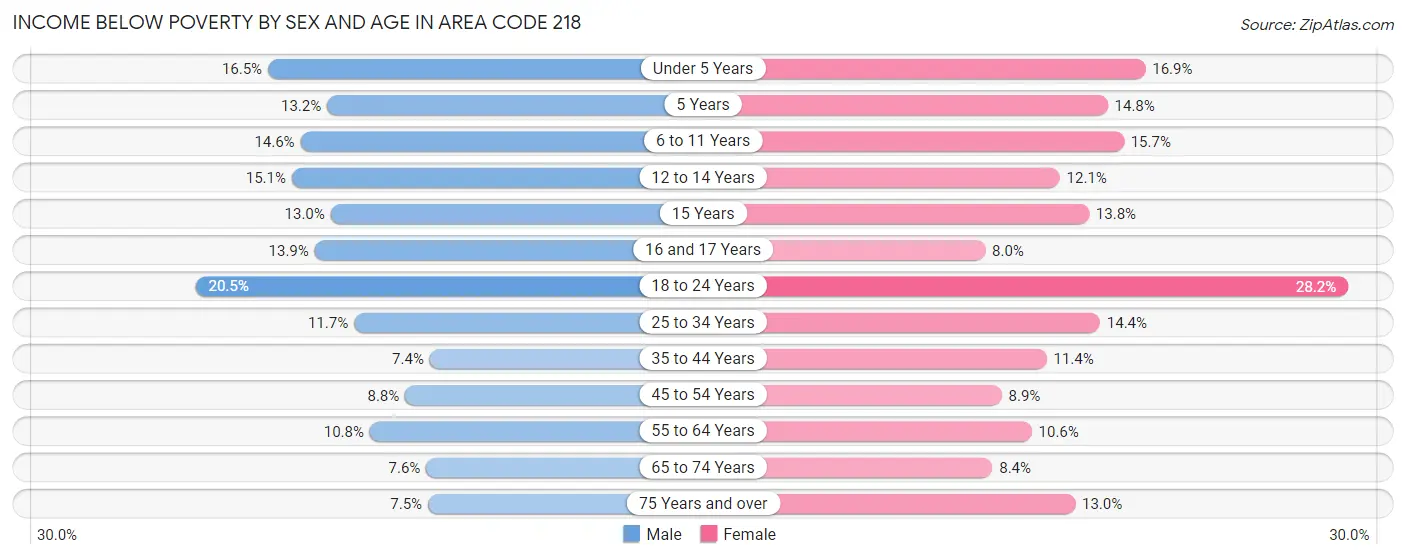
Income Below Poverty by Sex and Age in Area Code 218
With 11.4% poverty level for males and 13.1% for females among the residents of Area Code 218, 18 to 24 year old males and 18 to 24 year old females are the most vulnerable to poverty, with 6,975 males (20.5%) and 8,867 females (28.2%) in their respective age groups living below the poverty level.
| Age Bracket | Male | Female |
| Under 5 Years | 3,529 (16.5%) | 3,446 (16.9%) |
| 5 Years | 673 (13.2%) | 684 (14.8%) |
| 6 to 11 Years | 4,281 (14.6%) | 4,209 (15.7%) |
| 12 to 14 Years | 2,215 (15.1%) | 1,767 (12.1%) |
| 15 Years | 666 (13.0%) | 644 (13.8%) |
| 16 and 17 Years | 1,434 (13.9%) | 764 (8.0%) |
| 18 to 24 Years | 6,975 (20.5%) | 8,867 (28.2%) |
| 25 to 34 Years | 5,158 (11.7%) | 5,922 (14.4%) |
| 35 to 44 Years | 3,497 (7.4%) | 5,030 (11.4%) |
| 45 to 54 Years | 3,947 (8.8%) | 3,730 (8.9%) |
| 55 to 64 Years | 6,232 (10.8%) | 6,016 (10.6%) |
| 65 to 74 Years | 3,763 (7.6%) | 3,966 (8.4%) |
| 75 Years and over | 2,149 (7.5%) | 4,668 (13.0%) |
| Total | 44,519 (11.4%) | 49,713 (13.1%) |
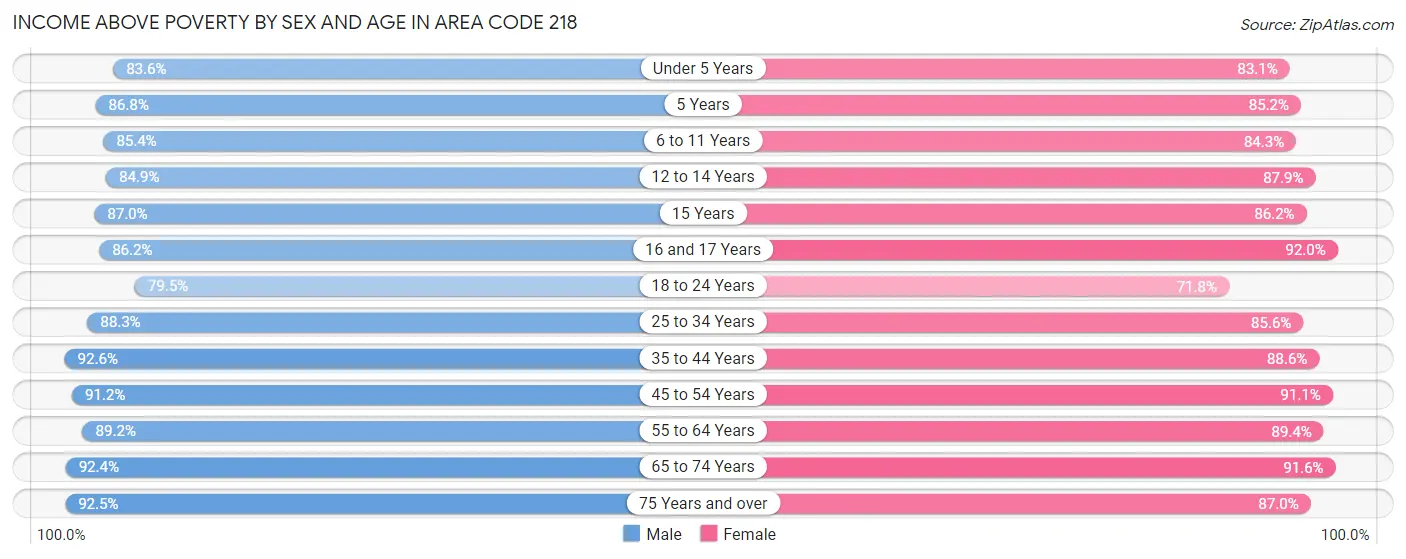
Income Above Poverty by Sex and Age in Area Code 218
According to the poverty statistics in Area Code 218, males aged 35 to 44 years and females aged 16 and 17 years are the age groups that are most secure financially, with 92.6% of males and 92.0% of females in these age groups living above the poverty line.
| Age Bracket | Male | Female |
| Under 5 Years | 17,929 (83.6%) | 16,944 (83.1%) |
| 5 Years | 4,441 (86.8%) | 3,937 (85.2%) |
| 6 to 11 Years | 24,968 (85.4%) | 22,592 (84.3%) |
| 12 to 14 Years | 12,434 (84.9%) | 12,800 (87.9%) |
| 15 Years | 4,471 (87.0%) | 4,036 (86.2%) |
| 16 and 17 Years | 8,918 (86.2%) | 8,804 (92.0%) |
| 18 to 24 Years | 27,088 (79.5%) | 22,589 (71.8%) |
| 25 to 34 Years | 39,074 (88.3%) | 35,302 (85.6%) |
| 35 to 44 Years | 43,499 (92.6%) | 39,094 (88.6%) |
| 45 to 54 Years | 40,856 (91.2%) | 38,193 (91.1%) |
| 55 to 64 Years | 51,584 (89.2%) | 50,912 (89.4%) |
| 65 to 74 Years | 45,498 (92.4%) | 43,367 (91.6%) |
| 75 Years and over | 26,365 (92.5%) | 31,280 (87.0%) |
| Total | 347,125 (88.6%) | 329,850 (86.9%) |
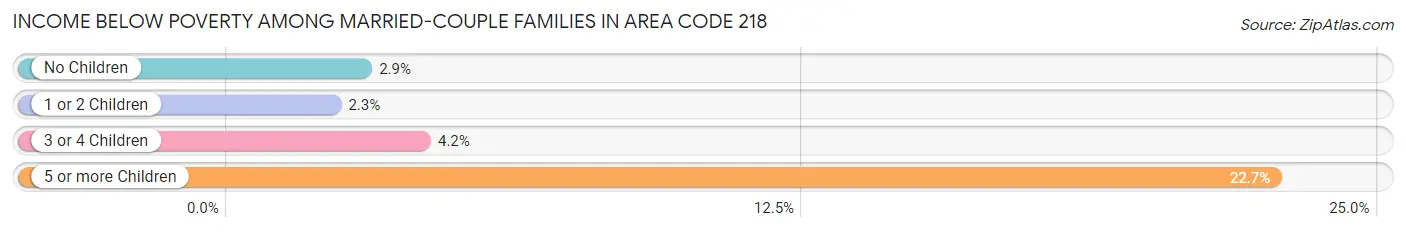
Income Below Poverty Among Married-Couple Families in Area Code 218
The poverty statistics for married-couple families in Area Code 218 show that 3.1% or 4,930 of the total 159,170 families live below the poverty line. Families with 5 or more children have the highest poverty rate of 22.7%, comprising of 447 families. On the other hand, families with 1 or 2 children have the lowest poverty rate of 2.2%, which includes 907 families.
| Children | Above Poverty | Below Poverty |
| No Children | 100,899 (97.1%) | 3,033 (2.9%) |
| 1 or 2 Children | 39,438 (97.8%) | 907 (2.2%) |
| 3 or 4 Children | 12,383 (95.8%) | 543 (4.2%) |
| 5 or more Children | 1,520 (77.3%) | 447 (22.7%) |
| Total | 154,240 (96.9%) | 4,930 (3.1%) |
Income Below Poverty Among Single-Parent Households in Area Code 218
According to the poverty data in Area Code 218, 11.8% or 1,767 single-father households and 27.0% or 7,471 single-mother households are living below the poverty line. Among single-father households, those with 5 or more children have the highest poverty rate, with 69 households (34.7%) experiencing poverty. Likewise, among single-mother households, those with 5 or more children have the highest poverty rate, with 291 households (70.6%) falling below the poverty line.
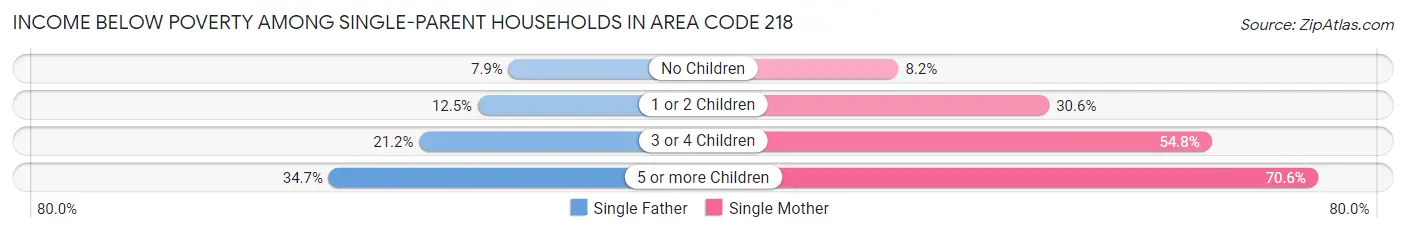
| Children | Single Father | Single Mother |
| No Children | 457 (7.9%) | 745 (8.2%) |
| 1 or 2 Children | 931 (12.4%) | 4,445 (30.6%) |
| 3 or 4 Children | 310 (21.2%) | 1,990 (54.8%) |
| 5 or more Children | 69 (34.7%) | 291 (70.6%) |
| Total | 1,767 (11.8%) | 7,471 (27.0%) |
Income Below Poverty Among Married-Couple vs Single-Parent Households in Area Code 218
The poverty data for Area Code 218 shows that 4,930 of the married-couple family households (3.1%) and 9,238 of the single-parent households (21.7%) are living below the poverty level. Within the married-couple family households, those with 5 or more children have the highest poverty rate, with 447 households (22.7%) falling below the poverty line. Among the single-parent households, those with 5 or more children have the highest poverty rate, with 360 household (58.9%) living below poverty.
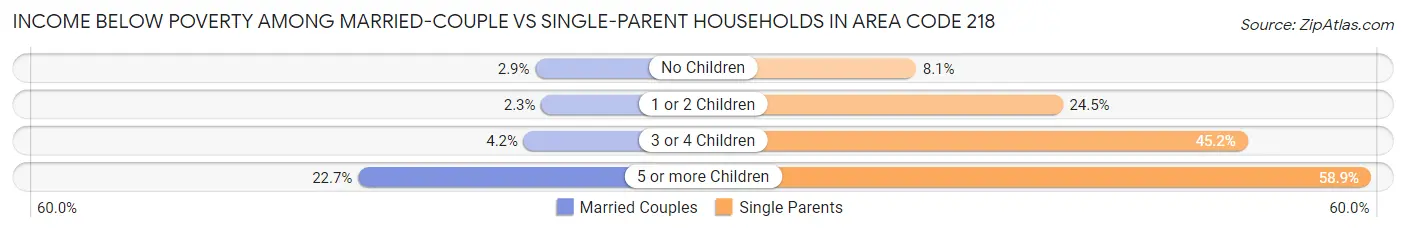
| Children | Married-Couple Families | Single-Parent Households |
| No Children | 3,033 (2.9%) | 1,202 (8.1%) |
| 1 or 2 Children | 907 (2.2%) | 5,376 (24.4%) |
| 3 or 4 Children | 543 (4.2%) | 2,300 (45.2%) |
| 5 or more Children | 447 (22.7%) | 360 (58.9%) |
| Total | 4,930 (3.1%) | 9,238 (21.7%) |
Race in Area Code 218
The most populous races in Area Code 218 are White / Caucasian (706,653 | 89.0%), Two or more Races (37,363 | 4.7%), and Native / Alaskan (26,779 | 3.4%).
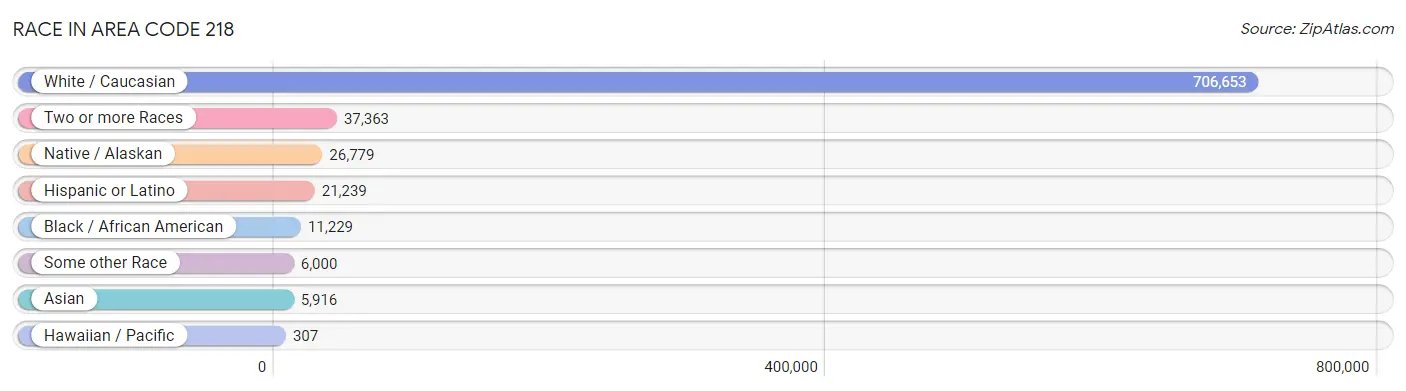
| Race | # Population | % Population |
| Asian | 5,916 | 0.7% |
| Black / African American | 11,229 | 1.4% |
| Hawaiian / Pacific | 307 | 0.0% |
| Hispanic or Latino | 21,239 | 2.7% |
| Native / Alaskan | 26,779 | 3.4% |
| White / Caucasian | 706,653 | 89.0% |
| Two or more Races | 37,363 | 4.7% |
| Some other Race | 6,000 | 0.8% |
| Total | 794,247 | 100.0% |
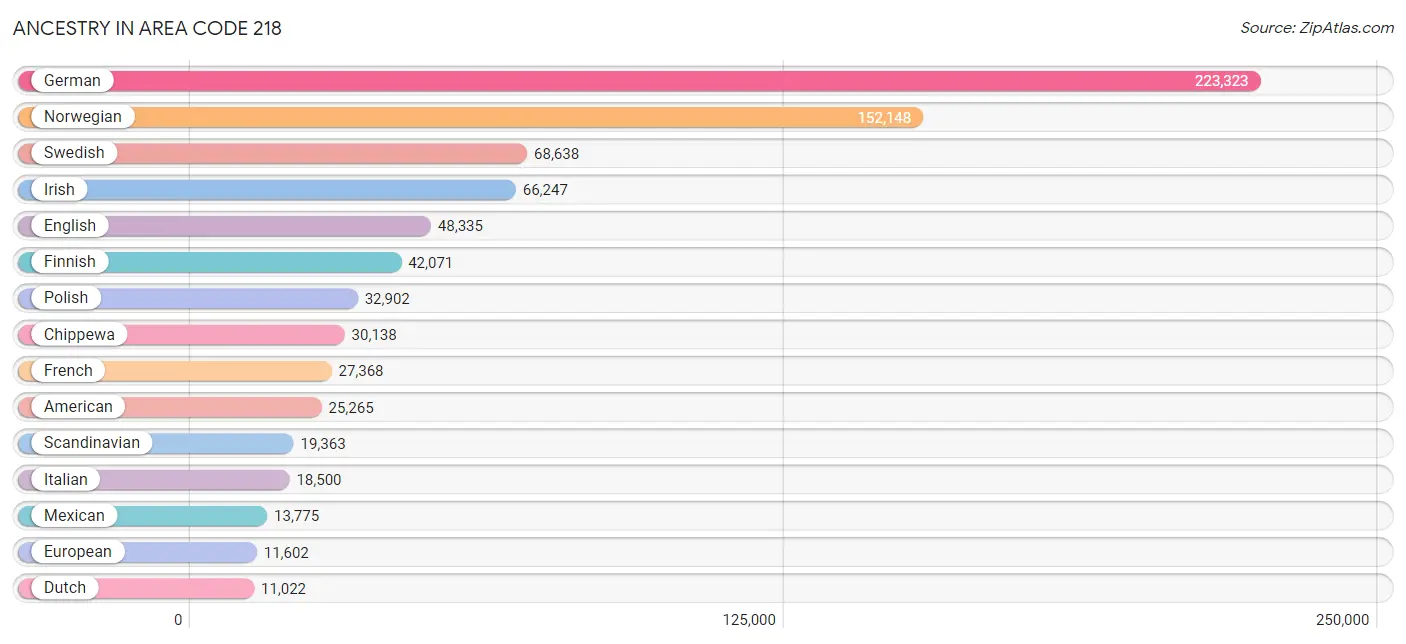
Ancestry in Area Code 218
The most populous ancestries reported in Area Code 218 are German (223,323 | 28.1%), Norwegian (152,148 | 19.2%), Swedish (68,638 | 8.6%), Irish (66,247 | 8.3%), and English (48,335 | 6.1%), together accounting for 70.4% of all Area Code 218 residents.
| Ancestry | # Population | % Population |
| African | 1,377 | 0.2% |
| Alaska Native | 62 | 0.0% |
| Alaskan Athabascan | 13 | 0.0% |
| Albanian | 68 | 0.0% |
| Aleut | 25 | 0.0% |
| Alsatian | 5 | 0.0% |
| American | 25,265 | 3.2% |
| Apache | 118 | 0.0% |
| Arab | 2,736 | 0.3% |
| Argentinean | 27 | 0.0% |
| Armenian | 80 | 0.0% |
| Australian | 107 | 0.0% |
| Austrian | 1,371 | 0.2% |
| Bahamian | 22 | 0.0% |
| Bangladeshi | 787 | 0.1% |
| Barbadian | 18 | 0.0% |
| Basque | 33 | 0.0% |
| Belgian | 1,562 | 0.2% |
| Belizean | 8 | 0.0% |
| Bhutanese | 737 | 0.1% |
| Blackfeet | 260 | 0.0% |
| Bolivian | 84 | 0.0% |
| Brazilian | 122 | 0.0% |
| British | 2,449 | 0.3% |
| British West Indian | 70 | 0.0% |
| Bulgarian | 97 | 0.0% |
| Burmese | 1,183 | 0.2% |
| Cajun | 59 | 0.0% |
| Cambodian | 39 | 0.0% |
| Canadian | 1,063 | 0.1% |
| Carpatho Rusyn | 3 | 0.0% |
| Celtic | 148 | 0.0% |
| Central American | 1,548 | 0.2% |
| Central American Indian | 102 | 0.0% |
| Cherokee | 1,052 | 0.1% |
| Cheyenne | 46 | 0.0% |
| Chickasaw | 7 | 0.0% |
| Chilean | 83 | 0.0% |
| Chinese | 3 | 0.0% |
| Chippewa | 30,138 | 3.8% |
| Choctaw | 338 | 0.0% |
| Colombian | 376 | 0.1% |
| Colville | 13 | 0.0% |
| Comanche | 25 | 0.0% |
| Costa Rican | 68 | 0.0% |
| Cree | 288 | 0.0% |
| Creek | 15 | 0.0% |
| Croatian | 2,791 | 0.4% |
| Crow | 12 | 0.0% |
| Cuban | 569 | 0.1% |
| Czech | 9,617 | 1.2% |
| Czechoslovakian | 1,298 | 0.2% |
| Danish | 8,730 | 1.1% |
| Delaware | 33 | 0.0% |
| Dominican | 107 | 0.0% |
| Dutch | 11,022 | 1.4% |
| Dutch West Indian | 20 | 0.0% |
| Eastern European | 1,448 | 0.2% |
| Ecuadorian | 238 | 0.0% |
| Egyptian | 23 | 0.0% |
| English | 48,335 | 6.1% |
| Estonian | 43 | 0.0% |
| Ethiopian | 225 | 0.0% |
| European | 11,602 | 1.5% |
| Fijian | 51 | 0.0% |
| Filipino | 45 | 0.0% |
| Finnish | 42,071 | 5.3% |
| French | 27,368 | 3.5% |
| French American Indian | 317 | 0.0% |
| French Canadian | 9,504 | 1.2% |
| German | 223,323 | 28.1% |
| German Russian | 256 | 0.0% |
| Ghanaian | 18 | 0.0% |
| Greek | 1,008 | 0.1% |
| Guamanian / Chamorro | 41 | 0.0% |
| Guatemalan | 758 | 0.1% |
| Haitian | 333 | 0.0% |
| Hmong | 1 | 0.0% |
| Honduran | 161 | 0.0% |
| Hopi | 9 | 0.0% |
| Houma | 2 | 0.0% |
| Hungarian | 1,153 | 0.2% |
| Icelander | 815 | 0.1% |
| Indian (Asian) | 1,655 | 0.2% |
| Indonesian | 57 | 0.0% |
| Inupiat | 36 | 0.0% |
| Iranian | 163 | 0.0% |
| Iraqi | 157 | 0.0% |
| Irish | 66,247 | 8.3% |
| Iroquois | 187 | 0.0% |
| Israeli | 74 | 0.0% |
| Italian | 18,500 | 2.3% |
| Jamaican | 111 | 0.0% |
| Japanese | 66 | 0.0% |
| Jordanian | 18 | 0.0% |
| Kenyan | 298 | 0.0% |
| Kiowa | 10 | 0.0% |
| Korean | 2,222 | 0.3% |
| Laotian | 11 | 0.0% |
| Latvian | 198 | 0.0% |
| Lebanese | 754 | 0.1% |
| Liberian | 166 | 0.0% |
| Lithuanian | 528 | 0.1% |
| Lumbee | 1 | 0.0% |
| Luxembourger | 237 | 0.0% |
| Macedonian | 19 | 0.0% |
| Malaysian | 445 | 0.1% |
| Maltese | 19 | 0.0% |
| Menominee | 30 | 0.0% |
| Mexican | 13,775 | 1.7% |
| Mexican American Indian | 93 | 0.0% |
| Mongolian | 11 | 0.0% |
| Moroccan | 7 | 0.0% |
| Native Hawaiian | 297 | 0.0% |
| Navajo | 416 | 0.1% |
| New Zealander | 5 | 0.0% |
| Nicaraguan | 78 | 0.0% |
| Nigerian | 188 | 0.0% |
| Northern European | 1,539 | 0.2% |
| Norwegian | 152,148 | 19.2% |
| Osage | 8 | 0.0% |
| Ottawa | 46 | 0.0% |
| Paiute | 19 | 0.0% |
| Pakistani | 149 | 0.0% |
| Palestinian | 44 | 0.0% |
| Panamanian | 215 | 0.0% |
| Paraguayan | 4 | 0.0% |
| Pennsylvania German | 355 | 0.0% |
| Peruvian | 34 | 0.0% |
| Polish | 32,902 | 4.1% |
| Portuguese | 312 | 0.0% |
| Potawatomi | 36 | 0.0% |
| Pueblo | 25 | 0.0% |
| Puerto Rican | 1,572 | 0.2% |
| Romanian | 500 | 0.1% |
| Russian | 3,960 | 0.5% |
| Salvadoran | 268 | 0.0% |
| Samoan | 104 | 0.0% |
| Scandinavian | 19,363 | 2.4% |
| Scotch-Irish | 3,618 | 0.5% |
| Scottish | 8,489 | 1.1% |
| Seminole | 22 | 0.0% |
| Senegalese | 8 | 0.0% |
| Serbian | 1,496 | 0.2% |
| Shoshone | 24 | 0.0% |
| Sierra Leonean | 2 | 0.0% |
| Sioux | 1,697 | 0.2% |
| Slavic | 800 | 0.1% |
| Slovak | 744 | 0.1% |
| Slovene | 3,582 | 0.4% |
| Somali | 993 | 0.1% |
| South African | 91 | 0.0% |
| South American | 1,035 | 0.1% |
| South American Indian | 14 | 0.0% |
| Soviet Union | 1 | 0.0% |
| Spaniard | 617 | 0.1% |
| Spanish | 549 | 0.1% |
| Spanish American | 23 | 0.0% |
| Sri Lankan | 1,033 | 0.1% |
| Subsaharan African | 3,918 | 0.5% |
| Sudanese | 2 | 0.0% |
| Swedish | 68,638 | 8.6% |
| Swiss | 1,927 | 0.2% |
| Syrian | 329 | 0.0% |
| Thai | 956 | 0.1% |
| Tlingit-Haida | 50 | 0.0% |
| Tohono O'Odham | 25 | 0.0% |
| Tongan | 2 | 0.0% |
| Trinidadian and Tobagonian | 24 | 0.0% |
| Turkish | 259 | 0.0% |
| Ugandan | 141 | 0.0% |
| Ukrainian | 1,628 | 0.2% |
| Uruguayan | 26 | 0.0% |
| Ute | 4 | 0.0% |
| Venezuelan | 148 | 0.0% |
| Vietnamese | 23 | 0.0% |
| Welsh | 2,482 | 0.3% |
| West Indian | 78 | 0.0% |
| Yakama | 49 | 0.0% |
| Yaqui | 4 | 0.0% |
| Yugoslavian | 1,509 | 0.2% |
| Yuman | 13 | 0.0% |
| Yup'ik | 45 | 0.0% |
| Zimbabwean | 8 | 0.0% | View All 184 Rows |
Immigrants in Area Code 218
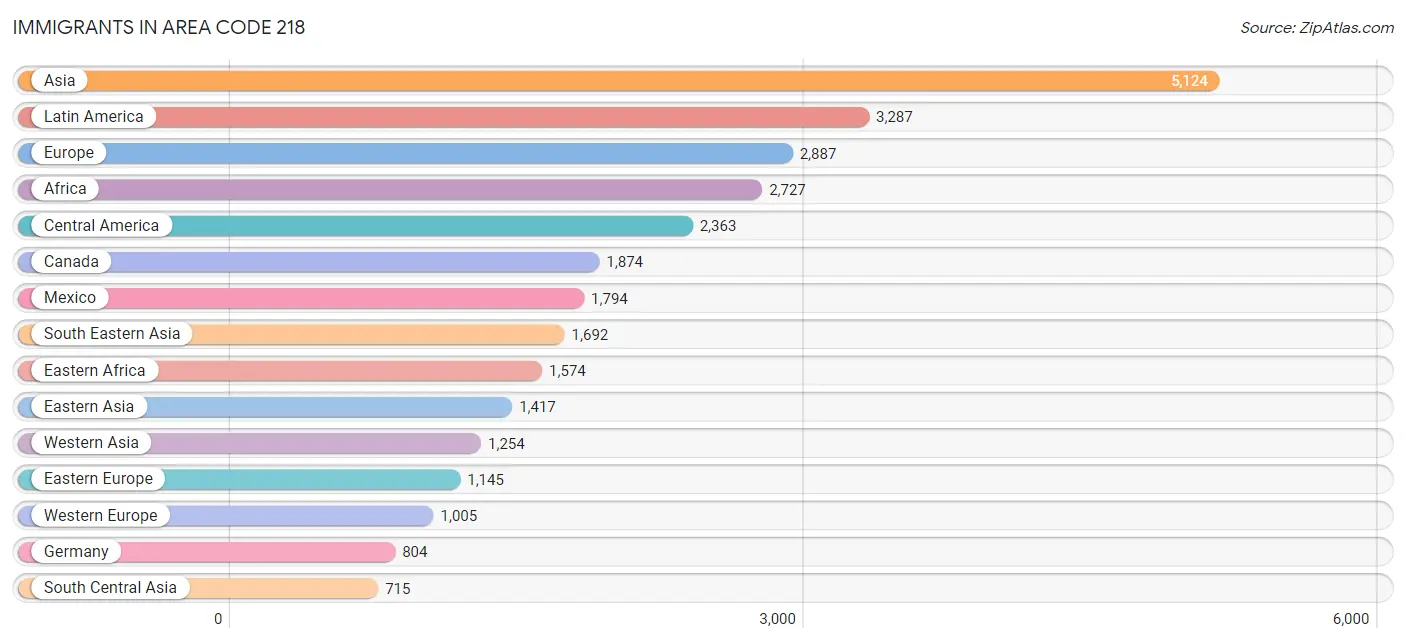
The most numerous immigrant groups reported in Area Code 218 came from Asia (5,124 | 0.6%), Latin America (3,287 | 0.4%), Europe (2,887 | 0.4%), Africa (2,727 | 0.3%), and Central America (2,363 | 0.3%), together accounting for 2.1% of all Area Code 218 residents.
| Immigration Origin | # Population | % Population |
| Africa | 2,727 | 0.3% |
| Argentina | 18 | 0.0% |
| Asia | 5,124 | 0.6% |
| Australia | 74 | 0.0% |
| Austria | 43 | 0.0% |
| Bahamas | 8 | 0.0% |
| Bangladesh | 17 | 0.0% |
| Belgium | 4 | 0.0% |
| Belize | 7 | 0.0% |
| Bolivia | 19 | 0.0% |
| Bosnia and Herzegovina | 261 | 0.0% |
| Brazil | 135 | 0.0% |
| Bulgaria | 25 | 0.0% |
| Cambodia | 15 | 0.0% |
| Cameroon | 2 | 0.0% |
| Canada | 1,874 | 0.2% |
| Caribbean | 235 | 0.0% |
| Central America | 2,363 | 0.3% |
| Chile | 40 | 0.0% |
| China | 677 | 0.1% |
| Colombia | 182 | 0.0% |
| Congo | 33 | 0.0% |
| Costa Rica | 29 | 0.0% |
| Cuba | 12 | 0.0% |
| Czechoslovakia | 20 | 0.0% |
| Denmark | 23 | 0.0% |
| Dominica | 3 | 0.0% |
| Dominican Republic | 24 | 0.0% |
| Eastern Africa | 1,574 | 0.2% |
| Eastern Asia | 1,417 | 0.2% |
| Eastern Europe | 1,145 | 0.1% |
| Ecuador | 113 | 0.0% |
| Egypt | 12 | 0.0% |
| El Salvador | 56 | 0.0% |
| England | 247 | 0.0% |
| Eritrea | 19 | 0.0% |
| Ethiopia | 238 | 0.0% |
| Europe | 2,887 | 0.4% |
| France | 31 | 0.0% |
| Germany | 804 | 0.1% |
| Ghana | 139 | 0.0% |
| Guatemala | 317 | 0.0% |
| Guyana | 8 | 0.0% |
| Haiti | 86 | 0.0% |
| Honduras | 114 | 0.0% |
| Hong Kong | 46 | 0.0% |
| Hungary | 6 | 0.0% |
| India | 453 | 0.1% |
| Indonesia | 11 | 0.0% |
| Iran | 45 | 0.0% |
| Iraq | 572 | 0.1% |
| Ireland | 8 | 0.0% |
| Israel | 47 | 0.0% |
| Italy | 67 | 0.0% |
| Jamaica | 47 | 0.0% |
| Japan | 113 | 0.0% |
| Jordan | 33 | 0.0% |
| Kazakhstan | 11 | 0.0% |
| Kenya | 446 | 0.1% |
| Korea | 627 | 0.1% |
| Laos | 358 | 0.1% |
| Latin America | 3,287 | 0.4% |
| Latvia | 15 | 0.0% |
| Lebanon | 12 | 0.0% |
| Liberia | 134 | 0.0% |
| Lithuania | 60 | 0.0% |
| Malaysia | 33 | 0.0% |
| Mexico | 1,794 | 0.2% |
| Micronesia | 17 | 0.0% |
| Middle Africa | 136 | 0.0% |
| Moldova | 20 | 0.0% |
| Nepal | 109 | 0.0% |
| Netherlands | 79 | 0.0% |
| Nicaragua | 15 | 0.0% |
| Nigeria | 178 | 0.0% |
| Northern Africa | 27 | 0.0% |
| Northern Europe | 636 | 0.1% |
| Norway | 39 | 0.0% |
| Oceania | 123 | 0.0% |
| Pakistan | 25 | 0.0% |
| Panama | 31 | 0.0% |
| Peru | 23 | 0.0% |
| Philippines | 631 | 0.1% |
| Poland | 119 | 0.0% |
| Portugal | 10 | 0.0% |
| Romania | 71 | 0.0% |
| Russia | 263 | 0.0% |
| Scotland | 15 | 0.0% |
| Senegal | 26 | 0.0% |
| Sierra Leone | 2 | 0.0% |
| Somalia | 587 | 0.1% |
| South Africa | 112 | 0.0% |
| South America | 689 | 0.1% |
| South Central Asia | 715 | 0.1% |
| South Eastern Asia | 1,692 | 0.2% |
| Southern Europe | 101 | 0.0% |
| Spain | 24 | 0.0% |
| Sri Lanka | 9 | 0.0% |
| Sudan | 9 | 0.0% |
| Sweden | 35 | 0.0% |
| Switzerland | 44 | 0.0% |
| Syria | 454 | 0.1% |
| Taiwan | 34 | 0.0% |
| Thailand | 252 | 0.0% |
| Trinidad and Tobago | 49 | 0.0% |
| Turkey | 124 | 0.0% |
| Uganda | 98 | 0.0% |
| Ukraine | 134 | 0.0% |
| Uruguay | 13 | 0.0% |
| Uzbekistan | 46 | 0.0% |
| Venezuela | 136 | 0.0% |
| Vietnam | 368 | 0.1% |
| Western Africa | 671 | 0.1% |
| Western Asia | 1,254 | 0.2% |
| Western Europe | 1,005 | 0.1% |
| Zaire | 101 | 0.0% |
| Zimbabwe | 65 | 0.0% | View All 117 Rows |
Sex and Age in Area Code 218
Sex and Age in Area Code 218
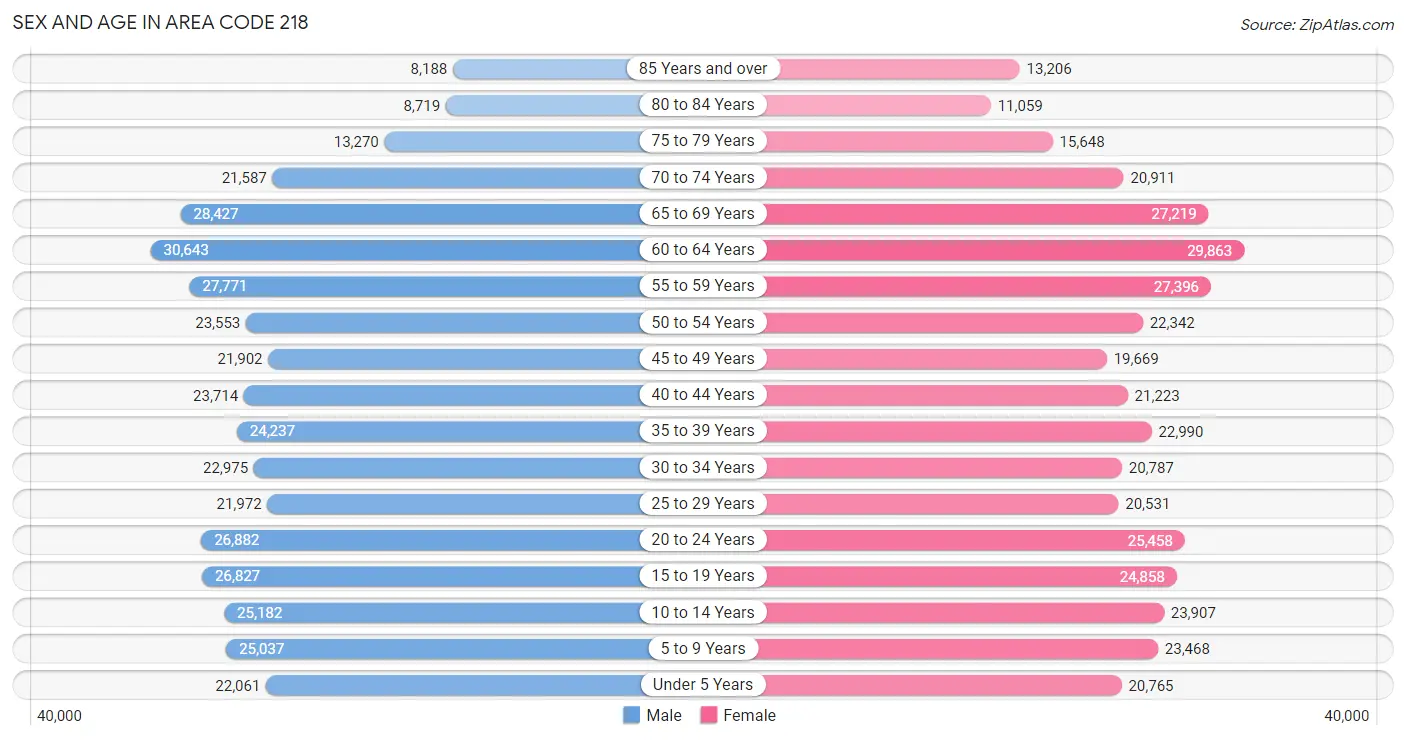
The most populous age groups in Area Code 218 are 60 to 64 Years (30,643 | 7.6%) for men and 60 to 64 Years (29,863 | 7.6%) for women.
| Age Bracket | Male | Female |
| Under 5 Years | 22,061 (5.5%) | 20,765 (5.3%) |
| 5 to 9 Years | 25,037 (6.2%) | 23,468 (6.0%) |
| 10 to 14 Years | 25,182 (6.2%) | 23,907 (6.1%) |
| 15 to 19 Years | 26,827 (6.7%) | 24,858 (6.4%) |
| 20 to 24 Years | 26,882 (6.7%) | 25,458 (6.5%) |
| 25 to 29 Years | 21,972 (5.4%) | 20,531 (5.2%) |
| 30 to 34 Years | 22,975 (5.7%) | 20,787 (5.3%) |
| 35 to 39 Years | 24,237 (6.0%) | 22,990 (5.9%) |
| 40 to 44 Years | 23,714 (5.9%) | 21,223 (5.4%) |
| 45 to 49 Years | 21,902 (5.4%) | 19,669 (5.0%) |
| 50 to 54 Years | 23,553 (5.9%) | 22,342 (5.7%) |
| 55 to 59 Years | 27,771 (6.9%) | 27,396 (7.0%) |
| 60 to 64 Years | 30,643 (7.6%) | 29,863 (7.6%) |
| 65 to 69 Years | 28,427 (7.0%) | 27,219 (7.0%) |
| 70 to 74 Years | 21,587 (5.4%) | 20,911 (5.3%) |
| 75 to 79 Years | 13,270 (3.3%) | 15,648 (4.0%) |
| 80 to 84 Years | 8,719 (2.2%) | 11,059 (2.8%) |
| 85 Years and over | 8,188 (2.0%) | 13,206 (3.4%) |
| Total | 402,947 (100.0%) | 391,300 (100.0%) |
Families and Households in Area Code 218
Median Family Size in Area Code 218
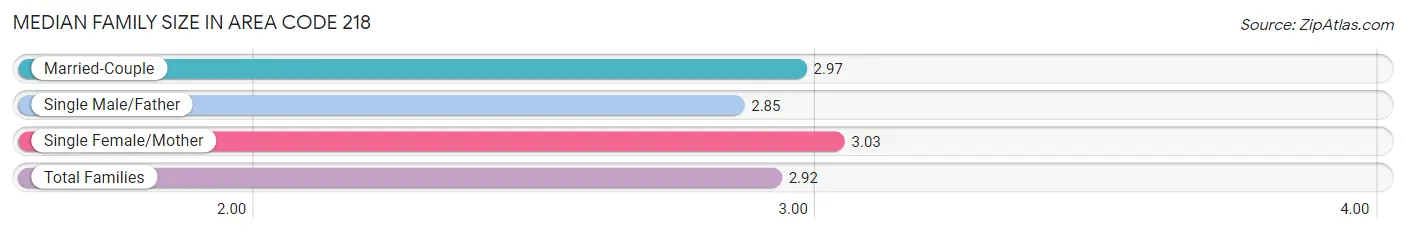
The median family size in Area Code 218 is 2.92 persons per family, with single female/mother families (27,673 | 13.7%) accounting for the largest median family size of 3.03287 persons per family. On the other hand, single male/father families (14,938 | 7.4%) represent the smallest median family size with 2.85 persons per family.
| Family Type | # Families | Family Size |
| Married-Couple | 159,170 (78.9%) | 2.97 |
| Single Male/Father | 14,938 (7.4%) | 2.85 |
| Single Female/Mother | 27,673 (13.7%) | 3.03 |
| Total Families | 201,781 (100.0%) | 2.92 |
Median Household Size in Area Code 218
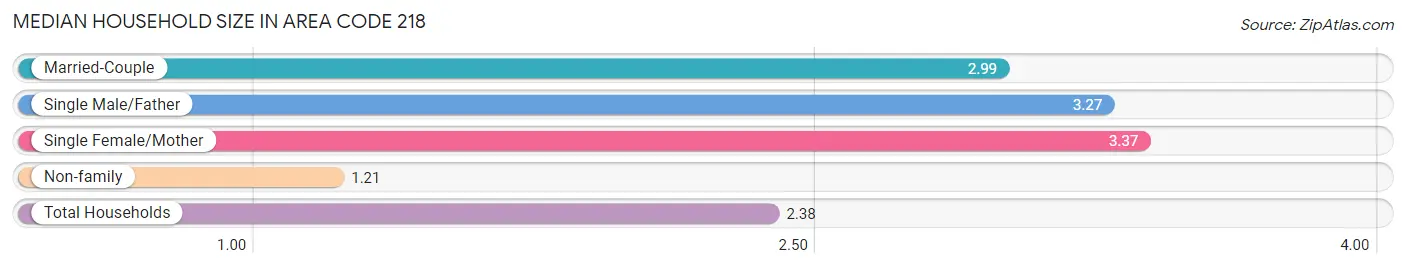
The median household size in Area Code 218 is 2.38 persons per household, with single female/mother households (27,673 | 8.5%) accounting for the largest median household size of 3.36671 persons per household. non-family households (125,646 | 38.4%) represent the smallest median household size with 1.21 persons per household.
| Household Type | # Households | Household Size |
| Married-Couple | 159,170 (48.6%) | 2.99 |
| Single Male/Father | 14,938 (4.6%) | 3.27 |
| Single Female/Mother | 27,673 (8.5%) | 3.37 |
| Non-family | 125,646 (38.4%) | 1.21 |
| Total Households | 327,427 (100.0%) | 2.38 |
Household Size by Marriage Status in Area Code 218
Out of a total of 327,427 households in Area Code 218, 201,781 (61.6%) are family households, while 125,646 (38.4%) are nonfamily households. The most numerous type of family households are 2-person households, comprising 106,290, and the most common type of nonfamily households are 1-person households, comprising 101,990.
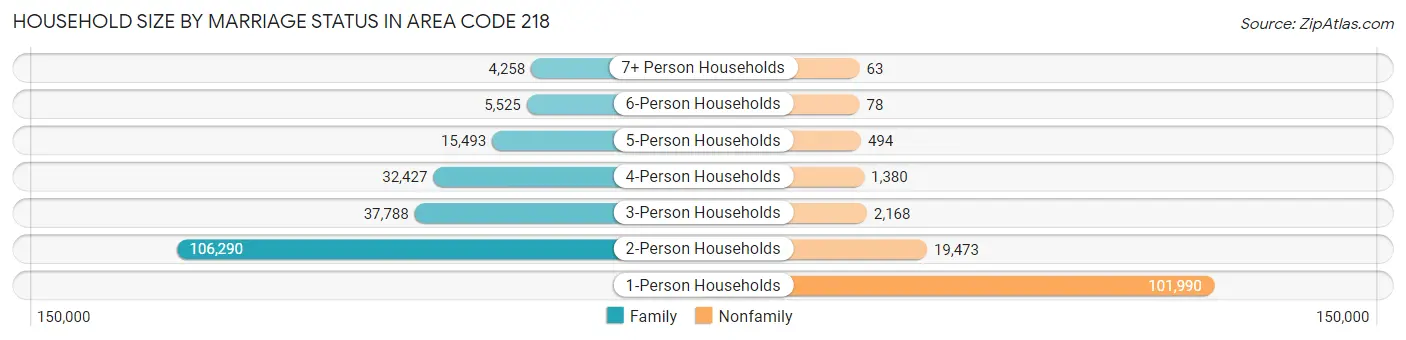
| Household Size | Family Households | Nonfamily Households |
| 1-Person Households | - | 101,990 (31.1%) |
| 2-Person Households | 106,290 (32.5%) | 19,473 (5.9%) |
| 3-Person Households | 37,788 (11.5%) | 2,168 (0.7%) |
| 4-Person Households | 32,427 (9.9%) | 1,380 (0.4%) |
| 5-Person Households | 15,493 (4.7%) | 494 (0.2%) |
| 6-Person Households | 5,525 (1.7%) | 78 (0.0%) |
| 7+ Person Households | 4,258 (1.3%) | 63 (0.0%) |
| Total | 201,781 (61.6%) | 125,646 (38.4%) |
Female Fertility in Area Code 218
Fertility by Age in Area Code 218
Average fertility rate in Area Code 218 is 68.6 births per 1,000 women. Women in the age bracket of 20 to 34 years have the highest fertility rate with 141.2 births per 1,000 women. Women in the age bracket of 20 to 34 years acount for 78.6% of all women with births.
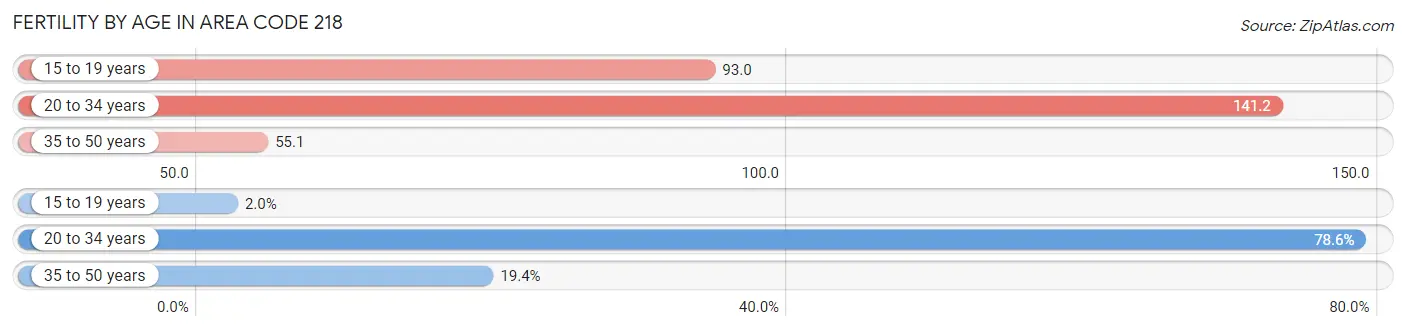
| Age Bracket | Women with Births | Births / 1,000 Women |
| 15 to 19 years | 168 (2.0%) | 93.0 |
| 20 to 34 years | 6,513 (78.6%) | 141.2 |
| 35 to 50 years | 1,605 (19.4%) | 55.1 |
| Total | 8,286 (100.0%) | 68.6 |
Fertility by Age by Marriage Status in Area Code 218
53.4% of women with births (8,286) in Area Code 218 are married. The highest percentage of unmarried women with births falls into 15 to 19 years age bracket with 100.0% of them unmarried at the time of birth, while the lowest percentage of unmarried women with births belong to 20 to 34 years age bracket with 49.0% of them unmarried.
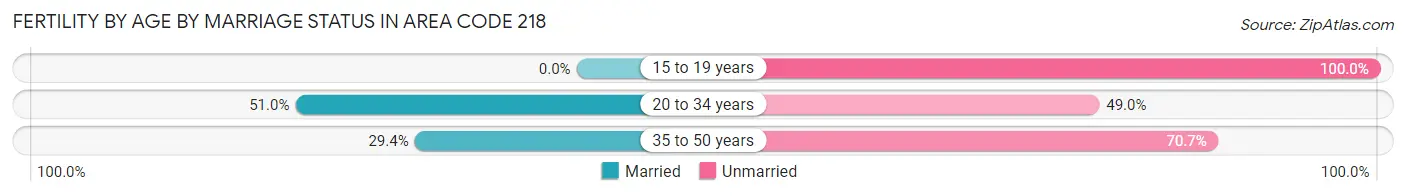
| Age Bracket | Married | Unmarried |
| 15 to 19 years | 0 (0.0%) | 168 (100.0%) |
| 20 to 34 years | 3,319 (51.0%) | 3,194 (49.0%) |
| 35 to 50 years | 471 (29.3%) | 1,134 (70.7%) |
| Total | 4,428 (53.4%) | 3,858 (46.6%) |
Fertility by Education in Area Code 218
Average fertility rate in Area Code 218 is 68.6 births per 1,000 women. Women with the education attainment of graduate degree have the highest fertility rate of 204.6 births per 1,000 women, while women with the education attainment of college or associate's degree have the lowest fertility at 81.8 births per 1,000 women. Women with the education attainment of college or associate's degree represent 37.3% of all women with births.
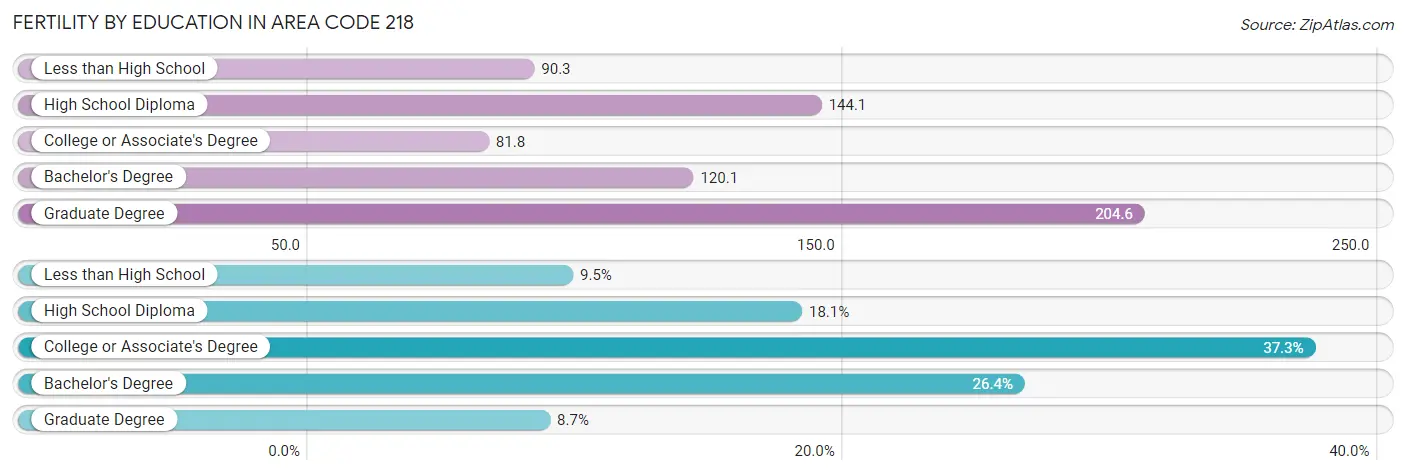
| Educational Attainment | Women with Births | Births / 1,000 Women |
| Less than High School | 788 (9.5%) | 90.3 |
| High School Diploma | 1,499 (18.1%) | 144.1 |
| College or Associate's Degree | 3,092 (37.3%) | 81.8 |
| Bachelor's Degree | 2,190 (26.4%) | 120.1 |
| Graduate Degree | 717 (8.6%) | 204.6 |
| Total | 8,286 (100.0%) | 68.6 |
Fertility by Education by Marriage Status in Area Code 218
46.6% of women with births in Area Code 218 are unmarried. Women with the educational attainment of bachelor's degree are most likely to be married with 50.7% of them married at childbirth, while women with the educational attainment of less than high school are least likely to be married with 93.0% of them unmarried at childbirth.
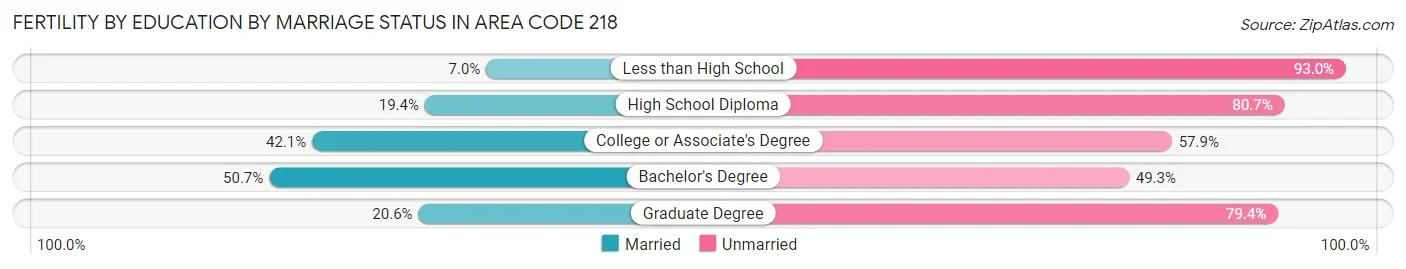
| Educational Attainment | Married | Unmarried |
| Less than High School | 55 (7.0%) | 733 (93.0%) |
| High School Diploma | 290 (19.4%) | 1,209 (80.6%) |
| College or Associate's Degree | 1,301 (42.1%) | 1,791 (57.9%) |
| Bachelor's Degree | 1,111 (50.7%) | 1,079 (49.3%) |
| Graduate Degree | 148 (20.6%) | 569 (79.4%) |
| Total | 4,428 (53.4%) | 3,858 (46.6%) |
Employment Characteristics in Area Code 218
Employment by Class of Employer in Area Code 218
Among the 368,115 employed individuals in Area Code 218, private company employees (225,851 | 61.4%), not-for-profit organizations (42,518 | 11.6%), and local government employees (34,661 | 9.4%) make up the most common classes of employment.
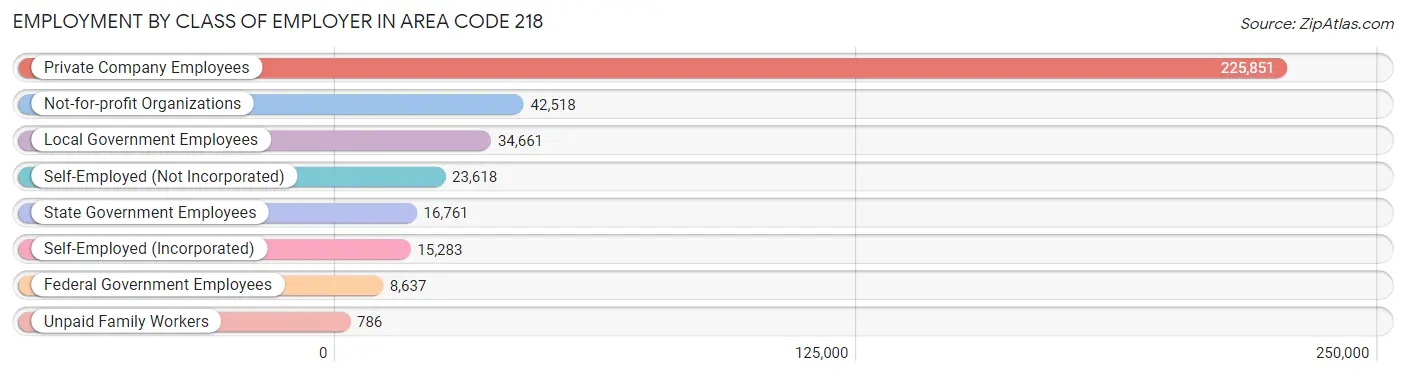
| Employer Class | # Employees | % Employees |
| Private Company Employees | 225,851 | 61.4% |
| Self-Employed (Incorporated) | 15,283 | 4.2% |
| Self-Employed (Not Incorporated) | 23,618 | 6.4% |
| Not-for-profit Organizations | 42,518 | 11.6% |
| Local Government Employees | 34,661 | 9.4% |
| State Government Employees | 16,761 | 4.5% |
| Federal Government Employees | 8,637 | 2.4% |
| Unpaid Family Workers | 786 | 0.2% |
| Total | 368,115 | 100.0% |
Employment Status by Age in Area Code 218
According to the labor force statistics for Area Code 218, out of the total population over 16 years of age (643,910), 58.9% or 379,070 individuals are in the labor force, with 5.6% or 21,114 of them unemployed. The age group with the highest labor force participation rate is 25 to 29 years, with 86.5% or 36,757 individuals in the labor force. Within the labor force, the 20 to 24 years age range has the highest percentage of unemployed individuals, with 2,330.2% or 1,025,335 of them being unemployed.
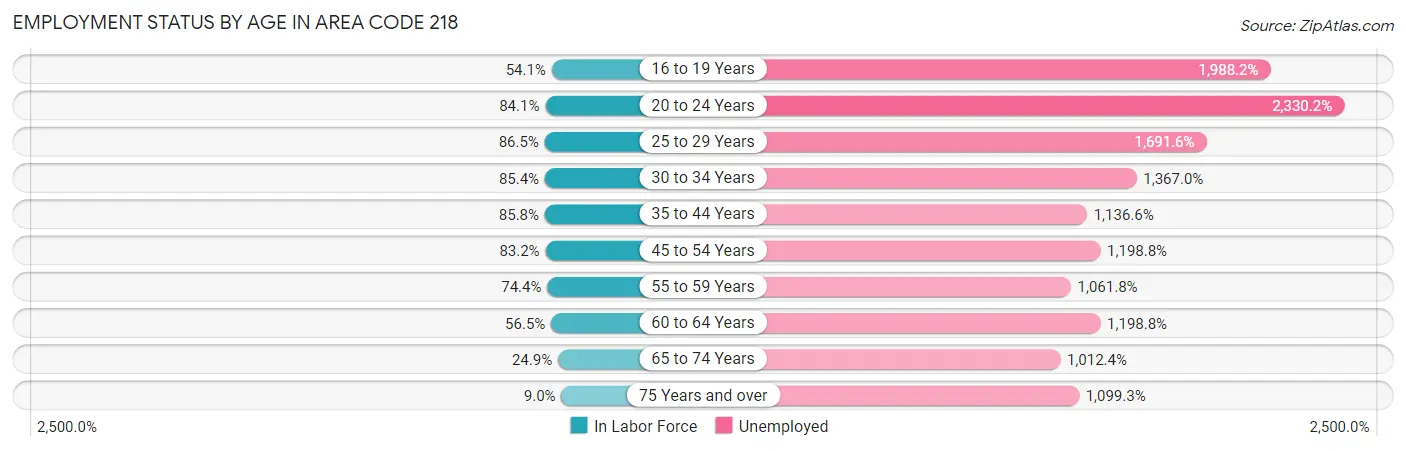
| Age Bracket | In Labor Force | Unemployed |
| 16 to 19 Years | 22,612 (54.1%) | 449,592 (1,988.2%) |
| 20 to 24 Years | 44,004 (84.1%) | 1,025,335 (2,330.2%) |
| 25 to 29 Years | 36,757 (86.5%) | 621,781 (1,691.6%) |
| 30 to 34 Years | 37,372 (85.4%) | 510,889 (1,367.0%) |
| 35 to 44 Years | 79,041 (85.8%) | 898,369 (1,136.6%) |
| 45 to 54 Years | 72,749 (83.2%) | 872,067 (1,198.8%) |
| 55 to 59 Years | 41,024 (74.4%) | 435,572 (1,061.8%) |
| 60 to 64 Years | 34,166 (56.5%) | 409,606 (1,198.8%) |
| 65 to 74 Years | 24,449 (24.9%) | 247,512 (1,012.4%) |
| 75 Years and over | 6,332 (9.0%) | 69,575 (1,099.3%) |
| Total | 379,051 (58.9%) | 21,101 (5.6%) |
Employment Status by Educational Attainment in Area Code 218
According to labor force statistics for Area Code 218, 77.6% of individuals (295,944) out of the total population between 25 and 64 years of age (381,568) are in the labor force, with 1,313.2% or 3,886,337 of them being unemployed. The group with the highest labor force participation rate are those with the educational attainment of bachelor's degree or higher, with 84.5% or 91,157 individuals in the labor force. Within the labor force, individuals with less than high school education have the highest percentage of unemployment, with 2,884.7% or 387,906 of them being unemployed.
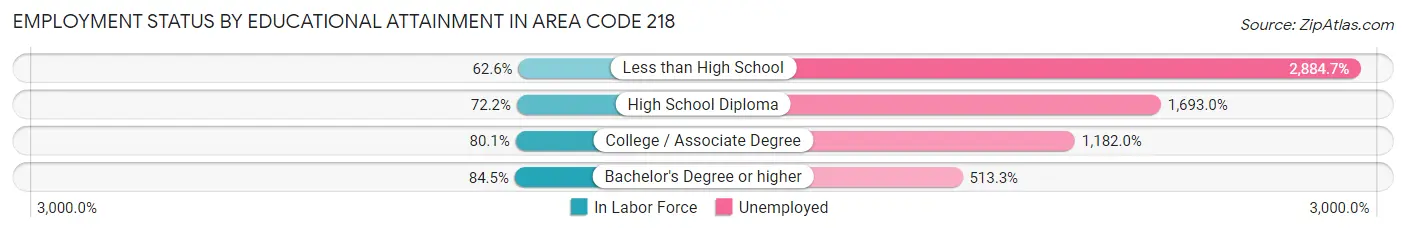
| Educational Attainment | In Labor Force | Unemployed |
| Less than High School | 13,447 (62.6%) | 619,460 (2,884.7%) |
| High School Diploma | 71,530 (72.2%) | 1,678,237 (1,693.0%) |
| College / Associate Degree | 122,654 (80.1%) | 1,809,500 (1,182.0%) |
| Bachelor's Degree or higher | 91,156 (84.5%) | 553,738 (513.3%) |
| Total | 295,937 (77.6%) | 5,010,751 (1,313.2%) |
Employment Occupations by Sex in Area Code 218
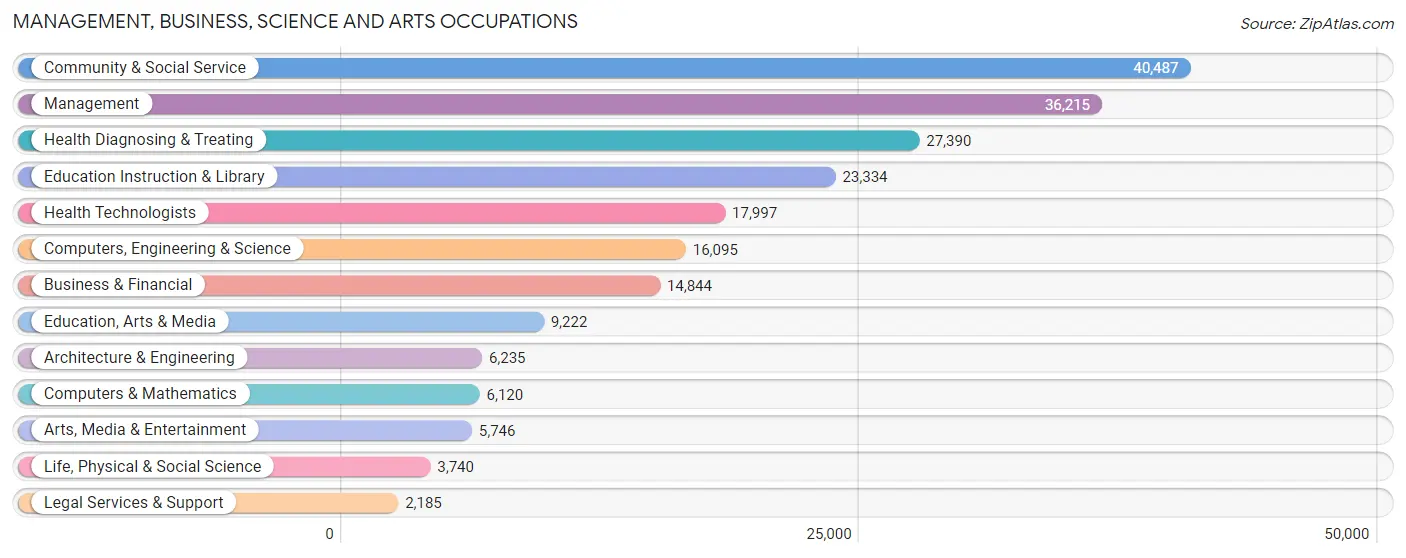
Management, Business, Science and Arts Occupations
The most common Management, Business, Science and Arts occupations in Area Code 218 are Community & Social Service (40,487 | 10.8%), Management (36,215 | 9.7%), Health Diagnosing & Treating (27,390 | 7.3%), Education Instruction & Library (23,334 | 6.2%), and Health Technologists (17,997 | 4.8%).
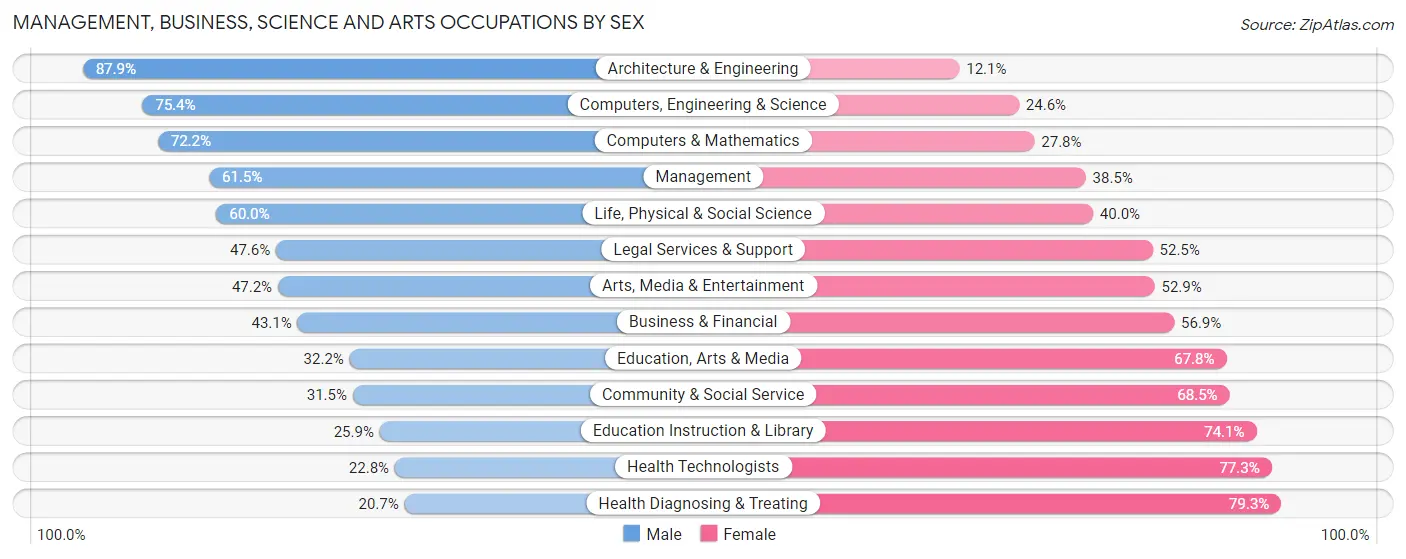
Management, Business, Science and Arts Occupations by Sex
Within the Management, Business, Science and Arts occupations in Area Code 218, the most male-oriented occupations are Architecture & Engineering (87.9%), Computers, Engineering & Science (75.4%), and Computers & Mathematics (72.2%), while the most female-oriented occupations are Health Diagnosing & Treating (79.3%), Health Technologists (77.2%), and Education Instruction & Library (74.1%).
| Occupation | Male | Female |
| Management | 22,276 (61.5%) | 13,939 (38.5%) |
| Business & Financial | 6,392 (43.1%) | 8,452 (56.9%) |
| Computers, Engineering & Science | 12,142 (75.4%) | 3,953 (24.6%) |
| Computers & Mathematics | 4,419 (72.2%) | 1,701 (27.8%) |
| Architecture & Engineering | 5,479 (87.9%) | 756 (12.1%) |
| Life, Physical & Social Science | 2,244 (60.0%) | 1,496 (40.0%) |
| Community & Social Service | 12,766 (31.5%) | 27,721 (68.5%) |
| Education, Arts & Media | 2,969 (32.2%) | 6,253 (67.8%) |
| Legal Services & Support | 1,039 (47.5%) | 1,146 (52.4%) |
| Education Instruction & Library | 6,049 (25.9%) | 17,285 (74.1%) |
| Arts, Media & Entertainment | 2,709 (47.1%) | 3,037 (52.8%) |
| Health Diagnosing & Treating | 5,681 (20.7%) | 21,709 (79.3%) |
| Health Technologists | 4,094 (22.8%) | 13,903 (77.2%) |
| Total (Category) | 59,257 (43.9%) | 75,774 (56.1%) |
| Total (Overall) | 196,960 (52.5%) | 178,119 (47.5%) |
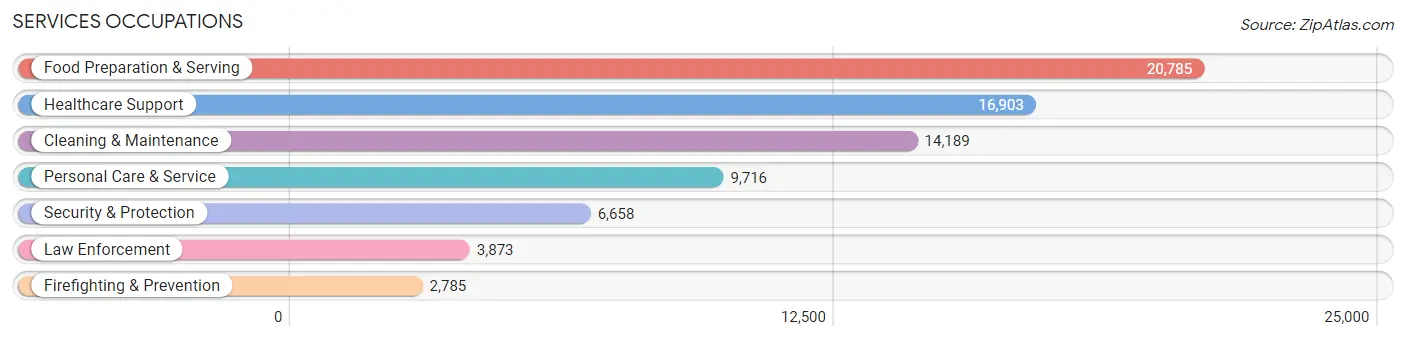
Services Occupations
The most common Services occupations in Area Code 218 are Food Preparation & Serving (20,785 | 5.5%), Healthcare Support (16,903 | 4.5%), Cleaning & Maintenance (14,189 | 3.8%), Personal Care & Service (9,716 | 2.6%), and Security & Protection (6,658 | 1.8%).
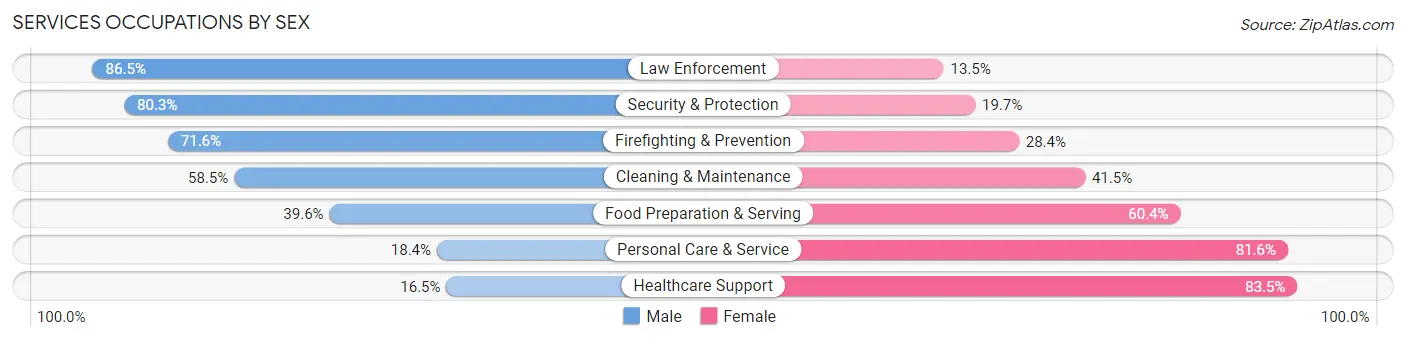
Services Occupations by Sex
Within the Services occupations in Area Code 218, the most male-oriented occupations are Law Enforcement (86.5%), Security & Protection (80.3%), and Firefighting & Prevention (71.6%), while the most female-oriented occupations are Healthcare Support (83.5%), Personal Care & Service (81.6%), and Food Preparation & Serving (60.4%).
| Occupation | Male | Female |
| Healthcare Support | 2,785 (16.5%) | 14,118 (83.5%) |
| Security & Protection | 5,346 (80.3%) | 1,312 (19.7%) |
| Firefighting & Prevention | 1,995 (71.6%) | 790 (28.4%) |
| Law Enforcement | 3,351 (86.5%) | 522 (13.5%) |
| Food Preparation & Serving | 8,239 (39.6%) | 12,546 (60.4%) |
| Cleaning & Maintenance | 8,302 (58.5%) | 5,887 (41.5%) |
| Personal Care & Service | 1,785 (18.4%) | 7,931 (81.6%) |
| Total (Category) | 26,457 (38.8%) | 41,794 (61.2%) |
| Total (Overall) | 196,960 (52.5%) | 178,119 (47.5%) |
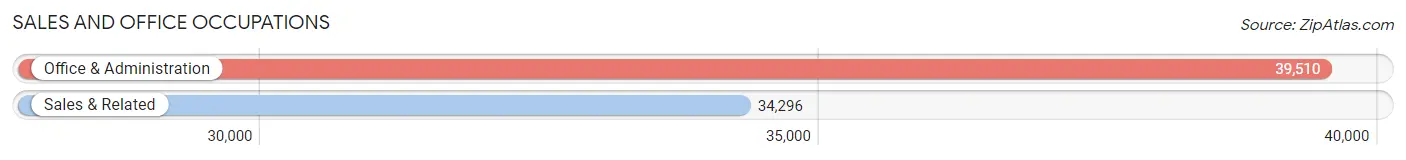
Sales and Office Occupations
The most common Sales and Office occupations in Area Code 218 are Office & Administration (39,510 | 10.5%), and Sales & Related (34,296 | 9.1%).
Sales and Office Occupations by Sex
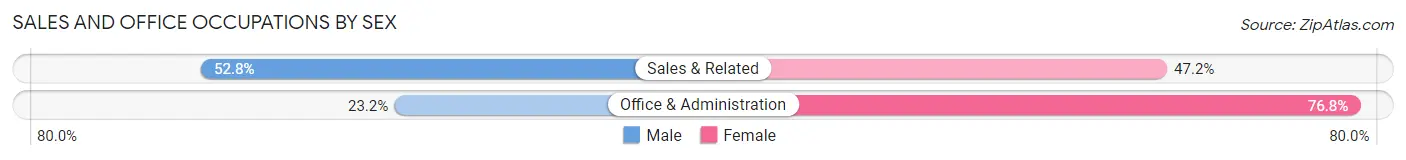
| Occupation | Male | Female |
| Sales & Related | 18,120 (52.8%) | 16,176 (47.2%) |
| Office & Administration | 9,150 (23.2%) | 30,360 (76.8%) |
| Total (Category) | 27,270 (36.9%) | 46,536 (63.0%) |
| Total (Overall) | 196,960 (52.5%) | 178,119 (47.5%) |
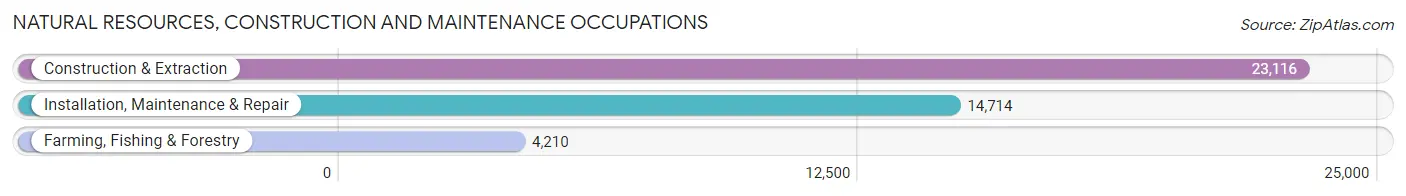
Natural Resources, Construction and Maintenance Occupations
The most common Natural Resources, Construction and Maintenance occupations in Area Code 218 are Construction & Extraction (23,116 | 6.2%), Installation, Maintenance & Repair (14,714 | 3.9%), and Farming, Fishing & Forestry (4,210 | 1.1%).
Natural Resources, Construction and Maintenance Occupations by Sex
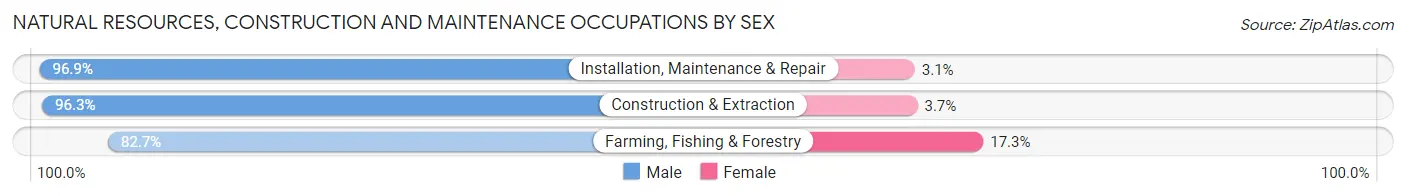
| Occupation | Male | Female |
| Farming, Fishing & Forestry | 3,480 (82.7%) | 730 (17.3%) |
| Construction & Extraction | 22,271 (96.3%) | 845 (3.7%) |
| Installation, Maintenance & Repair | 14,257 (96.9%) | 457 (3.1%) |
| Total (Category) | 40,008 (95.2%) | 2,032 (4.8%) |
| Total (Overall) | 196,960 (52.5%) | 178,119 (47.5%) |
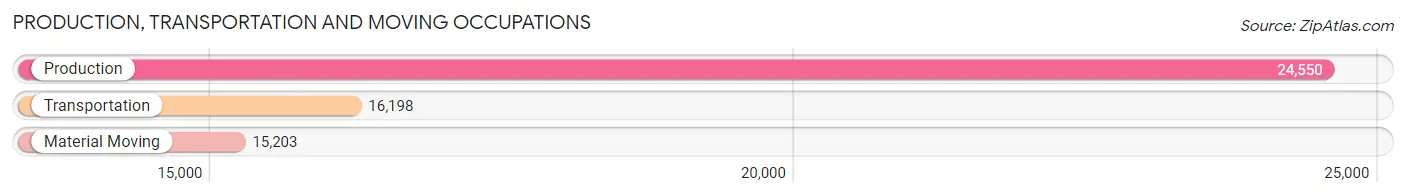
Production, Transportation and Moving Occupations
The most common Production, Transportation and Moving occupations in Area Code 218 are Production (24,550 | 6.6%), Transportation (16,198 | 4.3%), and Material Moving (15,203 | 4.1%).
Production, Transportation and Moving Occupations by Sex
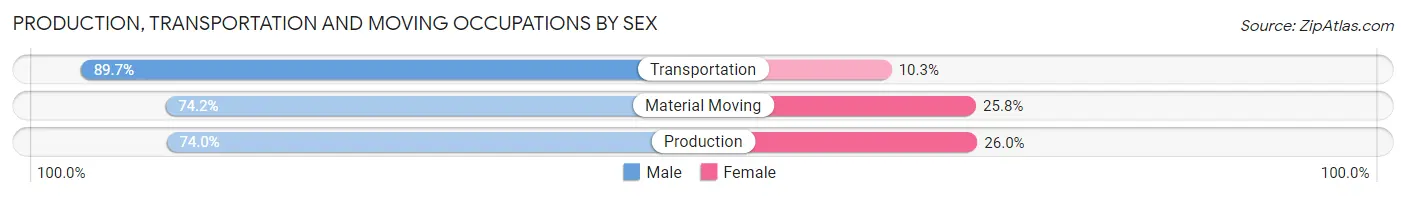
| Occupation | Male | Female |
| Production | 18,160 (74.0%) | 6,390 (26.0%) |
| Transportation | 14,528 (89.7%) | 1,670 (10.3%) |
| Material Moving | 11,280 (74.2%) | 3,923 (25.8%) |
| Total (Category) | 43,968 (78.6%) | 11,983 (21.4%) |
| Total (Overall) | 196,960 (52.5%) | 178,119 (47.5%) |
Employment Industries by Sex in Area Code 218
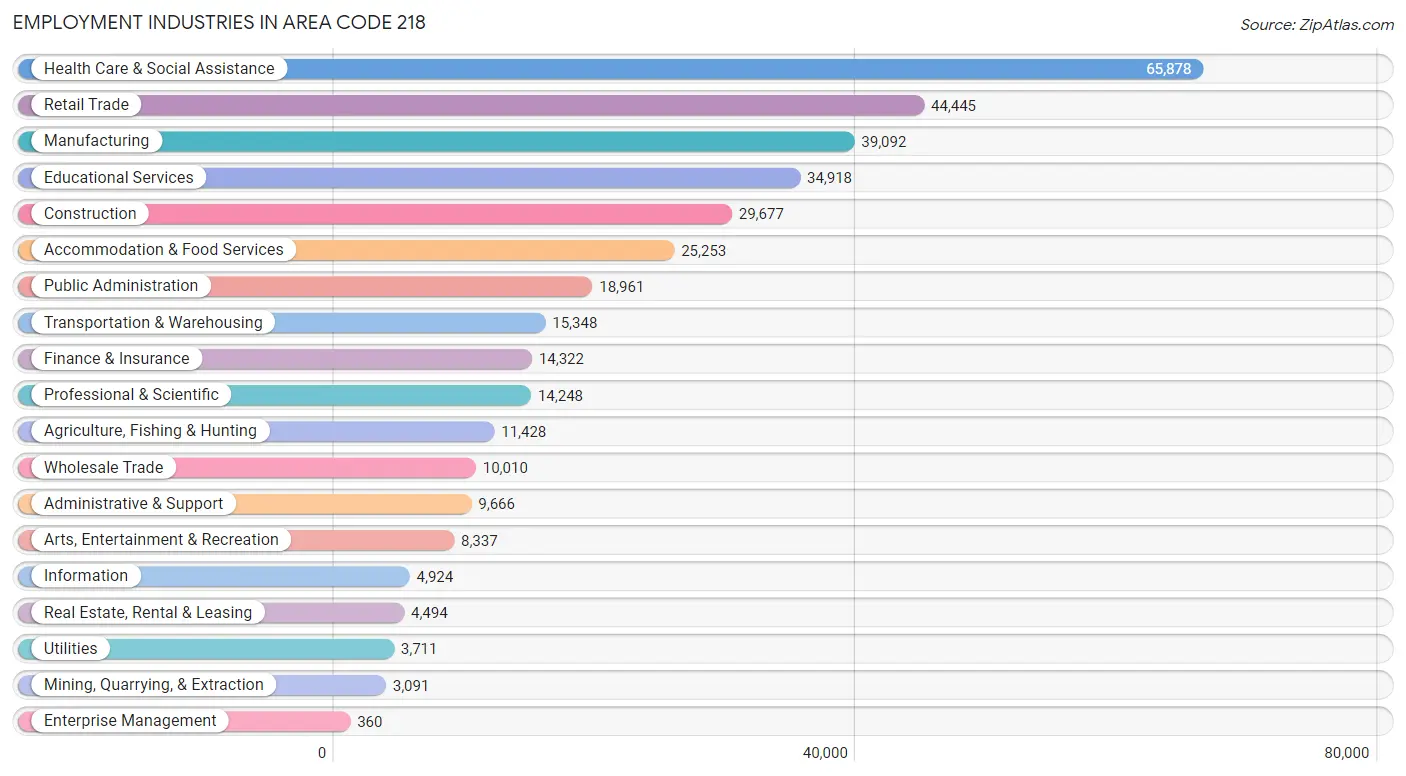
Employment Industries in Area Code 218
The major employment industries in Area Code 218 include Health Care & Social Assistance (65,878 | 17.6%), Retail Trade (44,445 | 11.8%), Manufacturing (39,092 | 10.4%), Educational Services (34,918 | 9.3%), and Construction (29,677 | 7.9%).
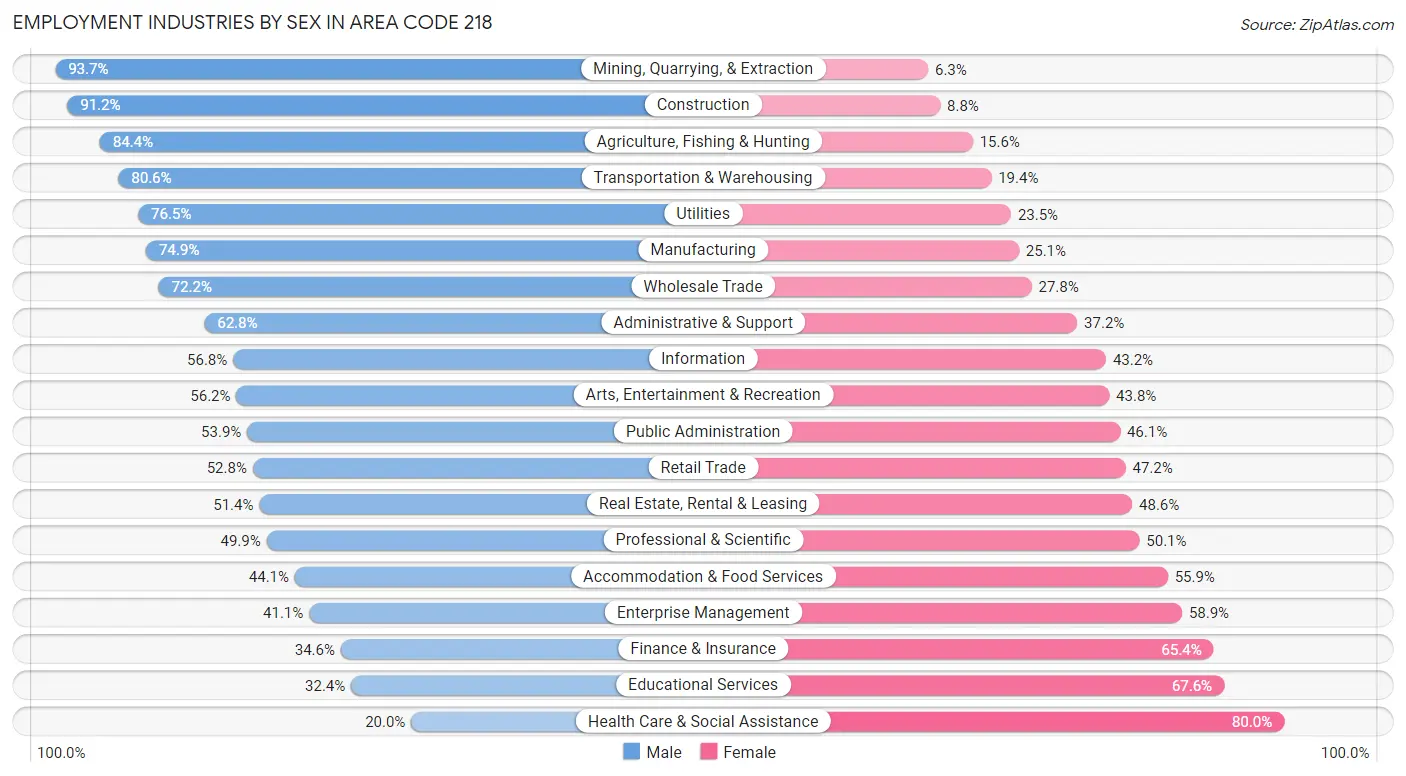
Employment Industries by Sex in Area Code 218
The Area Code 218 industries that see more men than women are Mining, Quarrying, & Extraction (93.7%), Construction (91.2%), and Agriculture, Fishing & Hunting (84.4%), whereas the industries that tend to have a higher number of women are Health Care & Social Assistance (80.0%), Educational Services (67.6%), and Finance & Insurance (65.4%).
| Industry | Male | Female |
| Agriculture, Fishing & Hunting | 9,648 (84.4%) | 1,780 (15.6%) |
| Mining, Quarrying, & Extraction | 2,895 (93.7%) | 196 (6.3%) |
| Construction | 27,053 (91.2%) | 2,624 (8.8%) |
| Manufacturing | 29,267 (74.9%) | 9,825 (25.1%) |
| Wholesale Trade | 7,231 (72.2%) | 2,779 (27.8%) |
| Retail Trade | 23,458 (52.8%) | 20,987 (47.2%) |
| Transportation & Warehousing | 12,367 (80.6%) | 2,981 (19.4%) |
| Utilities | 2,839 (76.5%) | 872 (23.5%) |
| Information | 2,799 (56.8%) | 2,125 (43.2%) |
| Finance & Insurance | 4,949 (34.6%) | 9,373 (65.4%) |
| Real Estate, Rental & Leasing | 2,311 (51.4%) | 2,183 (48.6%) |
| Professional & Scientific | 7,113 (49.9%) | 7,135 (50.1%) |
| Enterprise Management | 148 (41.1%) | 212 (58.9%) |
| Administrative & Support | 6,070 (62.8%) | 3,596 (37.2%) |
| Educational Services | 11,320 (32.4%) | 23,598 (67.6%) |
| Health Care & Social Assistance | 13,161 (20.0%) | 52,717 (80.0%) |
| Arts, Entertainment & Recreation | 4,683 (56.2%) | 3,654 (43.8%) |
| Accommodation & Food Services | 11,127 (44.1%) | 14,126 (55.9%) |
| Public Administration | 10,225 (53.9%) | 8,736 (46.1%) |
| Total | 196,960 (52.5%) | 178,119 (47.5%) |
Education in Area Code 218
School Enrollment in Area Code 218
The most common levels of schooling among the 181,233 students in Area Code 218 are high school (39,381 | 21.7%), middle school (38,577 | 21.3%), and college / undergraduate (37,919 | 20.9%).
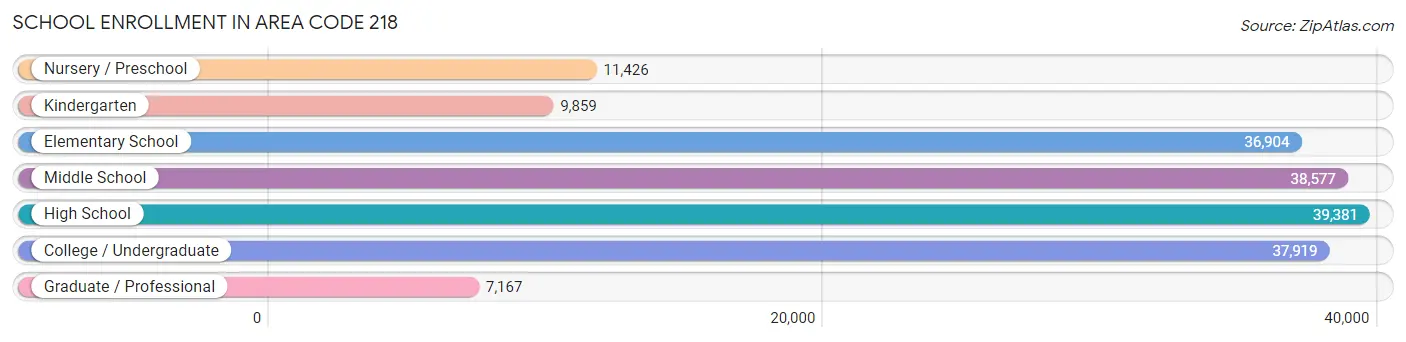
| School Level | # Students | % Students |
| Nursery / Preschool | 11,426 | 6.3% |
| Kindergarten | 9,859 | 5.4% |
| Elementary School | 36,904 | 20.4% |
| Middle School | 38,577 | 21.3% |
| High School | 39,381 | 21.7% |
| College / Undergraduate | 37,919 | 20.9% |
| Graduate / Professional | 7,167 | 4.0% |
| Total | 181,233 | 100.0% |
School Enrollment by Age by Funding Source in Area Code 218
Out of a total of 181,233 students who are enrolled in schools in Area Code 218, 23,383 (12.9%) attend a private institution, while the remaining 157,850 (87.1%) are enrolled in public schools. The age group of 35 years and over has the highest likelihood of being enrolled in private schools, with 1,917 (25.8% in the age bracket) enrolled. Conversely, the age group of 15 to 17 year olds has the lowest likelihood of being enrolled in a private school, with 27,059 (93.4% in the age bracket) attending a public institution.
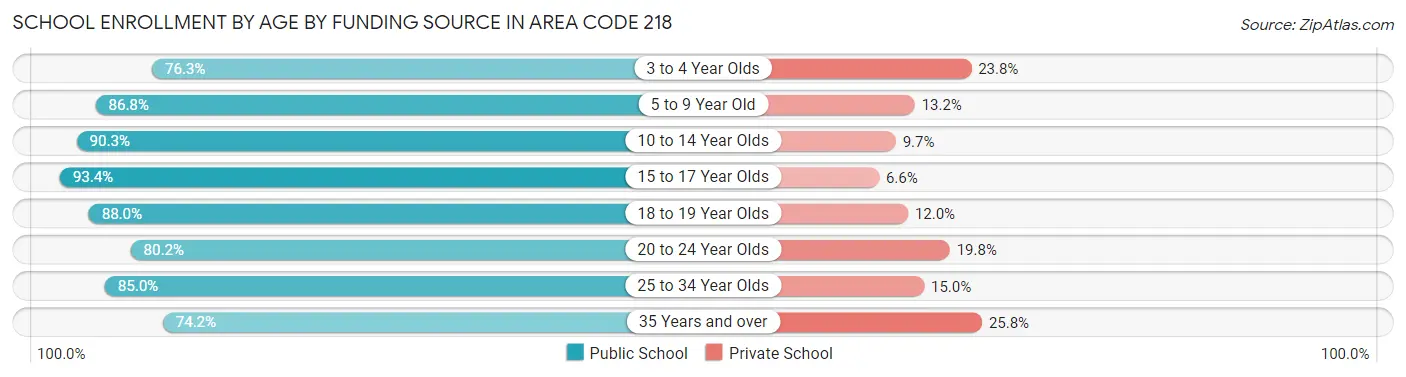
| Age Bracket | Public School | Private School |
| 3 to 4 Year Olds | 5,790 (76.2%) | 1,803 (23.7%) |
| 5 to 9 Year Old | 39,178 (86.8%) | 5,974 (13.2%) |
| 10 to 14 Year Olds | 42,791 (90.3%) | 4,595 (9.7%) |
| 15 to 17 Year Olds | 27,059 (93.4%) | 1,906 (6.6%) |
| 18 to 19 Year Olds | 14,227 (88.0%) | 1,935 (12.0%) |
| 20 to 24 Year Olds | 16,513 (80.2%) | 4,066 (19.8%) |
| 25 to 34 Year Olds | 6,763 (85.0%) | 1,191 (15.0%) |
| 35 Years and over | 5,525 (74.2%) | 1,917 (25.8%) |
| Total | 157,850 (87.1%) | 23,383 (12.9%) |
Educational Attainment by Field of Study in Area Code 218
Education (33,540 | 20.1%), business (24,569 | 14.7%), science & technology (21,073 | 12.7%), bio, nature & agricultural (15,019 | 9.0%), and arts & humanities (13,247 | 8.0%) are the most common fields of study among 166,593 individuals in Area Code 218 who have obtained a bachelor's degree or higher.
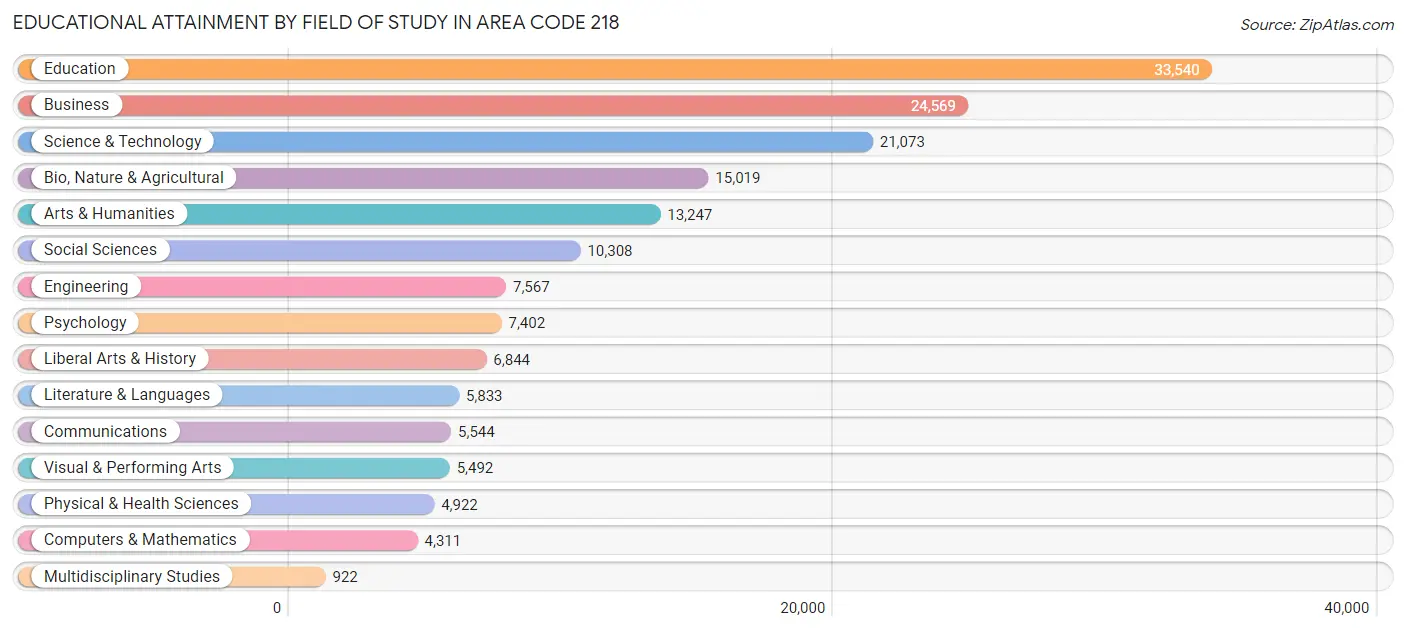
| Field of Study | # Graduates | % Graduates |
| Computers & Mathematics | 4,311 | 2.6% |
| Bio, Nature & Agricultural | 15,019 | 9.0% |
| Physical & Health Sciences | 4,922 | 2.9% |
| Psychology | 7,402 | 4.4% |
| Social Sciences | 10,308 | 6.2% |
| Engineering | 7,567 | 4.5% |
| Multidisciplinary Studies | 922 | 0.5% |
| Science & Technology | 21,073 | 12.7% |
| Business | 24,569 | 14.7% |
| Education | 33,540 | 20.1% |
| Literature & Languages | 5,833 | 3.5% |
| Liberal Arts & History | 6,844 | 4.1% |
| Visual & Performing Arts | 5,492 | 3.3% |
| Communications | 5,544 | 3.3% |
| Arts & Humanities | 13,247 | 8.0% |
| Total | 166,593 | 100.0% |
Transportation & Commute in Area Code 218
Vehicle Availability by Sex in Area Code 218
The most prevalent vehicle ownership categories in Area Code 218 are males with 2 vehicles (76,680, accounting for 40.1%) and females with 2 vehicles (67,412, making up 44.8%).
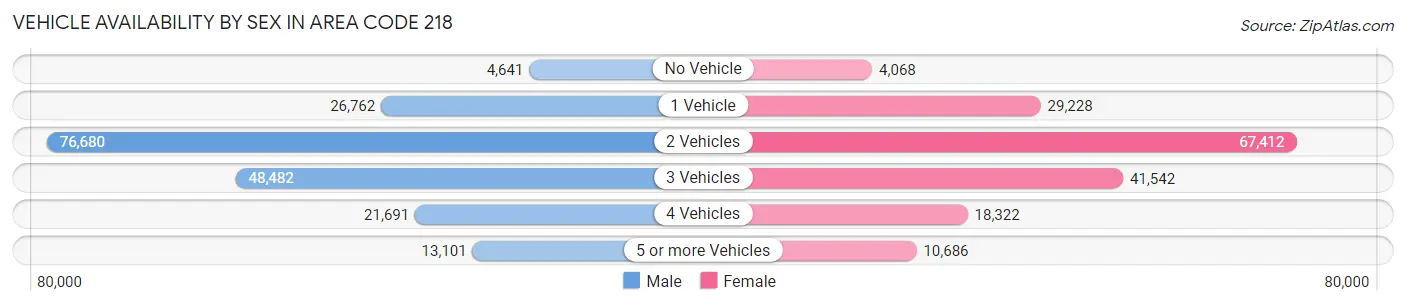
| Vehicles Available | Male | Female |
| No Vehicle | 4,641 (2.4%) | 4,068 (2.4%) |
| 1 Vehicle | 26,762 (14.0%) | 29,228 (17.1%) |
| 2 Vehicles | 76,680 (40.1%) | 67,412 (39.4%) |
| 3 Vehicles | 48,482 (25.3%) | 41,542 (24.3%) |
| 4 Vehicles | 21,691 (11.3%) | 18,322 (10.7%) |
| 5 or more Vehicles | 13,101 (6.9%) | 10,686 (6.2%) |
| Total | 191,357 (100.0%) | 171,258 (100.0%) |
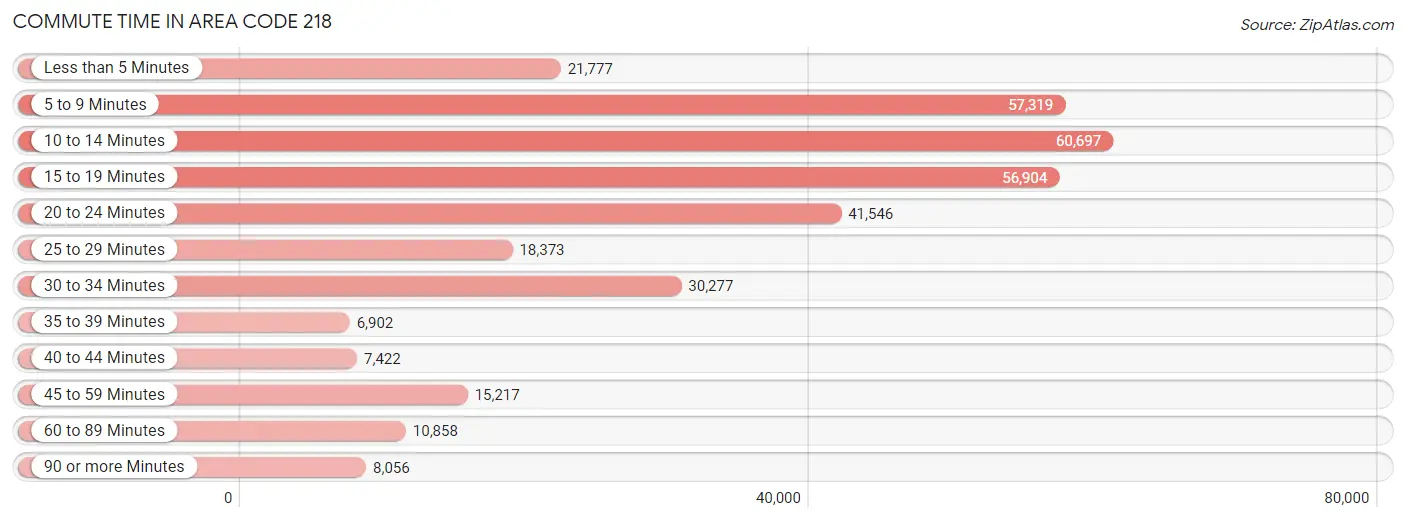
Commute Time in Area Code 218
The most frequently occuring commute durations in Area Code 218 are 10 to 14 minutes (60,697 commuters, 18.1%), 5 to 9 minutes (57,319 commuters, 17.1%), and 15 to 19 minutes (56,904 commuters, 17.0%).
| Commute Time | # Commuters | % Commuters |
| Less than 5 Minutes | 21,777 | 6.5% |
| 5 to 9 Minutes | 57,319 | 17.1% |
| 10 to 14 Minutes | 60,697 | 18.1% |
| 15 to 19 Minutes | 56,904 | 17.0% |
| 20 to 24 Minutes | 41,546 | 12.4% |
| 25 to 29 Minutes | 18,373 | 5.5% |
| 30 to 34 Minutes | 30,277 | 9.0% |
| 35 to 39 Minutes | 6,902 | 2.1% |
| 40 to 44 Minutes | 7,422 | 2.2% |
| 45 to 59 Minutes | 15,217 | 4.5% |
| 60 to 89 Minutes | 10,858 | 3.2% |
| 90 or more Minutes | 8,056 | 2.4% |
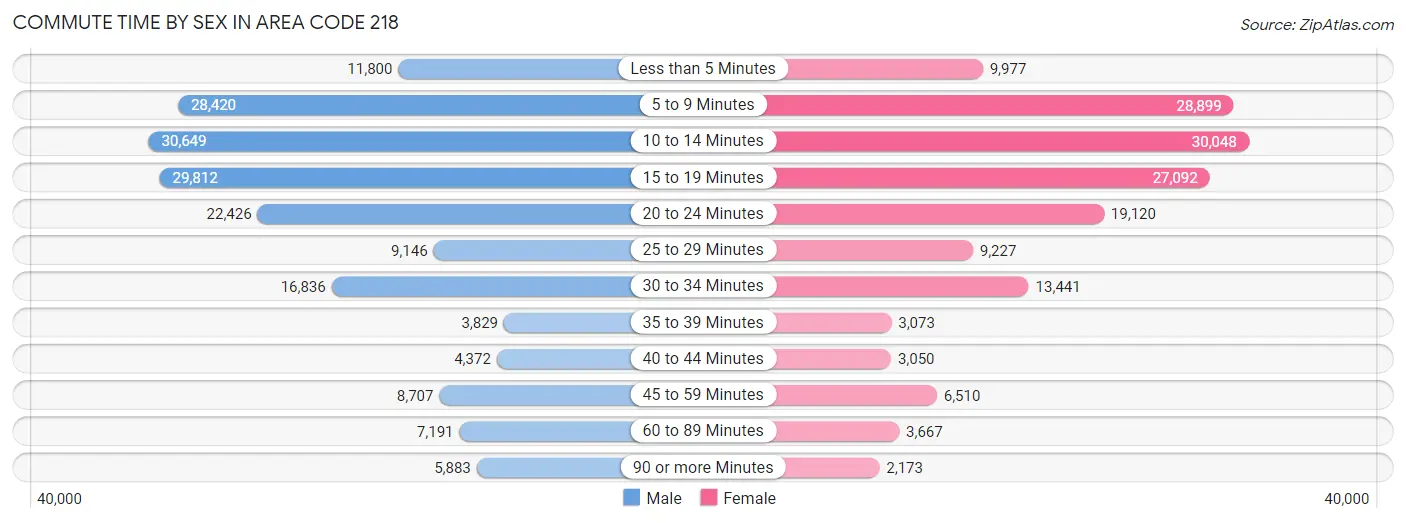
Commute Time by Sex in Area Code 218
The most common commute times in Area Code 218 are 10 to 14 minutes (30,649 commuters, 17.1%) for males and 10 to 14 minutes (30,048 commuters, 19.2%) for females.
| Commute Time | Male | Female |
| Less than 5 Minutes | 11,800 (6.6%) | 9,977 (6.4%) |
| 5 to 9 Minutes | 28,420 (15.9%) | 28,899 (18.5%) |
| 10 to 14 Minutes | 30,649 (17.1%) | 30,048 (19.2%) |
| 15 to 19 Minutes | 29,812 (16.7%) | 27,092 (17.3%) |
| 20 to 24 Minutes | 22,426 (12.5%) | 19,120 (12.2%) |
| 25 to 29 Minutes | 9,146 (5.1%) | 9,227 (5.9%) |
| 30 to 34 Minutes | 16,836 (9.4%) | 13,441 (8.6%) |
| 35 to 39 Minutes | 3,829 (2.1%) | 3,073 (2.0%) |
| 40 to 44 Minutes | 4,372 (2.4%) | 3,050 (1.9%) |
| 45 to 59 Minutes | 8,707 (4.9%) | 6,510 (4.2%) |
| 60 to 89 Minutes | 7,191 (4.0%) | 3,667 (2.4%) |
| 90 or more Minutes | 5,883 (3.3%) | 2,173 (1.4%) |
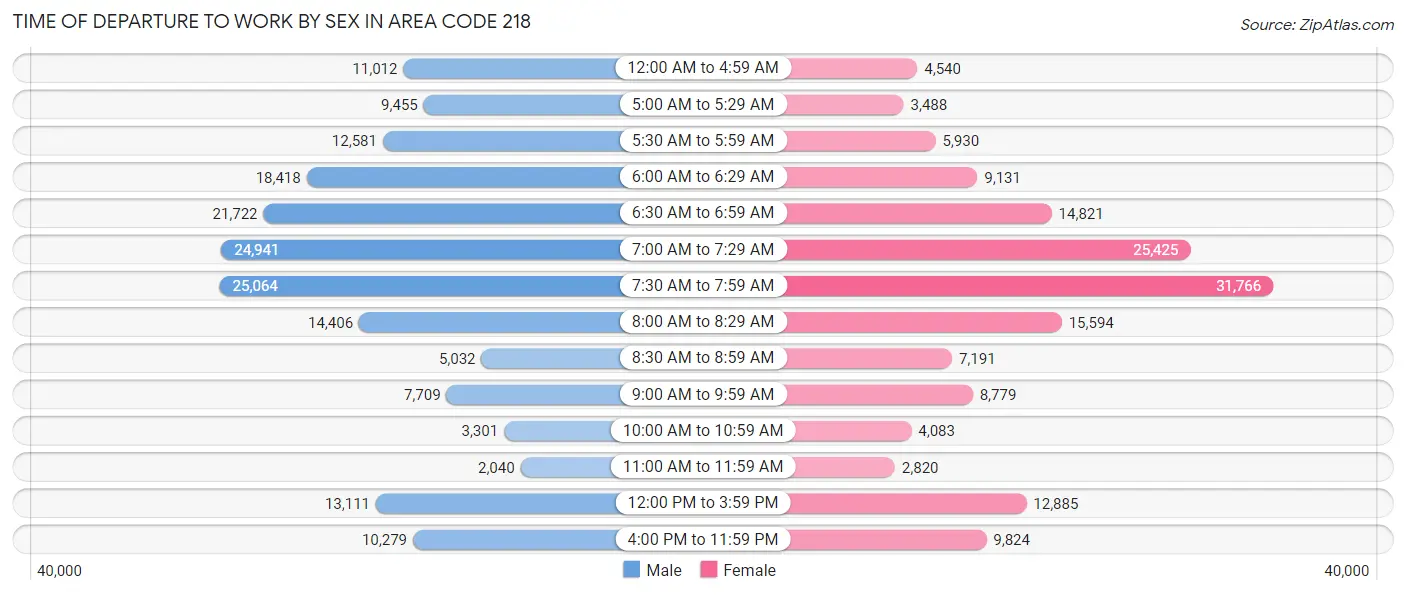
Time of Departure to Work by Sex in Area Code 218
The most frequent times of departure to work in Area Code 218 are 7:30 AM to 7:59 AM (25,064, 14.0%) for males and 7:30 AM to 7:59 AM (31,766, 20.3%) for females.
| Time of Departure | Male | Female |
| 12:00 AM to 4:59 AM | 11,012 (6.1%) | 4,540 (2.9%) |
| 5:00 AM to 5:29 AM | 9,455 (5.3%) | 3,488 (2.2%) |
| 5:30 AM to 5:59 AM | 12,581 (7.0%) | 5,930 (3.8%) |
| 6:00 AM to 6:29 AM | 18,418 (10.3%) | 9,131 (5.8%) |
| 6:30 AM to 6:59 AM | 21,722 (12.1%) | 14,821 (9.5%) |
| 7:00 AM to 7:29 AM | 24,941 (13.9%) | 25,425 (16.3%) |
| 7:30 AM to 7:59 AM | 25,064 (14.0%) | 31,766 (20.3%) |
| 8:00 AM to 8:29 AM | 14,406 (8.0%) | 15,594 (10.0%) |
| 8:30 AM to 8:59 AM | 5,032 (2.8%) | 7,191 (4.6%) |
| 9:00 AM to 9:59 AM | 7,709 (4.3%) | 8,779 (5.6%) |
| 10:00 AM to 10:59 AM | 3,301 (1.8%) | 4,083 (2.6%) |
| 11:00 AM to 11:59 AM | 2,040 (1.1%) | 2,820 (1.8%) |
| 12:00 PM to 3:59 PM | 13,111 (7.3%) | 12,885 (8.2%) |
| 4:00 PM to 11:59 PM | 10,279 (5.7%) | 9,824 (6.3%) |
| Total | 179,071 (100.0%) | 156,277 (100.0%) |
Housing Occupancy in Area Code 218
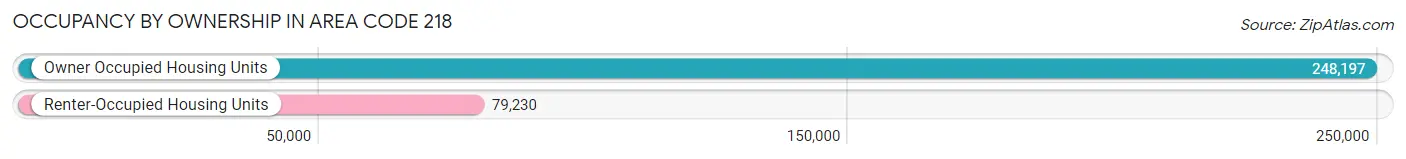
Occupancy by Ownership in Area Code 218
Of the total 327,427 dwellings in Area Code 218, owner-occupied units account for 248,197 (75.8%), while renter-occupied units make up 79,230 (24.2%).
| Occupancy | # Housing Units | % Housing Units |
| Owner Occupied Housing Units | 248,197 | 75.8% |
| Renter-Occupied Housing Units | 79,230 | 24.2% |
| Total Occupied Housing Units | 327,427 | 100.0% |
Occupancy by Household Size in Area Code 218
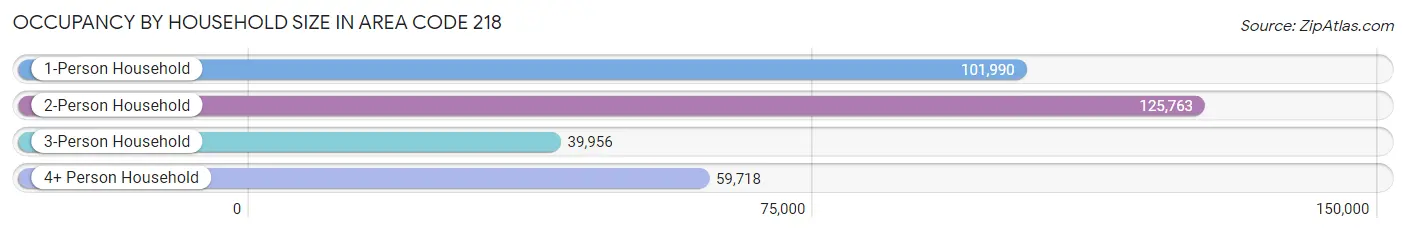
| Household Size | # Housing Units | % Housing Units |
| 1-Person Household | 101,990 | 31.1% |
| 2-Person Household | 125,763 | 38.4% |
| 3-Person Household | 39,956 | 12.2% |
| 4+ Person Household | 59,718 | 18.2% |
| Total Housing Units | 327,427 | 100.0% |
Occupancy by Ownership by Household Size in Area Code 218
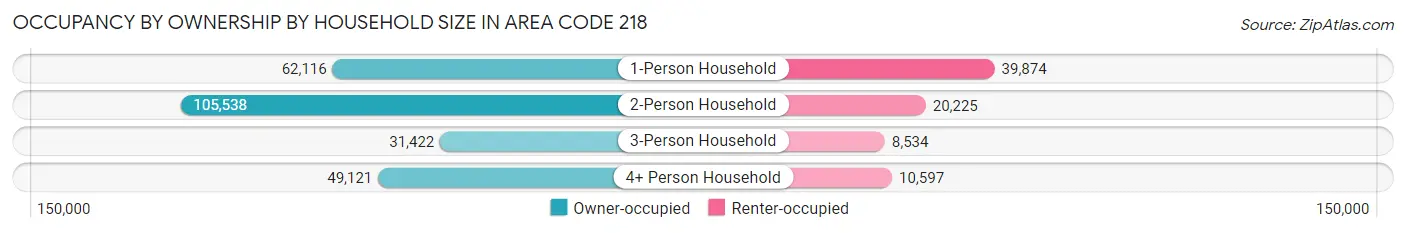
| Household Size | Owner-occupied | Renter-occupied |
| 1-Person Household | 62,116 (60.9%) | 39,874 (39.1%) |
| 2-Person Household | 105,538 (83.9%) | 20,225 (16.1%) |
| 3-Person Household | 31,422 (78.6%) | 8,534 (21.4%) |
| 4+ Person Household | 49,121 (82.3%) | 10,597 (17.7%) |
| Total Housing Units | 248,197 (75.8%) | 79,230 (24.2%) |
Occupancy by Educational Attainment in Area Code 218

| Household Size | Owner-occupied | Renter-occupied |
| Less than High School | 10,130 (56.0%) | 7,965 (44.0%) |
| High School Diploma | 63,192 (72.1%) | 24,448 (27.9%) |
| College/Associate Degree | 96,841 (75.2%) | 31,917 (24.8%) |
| Bachelor's Degree or higher | 78,034 (84.0%) | 14,900 (16.0%) |
Occupancy by Age of Householder in Area Code 218
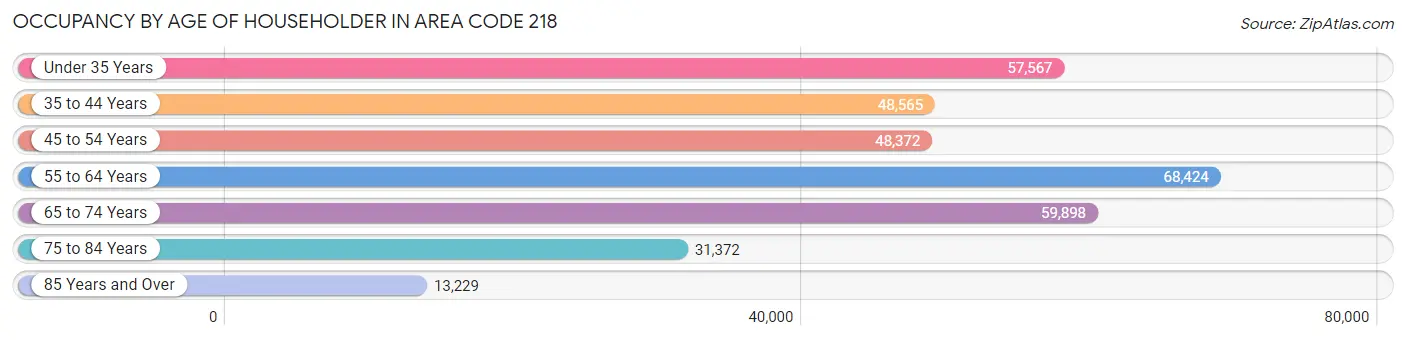
| Age Bracket | # Households | % Households |
| Under 35 Years | 57,567 | 17.6% |
| 35 to 44 Years | 48,565 | 14.8% |
| 45 to 54 Years | 48,372 | 14.8% |
| 55 to 64 Years | 68,424 | 20.9% |
| 65 to 74 Years | 59,898 | 18.3% |
| 75 to 84 Years | 31,372 | 9.6% |
| 85 Years and Over | 13,229 | 4.0% |
| Total | 327,427 | 100.0% |
Housing Finances in Area Code 218
Median Income by Occupancy in Area Code 218
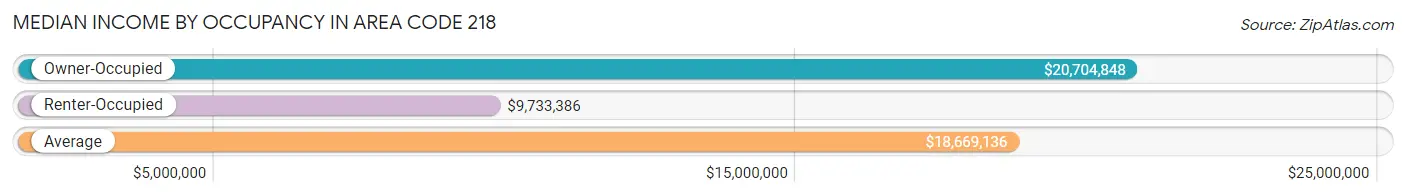
| Occupancy Type | # Households | Median Income |
| Owner-Occupied | 248,197 (75.8%) | $20,704,848 |
| Renter-Occupied | 79,230 (24.2%) | $9,733,386 |
| Average | 327,427 (100.0%) | $18,669,136 |
Occupancy by Householder Income Bracket in Area Code 218
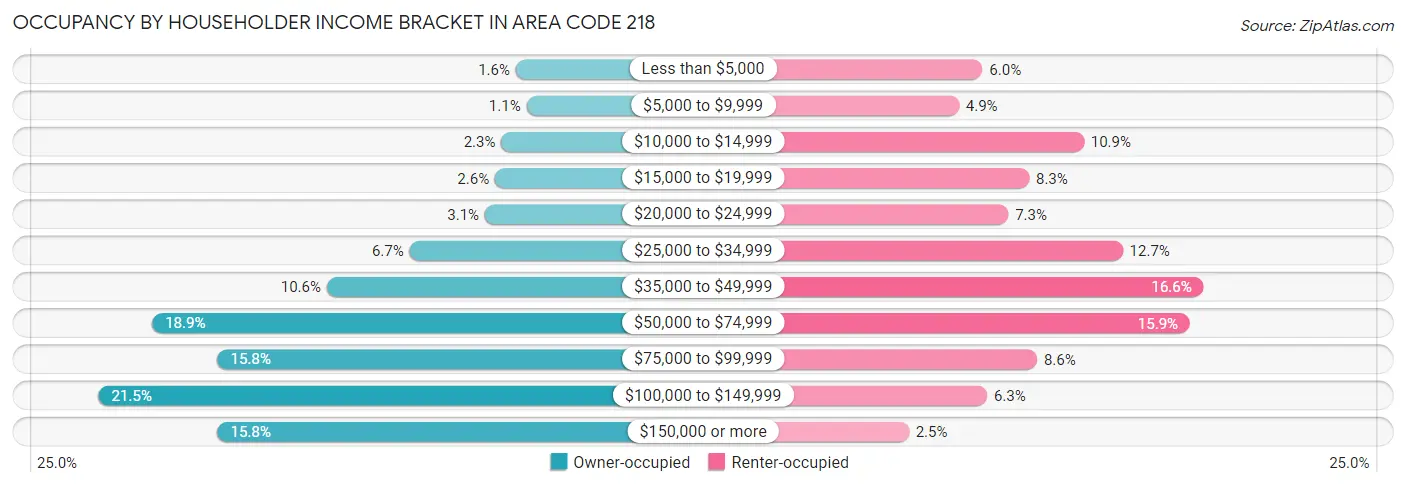
| Income Bracket | Owner-occupied | Renter-occupied |
| Less than $5,000 | 4,003 (1.6%) | 4,788 (6.0%) |
| $5,000 to $9,999 | 2,732 (1.1%) | 3,899 (4.9%) |
| $10,000 to $14,999 | 5,699 (2.3%) | 8,610 (10.9%) |
| $15,000 to $19,999 | 6,441 (2.6%) | 6,542 (8.3%) |
| $20,000 to $24,999 | 7,652 (3.1%) | 5,759 (7.3%) |
| $25,000 to $34,999 | 16,557 (6.7%) | 10,080 (12.7%) |
| $35,000 to $49,999 | 26,336 (10.6%) | 13,130 (16.6%) |
| $50,000 to $74,999 | 46,967 (18.9%) | 12,612 (15.9%) |
| $75,000 to $99,999 | 39,252 (15.8%) | 6,845 (8.6%) |
| $100,000 to $149,999 | 53,314 (21.5%) | 4,958 (6.3%) |
| $150,000 or more | 39,244 (15.8%) | 2,007 (2.5%) |
| Total | 248,197 (100.0%) | 79,230 (100.0%) |
Monthly Housing Cost Tiers in Area Code 218
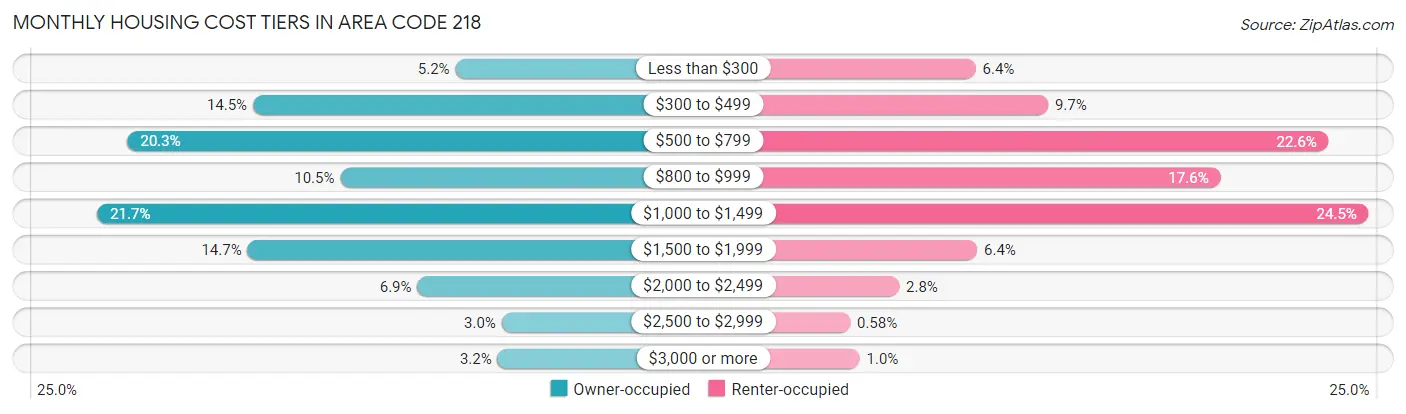
| Monthly Cost | Owner-occupied | Renter-occupied |
| Less than $300 | 12,844 (5.2%) | 5,039 (6.4%) |
| $300 to $499 | 35,954 (14.5%) | 7,679 (9.7%) |
| $500 to $799 | 50,315 (20.3%) | 17,912 (22.6%) |
| $800 to $999 | 25,985 (10.5%) | 13,971 (17.6%) |
| $1,000 to $1,499 | 53,771 (21.7%) | 19,374 (24.4%) |
| $1,500 to $1,999 | 36,590 (14.7%) | 5,094 (6.4%) |
| $2,000 to $2,499 | 17,165 (6.9%) | 2,248 (2.8%) |
| $2,500 to $2,999 | 7,545 (3.0%) | 458 (0.6%) |
| $3,000 or more | 8,028 (3.2%) | 808 (1.0%) |
| Total | 248,197 (100.0%) | 79,230 (100.0%) |
Physical Housing Characteristics in Area Code 218
Housing Structures in Area Code 218
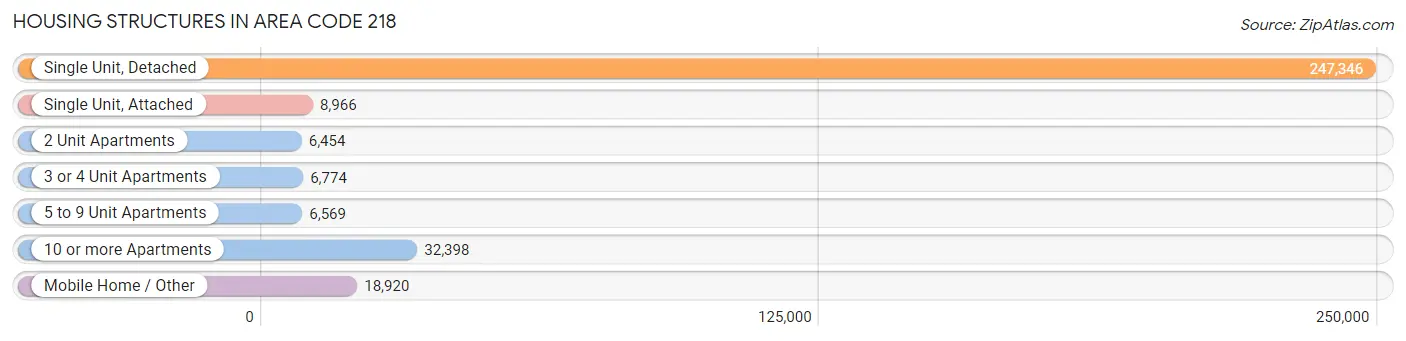
| Structure Type | # Housing Units | % Housing Units |
| Single Unit, Detached | 247,346 | 75.5% |
| Single Unit, Attached | 8,966 | 2.7% |
| 2 Unit Apartments | 6,454 | 2.0% |
| 3 or 4 Unit Apartments | 6,774 | 2.1% |
| 5 to 9 Unit Apartments | 6,569 | 2.0% |
| 10 or more Apartments | 32,398 | 9.9% |
| Mobile Home / Other | 18,920 | 5.8% |
| Total | 327,427 | 100.0% |
Housing Structures by Occupancy in Area Code 218
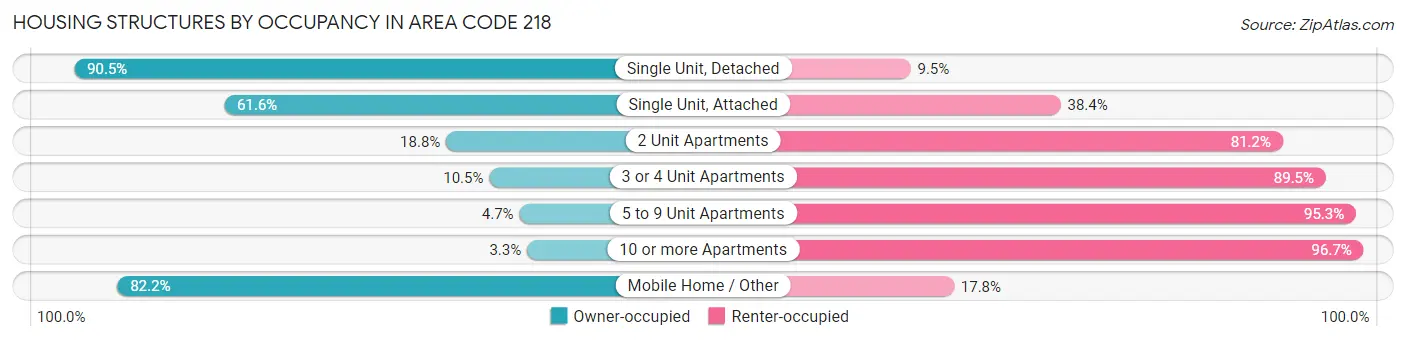
| Structure Type | Owner-occupied | Renter-occupied |
| Single Unit, Detached | 223,834 (90.5%) | 23,512 (9.5%) |
| Single Unit, Attached | 5,524 (61.6%) | 3,442 (38.4%) |
| 2 Unit Apartments | 1,215 (18.8%) | 5,239 (81.2%) |
| 3 or 4 Unit Apartments | 713 (10.5%) | 6,061 (89.5%) |
| 5 to 9 Unit Apartments | 310 (4.7%) | 6,259 (95.3%) |
| 10 or more Apartments | 1,056 (3.3%) | 31,342 (96.7%) |
| Mobile Home / Other | 15,545 (82.2%) | 3,375 (17.8%) |
| Total | 248,197 (75.8%) | 79,230 (24.2%) |
Housing Structures by Number of Rooms in Area Code 218
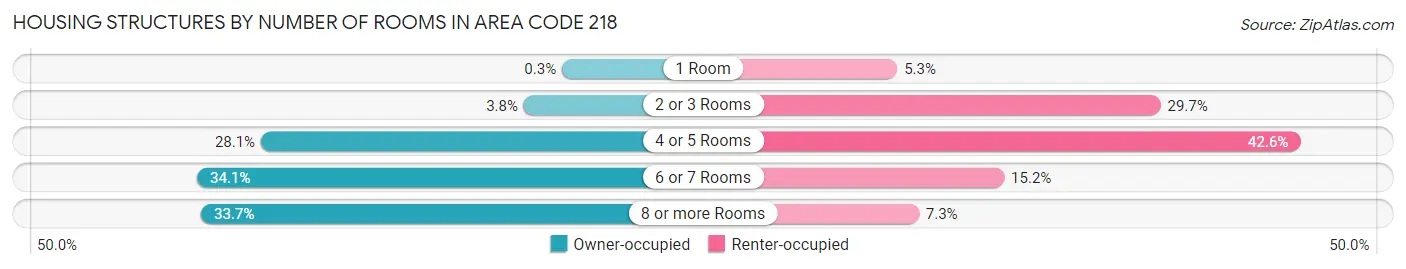
| Number of Rooms | Owner-occupied | Renter-occupied |
| 1 Room | 752 (0.3%) | 4,196 (5.3%) |
| 2 or 3 Rooms | 9,494 (3.8%) | 23,489 (29.6%) |
| 4 or 5 Rooms | 69,848 (28.1%) | 33,723 (42.6%) |
| 6 or 7 Rooms | 84,501 (34.1%) | 12,035 (15.2%) |
| 8 or more Rooms | 83,602 (33.7%) | 5,787 (7.3%) |
| Total | 248,197 (100.0%) | 79,230 (100.0%) |
Housing Structure by Heating Type in Area Code 218
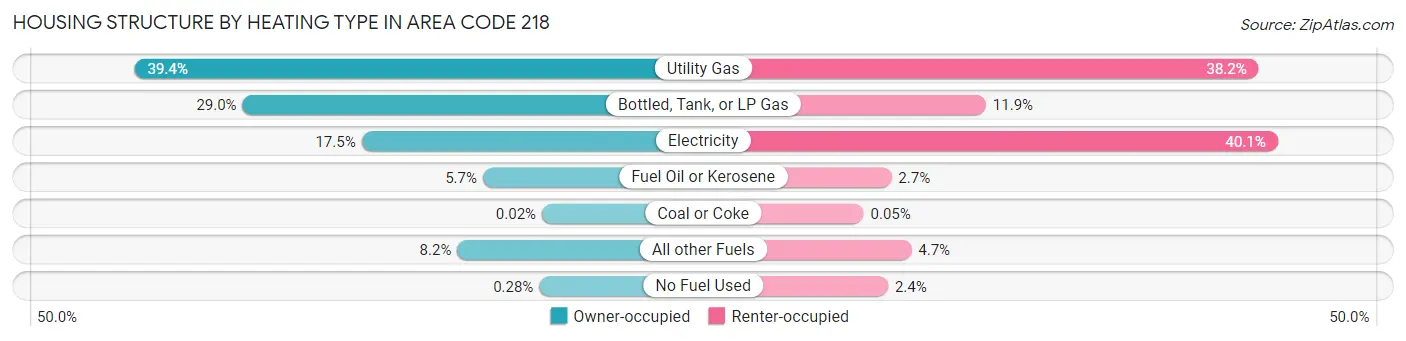
| Heating Type | Owner-occupied | Renter-occupied |
| Utility Gas | 97,738 (39.4%) | 30,274 (38.2%) |
| Bottled, Tank, or LP Gas | 71,861 (28.9%) | 9,405 (11.9%) |
| Electricity | 43,306 (17.4%) | 31,734 (40.1%) |
| Fuel Oil or Kerosene | 14,214 (5.7%) | 2,173 (2.7%) |
| Coal or Coke | 40 (0.0%) | 37 (0.1%) |
| All other Fuels | 20,351 (8.2%) | 3,701 (4.7%) |
| No Fuel Used | 687 (0.3%) | 1,906 (2.4%) |
| Total | 248,197 (100.0%) | 79,230 (100.0%) |
Household Vehicle Usage in Area Code 218
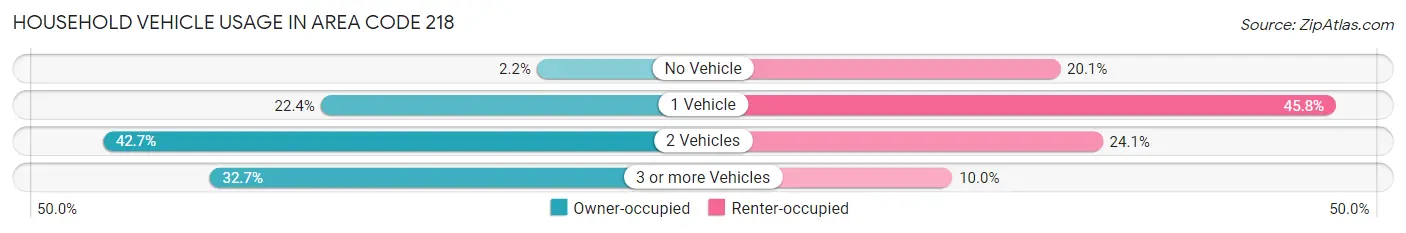
| Vehicles per Household | Owner-occupied | Renter-occupied |
| No Vehicle | 5,442 (2.2%) | 15,914 (20.1%) |
| 1 Vehicle | 55,528 (22.4%) | 36,315 (45.8%) |
| 2 Vehicles | 105,987 (42.7%) | 19,065 (24.1%) |
| 3 or more Vehicles | 81,240 (32.7%) | 7,936 (10.0%) |
| Total | 248,197 (100.0%) | 79,230 (100.0%) |
Real Estate & Mortgages in Area Code 218
Real Estate and Mortgage Overview in Area Code 218
| Characteristic | Without Mortgage | With Mortgage |
| Housing Units | 106,756 | 141,441 |
| Median Property Value | $50,187,200 | $55,985,700 |
| Median Household Income | $16,519,039 | $28,024 |
| Monthly Housing Costs | $147,845 | $7,850 |
| Real Estate Taxes | $426,939 | $2,835 |
Property Value by Mortgage Status in Area Code 218
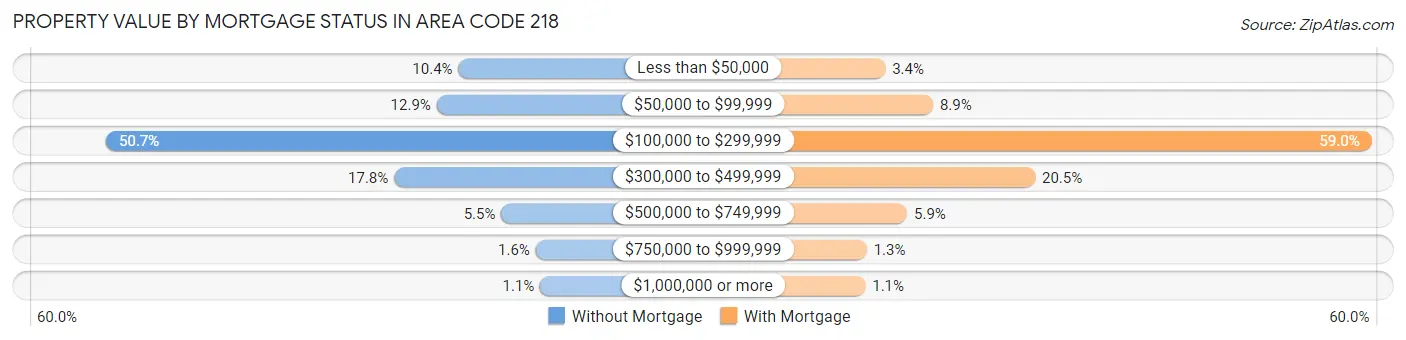
| Property Value | Without Mortgage | With Mortgage |
| Less than $50,000 | 11,129 (10.4%) | 4,801 (3.4%) |
| $50,000 to $99,999 | 13,787 (12.9%) | 12,511 (8.8%) |
| $100,000 to $299,999 | 54,120 (50.7%) | 83,417 (59.0%) |
| $300,000 to $499,999 | 18,968 (17.8%) | 29,009 (20.5%) |
| $500,000 to $749,999 | 5,897 (5.5%) | 8,328 (5.9%) |
| $750,000 to $999,999 | 1,697 (1.6%) | 1,809 (1.3%) |
| $1,000,000 or more | 1,158 (1.1%) | 1,566 (1.1%) |
| Total | 106,756 (100.0%) | 141,441 (100.0%) |
Household Income by Mortgage Status in Area Code 218
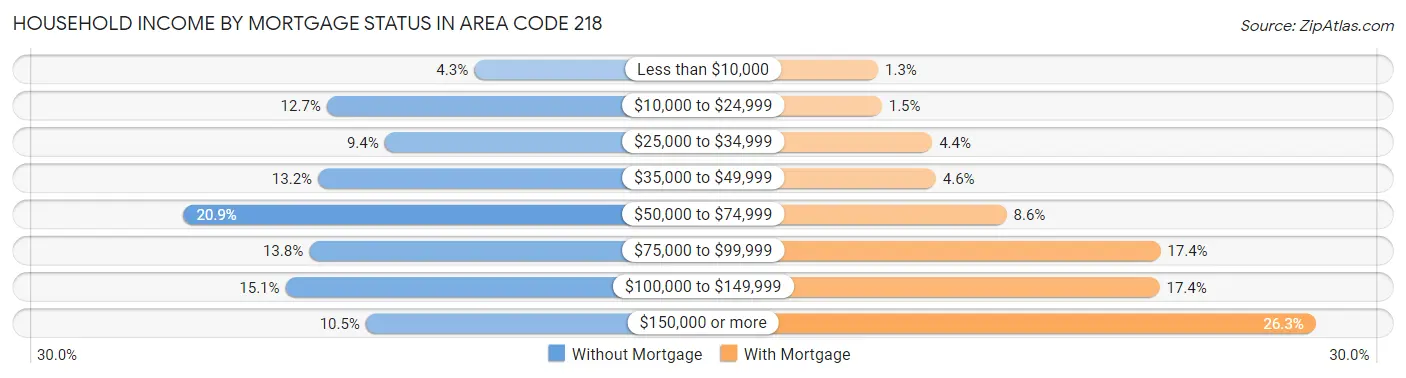
| Household Income | Without Mortgage | With Mortgage |
| Less than $10,000 | 4,607 (4.3%) | 1,831 (1.3%) |
| $10,000 to $24,999 | 13,600 (12.7%) | 2,128 (1.5%) |
| $25,000 to $34,999 | 10,065 (9.4%) | 6,192 (4.4%) |
| $35,000 to $49,999 | 14,131 (13.2%) | 6,492 (4.6%) |
| $50,000 to $74,999 | 22,330 (20.9%) | 12,205 (8.6%) |
| $75,000 to $99,999 | 14,678 (13.8%) | 24,637 (17.4%) |
| $100,000 to $149,999 | 16,125 (15.1%) | 24,574 (17.4%) |
| $150,000 or more | 11,220 (10.5%) | 37,189 (26.3%) |
| Total | 106,756 (100.0%) | 141,441 (100.0%) |
Property Value to Household Income Ratio in Area Code 218
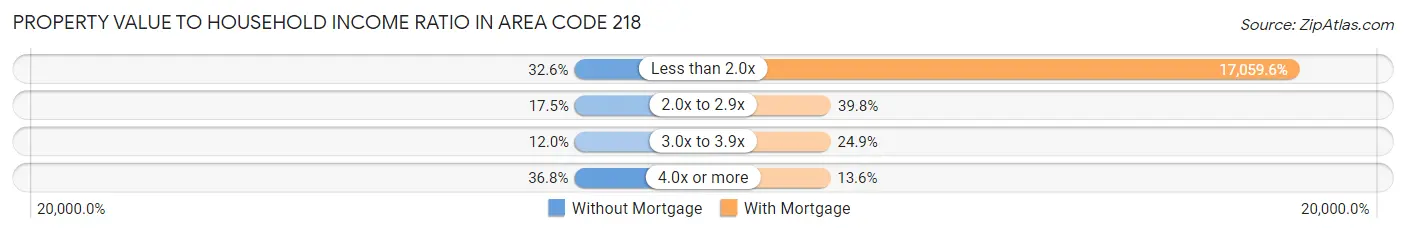
| Value-to-Income Ratio | Without Mortgage | With Mortgage |
| Less than 2.0x | 34,824 (32.6%) | 24,129,287 (17,059.6%) |
| 2.0x to 2.9x | 18,689 (17.5%) | 56,240 (39.8%) |
| 3.0x to 3.9x | 12,841 (12.0%) | 35,223 (24.9%) |
| 4.0x or more | 39,281 (36.8%) | 19,251 (13.6%) |
| Total | 106,756 (100.0%) | 141,441 (100.0%) |
Real Estate Taxes by Mortgage Status in Area Code 218
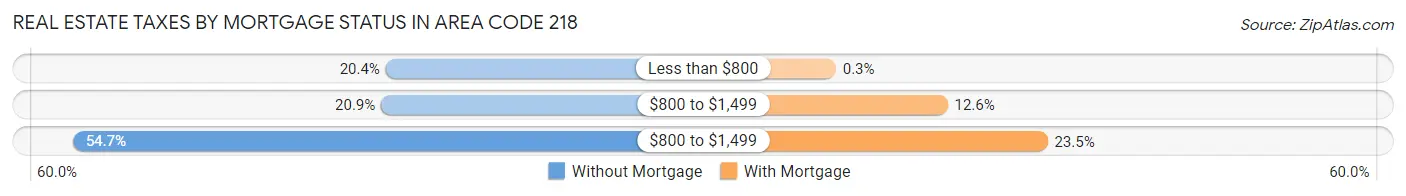
| Property Taxes | Without Mortgage | With Mortgage |
| Less than $800 | 21,810 (20.4%) | 429 (0.3%) |
| $800 to $1,499 | 22,342 (20.9%) | 17,751 (12.6%) |
| $800 to $1,499 | 58,418 (54.7%) | 33,234 (23.5%) |
| Total | 106,756 (100.0%) | 141,441 (100.0%) |
Health & Disability in Area Code 218
Health Insurance Coverage by Age in Area Code 218
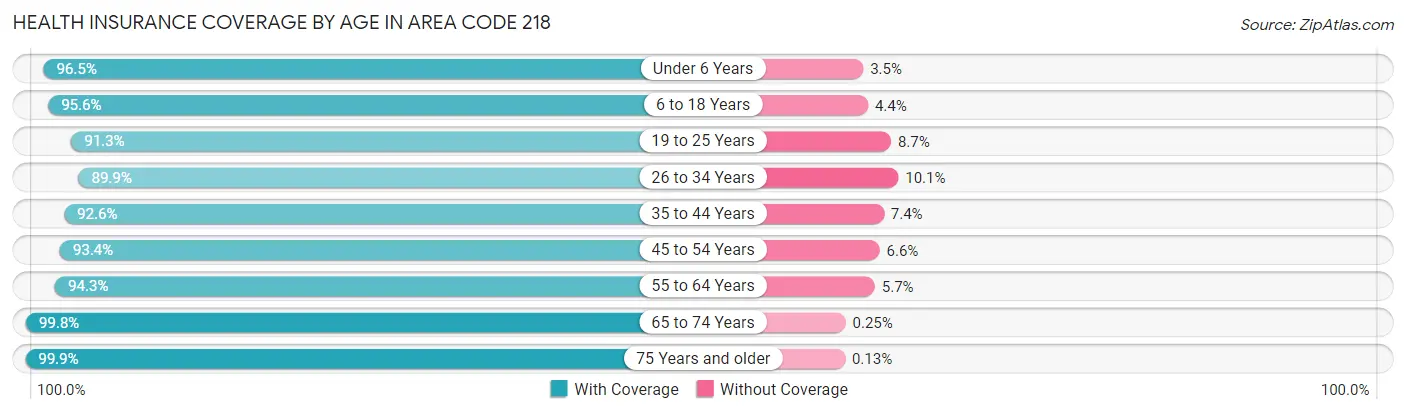
| Age Bracket | With Coverage | Without Coverage |
| Under 6 Years | 50,843 (96.5%) | 1,861 (3.5%) |
| 6 to 18 Years | 122,703 (95.6%) | 5,662 (4.4%) |
| 19 to 25 Years | 64,311 (91.3%) | 6,133 (8.7%) |
| 26 to 34 Years | 69,391 (89.9%) | 7,772 (10.1%) |
| 35 to 44 Years | 84,057 (92.6%) | 6,700 (7.4%) |
| 45 to 54 Years | 80,955 (93.4%) | 5,704 (6.6%) |
| 55 to 64 Years | 108,176 (94.3%) | 6,542 (5.7%) |
| 65 to 74 Years | 96,349 (99.8%) | 245 (0.3%) |
| 75 Years and older | 64,376 (99.9%) | 86 (0.1%) |
| Total | 741,161 (94.8%) | 40,705 (5.2%) |
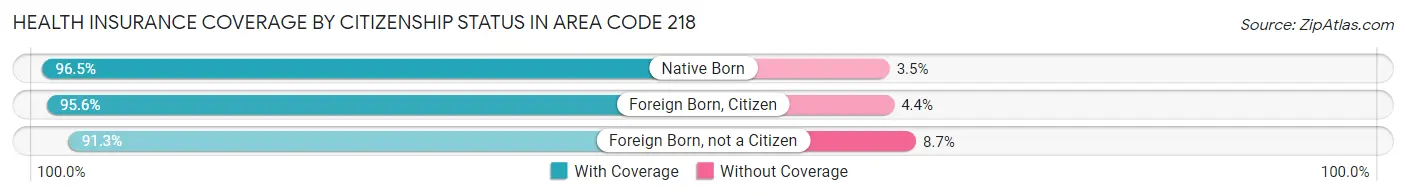
Health Insurance Coverage by Citizenship Status in Area Code 218
| Citizenship Status | With Coverage | Without Coverage |
| Native Born | 50,843 (96.5%) | 1,861 (3.5%) |
| Foreign Born, Citizen | 122,703 (95.6%) | 5,662 (4.4%) |
| Foreign Born, not a Citizen | 64,311 (91.3%) | 6,133 (8.7%) |
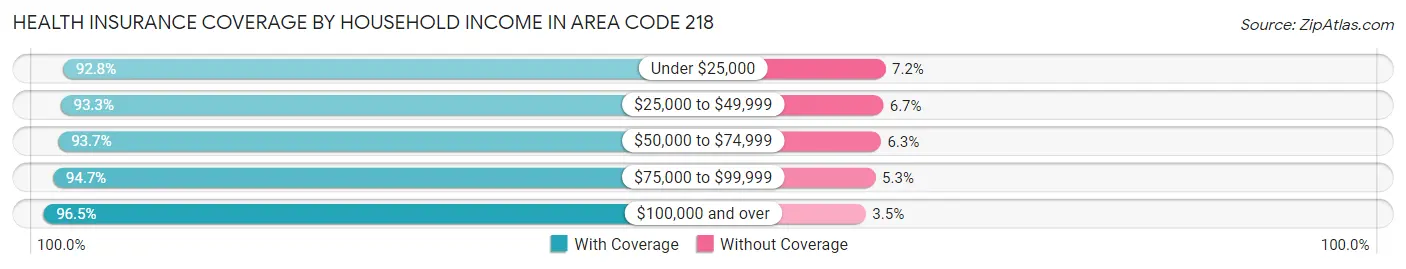
Health Insurance Coverage by Household Income in Area Code 218
| Household Income | With Coverage | Without Coverage |
| Under $25,000 | 79,354 (92.8%) | 6,130 (7.2%) |
| $25,000 to $49,999 | 117,505 (93.3%) | 8,498 (6.7%) |
| $50,000 to $74,999 | 124,762 (93.7%) | 8,397 (6.3%) |
| $75,000 to $99,999 | 113,627 (94.7%) | 6,372 (5.3%) |
| $100,000 and over | 291,690 (96.5%) | 10,542 (3.5%) |
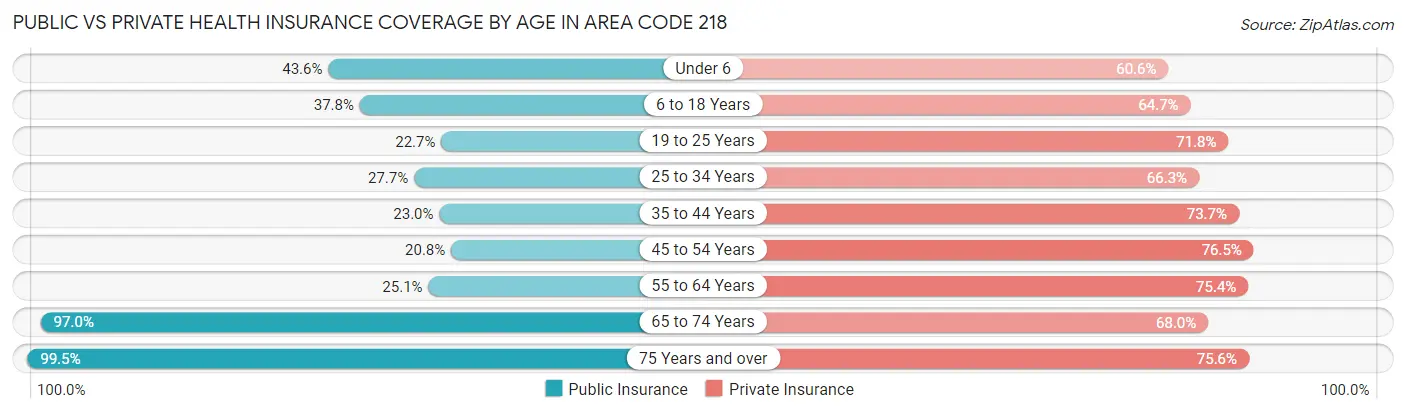
Public vs Private Health Insurance Coverage by Age in Area Code 218
| Age Bracket | Public Insurance | Private Insurance |
| Under 6 | 22,993 (43.6%) | 31,938 (60.6%) |
| 6 to 18 Years | 48,508 (37.8%) | 83,069 (64.7%) |
| 19 to 25 Years | 15,962 (22.7%) | 50,544 (71.8%) |
| 25 to 34 Years | 21,381 (27.7%) | 51,143 (66.3%) |
| 35 to 44 Years | 20,891 (23.0%) | 66,875 (73.7%) |
| 45 to 54 Years | 18,052 (20.8%) | 66,252 (76.4%) |
| 55 to 64 Years | 28,739 (25.1%) | 86,519 (75.4%) |
| 65 to 74 Years | 93,738 (97.0%) | 65,677 (68.0%) |
| 75 Years and over | 64,131 (99.5%) | 48,704 (75.5%) |
| Total | 334,395 (42.8%) | 550,721 (70.4%) |
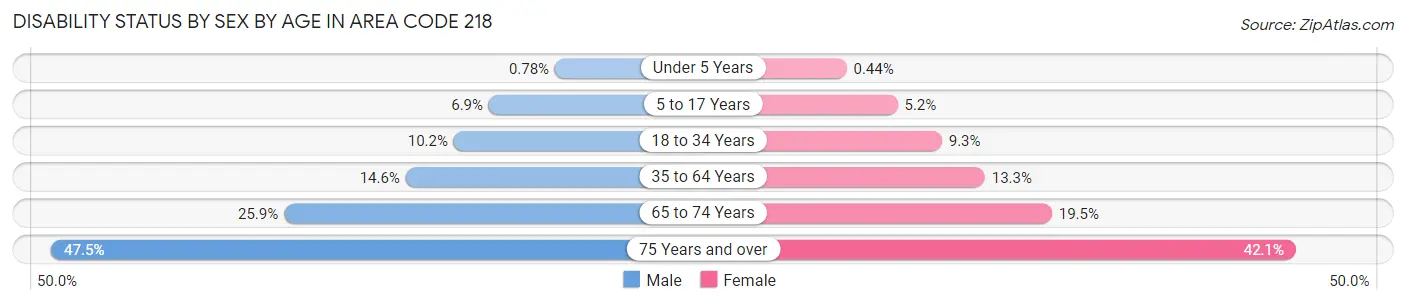
Disability Status by Sex by Age in Area Code 218
| Age Bracket | Male | Female |
| Under 5 Years | 173 (0.8%) | 91 (0.4%) |
| 5 to 17 Years | 4,532 (6.9%) | 3,183 (5.2%) |
| 18 to 34 Years | 8,297 (10.2%) | 7,157 (9.3%) |
| 35 to 64 Years | 21,828 (14.6%) | 18,961 (13.3%) |
| 65 to 74 Years | 12,767 (25.9%) | 9,223 (19.5%) |
| 75 Years and over | 13,552 (47.5%) | 15,146 (42.1%) |
Disability Class by Sex by Age in Area Code 218
Disability Class: Hearing Difficulty
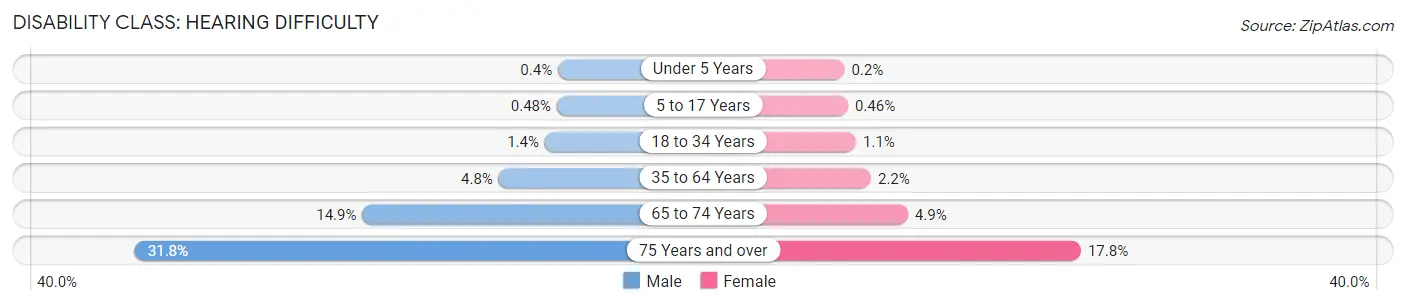
| Age Bracket | Male | Female |
| Under 5 Years | 88 (0.4%) | 42 (0.2%) |
| 5 to 17 Years | 314 (0.5%) | 284 (0.5%) |
| 18 to 34 Years | 1,122 (1.4%) | 819 (1.1%) |
| 35 to 64 Years | 7,163 (4.8%) | 3,096 (2.2%) |
| 65 to 74 Years | 7,355 (14.9%) | 2,325 (4.9%) |
| 75 Years and over | 9,070 (31.8%) | 6,386 (17.8%) |
Disability Class: Vision Difficulty
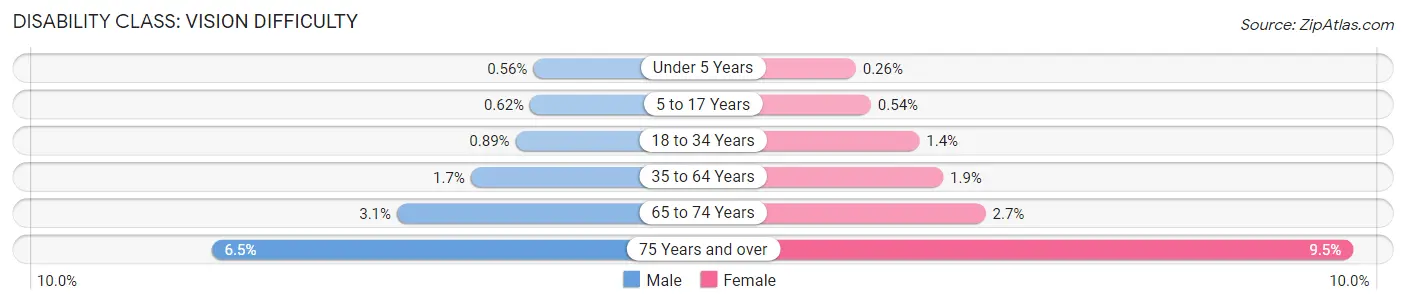
| Age Bracket | Male | Female |
| Under 5 Years | 123 (0.6%) | 55 (0.3%) |
| 5 to 17 Years | 408 (0.6%) | 331 (0.5%) |
| 18 to 34 Years | 722 (0.9%) | 1,107 (1.4%) |
| 35 to 64 Years | 2,570 (1.7%) | 2,691 (1.9%) |
| 65 to 74 Years | 1,522 (3.1%) | 1,266 (2.7%) |
| 75 Years and over | 1,863 (6.5%) | 3,411 (9.5%) |
Disability Class: Cognitive Difficulty
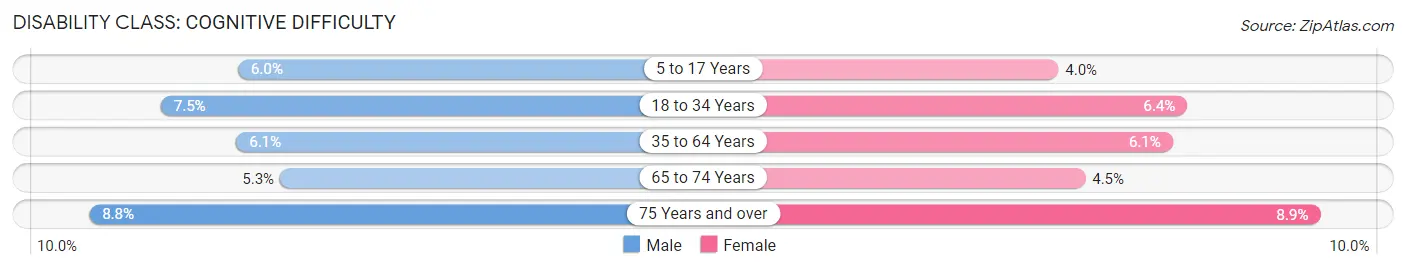
| Age Bracket | Male | Female |
| 5 to 17 Years | 3,967 (6.0%) | 2,474 (4.0%) |
| 18 to 34 Years | 6,094 (7.5%) | 4,944 (6.4%) |
| 35 to 64 Years | 9,060 (6.1%) | 8,770 (6.1%) |
| 65 to 74 Years | 2,593 (5.3%) | 2,140 (4.5%) |
| 75 Years and over | 2,510 (8.8%) | 3,193 (8.9%) |
Disability Class: Ambulatory Difficulty
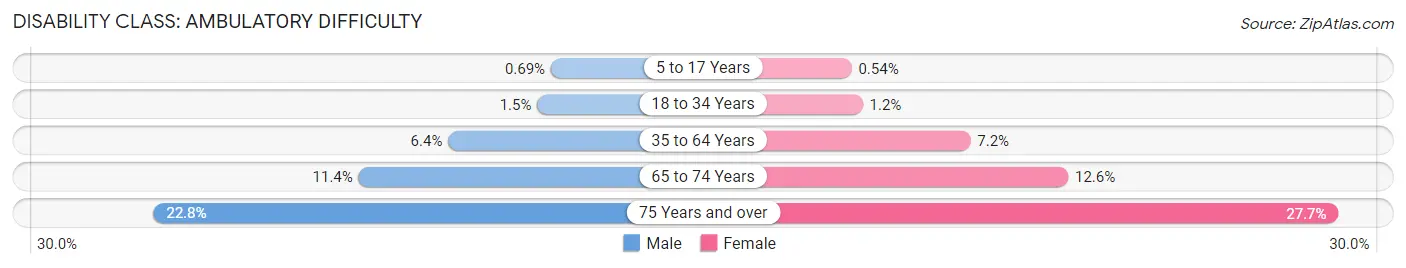
| Age Bracket | Male | Female |
| 5 to 17 Years | 451 (0.7%) | 332 (0.5%) |
| 18 to 34 Years | 1,179 (1.5%) | 894 (1.2%) |
| 35 to 64 Years | 9,558 (6.4%) | 10,228 (7.2%) |
| 65 to 74 Years | 5,617 (11.4%) | 5,962 (12.6%) |
| 75 Years and over | 6,509 (22.8%) | 9,940 (27.7%) |
Disability Class: Self-Care Difficulty
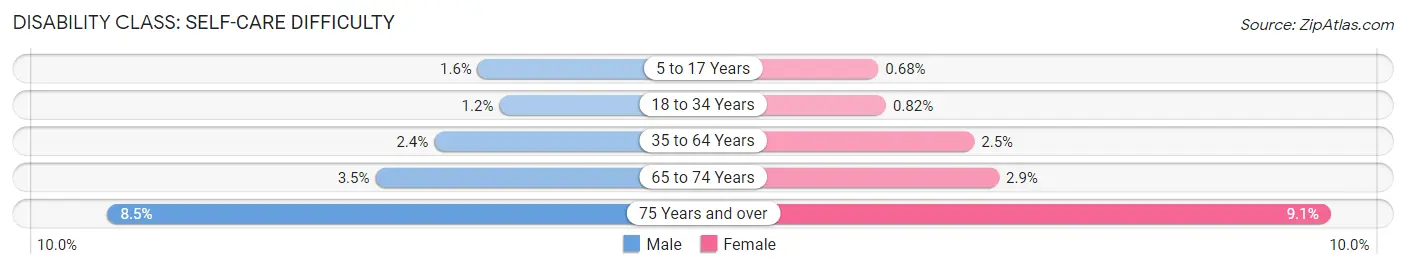
| Age Bracket | Male | Female |
| 5 to 17 Years | 1,045 (1.6%) | 418 (0.7%) |
| 18 to 34 Years | 967 (1.2%) | 629 (0.8%) |
| 35 to 64 Years | 3,582 (2.4%) | 3,515 (2.5%) |
| 65 to 74 Years | 1,717 (3.5%) | 1,380 (2.9%) |
| 75 Years and over | 2,412 (8.5%) | 3,261 (9.1%) |
Technology Access in Area Code 218
Computing Device Access in Area Code 218
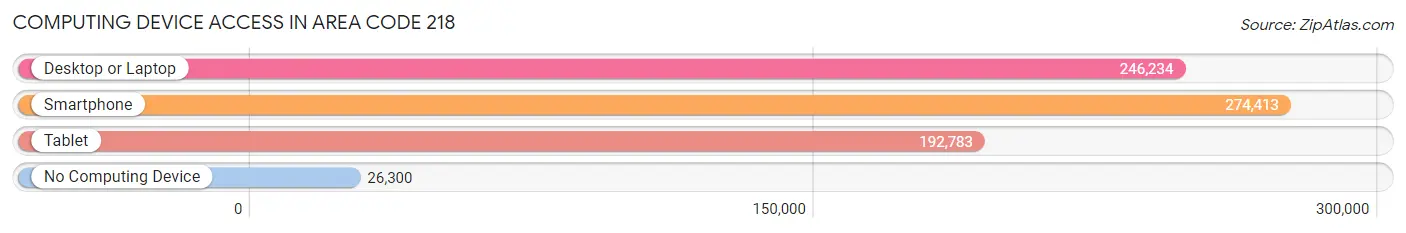
| Device Type | # Households | % Households |
| Desktop or Laptop | 246,234 | 75.2% |
| Smartphone | 274,413 | 83.8% |
| Tablet | 192,783 | 58.9% |
| No Computing Device | 26,300 | 8.0% |
| Total | 327,427 | 100.0% |
Internet Access in Area Code 218
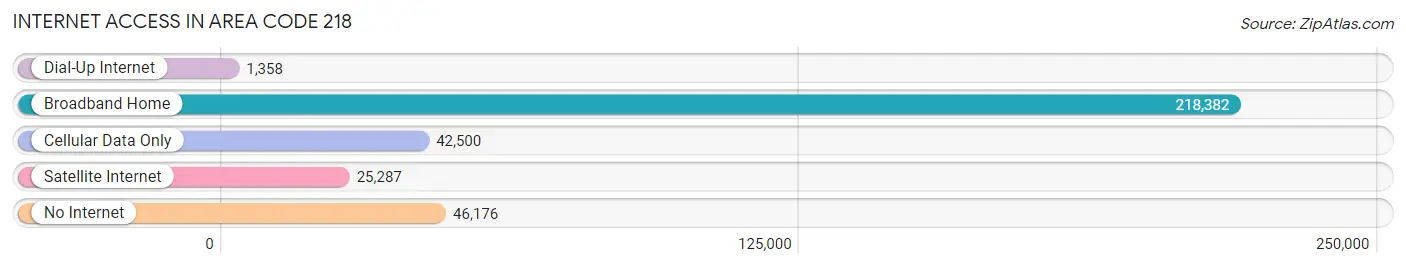
| Internet Type | # Households | % Households |
| Dial-Up Internet | 1,358 | 0.4% |
| Broadband Home | 218,382 | 66.7% |
| Cellular Data Only | 42,500 | 13.0% |
| Satellite Internet | 25,287 | 7.7% |
| No Internet | 46,176 | 14.1% |
| Total | 327,427 | 100.0% |
Area Code 218 Summary
Geography
Area code 218 is located in the northern part of Minnesota, covering the cities of Duluth, Grand Rapids, and Brainerd. It also covers the Iron Range region, which is a major mining area in the state.
Social
Area code 218 is home to a diverse population of people from all walks of life. The area is known for its strong sense of community and its vibrant culture. There are many festivals and events throughout the year that bring people together.
Economics
Area code 218 is an important economic hub for the state of Minnesota. It is home to many large companies, such as 3M, UnitedHealth Group, and Target. The area is also home to a number of small businesses, which provide jobs and economic opportunities for the local population.
Demographics
Area code 218 is home to a population of over 1.2 million people. The majority of the population is white, with a smaller percentage of African Americans, Asians, and Hispanics. The median household income is slightly above the national average, and the unemployment rate is lower than the national average.
Common Questions
What is Per Capita Income in Area Code 218?
Per Capita income in Area Code 218 is $35,220.
What is the Median Family Income in Area Code 218?
Median Family Income in Area Code 218 is $83,832.
What is the Median Household income in Area Code 218?
Median Household Income in Area Code 218 is $66,438.
What is Income or Wage Gap in Area Code 218?
Income or Wage Gap in Area Code 218 is 31.5%.
Women in Area Code 218 earn 68.5 cents for every dollar earned by a man.
What is Family Income Deficit in Area Code 218?
Family Income Deficit in Area Code 218 is $10,141.
Families that are below poverty line in Area Code 218 earn $10,141 less on average than the poverty threshold level.
What is Inequality or Gini Index in Area Code 218?
Inequality or Gini Index in Area Code 218 is 115.23.
What is the Total Population of Area Code 218?
Total Population of Area Code 218 is 794,247.
What is the Total Male Population of Area Code 218?
Total Male Population of Area Code 218 is 402,947.
What is the Total Female Population of Area Code 218?
Total Female Population of Area Code 218 is 391,300.
What is the Ratio of Males per 100 Females in Area Code 218?
There are 102.98 Males per 100 Females in Area Code 218.
What is the Ratio of Females per 100 Males in Area Code 218?
There are 97.11 Females per 100 Males in Area Code 218.
What is the Median Population Age in Area Code 218?
Median Population Age in Area Code 218 is 46.7 Years.
What is the Average Family Size in Area Code 218
Average Family Size in Area Code 218 is 2.9 People.
What is the Average Household Size in Area Code 218
Average Household Size in Area Code 218 is 2.4 People.
How Large is the Labor Force in Area Code 218?
There are 379,051 People in the Labor Forcein in Area Code 218.
What is the Percentage of People in the Labor Force in Area Code 218?
58.9% of People are in the Labor Force in Area Code 218.
What is the Unemployment Rate in Area Code 218?
Unemployment Rate in Area Code 218 is 5.6%.