Traverse County, MN Map & Demographics
Traverse County Map
Traverse County Overview
$36,023
PER CAPITA INCOME
$89,432
AVG FAMILY INCOME
$63,456
AVG HOUSEHOLD INCOME
38.5%
WAGE / INCOME GAP [ % ]
61.5¢/ $1
WAGE / INCOME GAP [ $ ]
0.43
INEQUALITY / GINI INDEX
3,345
TOTAL POPULATION
1,660
MALE POPULATION
1,685
FEMALE POPULATION
98.52
MALES / 100 FEMALES
101.51
FEMALES / 100 MALES
45.3
MEDIAN AGE
3.0
AVG FAMILY SIZE
2.3
AVG HOUSEHOLD SIZE
1,673
LABOR FORCE [ PEOPLE ]
62.3%
PERCENT IN LABOR FORCE
4.0%
UNEMPLOYMENT RATE
Income in Traverse County
Income Overview in Traverse County
Per Capita Income in Traverse County is $36,023, while median incomes of families and households are $89,432 and $63,456 respectively.
| Characteristic | Number | Measure |
| Per Capita Income | 3,345 | $36,023 |
| Median Family Income | 875 | $89,432 |
| Mean Family Income | 875 | $102,988 |
| Median Household Income | 1,433 | $63,456 |
| Mean Household Income | 1,433 | $81,057 |
| Income Deficit | 875 | $0 |
| Wage / Income Gap (%) | 3,345 | 38.55% |
| Wage / Income Gap ($) | 3,345 | 61.45¢ per $1 |
| Gini / Inequality Index | 3,345 | 0.43 |
Earnings by Sex in Traverse County
Average Earnings in Traverse County are $40,329, $47,900 for men and $29,435 for women, a difference of 38.6%.
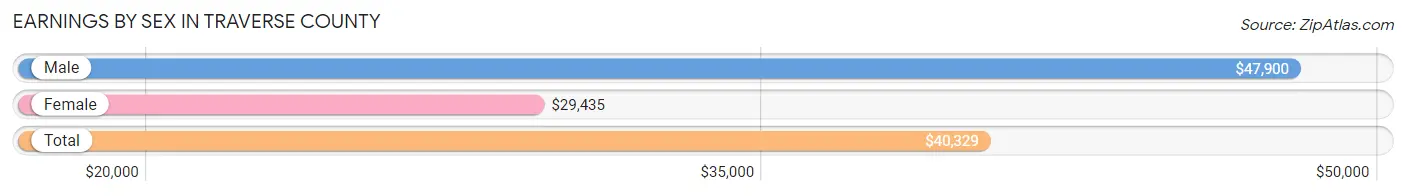
| Sex | Number | Average Earnings |
| Male | 988 (55.7%) | $47,900 |
| Female | 785 (44.3%) | $29,435 |
| Total | 1,773 (100.0%) | $40,329 |
Earnings by Sex by Income Bracket in Traverse County
The most common earnings brackets in Traverse County are $100,000+ for men (142 | 14.4%) and $25,000 to $29,999 for women (84 | 10.7%).
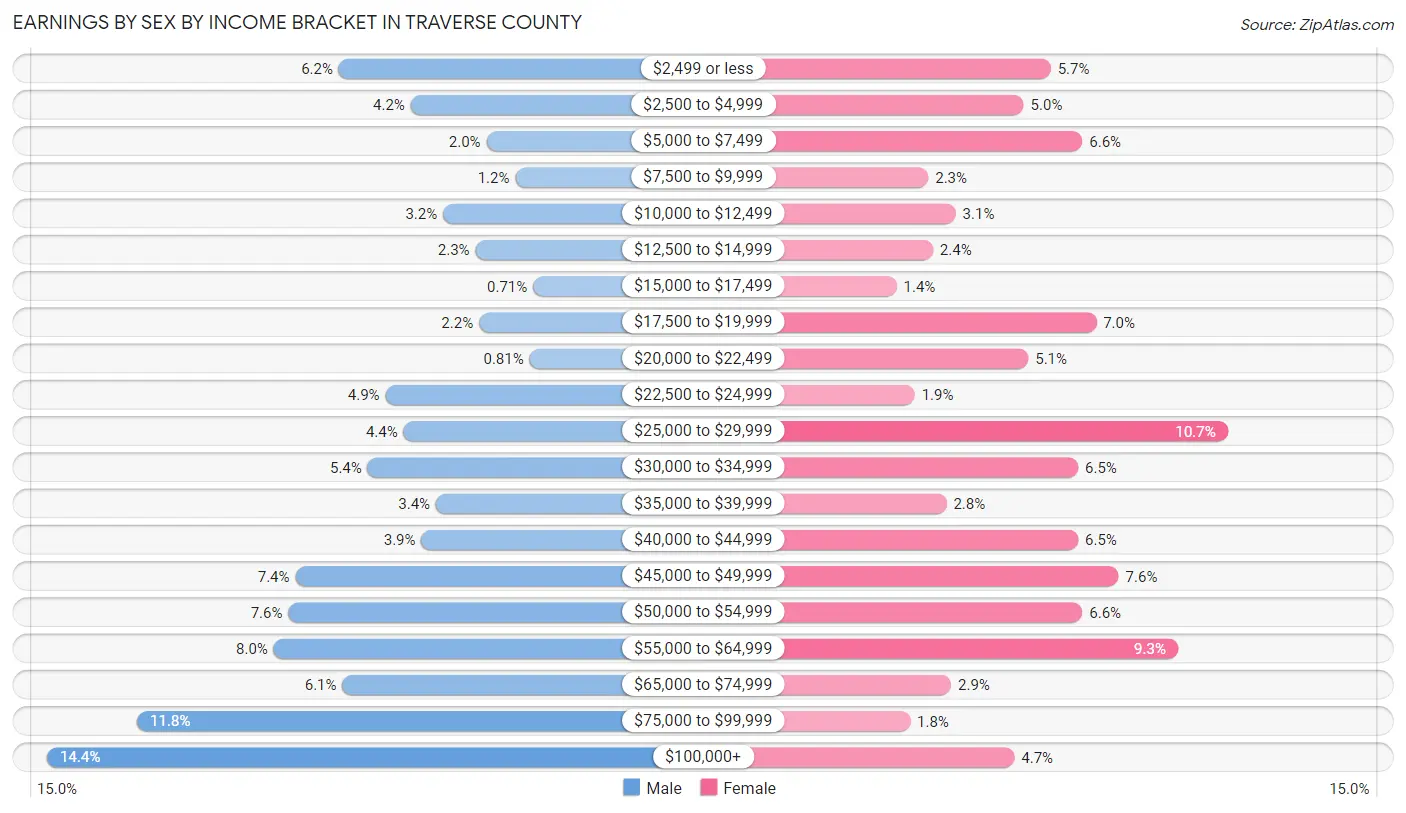
| Income | Male | Female |
| $2,499 or less | 61 (6.2%) | 45 (5.7%) |
| $2,500 to $4,999 | 41 (4.2%) | 39 (5.0%) |
| $5,000 to $7,499 | 20 (2.0%) | 52 (6.6%) |
| $7,500 to $9,999 | 12 (1.2%) | 18 (2.3%) |
| $10,000 to $12,499 | 32 (3.2%) | 24 (3.1%) |
| $12,500 to $14,999 | 23 (2.3%) | 19 (2.4%) |
| $15,000 to $17,499 | 7 (0.7%) | 11 (1.4%) |
| $17,500 to $19,999 | 22 (2.2%) | 55 (7.0%) |
| $20,000 to $22,499 | 8 (0.8%) | 40 (5.1%) |
| $22,500 to $24,999 | 48 (4.9%) | 15 (1.9%) |
| $25,000 to $29,999 | 43 (4.3%) | 84 (10.7%) |
| $30,000 to $34,999 | 53 (5.4%) | 51 (6.5%) |
| $35,000 to $39,999 | 34 (3.4%) | 22 (2.8%) |
| $40,000 to $44,999 | 38 (3.8%) | 51 (6.5%) |
| $45,000 to $49,999 | 73 (7.4%) | 60 (7.6%) |
| $50,000 to $54,999 | 75 (7.6%) | 52 (6.6%) |
| $55,000 to $64,999 | 79 (8.0%) | 73 (9.3%) |
| $65,000 to $74,999 | 60 (6.1%) | 23 (2.9%) |
| $75,000 to $99,999 | 117 (11.8%) | 14 (1.8%) |
| $100,000+ | 142 (14.4%) | 37 (4.7%) |
| Total | 988 (100.0%) | 785 (100.0%) |
Earnings by Sex by Educational Attainment in Traverse County
Average earnings in Traverse County are $51,993 for men and $33,145 for women, a difference of 36.2%. Men with an educational attainment of bachelor's degree enjoy the highest average annual earnings of $79,625, while those with high school diploma education earn the least with $40,625. Women with an educational attainment of graduate degree earn the most with the average annual earnings of $68,750, while those with high school diploma education have the smallest earnings of $25,859.
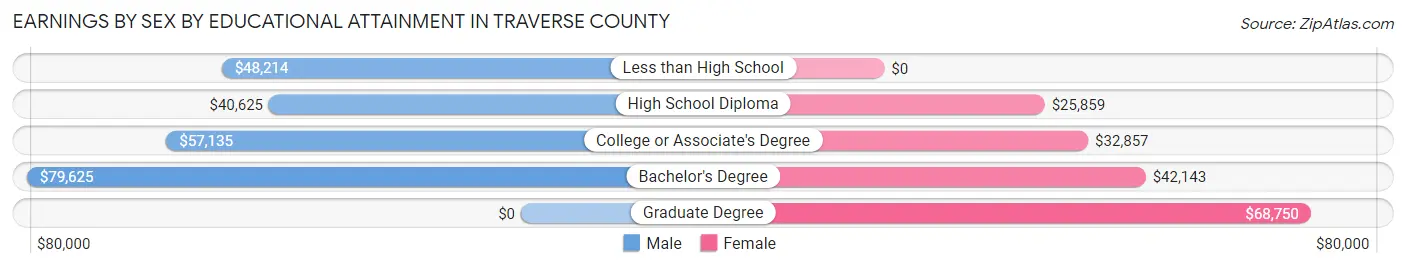
| Educational Attainment | Male Income | Female Income |
| Less than High School | $48,214 | $0 |
| High School Diploma | $40,625 | $25,859 |
| College or Associate's Degree | $57,135 | $32,857 |
| Bachelor's Degree | $79,625 | $42,143 |
| Graduate Degree | - | - |
| Total | $51,993 | $33,145 |
Family Income in Traverse County
Family Income Brackets in Traverse County
According to the Traverse County family income data, there are 202 families falling into the $100,000 to $149,999 income range, which is the most common income bracket and makes up 23.1% of all families. Conversely, the $10,000 to $14,999 income bracket is the least frequent group with only 12 families (1.4%) belonging to this category.
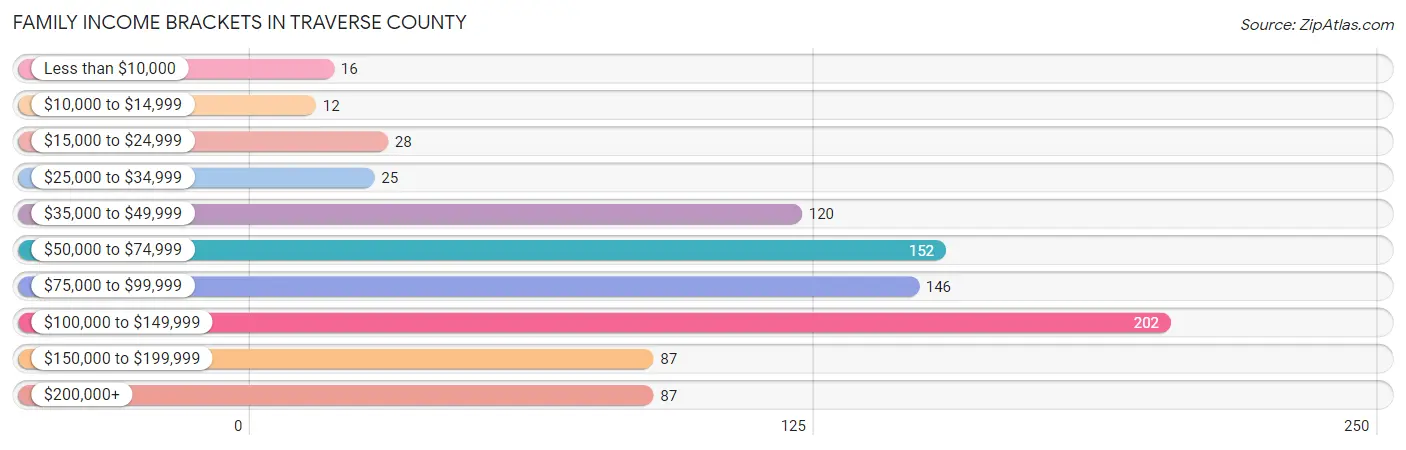
| Income Bracket | # Families | % Families |
| Less than $10,000 | 16 | 1.8% |
| $10,000 to $14,999 | 12 | 1.4% |
| $15,000 to $24,999 | 28 | 3.2% |
| $25,000 to $34,999 | 25 | 2.9% |
| $35,000 to $49,999 | 120 | 13.7% |
| $50,000 to $74,999 | 152 | 17.4% |
| $75,000 to $99,999 | 146 | 16.7% |
| $100,000 to $149,999 | 202 | 23.1% |
| $150,000 to $199,999 | 87 | 9.9% |
| $200,000+ | 87 | 9.9% |
Family Income by Famaliy Size in Traverse County
4-person families (148 | 16.9%) account for the highest median family income in Traverse County with $114,500 per family, while 2-person families (482 | 55.1%) have the highest median income of $43,572 per family member.
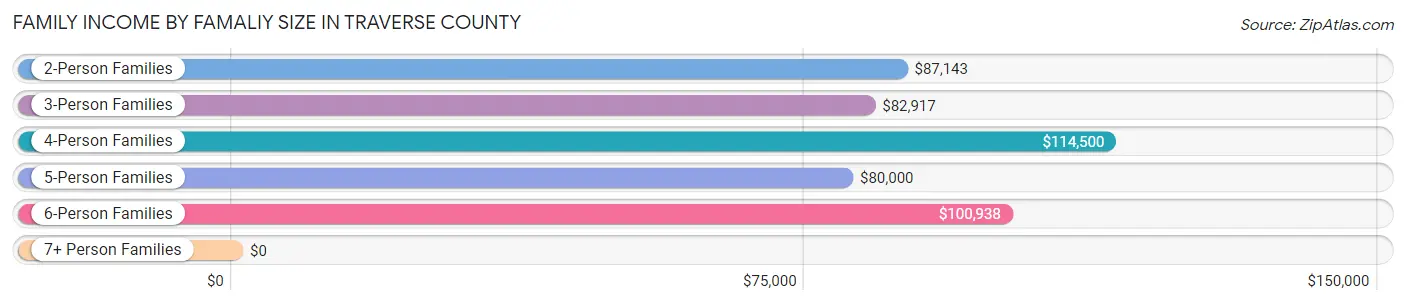
| Income Bracket | # Families | Median Income |
| 2-Person Families | 482 (55.1%) | $87,143 |
| 3-Person Families | 153 (17.5%) | $82,917 |
| 4-Person Families | 148 (16.9%) | $114,500 |
| 5-Person Families | 48 (5.5%) | $80,000 |
| 6-Person Families | 43 (4.9%) | $100,938 |
| 7+ Person Families | 1 (0.1%) | $0 |
| Total | 875 (100.0%) | $89,432 |
Family Income by Number of Earners in Traverse County
The median family income in Traverse County is $89,432, with families comprising 3+ earners (80) having the highest median family income of $160,500, while families with no earners (143) have the lowest median family income of $53,281, accounting for 9.1% and 16.3% of families, respectively.
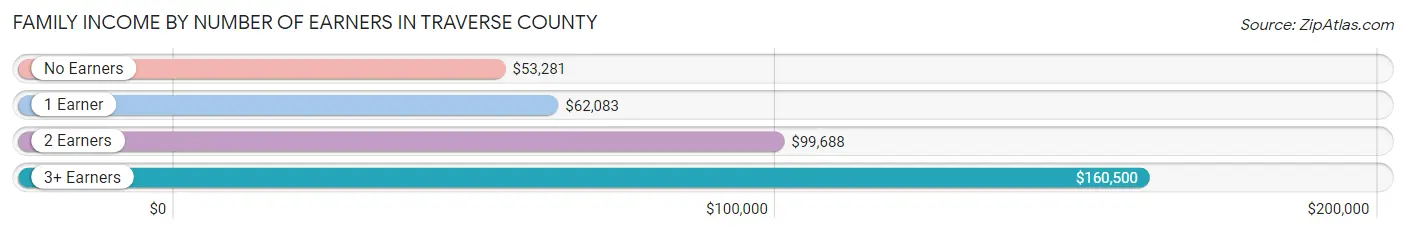
| Number of Earners | # Families | Median Income |
| No Earners | 143 (16.3%) | $53,281 |
| 1 Earner | 183 (20.9%) | $62,083 |
| 2 Earners | 469 (53.6%) | $99,688 |
| 3+ Earners | 80 (9.1%) | $160,500 |
| Total | 875 (100.0%) | $89,432 |
Household Income in Traverse County
Household Income Brackets in Traverse County
With 246 households falling in the category, the $50,000 to $74,999 income range is the most frequent in Traverse County, accounting for 17.2% of all households. In contrast, only 43 households (3.0%) fall into the less than $10,000 income bracket, making it the least populous group.
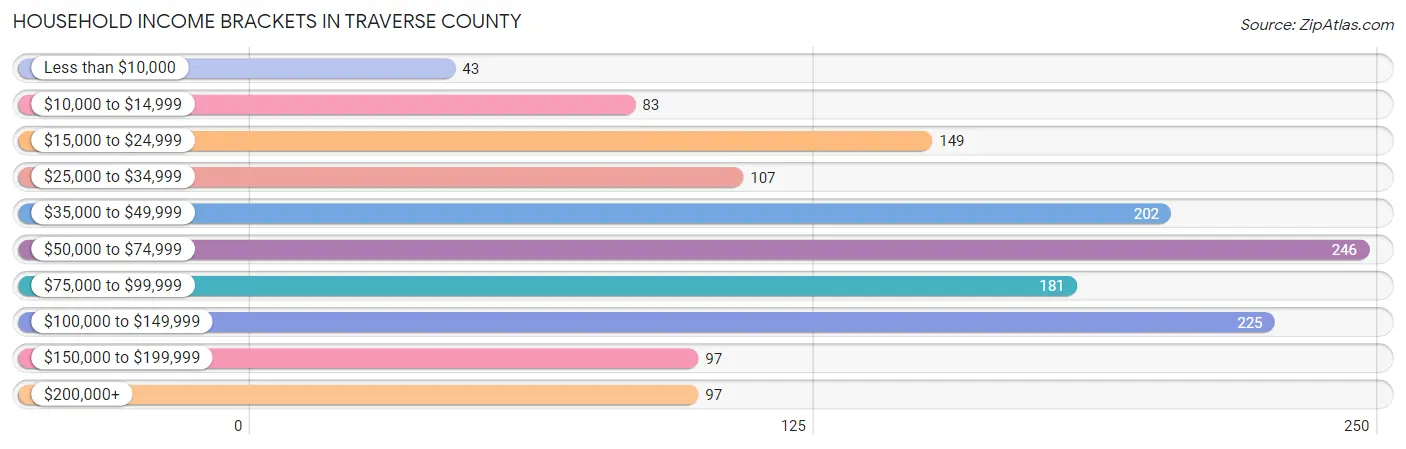
| Income Bracket | # Households | % Households |
| Less than $10,000 | 43 | 3.0% |
| $10,000 to $14,999 | 83 | 5.8% |
| $15,000 to $24,999 | 149 | 10.4% |
| $25,000 to $34,999 | 107 | 7.5% |
| $35,000 to $49,999 | 202 | 14.1% |
| $50,000 to $74,999 | 246 | 17.2% |
| $75,000 to $99,999 | 181 | 12.6% |
| $100,000 to $149,999 | 225 | 15.7% |
| $150,000 to $199,999 | 97 | 6.8% |
| $200,000+ | 97 | 6.8% |
Household Income by Householder Age in Traverse County
The median household income in Traverse County is $63,456, with the highest median household income of $84,107 found in the 45 to 64 years age bracket for the primary householder. A total of 492 households (34.3%) fall into this category. Meanwhile, the 15 to 24 years age bracket for the primary householder has the lowest median household income of $44,342, with 60 households (4.2%) in this group.
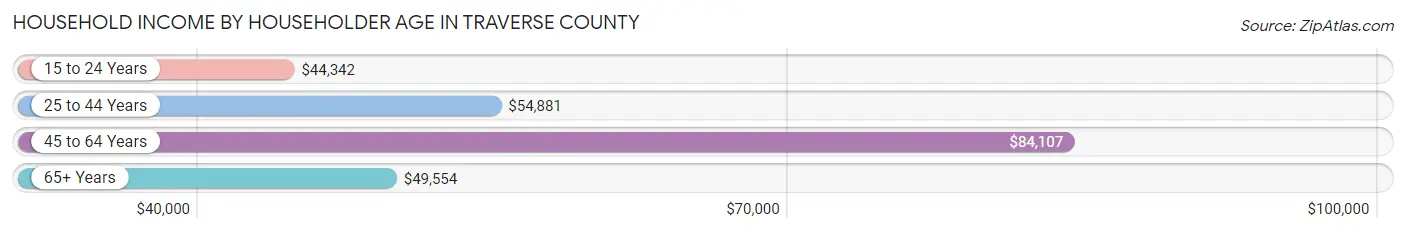
| Income Bracket | # Households | Median Income |
| 15 to 24 Years | 60 (4.2%) | $44,342 |
| 25 to 44 Years | 376 (26.2%) | $54,881 |
| 45 to 64 Years | 492 (34.3%) | $84,107 |
| 65+ Years | 505 (35.2%) | $49,554 |
| Total | 1,433 (100.0%) | $63,456 |
Poverty in Traverse County
Income Below Poverty by Sex and Age in Traverse County
With 7.6% poverty level for males and 9.2% for females among the residents of Traverse County, under 5 year old males and 6 to 11 year old females are the most vulnerable to poverty, with 22 males (22.5%) and 27 females (20.4%) in their respective age groups living below the poverty level.
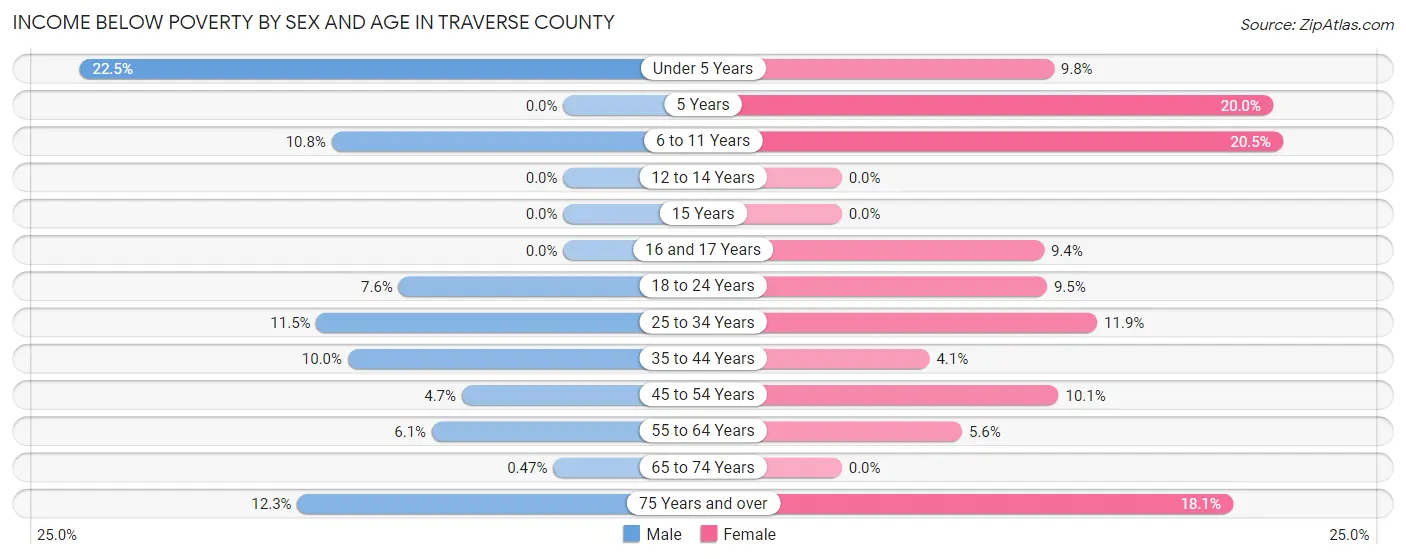
| Age Bracket | Male | Female |
| Under 5 Years | 22 (22.5%) | 12 (9.8%) |
| 5 Years | 0 (0.0%) | 2 (20.0%) |
| 6 to 11 Years | 10 (10.7%) | 27 (20.4%) |
| 12 to 14 Years | 0 (0.0%) | 0 (0.0%) |
| 15 Years | 0 (0.0%) | 0 (0.0%) |
| 16 and 17 Years | 0 (0.0%) | 3 (9.4%) |
| 18 to 24 Years | 12 (7.6%) | 12 (9.5%) |
| 25 to 34 Years | 18 (11.5%) | 16 (11.8%) |
| 35 to 44 Years | 18 (10.0%) | 7 (4.1%) |
| 45 to 54 Years | 8 (4.7%) | 18 (10.1%) |
| 55 to 64 Years | 15 (6.1%) | 14 (5.6%) |
| 65 to 74 Years | 1 (0.5%) | 0 (0.0%) |
| 75 Years and over | 19 (12.3%) | 39 (18.1%) |
| Total | 123 (7.6%) | 150 (9.2%) |
Income Above Poverty by Sex and Age in Traverse County
According to the poverty statistics in Traverse County, males aged 5 years and females aged 12 to 14 years are the age groups that are most secure financially, with 100.0% of males and 100.0% of females in these age groups living above the poverty line.
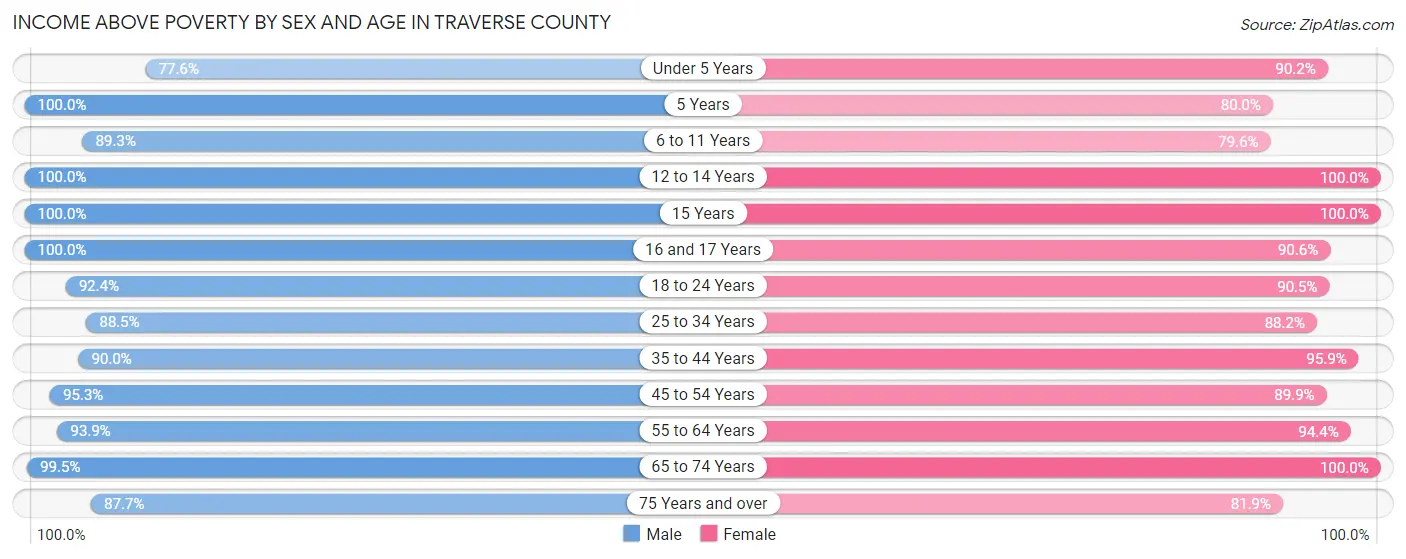
| Age Bracket | Male | Female |
| Under 5 Years | 76 (77.5%) | 110 (90.2%) |
| 5 Years | 20 (100.0%) | 8 (80.0%) |
| 6 to 11 Years | 83 (89.2%) | 105 (79.5%) |
| 12 to 14 Years | 74 (100.0%) | 55 (100.0%) |
| 15 Years | 27 (100.0%) | 28 (100.0%) |
| 16 and 17 Years | 29 (100.0%) | 29 (90.6%) |
| 18 to 24 Years | 145 (92.4%) | 114 (90.5%) |
| 25 to 34 Years | 139 (88.5%) | 119 (88.1%) |
| 35 to 44 Years | 162 (90.0%) | 165 (95.9%) |
| 45 to 54 Years | 162 (95.3%) | 161 (89.9%) |
| 55 to 64 Years | 231 (93.9%) | 237 (94.4%) |
| 65 to 74 Years | 211 (99.5%) | 171 (100.0%) |
| 75 Years and over | 135 (87.7%) | 176 (81.9%) |
| Total | 1,494 (92.4%) | 1,478 (90.8%) |
Income Below Poverty Among Married-Couple Families in Traverse County
The poverty statistics for married-couple families in Traverse County show that 2.6% or 19 of the total 728 families live below the poverty line. Families with 3 or 4 children have the highest poverty rate of 4.4%, comprising of 3 families. On the other hand, families with 5 or more children have the lowest poverty rate of 0.0%, which includes 0 families.
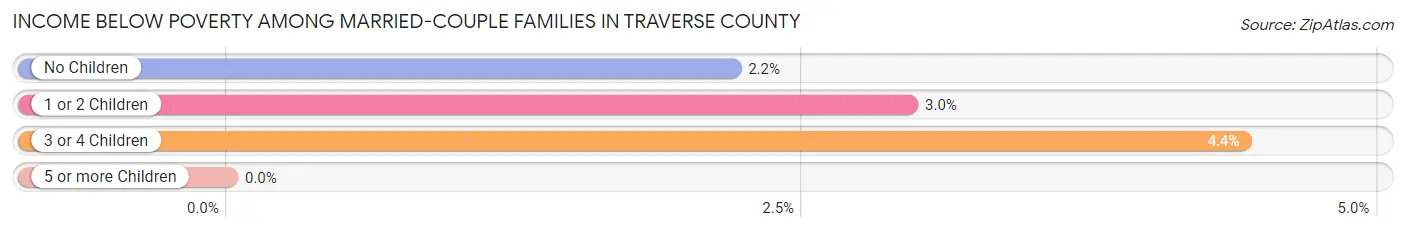
| Children | Above Poverty | Below Poverty |
| No Children | 446 (97.8%) | 10 (2.2%) |
| 1 or 2 Children | 197 (97.0%) | 6 (3.0%) |
| 3 or 4 Children | 65 (95.6%) | 3 (4.4%) |
| 5 or more Children | 1 (100.0%) | 0 (0.0%) |
| Total | 709 (97.4%) | 19 (2.6%) |
Income Below Poverty Among Single-Parent Households in Traverse County
According to the poverty data in Traverse County, 21.6% or 11 single-father households and 12.5% or 12 single-mother households are living below the poverty line. Among single-father households, those with 3 or 4 children have the highest poverty rate, with 11 households (100.0%) experiencing poverty. Likewise, among single-mother households, those with 1 or 2 children have the highest poverty rate, with 12 households (21.8%) falling below the poverty line.
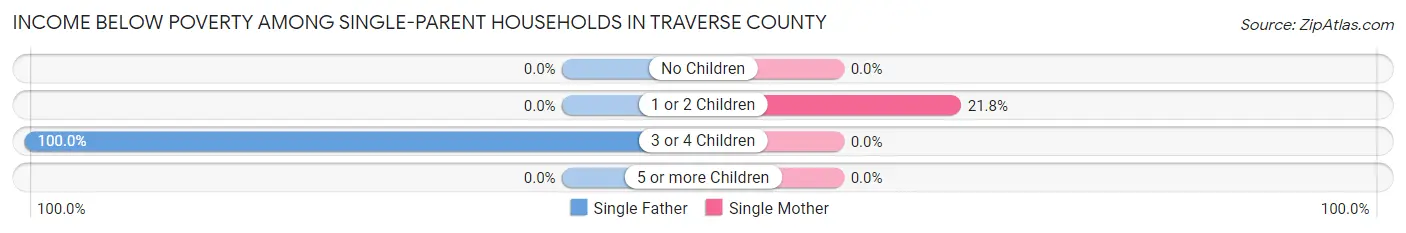
| Children | Single Father | Single Mother |
| No Children | 0 (0.0%) | 0 (0.0%) |
| 1 or 2 Children | 0 (0.0%) | 12 (21.8%) |
| 3 or 4 Children | 11 (100.0%) | 0 (0.0%) |
| 5 or more Children | 0 (0.0%) | 0 (0.0%) |
| Total | 11 (21.6%) | 12 (12.5%) |
Income Below Poverty Among Married-Couple vs Single-Parent Households in Traverse County
The poverty data for Traverse County shows that 19 of the married-couple family households (2.6%) and 23 of the single-parent households (15.7%) are living below the poverty level. Within the married-couple family households, those with 3 or 4 children have the highest poverty rate, with 3 households (4.4%) falling below the poverty line. Among the single-parent households, those with 3 or 4 children have the highest poverty rate, with 11 household (52.4%) living below poverty.
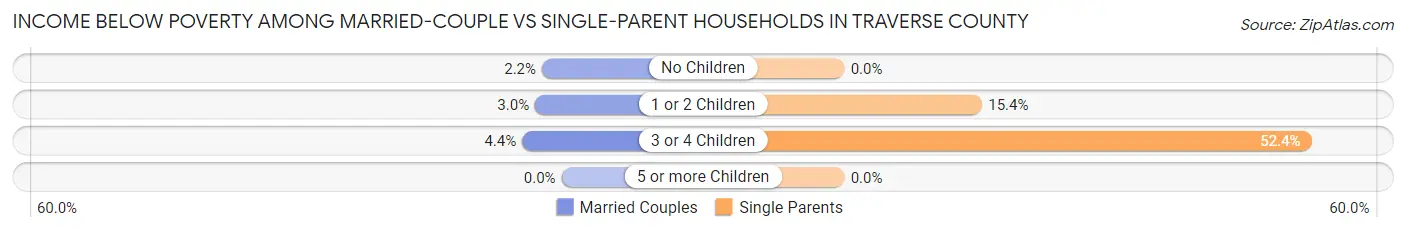
| Children | Married-Couple Families | Single-Parent Households |
| No Children | 10 (2.2%) | 0 (0.0%) |
| 1 or 2 Children | 6 (3.0%) | 12 (15.4%) |
| 3 or 4 Children | 3 (4.4%) | 11 (52.4%) |
| 5 or more Children | 0 (0.0%) | 0 (0.0%) |
| Total | 19 (2.6%) | 23 (15.7%) |
Race in Traverse County
The most populous races in Traverse County are White / Caucasian (2,951 | 88.2%), Native / Alaskan (225 | 6.7%), and Hispanic or Latino (147 | 4.4%).
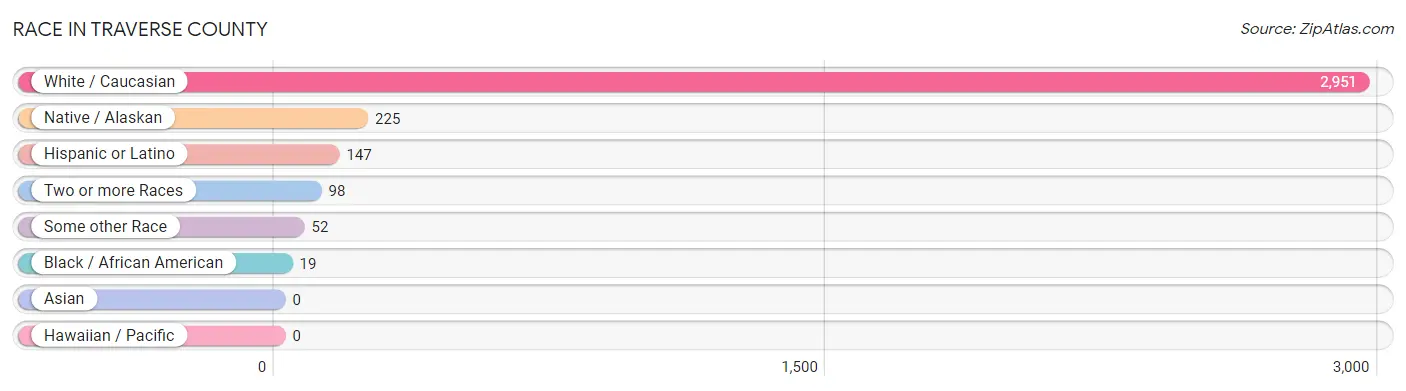
| Race | # Population | % Population |
| Asian | 0 | 0.0% |
| Black / African American | 19 | 0.6% |
| Hawaiian / Pacific | 0 | 0.0% |
| Hispanic or Latino | 147 | 4.4% |
| Native / Alaskan | 225 | 6.7% |
| White / Caucasian | 2,951 | 88.2% |
| Two or more Races | 98 | 2.9% |
| Some other Race | 52 | 1.5% |
| Total | 3,345 | 100.0% |
Ancestry in Traverse County
The most populous ancestries reported in Traverse County are German (1,648 | 49.3%), Norwegian (562 | 16.8%), Swedish (361 | 10.8%), Irish (239 | 7.1%), and English (181 | 5.4%), together accounting for 89.4% of all Traverse County residents.
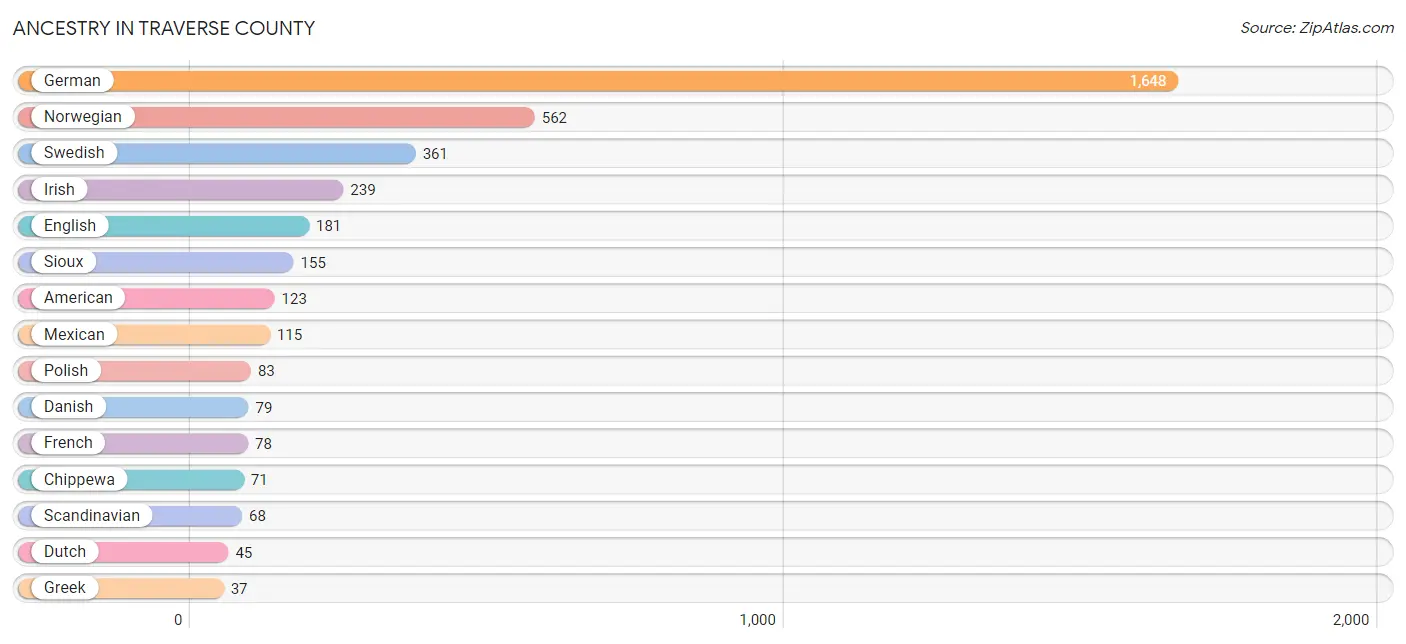
| Ancestry | # Population | % Population |
| African | 8 | 0.2% |
| American | 123 | 3.7% |
| Austrian | 10 | 0.3% |
| Basque | 2 | 0.1% |
| Belgian | 3 | 0.1% |
| Bhutanese | 7 | 0.2% |
| British | 4 | 0.1% |
| Cherokee | 10 | 0.3% |
| Chippewa | 71 | 2.1% |
| Comanche | 6 | 0.2% |
| Cuban | 5 | 0.2% |
| Czech | 22 | 0.7% |
| Czechoslovakian | 8 | 0.2% |
| Danish | 79 | 2.4% |
| Dutch | 45 | 1.3% |
| English | 181 | 5.4% |
| European | 1 | 0.0% |
| Finnish | 27 | 0.8% |
| French | 78 | 2.3% |
| French Canadian | 20 | 0.6% |
| German | 1,648 | 49.3% |
| Greek | 37 | 1.1% |
| Hungarian | 8 | 0.2% |
| Indian (Asian) | 2 | 0.1% |
| Irish | 239 | 7.1% |
| Italian | 29 | 0.9% |
| Jamaican | 14 | 0.4% |
| Korean | 1 | 0.0% |
| Mexican | 115 | 3.4% |
| Northern European | 7 | 0.2% |
| Norwegian | 562 | 16.8% |
| Polish | 83 | 2.5% |
| Portuguese | 5 | 0.2% |
| Puerto Rican | 27 | 0.8% |
| Russian | 17 | 0.5% |
| Scandinavian | 68 | 2.0% |
| Scotch-Irish | 27 | 0.8% |
| Scottish | 15 | 0.4% |
| Sioux | 155 | 4.6% |
| Sri Lankan | 2 | 0.1% |
| Subsaharan African | 10 | 0.3% |
| Sudanese | 2 | 0.1% |
| Swedish | 361 | 10.8% |
| Swiss | 3 | 0.1% |
| Welsh | 2 | 0.1% | View All 45 Rows |
Immigrants in Traverse County
The most numerous immigrant groups reported in Traverse County came from Latin America (39 | 1.2%), Central America (22 | 0.7%), Mexico (22 | 0.7%), Caribbean (13 | 0.4%), and Canada (11 | 0.3%), together accounting for 3.2% of all Traverse County residents.
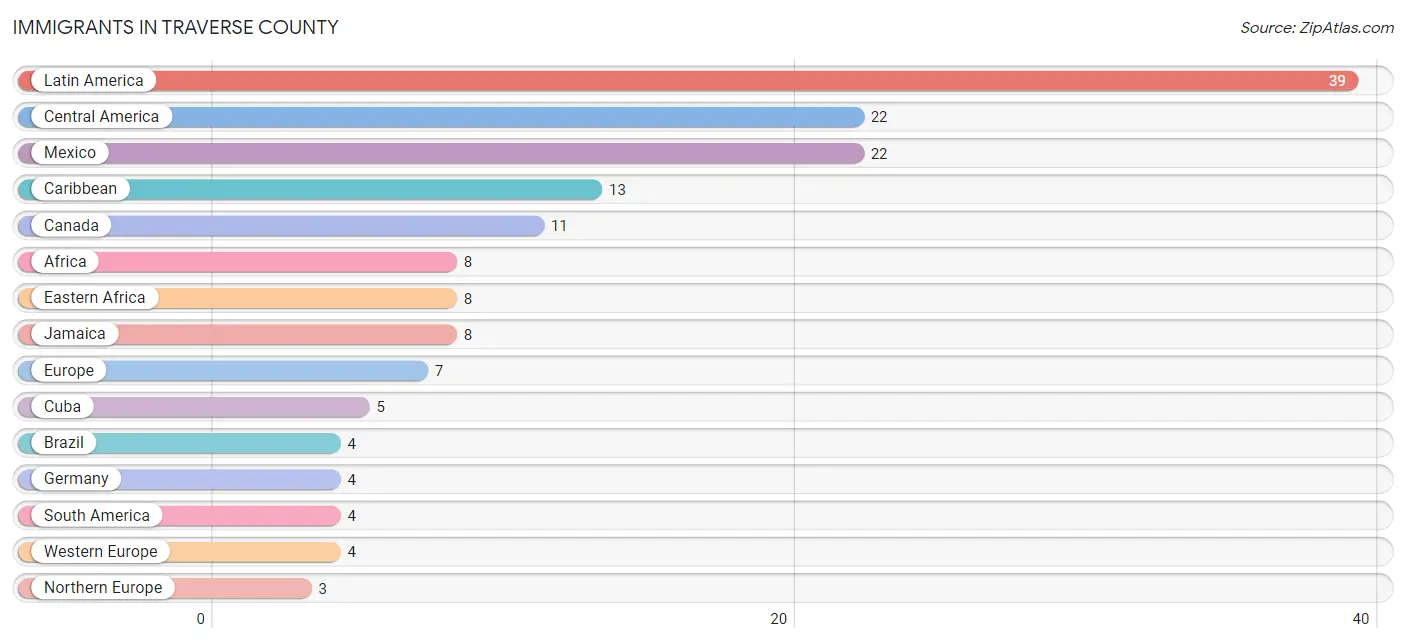
| Immigration Origin | # Population | % Population |
| Africa | 8 | 0.2% |
| Asia | 1 | 0.0% |
| Brazil | 4 | 0.1% |
| Canada | 11 | 0.3% |
| Caribbean | 13 | 0.4% |
| Central America | 22 | 0.7% |
| Cuba | 5 | 0.2% |
| Eastern Africa | 8 | 0.2% |
| Europe | 7 | 0.2% |
| Germany | 4 | 0.1% |
| India | 1 | 0.0% |
| Jamaica | 8 | 0.2% |
| Latin America | 39 | 1.2% |
| Mexico | 22 | 0.7% |
| Northern Europe | 3 | 0.1% |
| Norway | 3 | 0.1% |
| South America | 4 | 0.1% |
| South Central Asia | 1 | 0.0% |
| Western Europe | 4 | 0.1% | View All 19 Rows |
Sex and Age in Traverse County
Sex and Age in Traverse County
The most populous age groups in Traverse County are 65 to 69 Years (148 | 8.9%) for men and 85 Years and over (140 | 8.3%) for women.
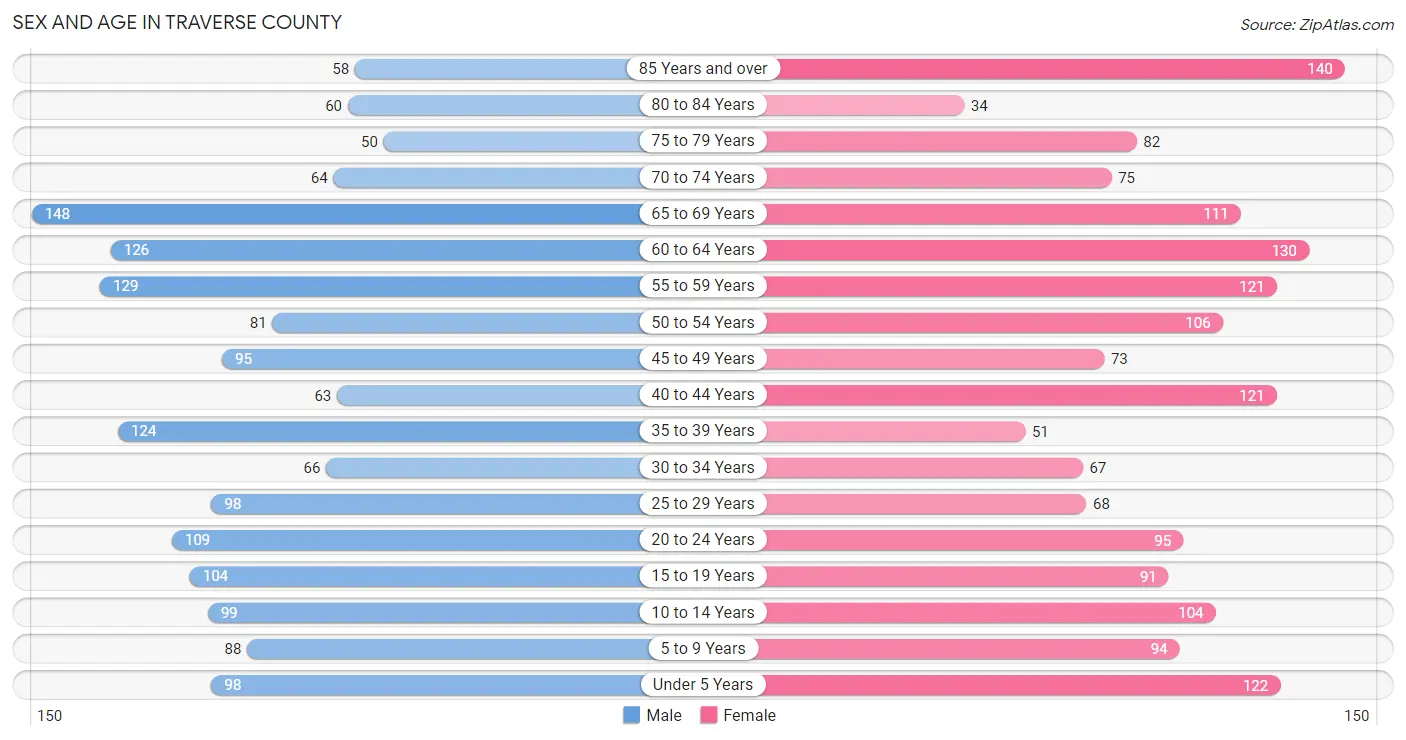
| Age Bracket | Male | Female |
| Under 5 Years | 98 (5.9%) | 122 (7.2%) |
| 5 to 9 Years | 88 (5.3%) | 94 (5.6%) |
| 10 to 14 Years | 99 (6.0%) | 104 (6.2%) |
| 15 to 19 Years | 104 (6.3%) | 91 (5.4%) |
| 20 to 24 Years | 109 (6.6%) | 95 (5.6%) |
| 25 to 29 Years | 98 (5.9%) | 68 (4.0%) |
| 30 to 34 Years | 66 (4.0%) | 67 (4.0%) |
| 35 to 39 Years | 124 (7.5%) | 51 (3.0%) |
| 40 to 44 Years | 63 (3.8%) | 121 (7.2%) |
| 45 to 49 Years | 95 (5.7%) | 73 (4.3%) |
| 50 to 54 Years | 81 (4.9%) | 106 (6.3%) |
| 55 to 59 Years | 129 (7.8%) | 121 (7.2%) |
| 60 to 64 Years | 126 (7.6%) | 130 (7.7%) |
| 65 to 69 Years | 148 (8.9%) | 111 (6.6%) |
| 70 to 74 Years | 64 (3.9%) | 75 (4.4%) |
| 75 to 79 Years | 50 (3.0%) | 82 (4.9%) |
| 80 to 84 Years | 60 (3.6%) | 34 (2.0%) |
| 85 Years and over | 58 (3.5%) | 140 (8.3%) |
| Total | 1,660 (100.0%) | 1,685 (100.0%) |
Families and Households in Traverse County
Median Family Size in Traverse County
The median family size in Traverse County is 2.98 persons per family, with single female/mother families (96 | 11.0%) accounting for the largest median family size of 3.63 persons per family. On the other hand, single male/father families (51 | 5.8%) represent the smallest median family size with 2.84 persons per family.
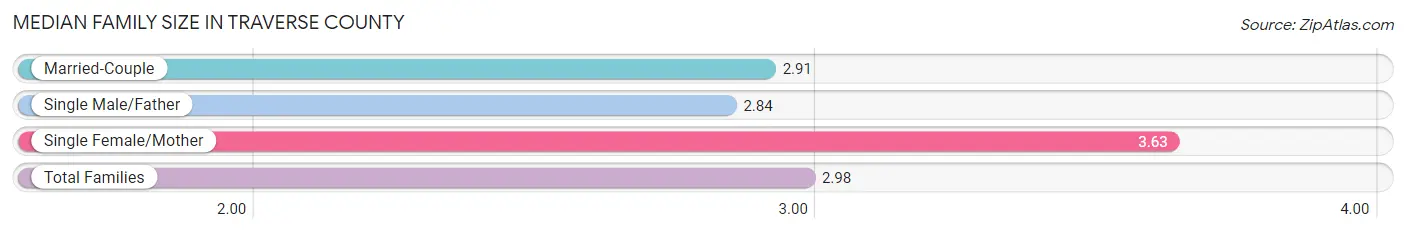
| Family Type | # Families | Family Size |
| Married-Couple | 728 (83.2%) | 2.91 |
| Single Male/Father | 51 (5.8%) | 2.84 |
| Single Female/Mother | 96 (11.0%) | 3.63 |
| Total Families | 875 (100.0%) | 2.98 |
Median Household Size in Traverse County
The median household size in Traverse County is 2.26 persons per household, with single female/mother households (96 | 6.7%) accounting for the largest median household size of 3.76 persons per household. non-family households (558 | 38.9%) represent the smallest median household size with 1.06 persons per household.

| Household Type | # Households | Household Size |
| Married-Couple | 728 (50.8%) | 2.91 |
| Single Male/Father | 51 (3.6%) | 3.25 |
| Single Female/Mother | 96 (6.7%) | 3.76 |
| Non-family | 558 (38.9%) | 1.06 |
| Total Households | 1,433 (100.0%) | 2.26 |
Household Size by Marriage Status in Traverse County
Out of a total of 1,433 households in Traverse County, 875 (61.1%) are family households, while 558 (38.9%) are nonfamily households. The most numerous type of family households are 2-person households, comprising 470, and the most common type of nonfamily households are 1-person households, comprising 519.
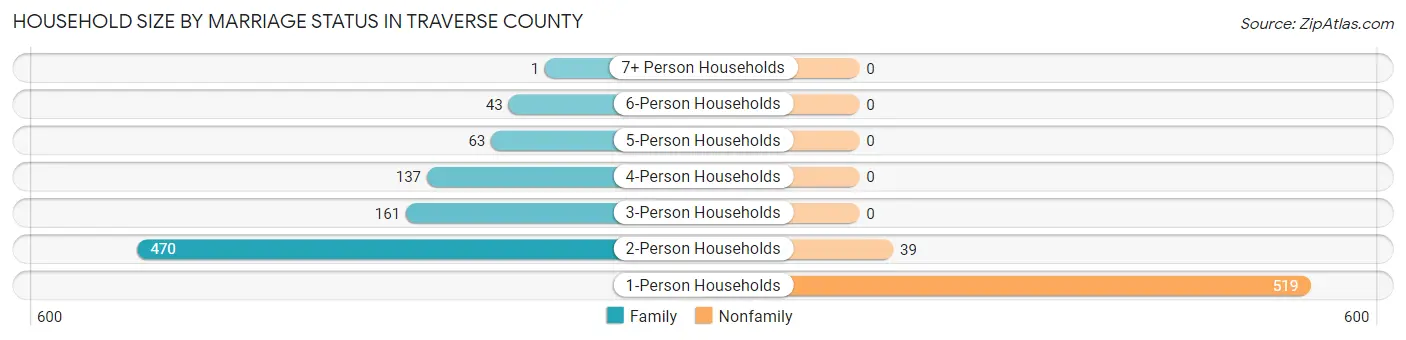
| Household Size | Family Households | Nonfamily Households |
| 1-Person Households | - | 519 (36.2%) |
| 2-Person Households | 470 (32.8%) | 39 (2.7%) |
| 3-Person Households | 161 (11.2%) | 0 (0.0%) |
| 4-Person Households | 137 (9.6%) | 0 (0.0%) |
| 5-Person Households | 63 (4.4%) | 0 (0.0%) |
| 6-Person Households | 43 (3.0%) | 0 (0.0%) |
| 7+ Person Households | 1 (0.1%) | 0 (0.0%) |
| Total | 875 (61.1%) | 558 (38.9%) |
Female Fertility in Traverse County
Fertility by Age in Traverse County
Average fertility rate in Traverse County is 86.0 births per 1,000 women. Women in the age bracket of 20 to 34 years have the highest fertility rate with 204.0 births per 1,000 women. Women in the age bracket of 20 to 34 years acount for 90.4% of all women with births.
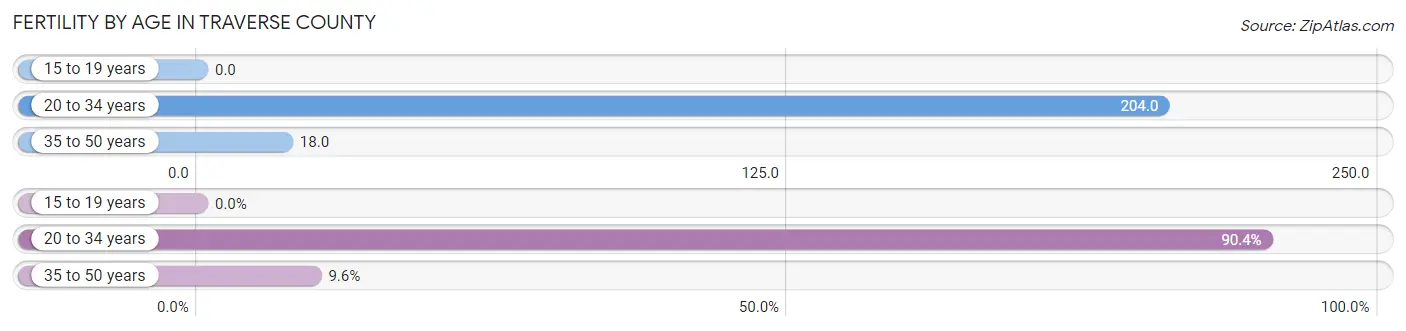
| Age Bracket | Women with Births | Births / 1,000 Women |
| 15 to 19 years | 0 (0.0%) | 0.0 |
| 20 to 34 years | 47 (90.4%) | 204.0 |
| 35 to 50 years | 5 (9.6%) | 18.0 |
| Total | 52 (100.0%) | 86.0 |
Fertility by Age by Marriage Status in Traverse County
73.1% of women with births (52) in Traverse County are married. The highest percentage of unmarried women with births falls into 20 to 34 years age bracket with 29.8% of them unmarried at the time of birth, while the lowest percentage of unmarried women with births belong to 35 to 50 years age bracket with 0.0% of them unmarried.
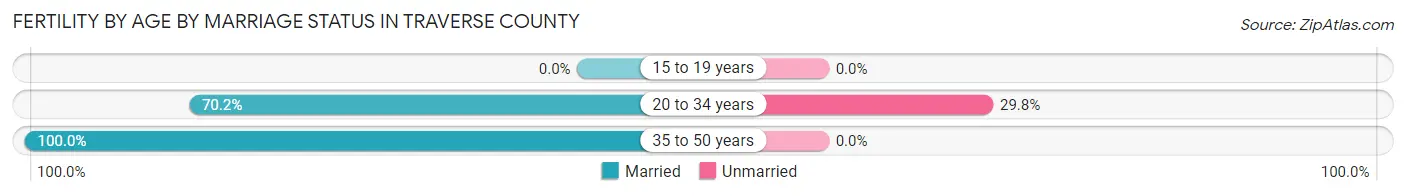
| Age Bracket | Married | Unmarried |
| 15 to 19 years | 0 (0.0%) | 0 (0.0%) |
| 20 to 34 years | 33 (70.2%) | 14 (29.8%) |
| 35 to 50 years | 5 (100.0%) | 0 (0.0%) |
| Total | 38 (73.1%) | 14 (26.9%) |
Fertility by Education in Traverse County
Average fertility rate in Traverse County is 86.0 births per 1,000 women. Women with the education attainment of graduate degree have the highest fertility rate of 277.0 births per 1,000 women, while women with the education attainment of less than high school have the lowest fertility at 25.0 births per 1,000 women. Women with the education attainment of high school diploma represent 36.5% of all women with births.
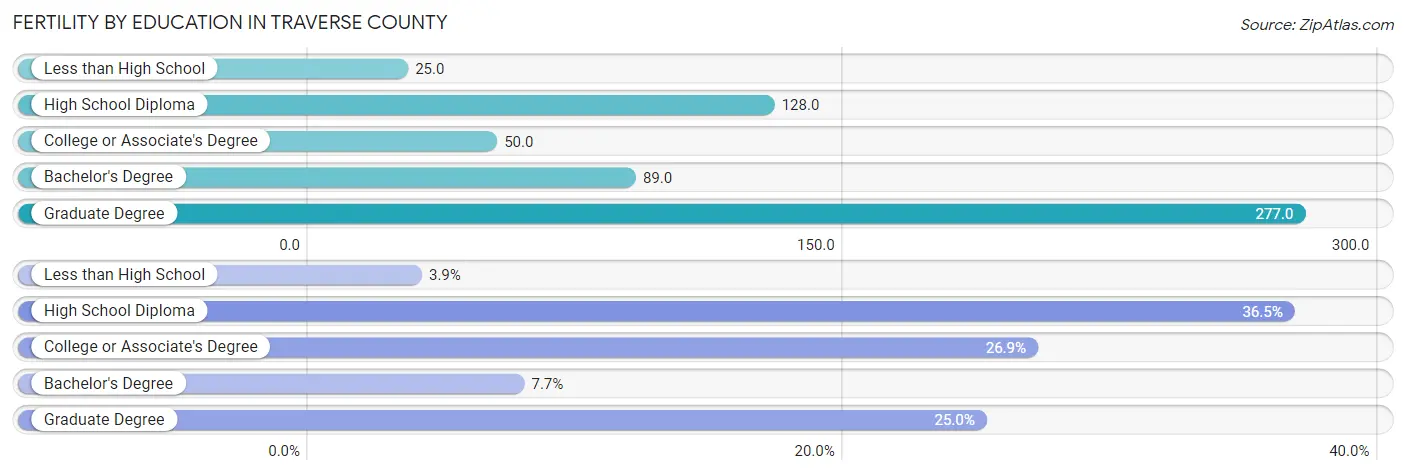
| Educational Attainment | Women with Births | Births / 1,000 Women |
| Less than High School | 2 (3.8%) | 25.0 |
| High School Diploma | 19 (36.5%) | 128.0 |
| College or Associate's Degree | 14 (26.9%) | 50.0 |
| Bachelor's Degree | 4 (7.7%) | 89.0 |
| Graduate Degree | 13 (25.0%) | 277.0 |
| Total | 52 (100.0%) | 86.0 |
Fertility by Education by Marriage Status in Traverse County
26.9% of women with births in Traverse County are unmarried. Women with the educational attainment of less than high school are most likely to be married with 100.0% of them married at childbirth, while women with the educational attainment of high school diploma are least likely to be married with 73.7% of them unmarried at childbirth.
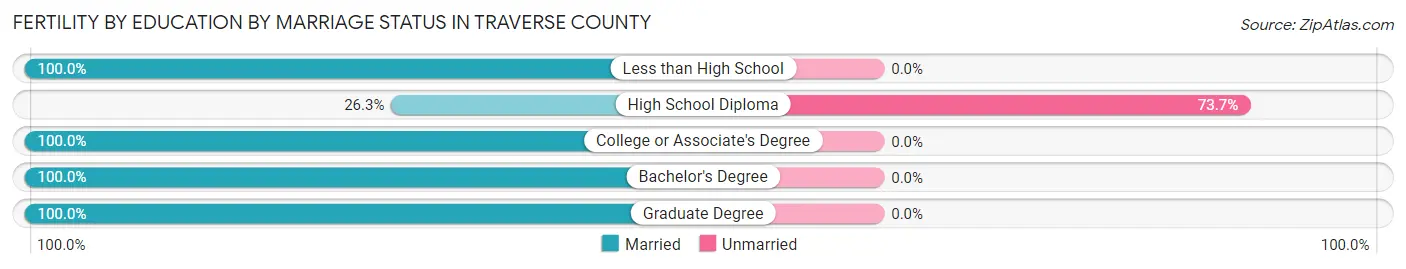
| Educational Attainment | Married | Unmarried |
| Less than High School | 2 (100.0%) | 0 (0.0%) |
| High School Diploma | 5 (26.3%) | 14 (73.7%) |
| College or Associate's Degree | 14 (100.0%) | 0 (0.0%) |
| Bachelor's Degree | 4 (100.0%) | 0 (0.0%) |
| Graduate Degree | 13 (100.0%) | 0 (0.0%) |
| Total | 38 (73.1%) | 14 (26.9%) |
Employment Characteristics in Traverse County
Employment by Class of Employer in Traverse County
Among the 1,569 employed individuals in Traverse County, private company employees (780 | 49.7%), self-employed (not incorporated) (270 | 17.2%), and local government employees (195 | 12.4%) make up the most common classes of employment.
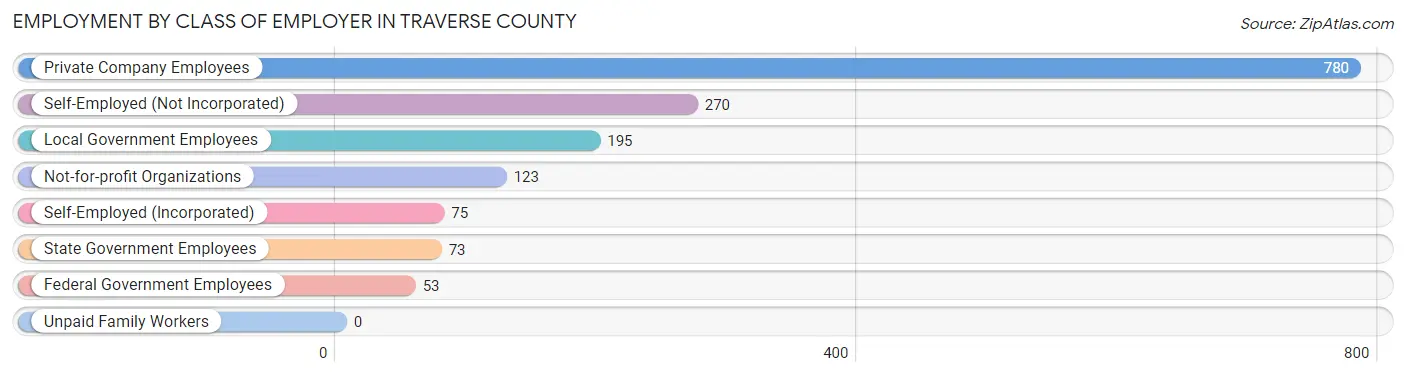
| Employer Class | # Employees | % Employees |
| Private Company Employees | 780 | 49.7% |
| Self-Employed (Incorporated) | 75 | 4.8% |
| Self-Employed (Not Incorporated) | 270 | 17.2% |
| Not-for-profit Organizations | 123 | 7.8% |
| Local Government Employees | 195 | 12.4% |
| State Government Employees | 73 | 4.6% |
| Federal Government Employees | 53 | 3.4% |
| Unpaid Family Workers | 0 | 0.0% |
| Total | 1,569 | 100.0% |
Employment Status by Age in Traverse County
According to the labor force statistics for Traverse County, out of the total population over 16 years of age (2,685), 62.3% or 1,673 individuals are in the labor force, with 4.0% or 67 of them unemployed. The age group with the highest labor force participation rate is 20 to 24 years, with 94.1% or 192 individuals in the labor force. Within the labor force, the 16 to 19 years age range has the highest percentage of unemployed individuals, with 20.3% or 15 of them being unemployed.
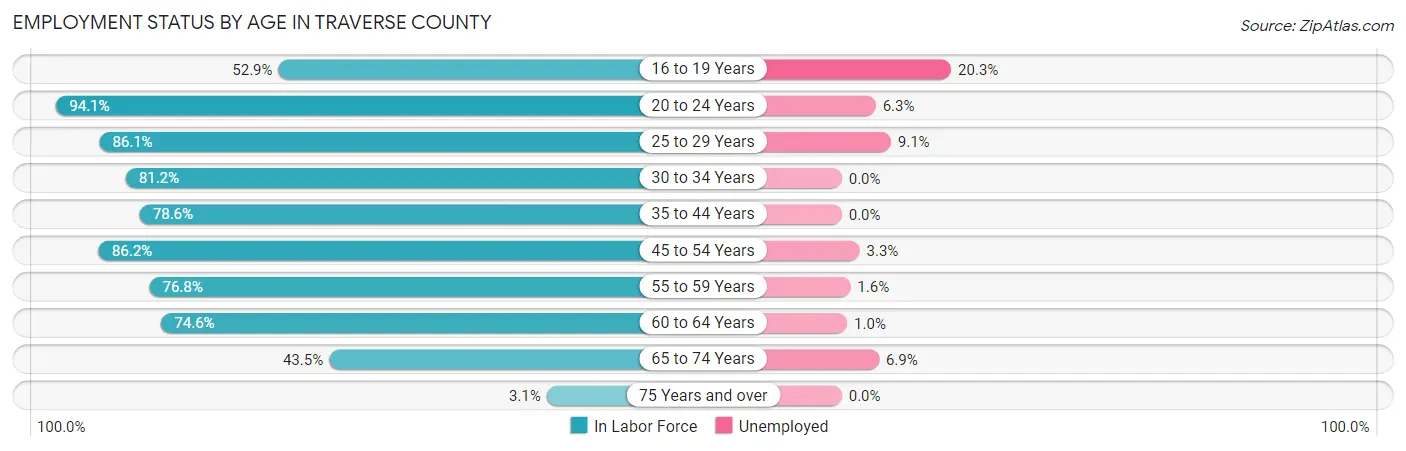
| Age Bracket | In Labor Force | Unemployed |
| 16 to 19 Years | 74 (52.9%) | 15 (20.3%) |
| 20 to 24 Years | 192 (94.1%) | 12 (6.3%) |
| 25 to 29 Years | 143 (86.1%) | 13 (9.1%) |
| 30 to 34 Years | 108 (81.2%) | 0 (0.0%) |
| 35 to 44 Years | 282 (78.6%) | 0 (0.0%) |
| 45 to 54 Years | 306 (86.2%) | 10 (3.3%) |
| 55 to 59 Years | 192 (76.8%) | 3 (1.6%) |
| 60 to 64 Years | 191 (74.6%) | 2 (1.0%) |
| 65 to 74 Years | 173 (43.5%) | 12 (6.9%) |
| 75 Years and over | 13 (3.1%) | 0 (0.0%) |
| Total | 1,673 (62.3%) | 67 (4.0%) |
Employment Status by Educational Attainment in Traverse County
According to labor force statistics for Traverse County, 80.4% of individuals (1,221) out of the total population between 25 and 64 years of age (1,519) are in the labor force, with 2.3% or 28 of them being unemployed. The group with the highest labor force participation rate are those with the educational attainment of bachelor's degree or higher, with 91.1% or 245 individuals in the labor force. Within the labor force, individuals with high school diploma education have the highest percentage of unemployment, with 5.3% or 20 of them being unemployed.
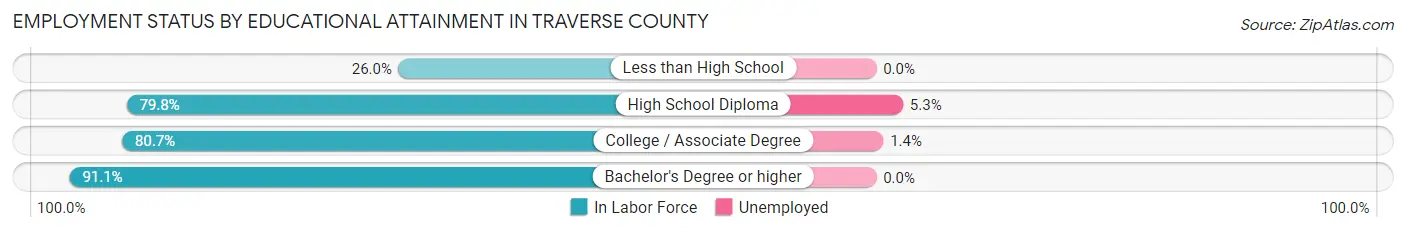
| Educational Attainment | In Labor Force | Unemployed |
| Less than High School | 13 (26.0%) | 0 (0.0%) |
| High School Diploma | 375 (79.8%) | 25 (5.3%) |
| College / Associate Degree | 589 (80.7%) | 10 (1.4%) |
| Bachelor's Degree or higher | 245 (91.1%) | 0 (0.0%) |
| Total | 1,221 (80.4%) | 35 (2.3%) |
Employment Occupations by Sex in Traverse County
Management, Business, Science and Arts Occupations
The most common Management, Business, Science and Arts occupations in Traverse County are Management (342 | 21.3%), Community & Social Service (132 | 8.2%), Health Diagnosing & Treating (95 | 5.9%), Education Instruction & Library (76 | 4.7%), and Health Technologists (67 | 4.2%).

Management, Business, Science and Arts Occupations by Sex
Within the Management, Business, Science and Arts occupations in Traverse County, the most male-oriented occupations are Computers & Mathematics (100.0%), Architecture & Engineering (94.7%), and Computers, Engineering & Science (90.3%), while the most female-oriented occupations are Health Diagnosing & Treating (95.8%), Health Technologists (94.0%), and Education, Arts & Media (88.9%).
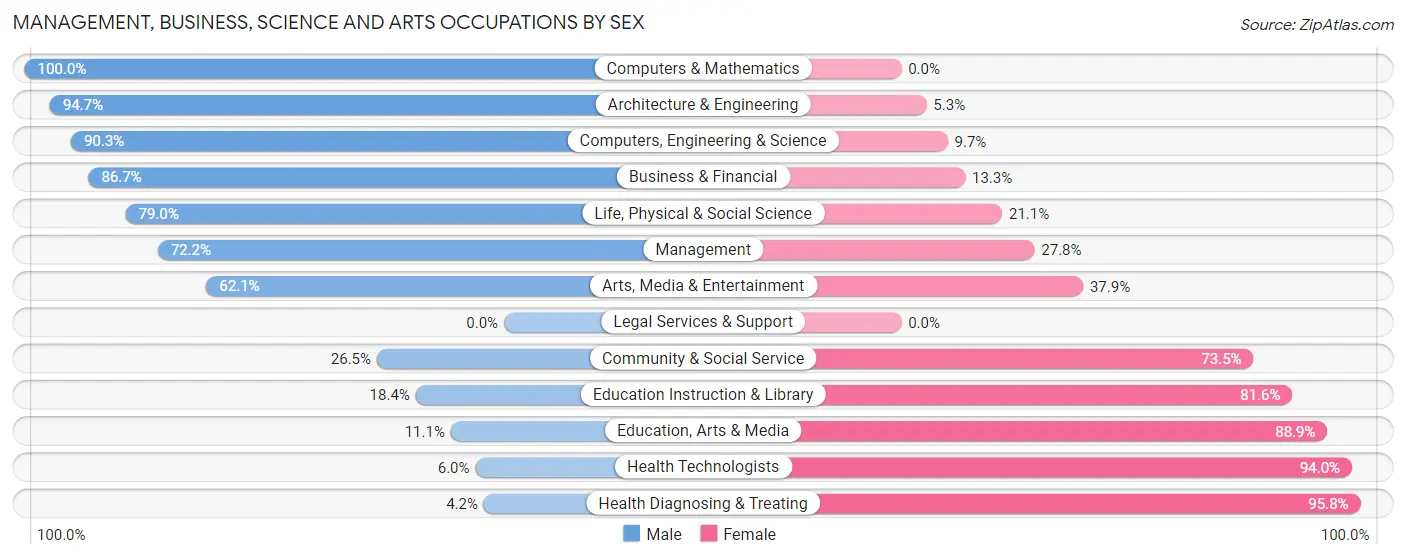
| Occupation | Male | Female |
| Management | 247 (72.2%) | 95 (27.8%) |
| Business & Financial | 26 (86.7%) | 4 (13.3%) |
| Computers, Engineering & Science | 56 (90.3%) | 6 (9.7%) |
| Computers & Mathematics | 5 (100.0%) | 0 (0.0%) |
| Architecture & Engineering | 36 (94.7%) | 2 (5.3%) |
| Life, Physical & Social Science | 15 (78.9%) | 4 (21.0%) |
| Community & Social Service | 35 (26.5%) | 97 (73.5%) |
| Education, Arts & Media | 3 (11.1%) | 24 (88.9%) |
| Legal Services & Support | 0 (0.0%) | 0 (0.0%) |
| Education Instruction & Library | 14 (18.4%) | 62 (81.6%) |
| Arts, Media & Entertainment | 18 (62.1%) | 11 (37.9%) |
| Health Diagnosing & Treating | 4 (4.2%) | 91 (95.8%) |
| Health Technologists | 4 (6.0%) | 63 (94.0%) |
| Total (Category) | 368 (55.7%) | 293 (44.3%) |
| Total (Overall) | 886 (55.2%) | 719 (44.8%) |
Services Occupations
The most common Services occupations in Traverse County are Healthcare Support (86 | 5.4%), Cleaning & Maintenance (66 | 4.1%), Food Preparation & Serving (53 | 3.3%), Personal Care & Service (49 | 3.0%), and Security & Protection (9 | 0.6%).
Services Occupations by Sex
Within the Services occupations in Traverse County, the most male-oriented occupations are Firefighting & Prevention (100.0%), Security & Protection (88.9%), and Law Enforcement (87.5%), while the most female-oriented occupations are Personal Care & Service (100.0%), Healthcare Support (95.4%), and Food Preparation & Serving (81.1%).
| Occupation | Male | Female |
| Healthcare Support | 4 (4.6%) | 82 (95.4%) |
| Security & Protection | 8 (88.9%) | 1 (11.1%) |
| Firefighting & Prevention | 1 (100.0%) | 0 (0.0%) |
| Law Enforcement | 7 (87.5%) | 1 (12.5%) |
| Food Preparation & Serving | 10 (18.9%) | 43 (81.1%) |
| Cleaning & Maintenance | 51 (77.3%) | 15 (22.7%) |
| Personal Care & Service | 0 (0.0%) | 49 (100.0%) |
| Total (Category) | 73 (27.8%) | 190 (72.2%) |
| Total (Overall) | 886 (55.2%) | 719 (44.8%) |
Sales and Office Occupations
The most common Sales and Office occupations in Traverse County are Office & Administration (159 | 9.9%), and Sales & Related (134 | 8.4%).
Sales and Office Occupations by Sex
| Occupation | Male | Female |
| Sales & Related | 69 (51.5%) | 65 (48.5%) |
| Office & Administration | 23 (14.5%) | 136 (85.5%) |
| Total (Category) | 92 (31.4%) | 201 (68.6%) |
| Total (Overall) | 886 (55.2%) | 719 (44.8%) |
Natural Resources, Construction and Maintenance Occupations
The most common Natural Resources, Construction and Maintenance occupations in Traverse County are Installation, Maintenance & Repair (74 | 4.6%), Farming, Fishing & Forestry (62 | 3.9%), and Construction & Extraction (51 | 3.2%).

Natural Resources, Construction and Maintenance Occupations by Sex
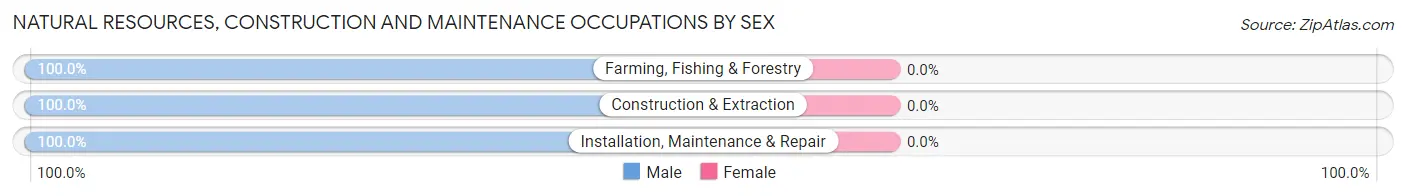
| Occupation | Male | Female |
| Farming, Fishing & Forestry | 62 (100.0%) | 0 (0.0%) |
| Construction & Extraction | 51 (100.0%) | 0 (0.0%) |
| Installation, Maintenance & Repair | 74 (100.0%) | 0 (0.0%) |
| Total (Category) | 187 (100.0%) | 0 (0.0%) |
| Total (Overall) | 886 (55.2%) | 719 (44.8%) |
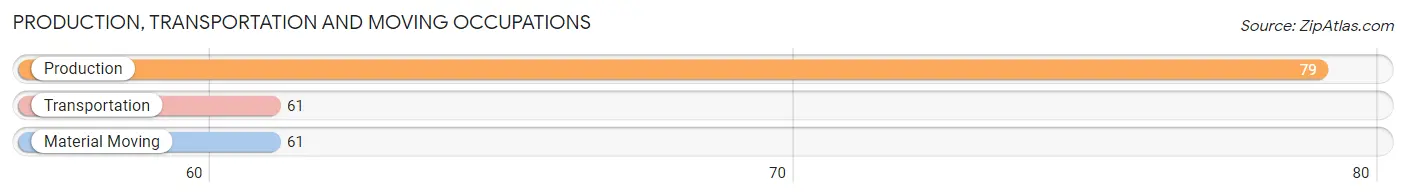
Production, Transportation and Moving Occupations
The most common Production, Transportation and Moving occupations in Traverse County are Production (79 | 4.9%), Transportation (61 | 3.8%), and Material Moving (61 | 3.8%).
Production, Transportation and Moving Occupations by Sex
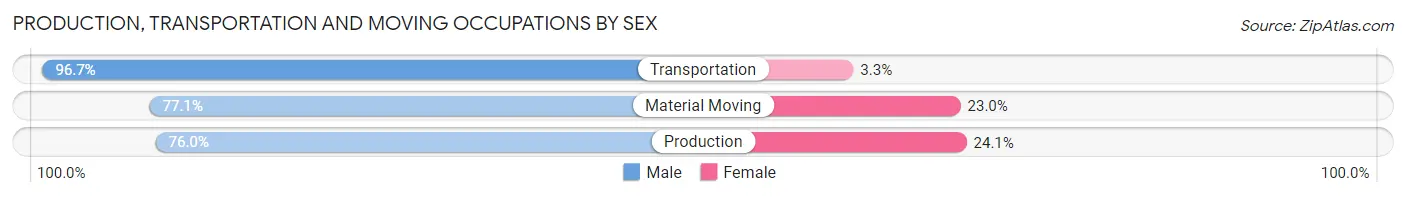
| Occupation | Male | Female |
| Production | 60 (75.9%) | 19 (24.0%) |
| Transportation | 59 (96.7%) | 2 (3.3%) |
| Material Moving | 47 (77.0%) | 14 (23.0%) |
| Total (Category) | 166 (82.6%) | 35 (17.4%) |
| Total (Overall) | 886 (55.2%) | 719 (44.8%) |
Employment Industries by Sex in Traverse County
Employment Industries in Traverse County
The major employment industries in Traverse County include Agriculture, Fishing & Hunting (316 | 19.7%), Health Care & Social Assistance (253 | 15.8%), Manufacturing (153 | 9.5%), Retail Trade (146 | 9.1%), and Educational Services (136 | 8.5%).
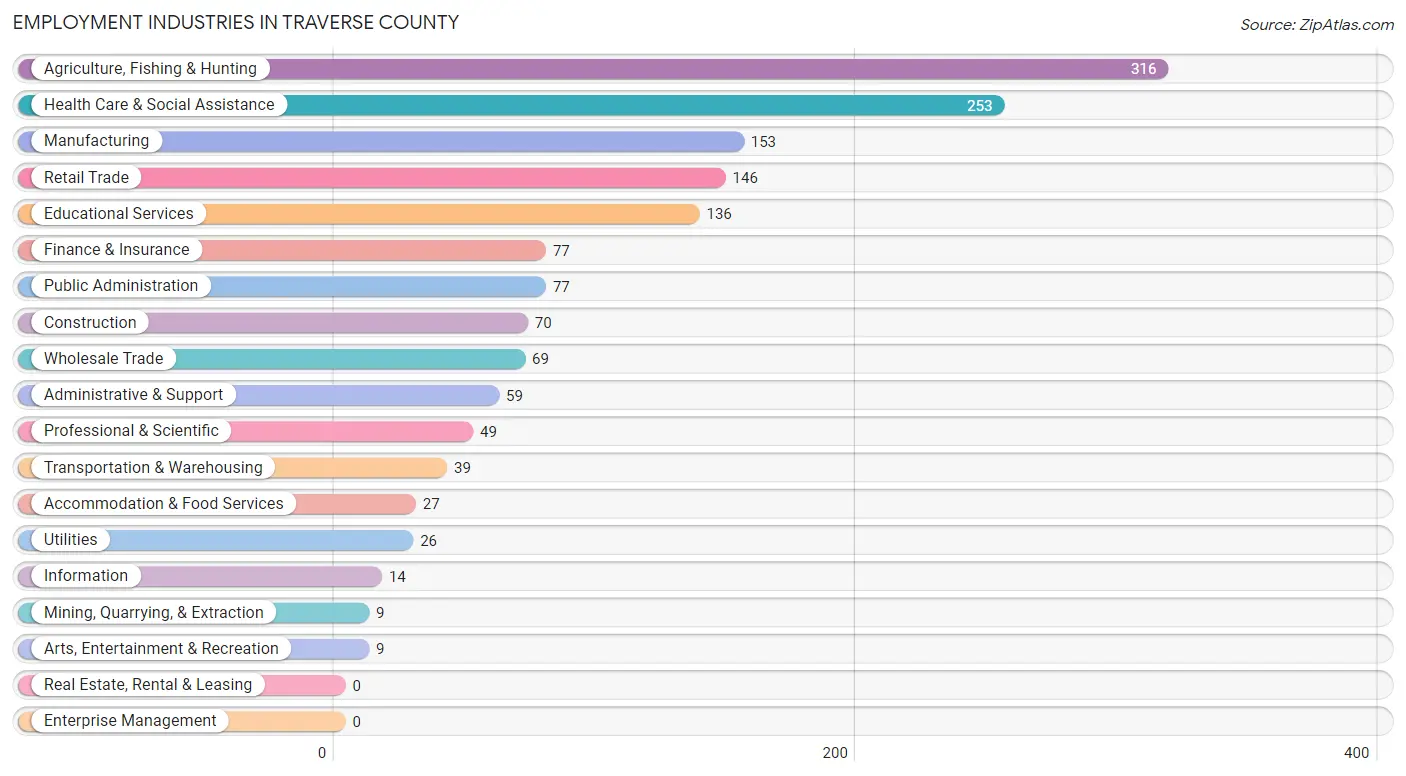
Employment Industries by Sex in Traverse County
The Traverse County industries that see more men than women are Mining, Quarrying, & Extraction (100.0%), Construction (94.3%), and Professional & Scientific (93.9%), whereas the industries that tend to have a higher number of women are Arts, Entertainment & Recreation (100.0%), Accommodation & Food Services (88.9%), and Health Care & Social Assistance (88.5%).

| Industry | Male | Female |
| Agriculture, Fishing & Hunting | 275 (87.0%) | 41 (13.0%) |
| Mining, Quarrying, & Extraction | 9 (100.0%) | 0 (0.0%) |
| Construction | 66 (94.3%) | 4 (5.7%) |
| Manufacturing | 105 (68.6%) | 48 (31.4%) |
| Wholesale Trade | 64 (92.7%) | 5 (7.2%) |
| Retail Trade | 67 (45.9%) | 79 (54.1%) |
| Transportation & Warehousing | 32 (82.1%) | 7 (17.9%) |
| Utilities | 21 (80.8%) | 5 (19.2%) |
| Information | 10 (71.4%) | 4 (28.6%) |
| Finance & Insurance | 12 (15.6%) | 65 (84.4%) |
| Real Estate, Rental & Leasing | 0 (0.0%) | 0 (0.0%) |
| Professional & Scientific | 46 (93.9%) | 3 (6.1%) |
| Enterprise Management | 0 (0.0%) | 0 (0.0%) |
| Administrative & Support | 51 (86.4%) | 8 (13.6%) |
| Educational Services | 34 (25.0%) | 102 (75.0%) |
| Health Care & Social Assistance | 29 (11.5%) | 224 (88.5%) |
| Arts, Entertainment & Recreation | 0 (0.0%) | 9 (100.0%) |
| Accommodation & Food Services | 3 (11.1%) | 24 (88.9%) |
| Public Administration | 32 (41.6%) | 45 (58.4%) |
| Total | 886 (55.2%) | 719 (44.8%) |
Education in Traverse County
School Enrollment in Traverse County
The most common levels of schooling among the 641 students in Traverse County are middle school (169 | 26.4%), high school (163 | 25.4%), and elementary school (130 | 20.3%).
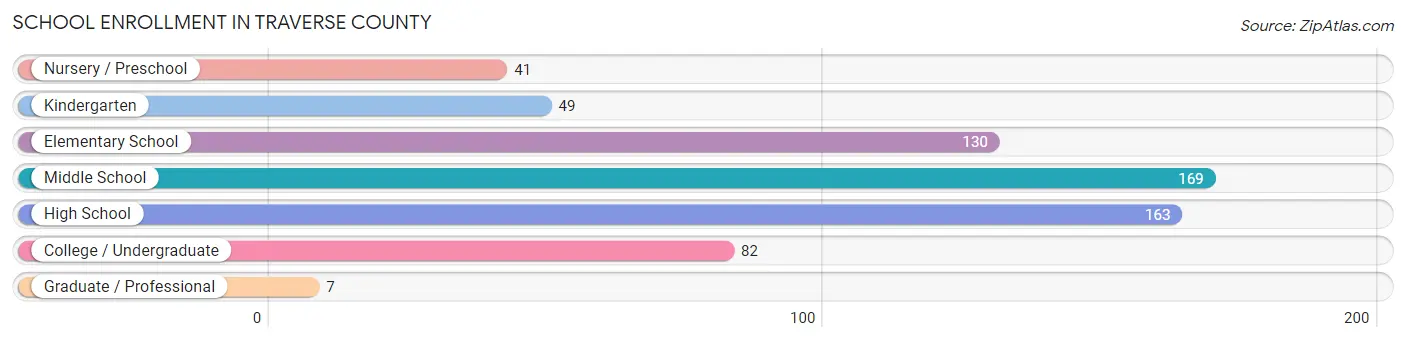
| School Level | # Students | % Students |
| Nursery / Preschool | 41 | 6.4% |
| Kindergarten | 49 | 7.6% |
| Elementary School | 130 | 20.3% |
| Middle School | 169 | 26.4% |
| High School | 163 | 25.4% |
| College / Undergraduate | 82 | 12.8% |
| Graduate / Professional | 7 | 1.1% |
| Total | 641 | 100.0% |
School Enrollment by Age by Funding Source in Traverse County
Out of a total of 641 students who are enrolled in schools in Traverse County, 17 (2.7%) attend a private institution, while the remaining 624 (97.3%) are enrolled in public schools. The age group of 3 to 4 year olds has the highest likelihood of being enrolled in private schools, with 9 (36.0% in the age bracket) enrolled. Conversely, the age group of 15 to 17 year olds has the lowest likelihood of being enrolled in a private school, with 110 (100.0% in the age bracket) attending a public institution.
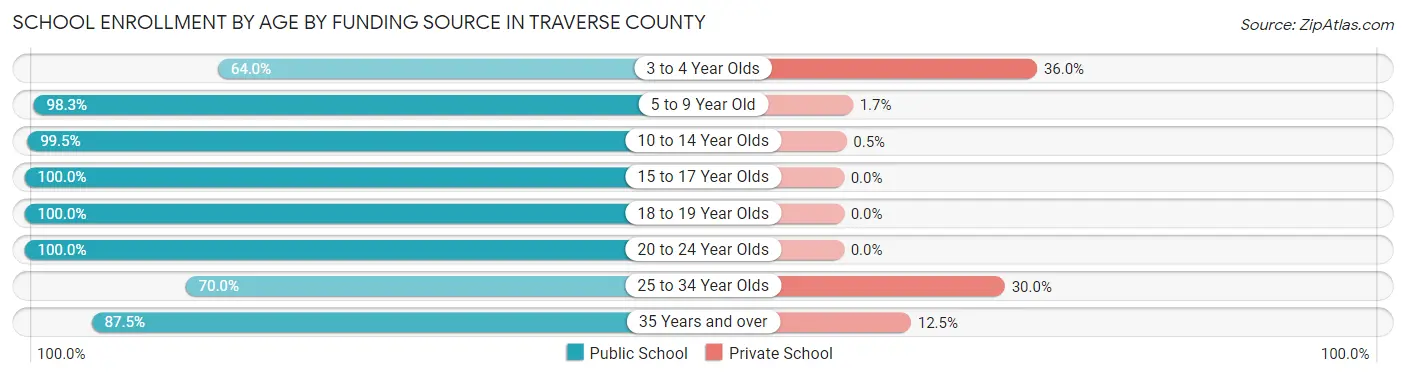
| Age Bracket | Public School | Private School |
| 3 to 4 Year Olds | 16 (64.0%) | 9 (36.0%) |
| 5 to 9 Year Old | 175 (98.3%) | 3 (1.7%) |
| 10 to 14 Year Olds | 199 (99.5%) | 1 (0.5%) |
| 15 to 17 Year Olds | 110 (100.0%) | 0 (0.0%) |
| 18 to 19 Year Olds | 60 (100.0%) | 0 (0.0%) |
| 20 to 24 Year Olds | 50 (100.0%) | 0 (0.0%) |
| 25 to 34 Year Olds | 7 (70.0%) | 3 (30.0%) |
| 35 Years and over | 7 (87.5%) | 1 (12.5%) |
| Total | 624 (97.3%) | 17 (2.7%) |
Educational Attainment by Field of Study in Traverse County
Education (106 | 26.0%), bio, nature & agricultural (64 | 15.7%), science & technology (55 | 13.5%), business (54 | 13.3%), and arts & humanities (26 | 6.4%) are the most common fields of study among 407 individuals in Traverse County who have obtained a bachelor's degree or higher.
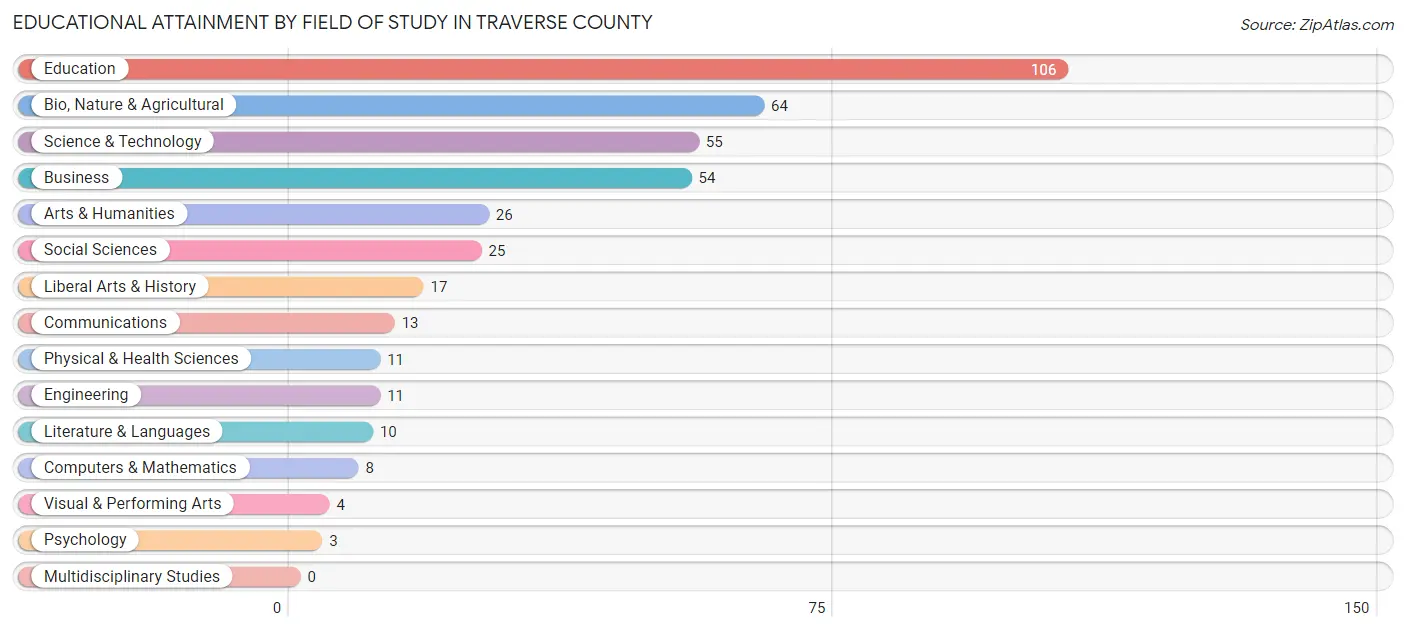
| Field of Study | # Graduates | % Graduates |
| Computers & Mathematics | 8 | 2.0% |
| Bio, Nature & Agricultural | 64 | 15.7% |
| Physical & Health Sciences | 11 | 2.7% |
| Psychology | 3 | 0.7% |
| Social Sciences | 25 | 6.1% |
| Engineering | 11 | 2.7% |
| Multidisciplinary Studies | 0 | 0.0% |
| Science & Technology | 55 | 13.5% |
| Business | 54 | 13.3% |
| Education | 106 | 26.0% |
| Literature & Languages | 10 | 2.5% |
| Liberal Arts & History | 17 | 4.2% |
| Visual & Performing Arts | 4 | 1.0% |
| Communications | 13 | 3.2% |
| Arts & Humanities | 26 | 6.4% |
| Total | 407 | 100.0% |
Transportation & Commute in Traverse County
Vehicle Availability by Sex in Traverse County
The most prevalent vehicle ownership categories in Traverse County are males with 2 vehicles (329, accounting for 38.0%) and females with 2 vehicles (255, making up 47.3%).
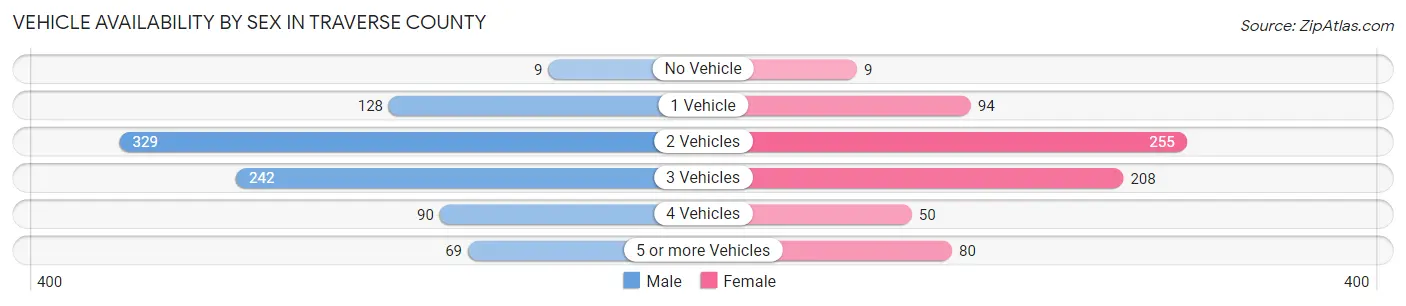
| Vehicles Available | Male | Female |
| No Vehicle | 9 (1.0%) | 9 (1.3%) |
| 1 Vehicle | 128 (14.8%) | 94 (13.5%) |
| 2 Vehicles | 329 (38.0%) | 255 (36.6%) |
| 3 Vehicles | 242 (27.9%) | 208 (29.9%) |
| 4 Vehicles | 90 (10.4%) | 50 (7.2%) |
| 5 or more Vehicles | 69 (8.0%) | 80 (11.5%) |
| Total | 867 (100.0%) | 696 (100.0%) |
Commute Time in Traverse County
The most frequently occuring commute durations in Traverse County are 5 to 9 minutes (247 commuters, 18.8%), less than 5 minutes (218 commuters, 16.6%), and 15 to 19 minutes (216 commuters, 16.5%).
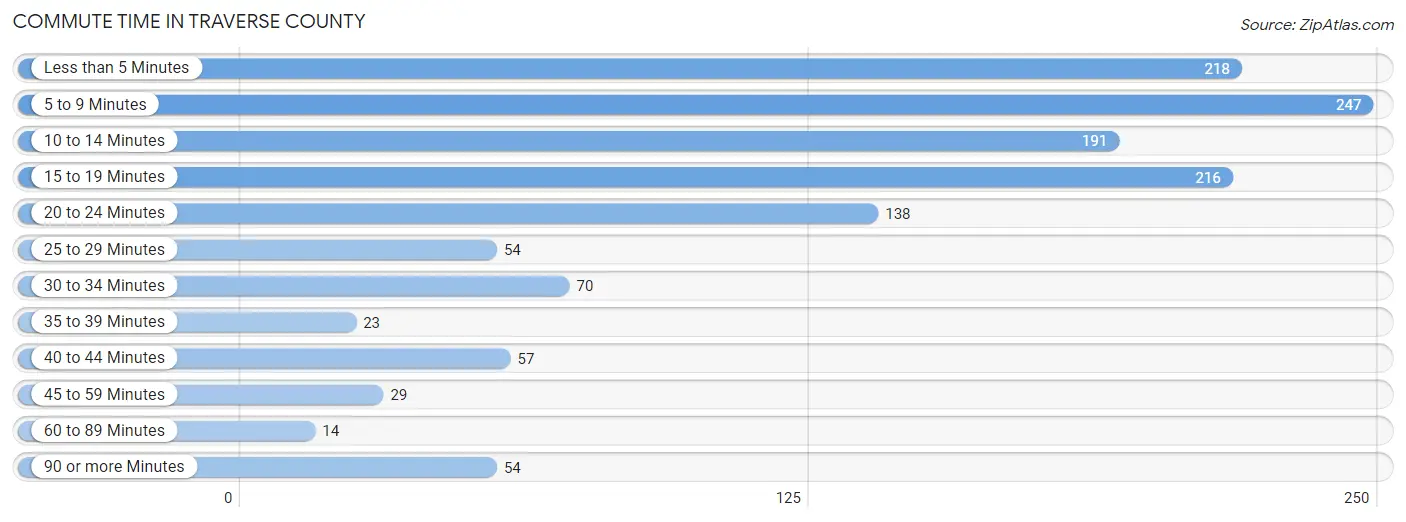
| Commute Time | # Commuters | % Commuters |
| Less than 5 Minutes | 218 | 16.6% |
| 5 to 9 Minutes | 247 | 18.8% |
| 10 to 14 Minutes | 191 | 14.6% |
| 15 to 19 Minutes | 216 | 16.5% |
| 20 to 24 Minutes | 138 | 10.5% |
| 25 to 29 Minutes | 54 | 4.1% |
| 30 to 34 Minutes | 70 | 5.3% |
| 35 to 39 Minutes | 23 | 1.8% |
| 40 to 44 Minutes | 57 | 4.3% |
| 45 to 59 Minutes | 29 | 2.2% |
| 60 to 89 Minutes | 14 | 1.1% |
| 90 or more Minutes | 54 | 4.1% |
Commute Time by Sex in Traverse County
The most common commute times in Traverse County are 15 to 19 minutes (125 commuters, 18.9%) for males and 5 to 9 minutes (134 commuters, 20.6%) for females.
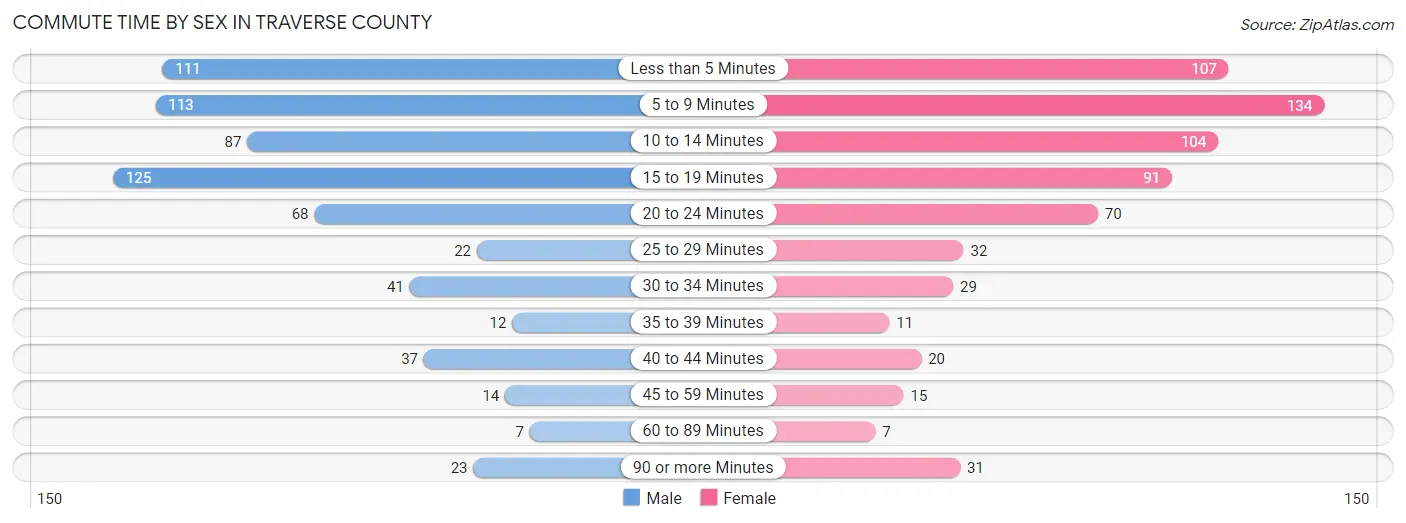
| Commute Time | Male | Female |
| Less than 5 Minutes | 111 (16.8%) | 107 (16.4%) |
| 5 to 9 Minutes | 113 (17.1%) | 134 (20.6%) |
| 10 to 14 Minutes | 87 (13.2%) | 104 (16.0%) |
| 15 to 19 Minutes | 125 (18.9%) | 91 (14.0%) |
| 20 to 24 Minutes | 68 (10.3%) | 70 (10.7%) |
| 25 to 29 Minutes | 22 (3.3%) | 32 (4.9%) |
| 30 to 34 Minutes | 41 (6.2%) | 29 (4.4%) |
| 35 to 39 Minutes | 12 (1.8%) | 11 (1.7%) |
| 40 to 44 Minutes | 37 (5.6%) | 20 (3.1%) |
| 45 to 59 Minutes | 14 (2.1%) | 15 (2.3%) |
| 60 to 89 Minutes | 7 (1.1%) | 7 (1.1%) |
| 90 or more Minutes | 23 (3.5%) | 31 (4.8%) |
Time of Departure to Work by Sex in Traverse County
The most frequent times of departure to work in Traverse County are 7:00 AM to 7:29 AM (137, 20.8%) for males and 7:30 AM to 7:59 AM (198, 30.4%) for females.
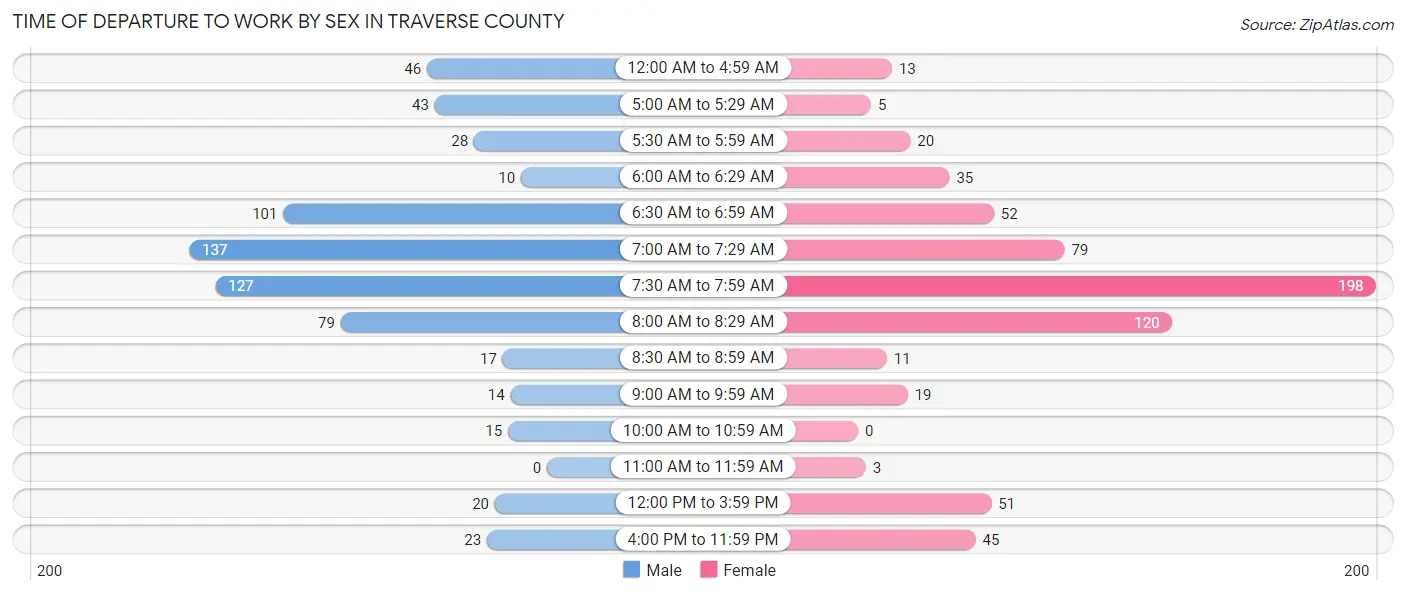
| Time of Departure | Male | Female |
| 12:00 AM to 4:59 AM | 46 (7.0%) | 13 (2.0%) |
| 5:00 AM to 5:29 AM | 43 (6.5%) | 5 (0.8%) |
| 5:30 AM to 5:59 AM | 28 (4.2%) | 20 (3.1%) |
| 6:00 AM to 6:29 AM | 10 (1.5%) | 35 (5.4%) |
| 6:30 AM to 6:59 AM | 101 (15.3%) | 52 (8.0%) |
| 7:00 AM to 7:29 AM | 137 (20.8%) | 79 (12.1%) |
| 7:30 AM to 7:59 AM | 127 (19.2%) | 198 (30.4%) |
| 8:00 AM to 8:29 AM | 79 (12.0%) | 120 (18.4%) |
| 8:30 AM to 8:59 AM | 17 (2.6%) | 11 (1.7%) |
| 9:00 AM to 9:59 AM | 14 (2.1%) | 19 (2.9%) |
| 10:00 AM to 10:59 AM | 15 (2.3%) | 0 (0.0%) |
| 11:00 AM to 11:59 AM | 0 (0.0%) | 3 (0.5%) |
| 12:00 PM to 3:59 PM | 20 (3.0%) | 51 (7.8%) |
| 4:00 PM to 11:59 PM | 23 (3.5%) | 45 (6.9%) |
| Total | 660 (100.0%) | 651 (100.0%) |
Housing Occupancy in Traverse County
Occupancy by Ownership in Traverse County
Of the total 1,433 dwellings in Traverse County, owner-occupied units account for 1,139 (79.5%), while renter-occupied units make up 294 (20.5%).

| Occupancy | # Housing Units | % Housing Units |
| Owner Occupied Housing Units | 1,139 | 79.5% |
| Renter-Occupied Housing Units | 294 | 20.5% |
| Total Occupied Housing Units | 1,433 | 100.0% |
Occupancy by Household Size in Traverse County
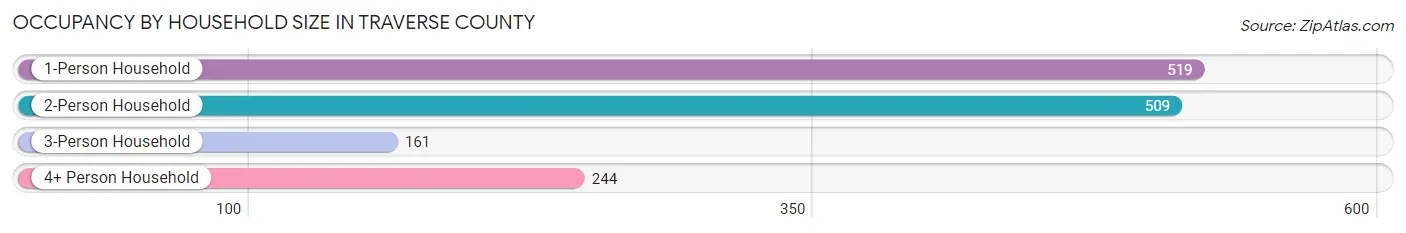
| Household Size | # Housing Units | % Housing Units |
| 1-Person Household | 519 | 36.2% |
| 2-Person Household | 509 | 35.5% |
| 3-Person Household | 161 | 11.2% |
| 4+ Person Household | 244 | 17.0% |
| Total Housing Units | 1,433 | 100.0% |
Occupancy by Ownership by Household Size in Traverse County
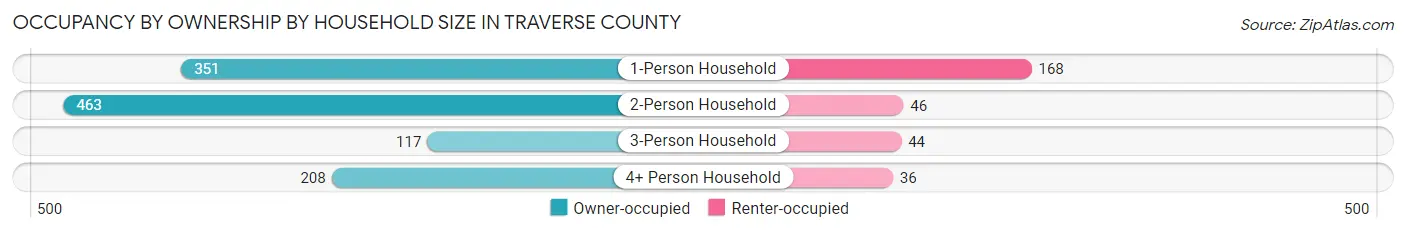
| Household Size | Owner-occupied | Renter-occupied |
| 1-Person Household | 351 (67.6%) | 168 (32.4%) |
| 2-Person Household | 463 (91.0%) | 46 (9.0%) |
| 3-Person Household | 117 (72.7%) | 44 (27.3%) |
| 4+ Person Household | 208 (85.3%) | 36 (14.7%) |
| Total Housing Units | 1,139 (79.5%) | 294 (20.5%) |
Occupancy by Educational Attainment in Traverse County
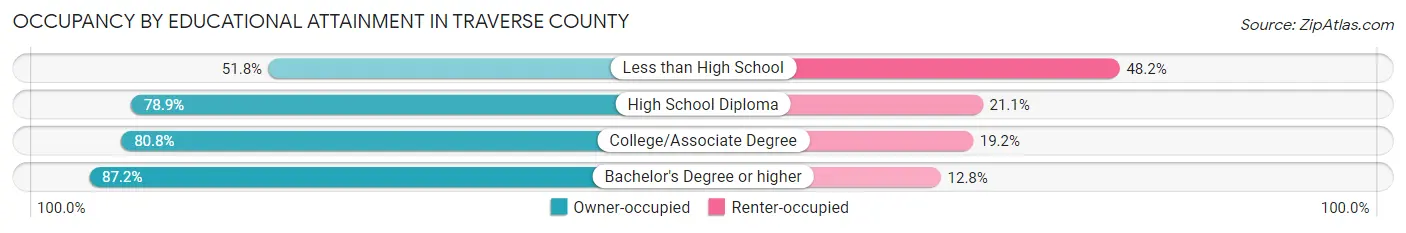
| Household Size | Owner-occupied | Renter-occupied |
| Less than High School | 44 (51.8%) | 41 (48.2%) |
| High School Diploma | 378 (78.9%) | 101 (21.1%) |
| College/Associate Degree | 519 (80.8%) | 123 (19.2%) |
| Bachelor's Degree or higher | 198 (87.2%) | 29 (12.8%) |
Occupancy by Age of Householder in Traverse County
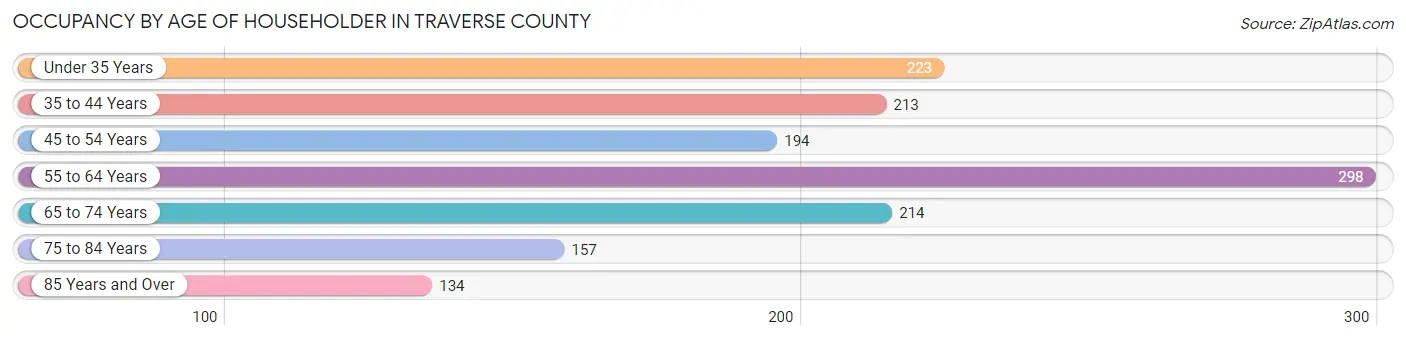
| Age Bracket | # Households | % Households |
| Under 35 Years | 223 | 15.6% |
| 35 to 44 Years | 213 | 14.9% |
| 45 to 54 Years | 194 | 13.5% |
| 55 to 64 Years | 298 | 20.8% |
| 65 to 74 Years | 214 | 14.9% |
| 75 to 84 Years | 157 | 11.0% |
| 85 Years and Over | 134 | 9.3% |
| Total | 1,433 | 100.0% |
Housing Finances in Traverse County
Median Income by Occupancy in Traverse County
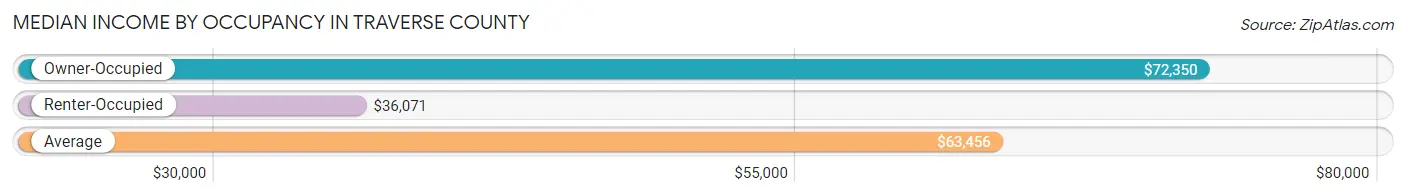
| Occupancy Type | # Households | Median Income |
| Owner-Occupied | 1,139 (79.5%) | $72,350 |
| Renter-Occupied | 294 (20.5%) | $36,071 |
| Average | 1,433 (100.0%) | $63,456 |
Occupancy by Householder Income Bracket in Traverse County
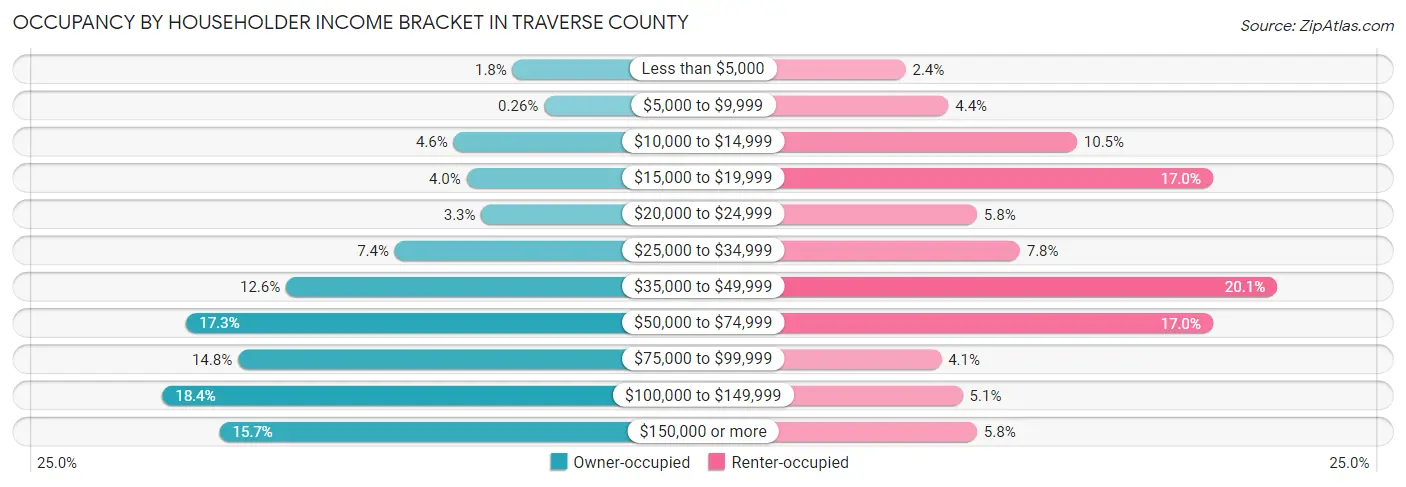
| Income Bracket | Owner-occupied | Renter-occupied |
| Less than $5,000 | 20 (1.8%) | 7 (2.4%) |
| $5,000 to $9,999 | 3 (0.3%) | 13 (4.4%) |
| $10,000 to $14,999 | 52 (4.6%) | 31 (10.5%) |
| $15,000 to $19,999 | 45 (4.0%) | 50 (17.0%) |
| $20,000 to $24,999 | 37 (3.3%) | 17 (5.8%) |
| $25,000 to $34,999 | 84 (7.4%) | 23 (7.8%) |
| $35,000 to $49,999 | 143 (12.6%) | 59 (20.1%) |
| $50,000 to $74,999 | 197 (17.3%) | 50 (17.0%) |
| $75,000 to $99,999 | 169 (14.8%) | 12 (4.1%) |
| $100,000 to $149,999 | 210 (18.4%) | 15 (5.1%) |
| $150,000 or more | 179 (15.7%) | 17 (5.8%) |
| Total | 1,139 (100.0%) | 294 (100.0%) |
Monthly Housing Cost Tiers in Traverse County
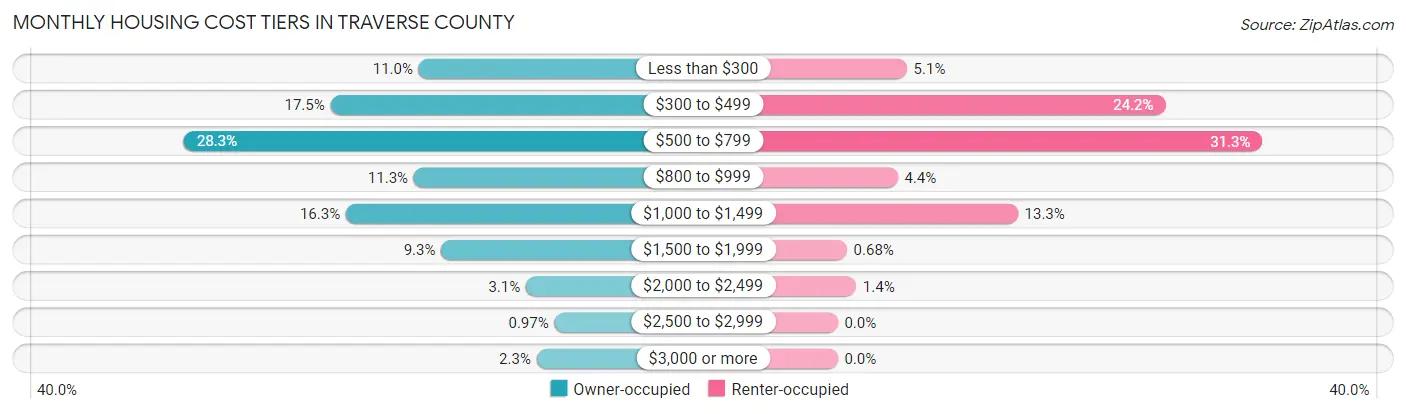
| Monthly Cost | Owner-occupied | Renter-occupied |
| Less than $300 | 125 (11.0%) | 15 (5.1%) |
| $300 to $499 | 199 (17.5%) | 71 (24.1%) |
| $500 to $799 | 322 (28.3%) | 92 (31.3%) |
| $800 to $999 | 129 (11.3%) | 13 (4.4%) |
| $1,000 to $1,499 | 186 (16.3%) | 39 (13.3%) |
| $1,500 to $1,999 | 106 (9.3%) | 2 (0.7%) |
| $2,000 to $2,499 | 35 (3.1%) | 4 (1.4%) |
| $2,500 to $2,999 | 11 (1.0%) | 0 (0.0%) |
| $3,000 or more | 26 (2.3%) | 0 (0.0%) |
| Total | 1,139 (100.0%) | 294 (100.0%) |
Physical Housing Characteristics in Traverse County
Housing Structures in Traverse County
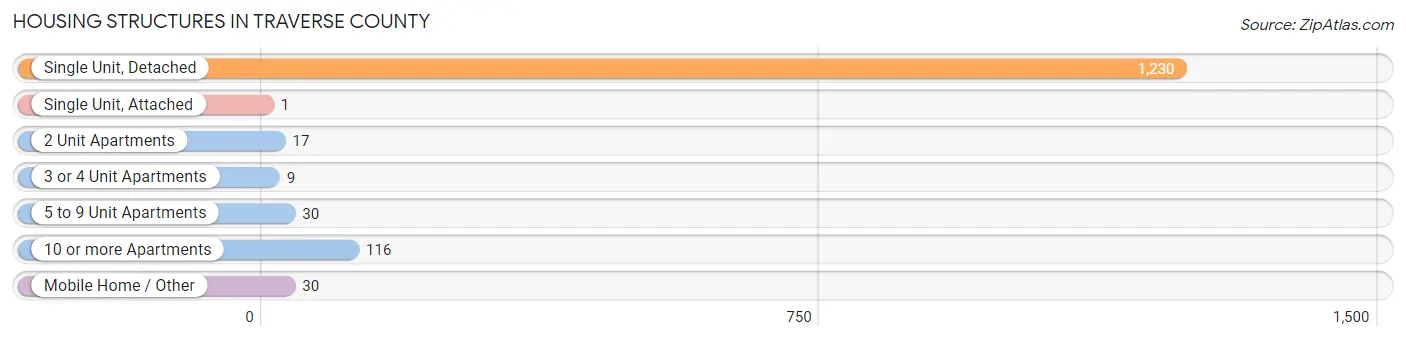
| Structure Type | # Housing Units | % Housing Units |
| Single Unit, Detached | 1,230 | 85.8% |
| Single Unit, Attached | 1 | 0.1% |
| 2 Unit Apartments | 17 | 1.2% |
| 3 or 4 Unit Apartments | 9 | 0.6% |
| 5 to 9 Unit Apartments | 30 | 2.1% |
| 10 or more Apartments | 116 | 8.1% |
| Mobile Home / Other | 30 | 2.1% |
| Total | 1,433 | 100.0% |
Housing Structures by Occupancy in Traverse County
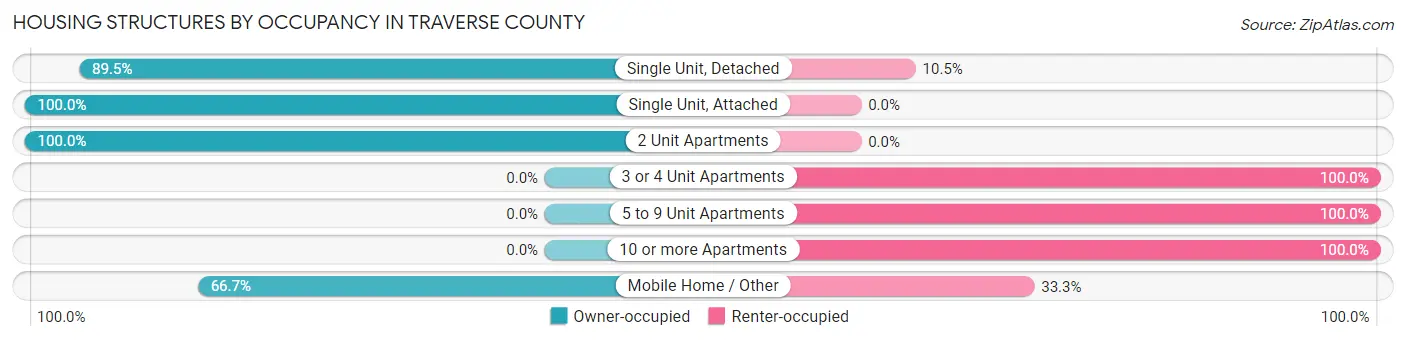
| Structure Type | Owner-occupied | Renter-occupied |
| Single Unit, Detached | 1,101 (89.5%) | 129 (10.5%) |
| Single Unit, Attached | 1 (100.0%) | 0 (0.0%) |
| 2 Unit Apartments | 17 (100.0%) | 0 (0.0%) |
| 3 or 4 Unit Apartments | 0 (0.0%) | 9 (100.0%) |
| 5 to 9 Unit Apartments | 0 (0.0%) | 30 (100.0%) |
| 10 or more Apartments | 0 (0.0%) | 116 (100.0%) |
| Mobile Home / Other | 20 (66.7%) | 10 (33.3%) |
| Total | 1,139 (79.5%) | 294 (20.5%) |
Housing Structures by Number of Rooms in Traverse County
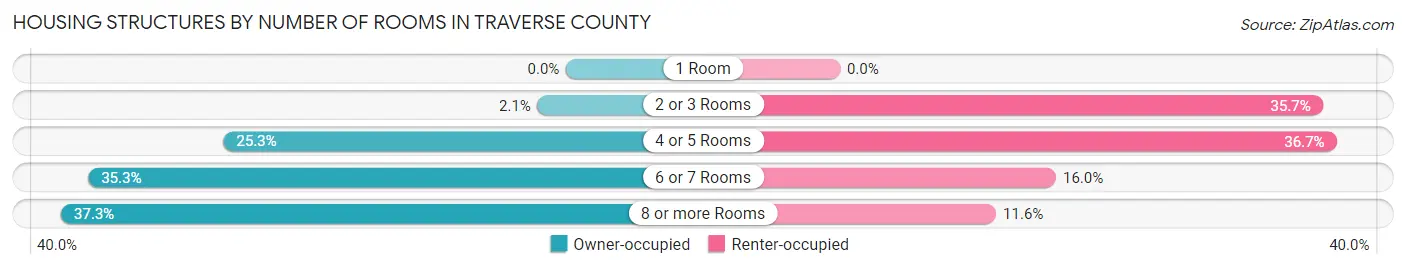
| Number of Rooms | Owner-occupied | Renter-occupied |
| 1 Room | 0 (0.0%) | 0 (0.0%) |
| 2 or 3 Rooms | 24 (2.1%) | 105 (35.7%) |
| 4 or 5 Rooms | 288 (25.3%) | 108 (36.7%) |
| 6 or 7 Rooms | 402 (35.3%) | 47 (16.0%) |
| 8 or more Rooms | 425 (37.3%) | 34 (11.6%) |
| Total | 1,139 (100.0%) | 294 (100.0%) |
Housing Structure by Heating Type in Traverse County

| Heating Type | Owner-occupied | Renter-occupied |
| Utility Gas | 21 (1.8%) | 0 (0.0%) |
| Bottled, Tank, or LP Gas | 676 (59.4%) | 140 (47.6%) |
| Electricity | 250 (22.0%) | 142 (48.3%) |
| Fuel Oil or Kerosene | 170 (14.9%) | 8 (2.7%) |
| Coal or Coke | 0 (0.0%) | 0 (0.0%) |
| All other Fuels | 18 (1.6%) | 3 (1.0%) |
| No Fuel Used | 4 (0.4%) | 1 (0.3%) |
| Total | 1,139 (100.0%) | 294 (100.0%) |
Household Vehicle Usage in Traverse County
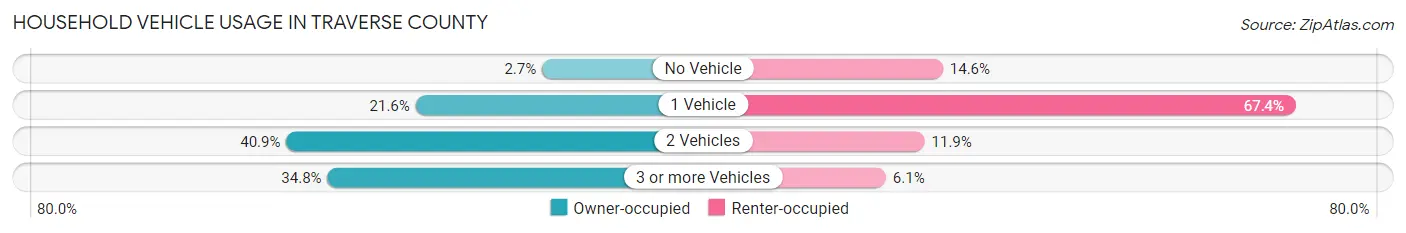
| Vehicles per Household | Owner-occupied | Renter-occupied |
| No Vehicle | 31 (2.7%) | 43 (14.6%) |
| 1 Vehicle | 246 (21.6%) | 198 (67.3%) |
| 2 Vehicles | 466 (40.9%) | 35 (11.9%) |
| 3 or more Vehicles | 396 (34.8%) | 18 (6.1%) |
| Total | 1,139 (100.0%) | 294 (100.0%) |
Real Estate & Mortgages in Traverse County
Real Estate and Mortgage Overview in Traverse County
| Characteristic | Without Mortgage | With Mortgage |
| Housing Units | 690 | 449 |
| Median Property Value | $107,700 | $111,500 |
| Median Household Income | $66,250 | $75 |
| Monthly Housing Costs | $529 | $23 |
| Real Estate Taxes | $881 | $5 |
Property Value by Mortgage Status in Traverse County

| Property Value | Without Mortgage | With Mortgage |
| Less than $50,000 | 183 (26.5%) | 61 (13.6%) |
| $50,000 to $99,999 | 140 (20.3%) | 140 (31.2%) |
| $100,000 to $299,999 | 264 (38.3%) | 175 (39.0%) |
| $300,000 to $499,999 | 45 (6.5%) | 56 (12.5%) |
| $500,000 to $749,999 | 25 (3.6%) | 17 (3.8%) |
| $750,000 to $999,999 | 5 (0.7%) | 0 (0.0%) |
| $1,000,000 or more | 28 (4.1%) | 0 (0.0%) |
| Total | 690 (100.0%) | 449 (100.0%) |
Household Income by Mortgage Status in Traverse County
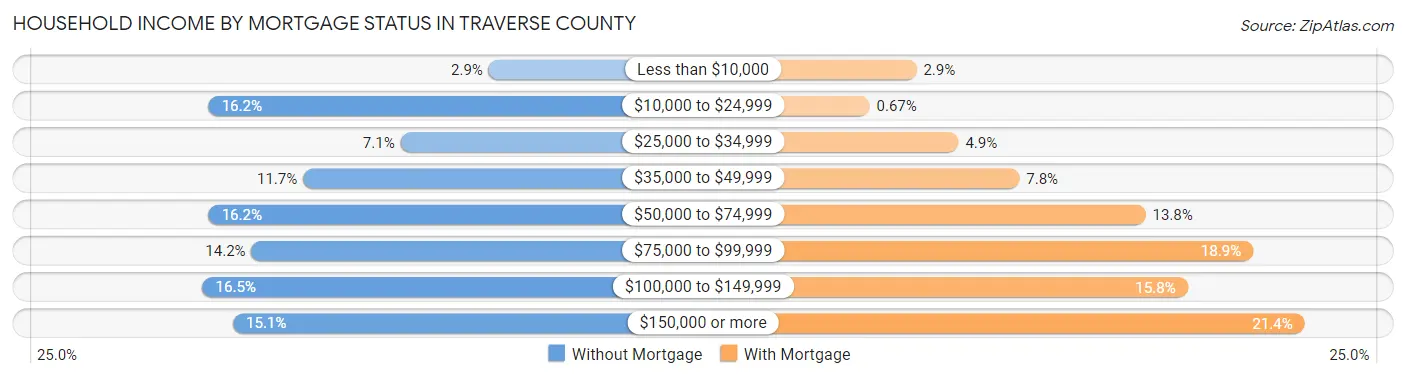
| Household Income | Without Mortgage | With Mortgage |
| Less than $10,000 | 20 (2.9%) | 13 (2.9%) |
| $10,000 to $24,999 | 112 (16.2%) | 3 (0.7%) |
| $25,000 to $34,999 | 49 (7.1%) | 22 (4.9%) |
| $35,000 to $49,999 | 81 (11.7%) | 35 (7.8%) |
| $50,000 to $74,999 | 112 (16.2%) | 62 (13.8%) |
| $75,000 to $99,999 | 98 (14.2%) | 85 (18.9%) |
| $100,000 to $149,999 | 114 (16.5%) | 71 (15.8%) |
| $150,000 or more | 104 (15.1%) | 96 (21.4%) |
| Total | 690 (100.0%) | 449 (100.0%) |
Property Value to Household Income Ratio in Traverse County
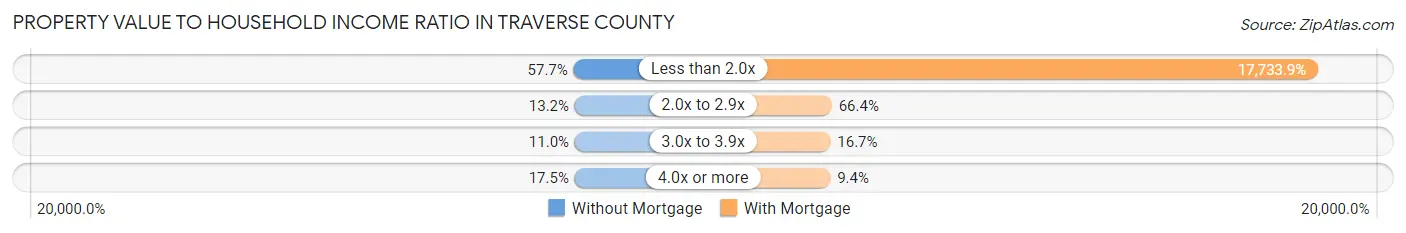
| Value-to-Income Ratio | Without Mortgage | With Mortgage |
| Less than 2.0x | 398 (57.7%) | 79,625 (17,733.9%) |
| 2.0x to 2.9x | 91 (13.2%) | 298 (66.4%) |
| 3.0x to 3.9x | 76 (11.0%) | 75 (16.7%) |
| 4.0x or more | 121 (17.5%) | 42 (9.3%) |
| Total | 690 (100.0%) | 449 (100.0%) |
Real Estate Taxes by Mortgage Status in Traverse County
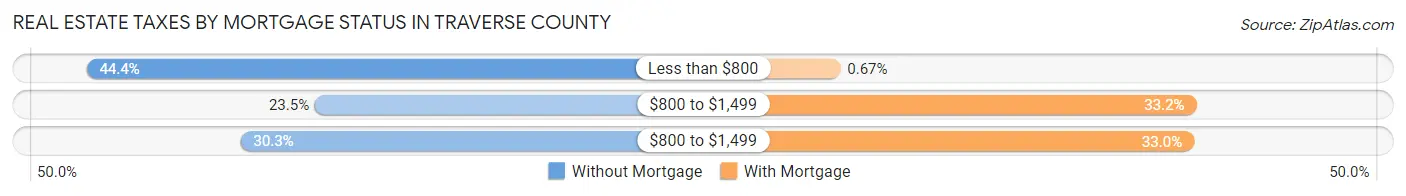
| Property Taxes | Without Mortgage | With Mortgage |
| Less than $800 | 306 (44.4%) | 3 (0.7%) |
| $800 to $1,499 | 162 (23.5%) | 149 (33.2%) |
| $800 to $1,499 | 209 (30.3%) | 148 (33.0%) |
| Total | 690 (100.0%) | 449 (100.0%) |
Health & Disability in Traverse County
Health Insurance Coverage by Age in Traverse County
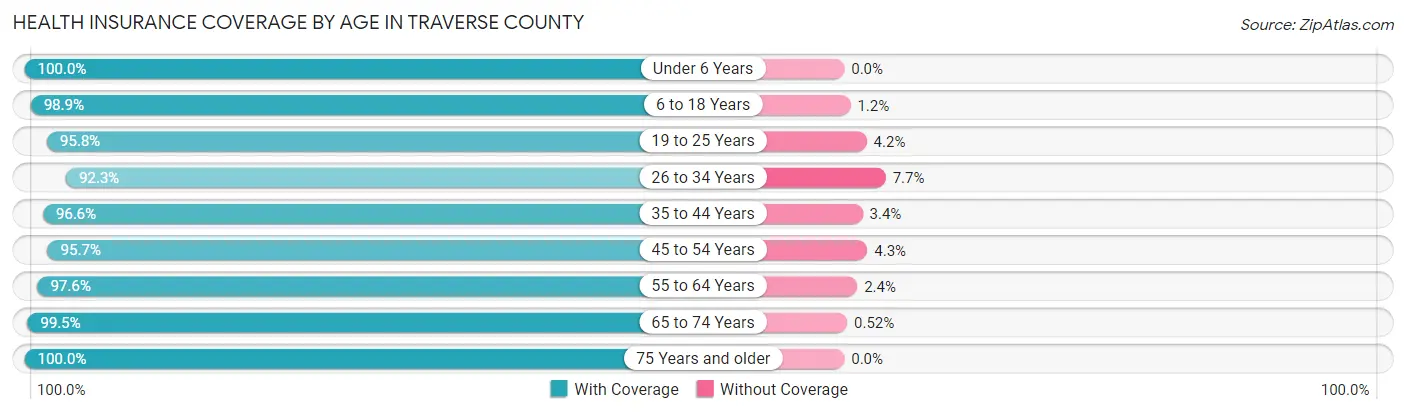
| Age Bracket | With Coverage | Without Coverage |
| Under 6 Years | 250 (100.0%) | 0 (0.0%) |
| 6 to 18 Years | 515 (98.9%) | 6 (1.1%) |
| 19 to 25 Years | 253 (95.8%) | 11 (4.2%) |
| 26 to 34 Years | 239 (92.3%) | 20 (7.7%) |
| 35 to 44 Years | 340 (96.6%) | 12 (3.4%) |
| 45 to 54 Years | 334 (95.7%) | 15 (4.3%) |
| 55 to 64 Years | 485 (97.6%) | 12 (2.4%) |
| 65 to 74 Years | 381 (99.5%) | 2 (0.5%) |
| 75 Years and older | 369 (100.0%) | 0 (0.0%) |
| Total | 3,166 (97.6%) | 78 (2.4%) |
Health Insurance Coverage by Citizenship Status in Traverse County
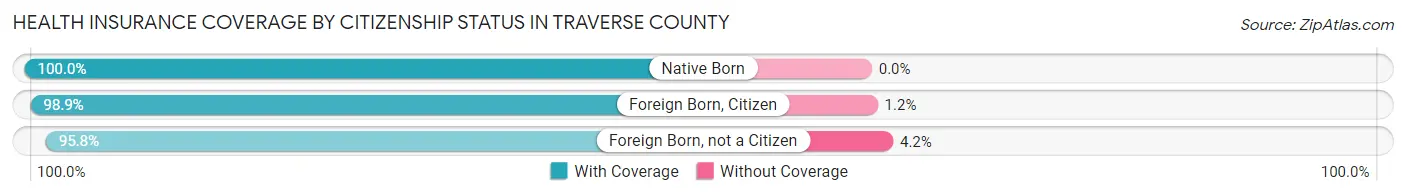
| Citizenship Status | With Coverage | Without Coverage |
| Native Born | 250 (100.0%) | 0 (0.0%) |
| Foreign Born, Citizen | 515 (98.9%) | 6 (1.1%) |
| Foreign Born, not a Citizen | 253 (95.8%) | 11 (4.2%) |
Health Insurance Coverage by Household Income in Traverse County
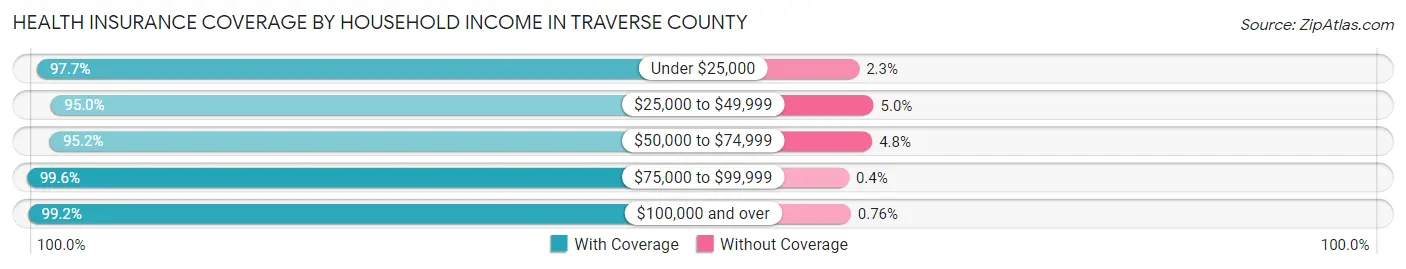
| Household Income | With Coverage | Without Coverage |
| Under $25,000 | 335 (97.7%) | 8 (2.3%) |
| $25,000 to $49,999 | 587 (95.0%) | 31 (5.0%) |
| $50,000 to $74,999 | 560 (95.2%) | 28 (4.8%) |
| $75,000 to $99,999 | 494 (99.6%) | 2 (0.4%) |
| $100,000 and over | 1,181 (99.2%) | 9 (0.8%) |
Public vs Private Health Insurance Coverage by Age in Traverse County
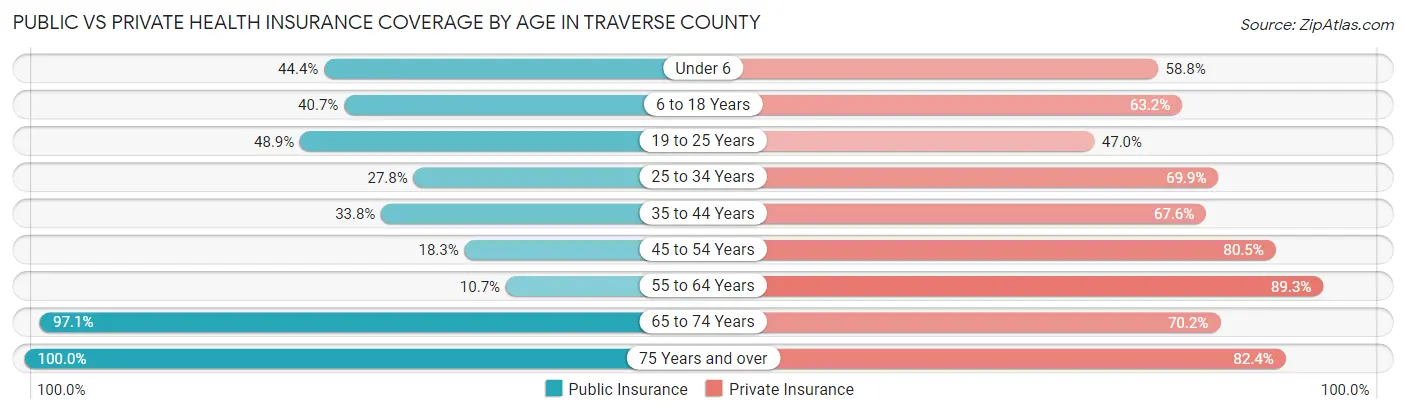
| Age Bracket | Public Insurance | Private Insurance |
| Under 6 | 111 (44.4%) | 147 (58.8%) |
| 6 to 18 Years | 212 (40.7%) | 329 (63.1%) |
| 19 to 25 Years | 129 (48.9%) | 124 (47.0%) |
| 25 to 34 Years | 72 (27.8%) | 181 (69.9%) |
| 35 to 44 Years | 119 (33.8%) | 238 (67.6%) |
| 45 to 54 Years | 64 (18.3%) | 281 (80.5%) |
| 55 to 64 Years | 53 (10.7%) | 444 (89.3%) |
| 65 to 74 Years | 372 (97.1%) | 269 (70.2%) |
| 75 Years and over | 369 (100.0%) | 304 (82.4%) |
| Total | 1,501 (46.3%) | 2,317 (71.4%) |
Disability Status by Sex by Age in Traverse County
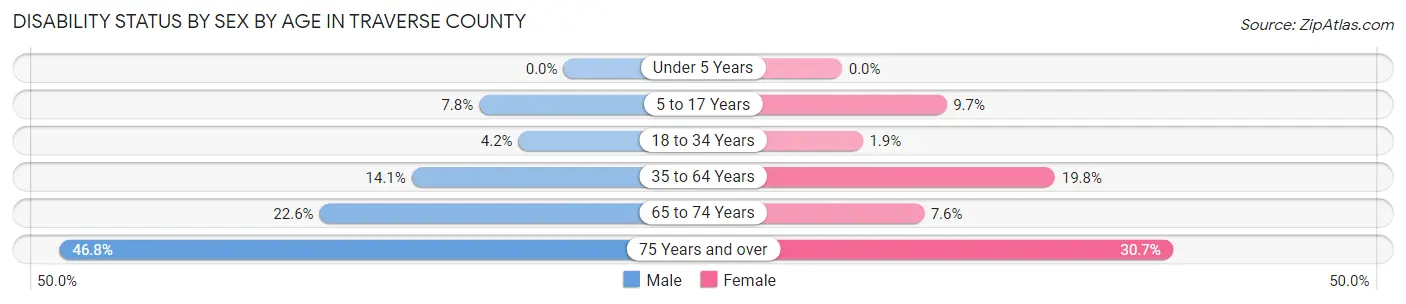
| Age Bracket | Male | Female |
| Under 5 Years | 0 (0.0%) | 0 (0.0%) |
| 5 to 17 Years | 19 (7.8%) | 25 (9.7%) |
| 18 to 34 Years | 13 (4.2%) | 5 (1.9%) |
| 35 to 64 Years | 84 (14.1%) | 119 (19.8%) |
| 65 to 74 Years | 48 (22.6%) | 13 (7.6%) |
| 75 Years and over | 72 (46.8%) | 66 (30.7%) |
Disability Class by Sex by Age in Traverse County
Disability Class: Hearing Difficulty
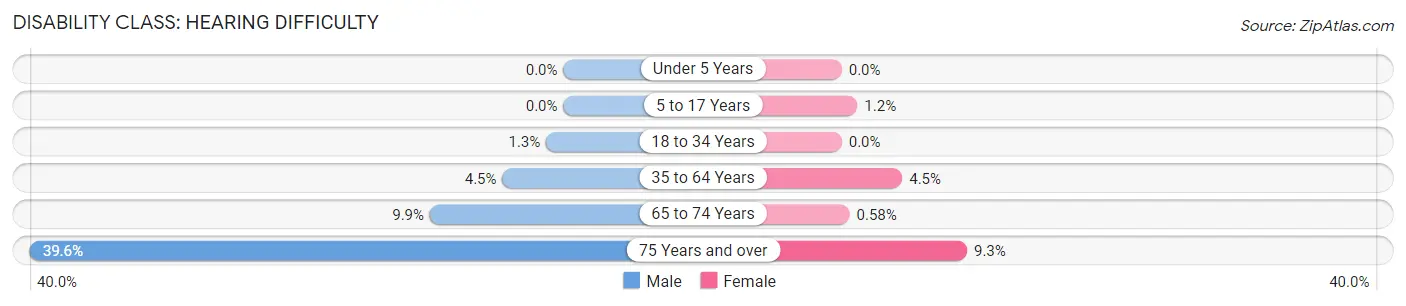
| Age Bracket | Male | Female |
| Under 5 Years | 0 (0.0%) | 0 (0.0%) |
| 5 to 17 Years | 0 (0.0%) | 3 (1.2%) |
| 18 to 34 Years | 4 (1.3%) | 0 (0.0%) |
| 35 to 64 Years | 27 (4.5%) | 27 (4.5%) |
| 65 to 74 Years | 21 (9.9%) | 1 (0.6%) |
| 75 Years and over | 61 (39.6%) | 20 (9.3%) |
Disability Class: Vision Difficulty
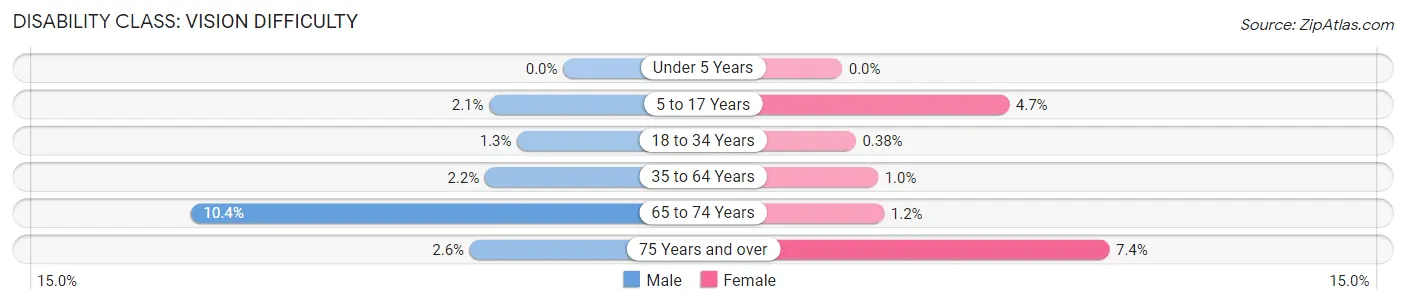
| Age Bracket | Male | Female |
| Under 5 Years | 0 (0.0%) | 0 (0.0%) |
| 5 to 17 Years | 5 (2.1%) | 12 (4.6%) |
| 18 to 34 Years | 4 (1.3%) | 1 (0.4%) |
| 35 to 64 Years | 13 (2.2%) | 6 (1.0%) |
| 65 to 74 Years | 22 (10.4%) | 2 (1.2%) |
| 75 Years and over | 4 (2.6%) | 16 (7.4%) |
Disability Class: Cognitive Difficulty
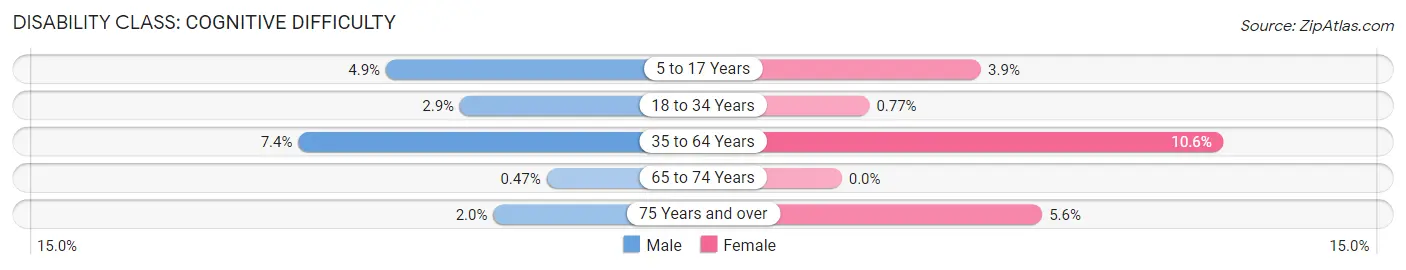
| Age Bracket | Male | Female |
| 5 to 17 Years | 12 (4.9%) | 10 (3.9%) |
| 18 to 34 Years | 9 (2.9%) | 2 (0.8%) |
| 35 to 64 Years | 44 (7.4%) | 64 (10.6%) |
| 65 to 74 Years | 1 (0.5%) | 0 (0.0%) |
| 75 Years and over | 3 (1.9%) | 12 (5.6%) |
Disability Class: Ambulatory Difficulty
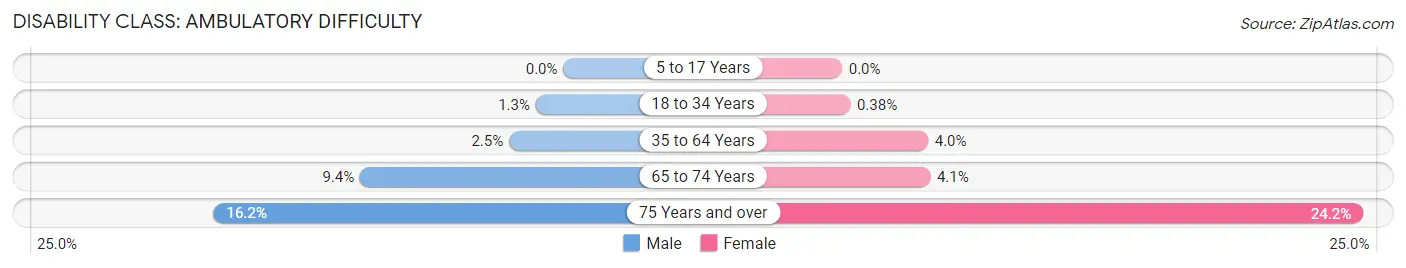
| Age Bracket | Male | Female |
| 5 to 17 Years | 0 (0.0%) | 0 (0.0%) |
| 18 to 34 Years | 4 (1.3%) | 1 (0.4%) |
| 35 to 64 Years | 15 (2.5%) | 24 (4.0%) |
| 65 to 74 Years | 20 (9.4%) | 7 (4.1%) |
| 75 Years and over | 25 (16.2%) | 52 (24.2%) |
Disability Class: Self-Care Difficulty
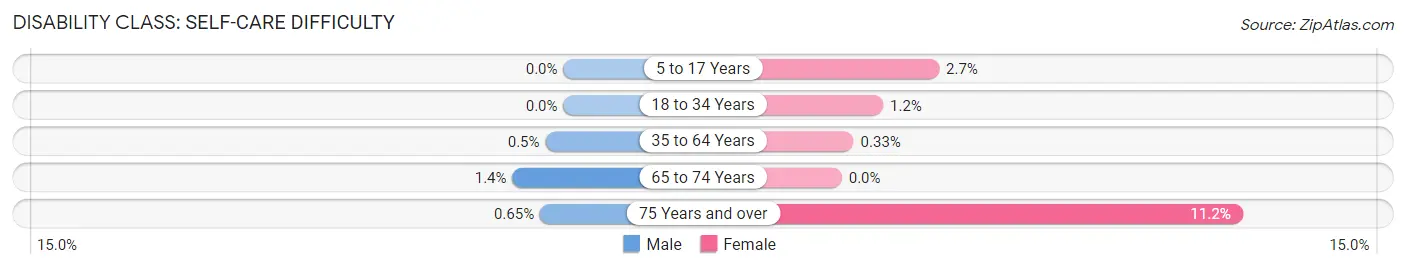
| Age Bracket | Male | Female |
| 5 to 17 Years | 0 (0.0%) | 7 (2.7%) |
| 18 to 34 Years | 0 (0.0%) | 3 (1.1%) |
| 35 to 64 Years | 3 (0.5%) | 2 (0.3%) |
| 65 to 74 Years | 3 (1.4%) | 0 (0.0%) |
| 75 Years and over | 1 (0.6%) | 24 (11.2%) |
Technology Access in Traverse County
Computing Device Access in Traverse County
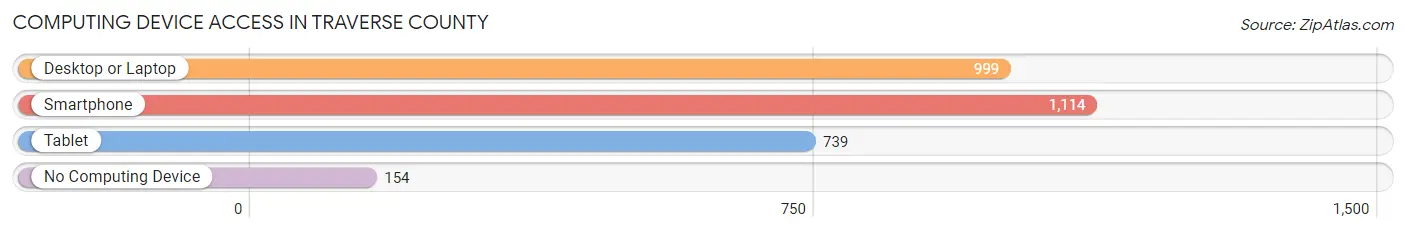
| Device Type | # Households | % Households |
| Desktop or Laptop | 999 | 69.7% |
| Smartphone | 1,114 | 77.7% |
| Tablet | 739 | 51.6% |
| No Computing Device | 154 | 10.7% |
| Total | 1,433 | 100.0% |
Internet Access in Traverse County
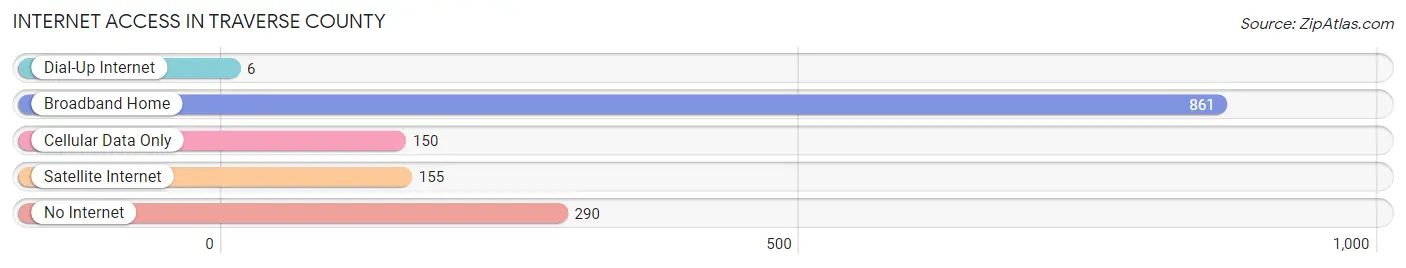
| Internet Type | # Households | % Households |
| Dial-Up Internet | 6 | 0.4% |
| Broadband Home | 861 | 60.1% |
| Cellular Data Only | 150 | 10.5% |
| Satellite Internet | 155 | 10.8% |
| No Internet | 290 | 20.2% |
| Total | 1,433 | 100.0% |
Traverse County Summary
Traverse County, Minnesota is located in the west-central part of the state, and is bordered by the counties of Wilkin, Grant, Douglas, Todd, and Stearns. It is part of the West Central Minnesota region, and is home to a population of approximately 8,000 people.
History
The area that is now Traverse County was first settled by European immigrants in the late 1800s. The first settlers were mostly of German and Scandinavian descent, and they established small farms and businesses in the area. The county was officially organized in 1872, and was named after the nearby Traverse River.
In the early 1900s, the county experienced a period of rapid growth, as more settlers moved to the area and established businesses. The county was home to a variety of industries, including lumber, farming, and manufacturing. The county also had a thriving tourism industry, as visitors flocked to the area to take advantage of the natural beauty and recreational opportunities.
Geography
Traverse County is located in the west-central part of Minnesota, and is bordered by the counties of Wilkin, Grant, Douglas, Todd, and Stearns. The county covers an area of approximately 845 square miles, and is home to a variety of landscapes, including rolling hills, wooded areas, and wetlands. The county is also home to several lakes, including Big Stone Lake, Lake Traverse, and Lake Osakis.
The county is located in the Central Plains region of Minnesota, and is part of the West Central Minnesota region. The county is located approximately 100 miles from Minneapolis, and is within a two-hour drive of several major cities, including St. Paul, Duluth, and Fargo.
Economy
The economy of Traverse County is largely based on agriculture and tourism. The county is home to a variety of farms, including dairy, beef, and grain farms. The county is also home to several tourist attractions, including the Big Stone Lake State Park, the Traverse County Historical Museum, and the Traverse County Fairgrounds.
The county is also home to several manufacturing companies, including a paper mill, a furniture factory, and a plastics factory. The county is also home to several retail stores, restaurants, and other businesses.
Demographics
As of the 2010 census, the population of Traverse County was 8,039. The population is largely white (94.3%), with small percentages of African American (2.2%), Native American (1.2%), and Asian (0.7%) residents. The median household income in the county is $45,845, and the median age is 43.7 years.
Conclusion
Traverse County, Minnesota is a rural county located in the west-central part of the state. The county is home to a population of approximately 8,000 people, and is largely based on agriculture and tourism. The county is home to a variety of landscapes, including rolling hills, wooded areas, and wetlands. The county is also home to several tourist attractions, manufacturing companies, and retail stores. The population of the county is largely white, with small percentages of African American, Native American, and Asian residents.
Common Questions
What is Per Capita Income in Traverse County?
Per Capita income in Traverse County is $36,023.
What is the Median Family Income in Traverse County?
Median Family Income in Traverse County is $89,432.
What is the Median Household income in Traverse County?
Median Household Income in Traverse County is $63,456.
What is Income or Wage Gap in Traverse County?
Income or Wage Gap in Traverse County is 38.5%.
Women in Traverse County earn 61.5 cents for every dollar earned by a man.
What is Inequality or Gini Index in Traverse County?
Inequality or Gini Index in Traverse County is 0.43.
What is the Total Population of Traverse County?
Total Population of Traverse County is 3,345.
What is the Total Male Population of Traverse County?
Total Male Population of Traverse County is 1,660.
What is the Total Female Population of Traverse County?
Total Female Population of Traverse County is 1,685.
What is the Ratio of Males per 100 Females in Traverse County?
There are 98.52 Males per 100 Females in Traverse County.
What is the Ratio of Females per 100 Males in Traverse County?
There are 101.51 Females per 100 Males in Traverse County.
What is the Median Population Age in Traverse County?
Median Population Age in Traverse County is 45.3 Years.
What is the Average Family Size in Traverse County
Average Family Size in Traverse County is 3.0 People.
What is the Average Household Size in Traverse County
Average Household Size in Traverse County is 2.3 People.
How Large is the Labor Force in Traverse County?
There are 1,673 People in the Labor Forcein in Traverse County.
What is the Percentage of People in the Labor Force in Traverse County?
62.3% of People are in the Labor Force in Traverse County.
What is the Unemployment Rate in Traverse County?
Unemployment Rate in Traverse County is 4.0%.