Pine County, MN Map & Demographics
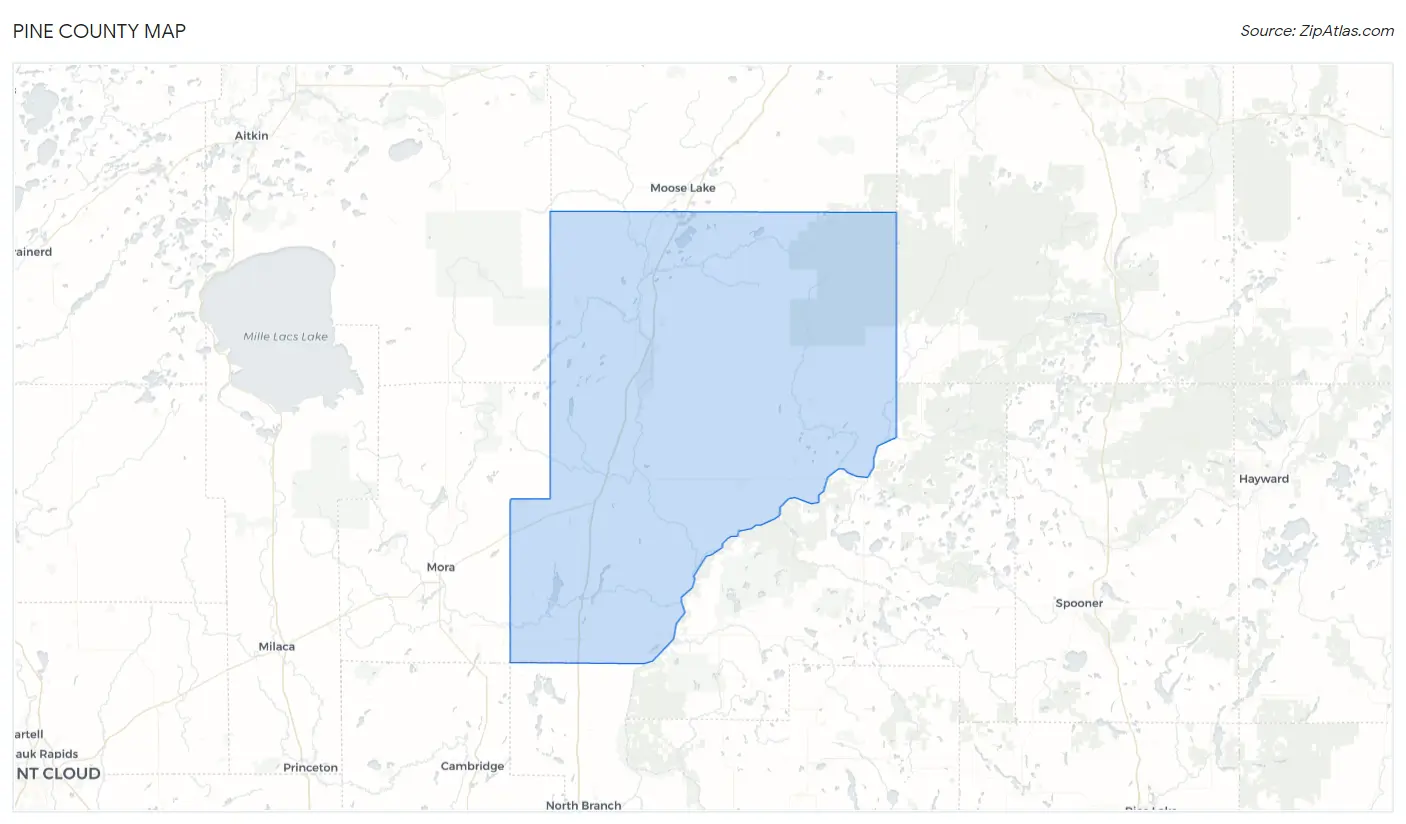
Pine County Map
Pine County Overview
$32,335
PER CAPITA INCOME
$79,482
AVG FAMILY INCOME
$65,059
AVG HOUSEHOLD INCOME
32.9%
WAGE / INCOME GAP [ % ]
67.1¢/ $1
WAGE / INCOME GAP [ $ ]
$10,301
FAMILY INCOME DEFICIT
0.42
INEQUALITY / GINI INDEX
29,090
TOTAL POPULATION
15,605
MALE POPULATION
13,485
FEMALE POPULATION
115.72
MALES / 100 FEMALES
86.41
FEMALES / 100 MALES
45.6
MEDIAN AGE
3.0
AVG FAMILY SIZE
2.4
AVG HOUSEHOLD SIZE
13,733
LABOR FORCE [ PEOPLE ]
56.8%
PERCENT IN LABOR FORCE
5.8%
UNEMPLOYMENT RATE
Income in Pine County
Income Overview in Pine County
Per Capita Income in Pine County is $32,335, while median incomes of families and households are $79,482 and $65,059 respectively.
| Characteristic | Number | Measure |
| Per Capita Income | 29,090 | $32,335 |
| Median Family Income | 7,233 | $79,482 |
| Mean Family Income | 7,233 | $93,237 |
| Median Household Income | 11,380 | $65,059 |
| Mean Household Income | 11,380 | $78,804 |
| Income Deficit | 7,233 | $10,301 |
| Wage / Income Gap (%) | 29,090 | 32.87% |
| Wage / Income Gap ($) | 29,090 | 67.13¢ per $1 |
| Gini / Inequality Index | 29,090 | 0.42 |
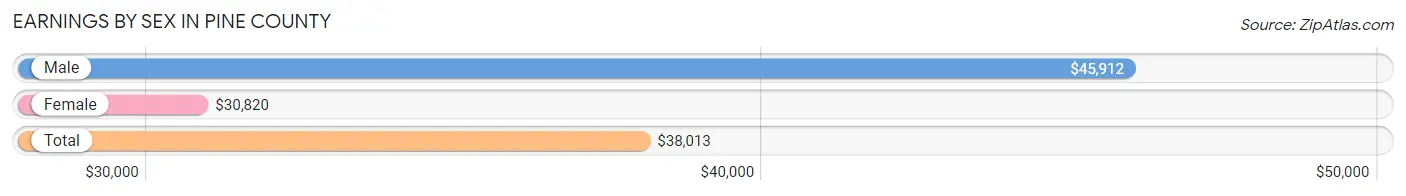
Earnings by Sex in Pine County
Average Earnings in Pine County are $38,013, $45,912 for men and $30,820 for women, a difference of 32.9%.
| Sex | Number | Average Earnings |
| Male | 8,095 (55.2%) | $45,912 |
| Female | 6,572 (44.8%) | $30,820 |
| Total | 14,667 (100.0%) | $38,013 |
Earnings by Sex by Income Bracket in Pine County
The most common earnings brackets in Pine County are $75,000 to $99,999 for men (972 | 12.0%) and $40,000 to $44,999 for women (495 | 7.5%).

| Income | Male | Female |
| $2,499 or less | 459 (5.7%) | 320 (4.9%) |
| $2,500 to $4,999 | 332 (4.1%) | 254 (3.9%) |
| $5,000 to $7,499 | 257 (3.2%) | 322 (4.9%) |
| $7,500 to $9,999 | 249 (3.1%) | 220 (3.4%) |
| $10,000 to $12,499 | 240 (3.0%) | 235 (3.6%) |
| $12,500 to $14,999 | 183 (2.3%) | 267 (4.1%) |
| $15,000 to $17,499 | 207 (2.6%) | 329 (5.0%) |
| $17,500 to $19,999 | 149 (1.8%) | 213 (3.2%) |
| $20,000 to $22,499 | 206 (2.5%) | 282 (4.3%) |
| $22,500 to $24,999 | 161 (2.0%) | 301 (4.6%) |
| $25,000 to $29,999 | 321 (4.0%) | 463 (7.0%) |
| $30,000 to $34,999 | 454 (5.6%) | 446 (6.8%) |
| $35,000 to $39,999 | 341 (4.2%) | 376 (5.7%) |
| $40,000 to $44,999 | 375 (4.6%) | 495 (7.5%) |
| $45,000 to $49,999 | 497 (6.1%) | 326 (5.0%) |
| $50,000 to $54,999 | 434 (5.4%) | 277 (4.2%) |
| $55,000 to $64,999 | 762 (9.4%) | 453 (6.9%) |
| $65,000 to $74,999 | 642 (7.9%) | 371 (5.7%) |
| $75,000 to $99,999 | 972 (12.0%) | 418 (6.4%) |
| $100,000+ | 854 (10.5%) | 204 (3.1%) |
| Total | 8,095 (100.0%) | 6,572 (100.0%) |
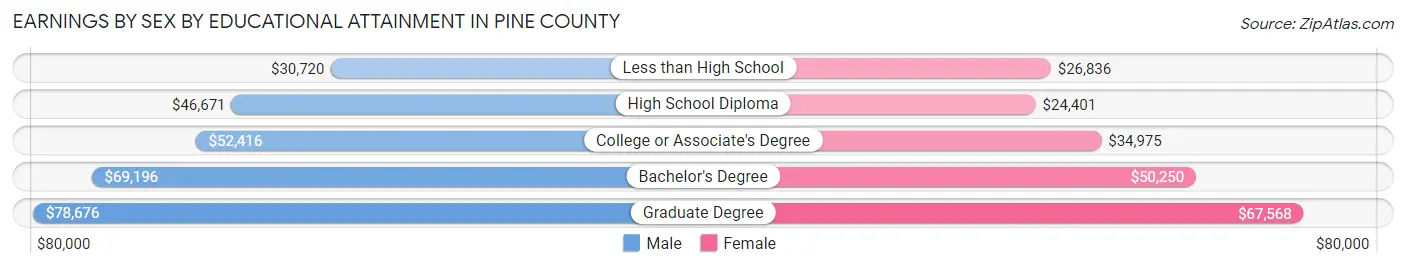
Earnings by Sex by Educational Attainment in Pine County
Average earnings in Pine County are $50,028 for men and $34,652 for women, a difference of 30.7%. Men with an educational attainment of graduate degree enjoy the highest average annual earnings of $78,676, while those with less than high school education earn the least with $30,720. Women with an educational attainment of graduate degree earn the most with the average annual earnings of $67,568, while those with high school diploma education have the smallest earnings of $24,401.
| Educational Attainment | Male Income | Female Income |
| Less than High School | $30,720 | $26,836 |
| High School Diploma | $46,671 | $24,401 |
| College or Associate's Degree | $52,416 | $34,975 |
| Bachelor's Degree | $69,196 | $50,250 |
| Graduate Degree | $78,676 | $67,568 |
| Total | $50,028 | $34,652 |
Family Income in Pine County
Family Income Brackets in Pine County
According to the Pine County family income data, there are 1,613 families falling into the $100,000 to $149,999 income range, which is the most common income bracket and makes up 22.3% of all families. Conversely, the $10,000 to $14,999 income bracket is the least frequent group with only 108 families (1.5%) belonging to this category.

| Income Bracket | # Families | % Families |
| Less than $10,000 | 210 | 2.9% |
| $10,000 to $14,999 | 108 | 1.5% |
| $15,000 to $24,999 | 268 | 3.7% |
| $25,000 to $34,999 | 441 | 6.1% |
| $35,000 to $49,999 | 904 | 12.5% |
| $50,000 to $74,999 | 1,410 | 19.5% |
| $75,000 to $99,999 | 1,215 | 16.8% |
| $100,000 to $149,999 | 1,613 | 22.3% |
| $150,000 to $199,999 | 629 | 8.7% |
| $200,000+ | 434 | 6.0% |
Family Income by Famaliy Size in Pine County
6-person families (166 | 2.3%) account for the highest median family income in Pine County with $122,500 per family, while 2-person families (4,287 | 59.3%) have the highest median income of $34,346 per family member.

| Income Bracket | # Families | Median Income |
| 2-Person Families | 4,287 (59.3%) | $68,691 |
| 3-Person Families | 1,100 (15.2%) | $91,765 |
| 4-Person Families | 1,154 (16.0%) | $107,381 |
| 5-Person Families | 424 (5.9%) | $90,357 |
| 6-Person Families | 166 (2.3%) | $122,500 |
| 7+ Person Families | 102 (1.4%) | $80,833 |
| Total | 7,233 (100.0%) | $79,482 |
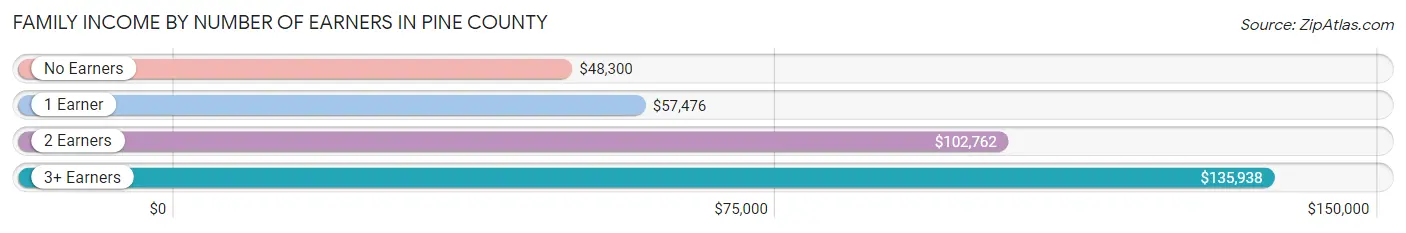
Family Income by Number of Earners in Pine County
The median family income in Pine County is $79,482, with families comprising 3+ earners (771) having the highest median family income of $135,938, while families with no earners (1,538) have the lowest median family income of $48,300, accounting for 10.7% and 21.3% of families, respectively.
| Number of Earners | # Families | Median Income |
| No Earners | 1,538 (21.3%) | $48,300 |
| 1 Earner | 1,935 (26.8%) | $57,476 |
| 2 Earners | 2,989 (41.3%) | $102,762 |
| 3+ Earners | 771 (10.7%) | $135,938 |
| Total | 7,233 (100.0%) | $79,482 |
Household Income in Pine County
Household Income Brackets in Pine County
With 2,094 households falling in the category, the $50,000 to $74,999 income range is the most frequent in Pine County, accounting for 18.4% of all households. In contrast, only 489 households (4.3%) fall into the less than $10,000 income bracket, making it the least populous group.
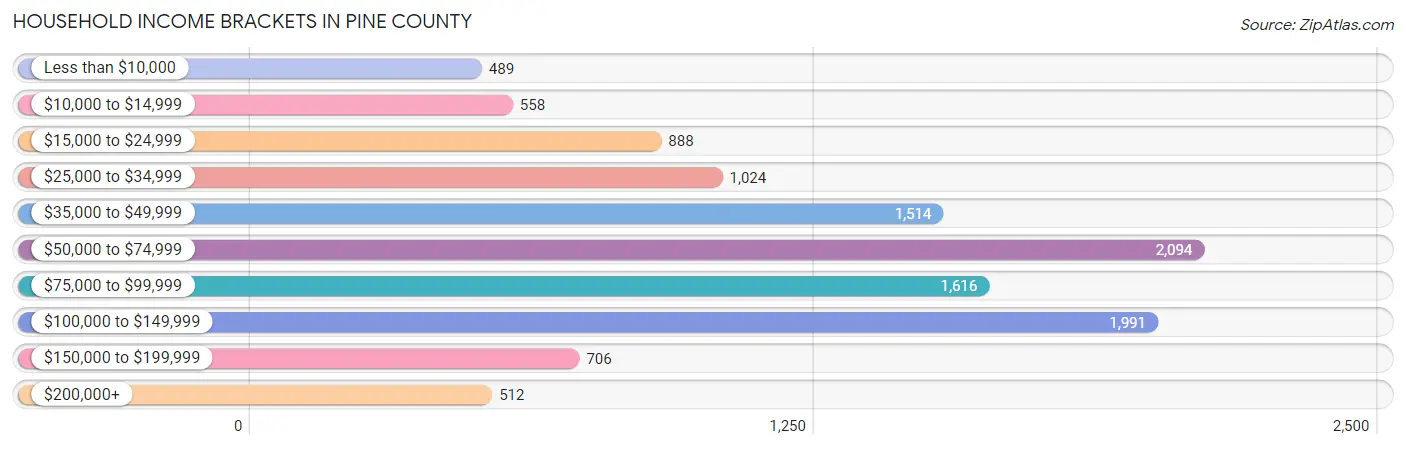
| Income Bracket | # Households | % Households |
| Less than $10,000 | 489 | 4.3% |
| $10,000 to $14,999 | 558 | 4.9% |
| $15,000 to $24,999 | 888 | 7.8% |
| $25,000 to $34,999 | 1,024 | 9.0% |
| $35,000 to $49,999 | 1,514 | 13.3% |
| $50,000 to $74,999 | 2,094 | 18.4% |
| $75,000 to $99,999 | 1,616 | 14.2% |
| $100,000 to $149,999 | 1,991 | 17.5% |
| $150,000 to $199,999 | 706 | 6.2% |
| $200,000+ | 512 | 4.5% |
Household Income by Householder Age in Pine County
The median household income in Pine County is $65,059, with the highest median household income of $82,258 found in the 25 to 44 years age bracket for the primary householder. A total of 2,802 households (24.6%) fall into this category. Meanwhile, the 65+ years age bracket for the primary householder has the lowest median household income of $43,787, with 3,920 households (34.4%) in this group.

| Income Bracket | # Households | Median Income |
| 15 to 24 Years | 184 (1.6%) | $48,571 |
| 25 to 44 Years | 2,802 (24.6%) | $82,258 |
| 45 to 64 Years | 4,474 (39.3%) | $75,169 |
| 65+ Years | 3,920 (34.4%) | $43,787 |
| Total | 11,380 (100.0%) | $65,059 |
Poverty in Pine County
Income Below Poverty by Sex and Age in Pine County
With 10.2% poverty level for males and 11.1% for females among the residents of Pine County, 5 year old males and 25 to 34 year old females are the most vulnerable to poverty, with 39 males (28.1%) and 239 females (19.8%) in their respective age groups living below the poverty level.
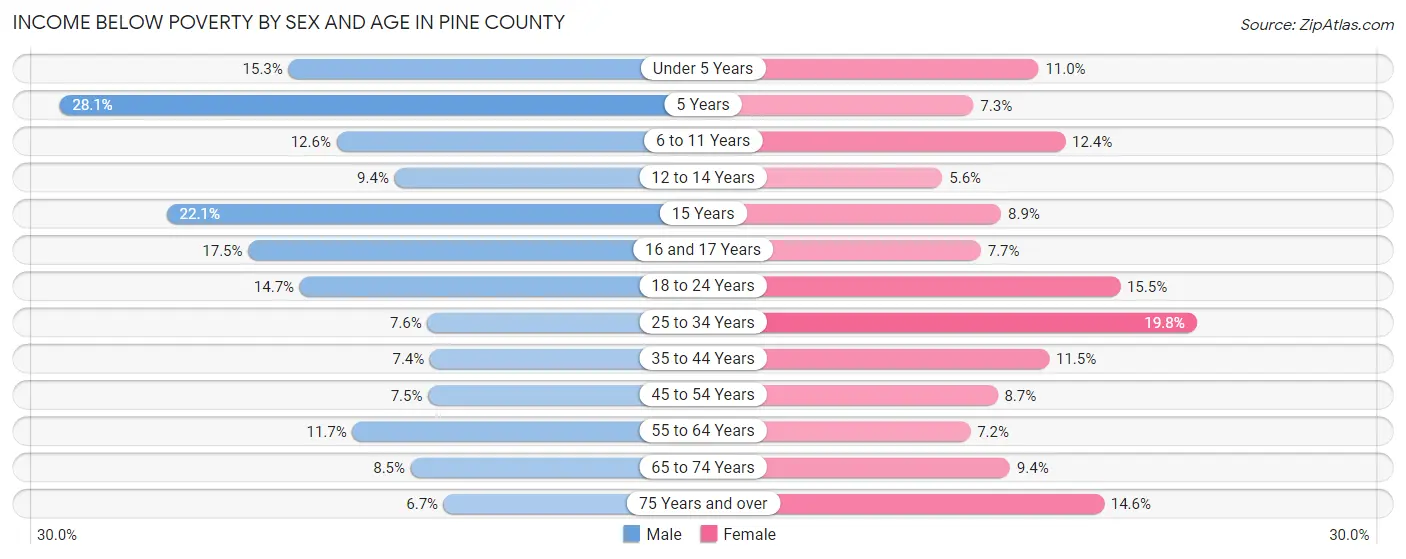
| Age Bracket | Male | Female |
| Under 5 Years | 99 (15.3%) | 67 (11.0%) |
| 5 Years | 39 (28.1%) | 11 (7.3%) |
| 6 to 11 Years | 106 (12.6%) | 107 (12.4%) |
| 12 to 14 Years | 54 (9.4%) | 26 (5.6%) |
| 15 Years | 38 (22.1%) | 18 (8.9%) |
| 16 and 17 Years | 67 (17.5%) | 26 (7.7%) |
| 18 to 24 Years | 159 (14.7%) | 134 (15.5%) |
| 25 to 34 Years | 117 (7.6%) | 239 (19.8%) |
| 35 to 44 Years | 124 (7.4%) | 181 (11.5%) |
| 45 to 54 Years | 134 (7.5%) | 144 (8.7%) |
| 55 to 64 Years | 291 (11.7%) | 161 (7.1%) |
| 65 to 74 Years | 161 (8.5%) | 165 (9.4%) |
| 75 Years and over | 73 (6.7%) | 192 (14.6%) |
| Total | 1,462 (10.2%) | 1,471 (11.1%) |
Income Above Poverty by Sex and Age in Pine County
According to the poverty statistics in Pine County, males aged 75 years and over and females aged 12 to 14 years are the age groups that are most secure financially, with 93.3% of males and 94.4% of females in these age groups living above the poverty line.
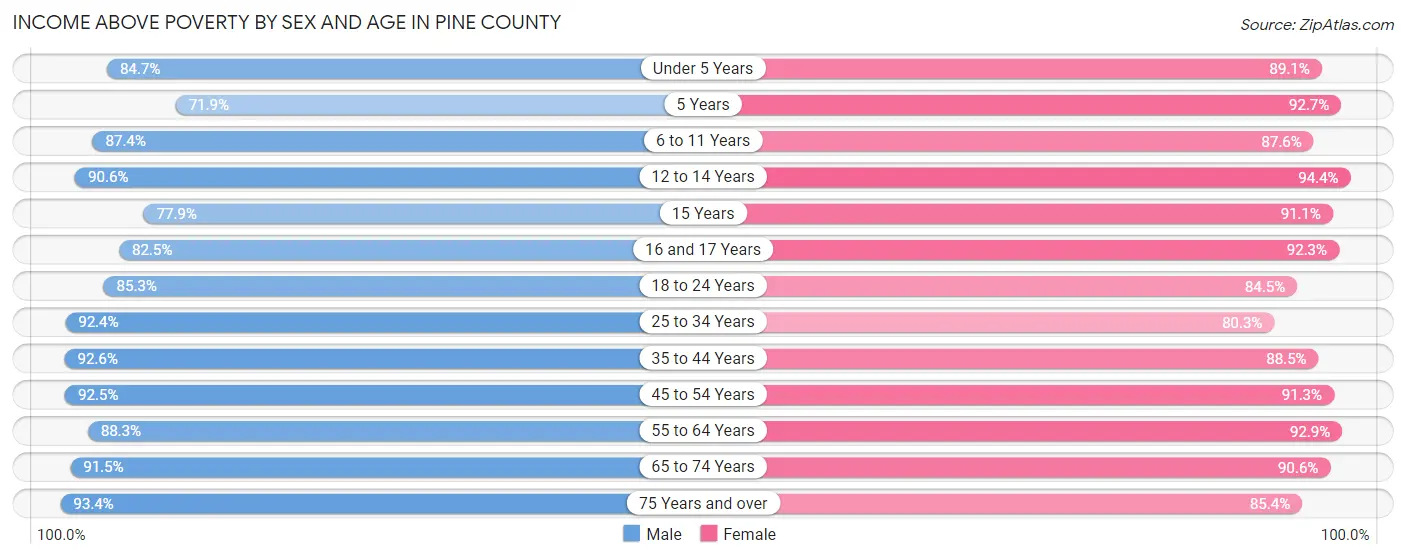
| Age Bracket | Male | Female |
| Under 5 Years | 548 (84.7%) | 545 (89.0%) |
| 5 Years | 100 (71.9%) | 139 (92.7%) |
| 6 to 11 Years | 734 (87.4%) | 754 (87.6%) |
| 12 to 14 Years | 521 (90.6%) | 438 (94.4%) |
| 15 Years | 134 (77.9%) | 185 (91.1%) |
| 16 and 17 Years | 315 (82.5%) | 310 (92.3%) |
| 18 to 24 Years | 925 (85.3%) | 731 (84.5%) |
| 25 to 34 Years | 1,430 (92.4%) | 971 (80.2%) |
| 35 to 44 Years | 1,548 (92.6%) | 1,387 (88.5%) |
| 45 to 54 Years | 1,649 (92.5%) | 1,516 (91.3%) |
| 55 to 64 Years | 2,187 (88.3%) | 2,090 (92.8%) |
| 65 to 74 Years | 1,736 (91.5%) | 1,597 (90.6%) |
| 75 Years and over | 1,024 (93.3%) | 1,124 (85.4%) |
| Total | 12,851 (89.8%) | 11,787 (88.9%) |
Income Below Poverty Among Married-Couple Families in Pine County
The poverty statistics for married-couple families in Pine County show that 2.5% or 145 of the total 5,741 families live below the poverty line. Families with 3 or 4 children have the highest poverty rate of 3.3%, comprising of 13 families. On the other hand, families with 5 or more children have the lowest poverty rate of 0.0%, which includes 0 families.
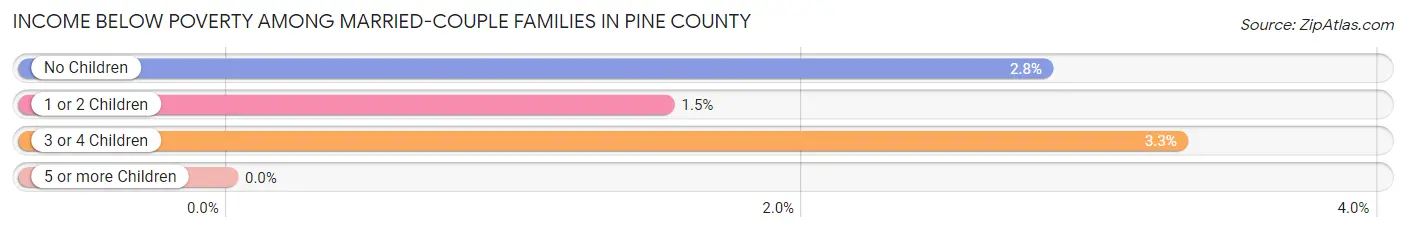
| Children | Above Poverty | Below Poverty |
| No Children | 3,792 (97.2%) | 111 (2.8%) |
| 1 or 2 Children | 1,365 (98.5%) | 21 (1.5%) |
| 3 or 4 Children | 380 (96.7%) | 13 (3.3%) |
| 5 or more Children | 59 (100.0%) | 0 (0.0%) |
| Total | 5,596 (97.5%) | 145 (2.5%) |
Income Below Poverty Among Single-Parent Households in Pine County
According to the poverty data in Pine County, 20.5% or 120 single-father households and 21.9% or 199 single-mother households are living below the poverty line. Among single-father households, those with 3 or 4 children have the highest poverty rate, with 21 households (34.4%) experiencing poverty. Likewise, among single-mother households, those with 5 or more children have the highest poverty rate, with 8 households (47.1%) falling below the poverty line.
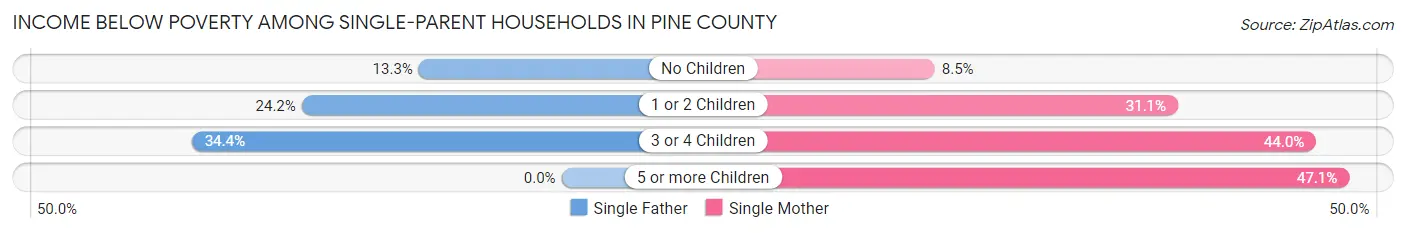
| Children | Single Father | Single Mother |
| No Children | 31 (13.3%) | 36 (8.5%) |
| 1 or 2 Children | 68 (24.2%) | 122 (31.1%) |
| 3 or 4 Children | 21 (34.4%) | 33 (44.0%) |
| 5 or more Children | 0 (0.0%) | 8 (47.1%) |
| Total | 120 (20.5%) | 199 (21.9%) |
Income Below Poverty Among Married-Couple vs Single-Parent Households in Pine County
The poverty data for Pine County shows that 145 of the married-couple family households (2.5%) and 319 of the single-parent households (21.4%) are living below the poverty level. Within the married-couple family households, those with 3 or 4 children have the highest poverty rate, with 13 households (3.3%) falling below the poverty line. Among the single-parent households, those with 3 or 4 children have the highest poverty rate, with 54 household (39.7%) living below poverty.
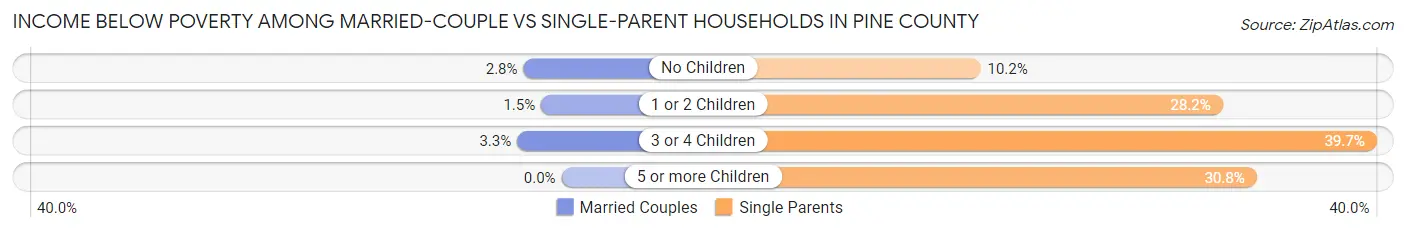
| Children | Married-Couple Families | Single-Parent Households |
| No Children | 111 (2.8%) | 67 (10.2%) |
| 1 or 2 Children | 21 (1.5%) | 190 (28.2%) |
| 3 or 4 Children | 13 (3.3%) | 54 (39.7%) |
| 5 or more Children | 0 (0.0%) | 8 (30.8%) |
| Total | 145 (2.5%) | 319 (21.4%) |
Race in Pine County
The most populous races in Pine County are White / Caucasian (26,314 | 90.5%), Two or more Races (1,181 | 4.1%), and Hispanic or Latino (907 | 3.1%).
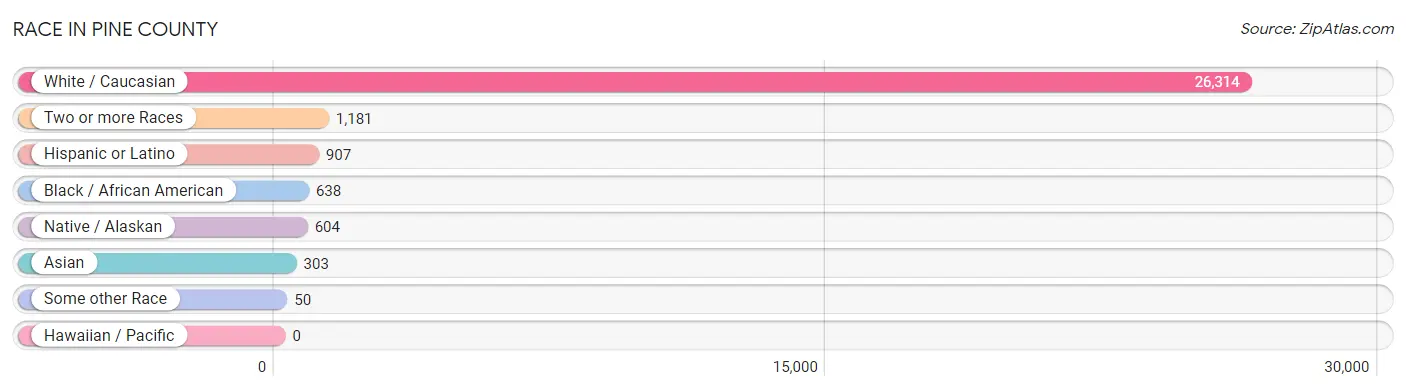
| Race | # Population | % Population |
| Asian | 303 | 1.0% |
| Black / African American | 638 | 2.2% |
| Hawaiian / Pacific | 0 | 0.0% |
| Hispanic or Latino | 907 | 3.1% |
| Native / Alaskan | 604 | 2.1% |
| White / Caucasian | 26,314 | 90.5% |
| Two or more Races | 1,181 | 4.1% |
| Some other Race | 50 | 0.2% |
| Total | 29,090 | 100.0% |
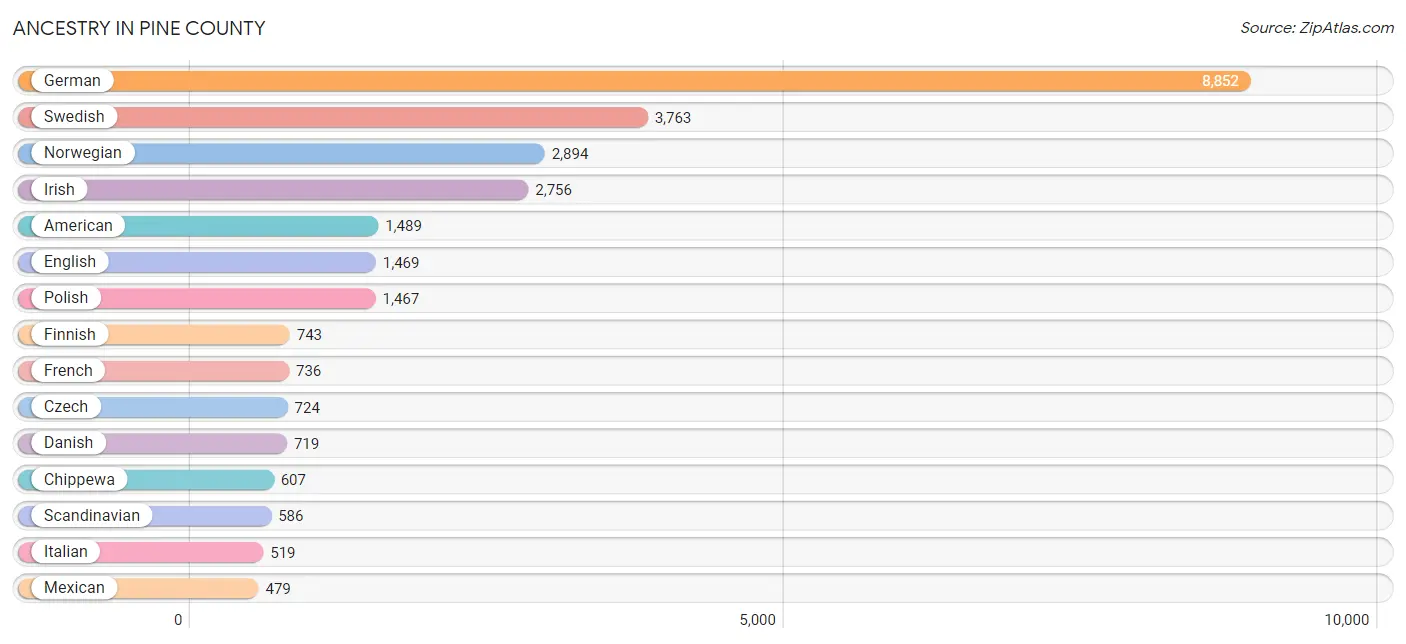
Ancestry in Pine County
The most populous ancestries reported in Pine County are German (8,852 | 30.4%), Swedish (3,763 | 12.9%), Norwegian (2,894 | 10.0%), Irish (2,756 | 9.5%), and American (1,489 | 5.1%), together accounting for 67.9% of all Pine County residents.
| Ancestry | # Population | % Population |
| African | 30 | 0.1% |
| Alaskan Athabascan | 8 | 0.0% |
| American | 1,489 | 5.1% |
| Apache | 8 | 0.0% |
| Arab | 39 | 0.1% |
| Argentinean | 23 | 0.1% |
| Austrian | 35 | 0.1% |
| Bangladeshi | 199 | 0.7% |
| Barbadian | 1 | 0.0% |
| Belgian | 24 | 0.1% |
| Bhutanese | 1 | 0.0% |
| Blackfeet | 5 | 0.0% |
| British | 76 | 0.3% |
| Burmese | 35 | 0.1% |
| Cajun | 7 | 0.0% |
| Canadian | 17 | 0.1% |
| Carpatho Rusyn | 1 | 0.0% |
| Central American | 26 | 0.1% |
| Cherokee | 37 | 0.1% |
| Chippewa | 607 | 2.1% |
| Choctaw | 3 | 0.0% |
| Cree | 1 | 0.0% |
| Creek | 6 | 0.0% |
| Croatian | 27 | 0.1% |
| Cuban | 41 | 0.1% |
| Czech | 724 | 2.5% |
| Czechoslovakian | 55 | 0.2% |
| Danish | 719 | 2.5% |
| Delaware | 12 | 0.0% |
| Dominican | 9 | 0.0% |
| Dutch | 324 | 1.1% |
| Dutch West Indian | 1 | 0.0% |
| Eastern European | 36 | 0.1% |
| English | 1,469 | 5.1% |
| Ethiopian | 7 | 0.0% |
| European | 389 | 1.3% |
| Finnish | 743 | 2.5% |
| French | 736 | 2.5% |
| French American Indian | 5 | 0.0% |
| French Canadian | 466 | 1.6% |
| German | 8,852 | 30.4% |
| Greek | 37 | 0.1% |
| Guatemalan | 17 | 0.1% |
| Haitian | 61 | 0.2% |
| Hungarian | 34 | 0.1% |
| Indian (Asian) | 31 | 0.1% |
| Inupiat | 7 | 0.0% |
| Irish | 2,756 | 9.5% |
| Iroquois | 3 | 0.0% |
| Italian | 519 | 1.8% |
| Jamaican | 18 | 0.1% |
| Jordanian | 7 | 0.0% |
| Korean | 41 | 0.1% |
| Laotian | 2 | 0.0% |
| Latvian | 6 | 0.0% |
| Lebanese | 9 | 0.0% |
| Liberian | 23 | 0.1% |
| Lithuanian | 21 | 0.1% |
| Luxembourger | 6 | 0.0% |
| Malaysian | 2 | 0.0% |
| Mexican | 479 | 1.7% |
| Mexican American Indian | 1 | 0.0% |
| Moroccan | 8 | 0.0% |
| Northern European | 28 | 0.1% |
| Norwegian | 2,894 | 10.0% |
| Pakistani | 25 | 0.1% |
| Panamanian | 9 | 0.0% |
| Polish | 1,467 | 5.0% |
| Portuguese | 8 | 0.0% |
| Puerto Rican | 33 | 0.1% |
| Romanian | 11 | 0.0% |
| Russian | 98 | 0.3% |
| Scandinavian | 586 | 2.0% |
| Scotch-Irish | 107 | 0.4% |
| Scottish | 423 | 1.5% |
| Seminole | 9 | 0.0% |
| Serbian | 4 | 0.0% |
| Shoshone | 2 | 0.0% |
| Sioux | 97 | 0.3% |
| Slavic | 13 | 0.0% |
| Slovak | 30 | 0.1% |
| Slovene | 17 | 0.1% |
| Somali | 1 | 0.0% |
| South American | 36 | 0.1% |
| Spaniard | 122 | 0.4% |
| Spanish | 23 | 0.1% |
| Sri Lankan | 27 | 0.1% |
| Subsaharan African | 61 | 0.2% |
| Swedish | 3,763 | 12.9% |
| Swiss | 64 | 0.2% |
| Syrian | 2 | 0.0% |
| Thai | 6 | 0.0% |
| Turkish | 13 | 0.0% |
| Ukrainian | 30 | 0.1% |
| Venezuelan | 13 | 0.0% |
| Welsh | 96 | 0.3% |
| Yaqui | 40 | 0.1% |
| Yugoslavian | 11 | 0.0% | View All 98 Rows |
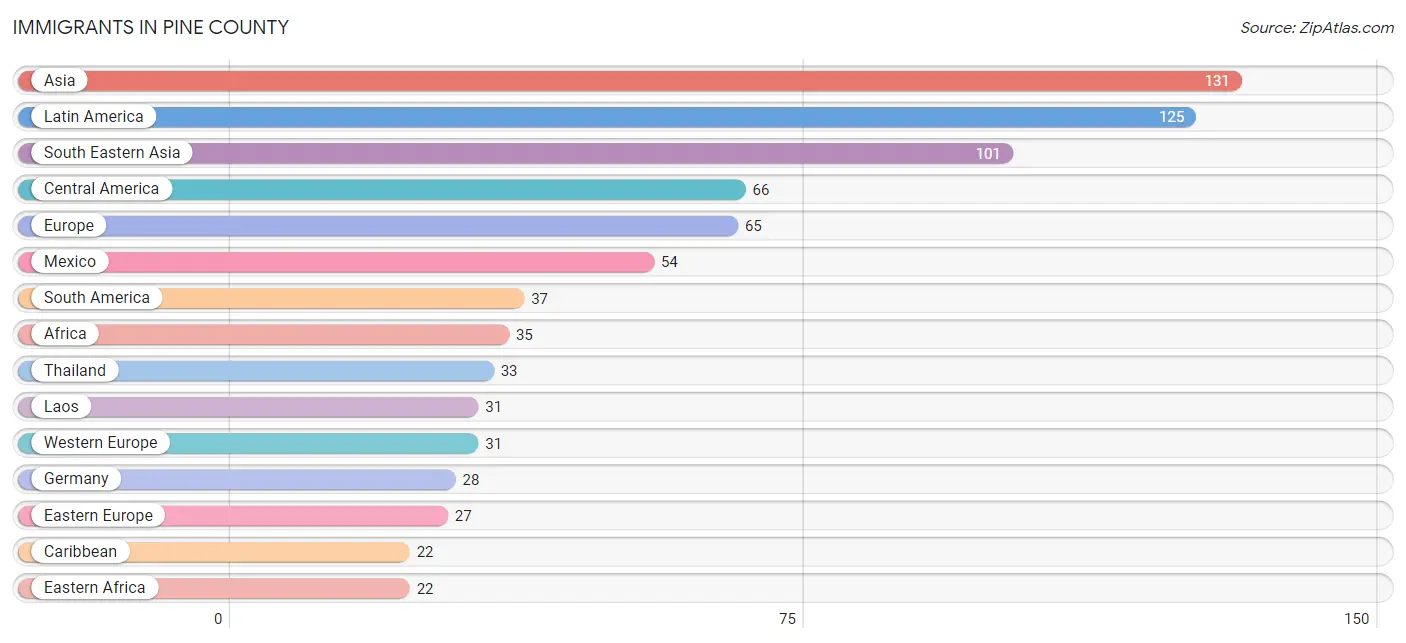
Immigrants in Pine County
The most numerous immigrant groups reported in Pine County came from Asia (131 | 0.4%), Latin America (125 | 0.4%), South Eastern Asia (101 | 0.4%), Central America (66 | 0.2%), and Europe (65 | 0.2%), together accounting for 1.7% of all Pine County residents.
| Immigration Origin | # Population | % Population |
| Africa | 35 | 0.1% |
| Asia | 131 | 0.4% |
| Austria | 2 | 0.0% |
| Bolivia | 8 | 0.0% |
| Bosnia and Herzegovina | 4 | 0.0% |
| Canada | 14 | 0.1% |
| Caribbean | 22 | 0.1% |
| Central America | 66 | 0.2% |
| China | 3 | 0.0% |
| Colombia | 8 | 0.0% |
| Dominican Republic | 6 | 0.0% |
| Eastern Africa | 22 | 0.1% |
| Eastern Asia | 14 | 0.1% |
| Eastern Europe | 27 | 0.1% |
| Ecuador | 8 | 0.0% |
| Ethiopia | 7 | 0.0% |
| Europe | 65 | 0.2% |
| Germany | 28 | 0.1% |
| Guatemala | 12 | 0.0% |
| Haiti | 12 | 0.0% |
| India | 12 | 0.0% |
| Indonesia | 2 | 0.0% |
| Jamaica | 4 | 0.0% |
| Jordan | 4 | 0.0% |
| Kenya | 3 | 0.0% |
| Korea | 11 | 0.0% |
| Laos | 31 | 0.1% |
| Latin America | 125 | 0.4% |
| Liberia | 12 | 0.0% |
| Mexico | 54 | 0.2% |
| Northern Africa | 1 | 0.0% |
| Northern Europe | 2 | 0.0% |
| Philippines | 21 | 0.1% |
| Poland | 5 | 0.0% |
| Russia | 6 | 0.0% |
| Somalia | 12 | 0.0% |
| South America | 37 | 0.1% |
| South Central Asia | 12 | 0.0% |
| South Eastern Asia | 101 | 0.4% |
| Southern Europe | 5 | 0.0% |
| Spain | 5 | 0.0% |
| Sudan | 1 | 0.0% |
| Switzerland | 1 | 0.0% |
| Thailand | 33 | 0.1% |
| Ukraine | 12 | 0.0% |
| Venezuela | 13 | 0.0% |
| Vietnam | 14 | 0.1% |
| Western Africa | 12 | 0.0% |
| Western Asia | 4 | 0.0% |
| Western Europe | 31 | 0.1% | View All 50 Rows |
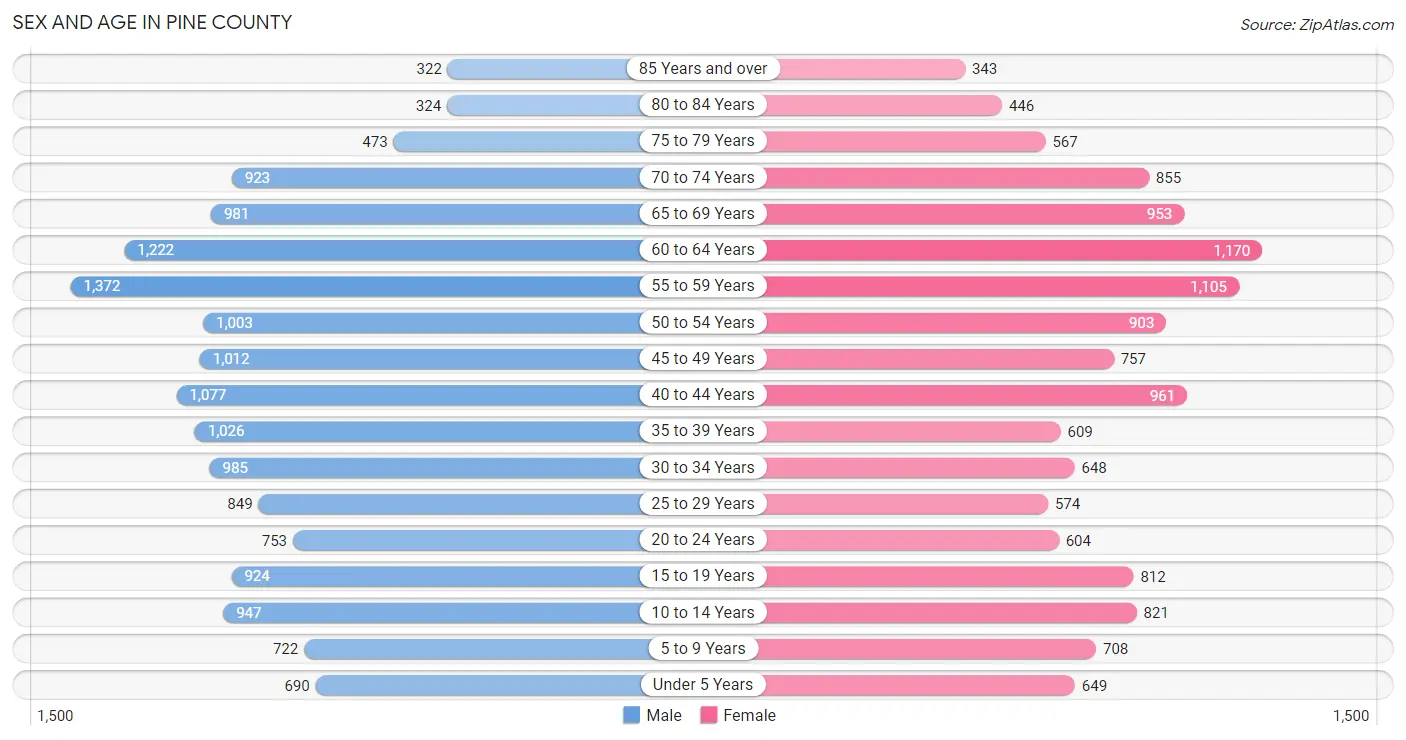
Sex and Age in Pine County
Sex and Age in Pine County
The most populous age groups in Pine County are 55 to 59 Years (1,372 | 8.8%) for men and 60 to 64 Years (1,170 | 8.7%) for women.
| Age Bracket | Male | Female |
| Under 5 Years | 690 (4.4%) | 649 (4.8%) |
| 5 to 9 Years | 722 (4.6%) | 708 (5.2%) |
| 10 to 14 Years | 947 (6.1%) | 821 (6.1%) |
| 15 to 19 Years | 924 (5.9%) | 812 (6.0%) |
| 20 to 24 Years | 753 (4.8%) | 604 (4.5%) |
| 25 to 29 Years | 849 (5.4%) | 574 (4.3%) |
| 30 to 34 Years | 985 (6.3%) | 648 (4.8%) |
| 35 to 39 Years | 1,026 (6.6%) | 609 (4.5%) |
| 40 to 44 Years | 1,077 (6.9%) | 961 (7.1%) |
| 45 to 49 Years | 1,012 (6.5%) | 757 (5.6%) |
| 50 to 54 Years | 1,003 (6.4%) | 903 (6.7%) |
| 55 to 59 Years | 1,372 (8.8%) | 1,105 (8.2%) |
| 60 to 64 Years | 1,222 (7.8%) | 1,170 (8.7%) |
| 65 to 69 Years | 981 (6.3%) | 953 (7.1%) |
| 70 to 74 Years | 923 (5.9%) | 855 (6.3%) |
| 75 to 79 Years | 473 (3.0%) | 567 (4.2%) |
| 80 to 84 Years | 324 (2.1%) | 446 (3.3%) |
| 85 Years and over | 322 (2.1%) | 343 (2.5%) |
| Total | 15,605 (100.0%) | 13,485 (100.0%) |
Families and Households in Pine County
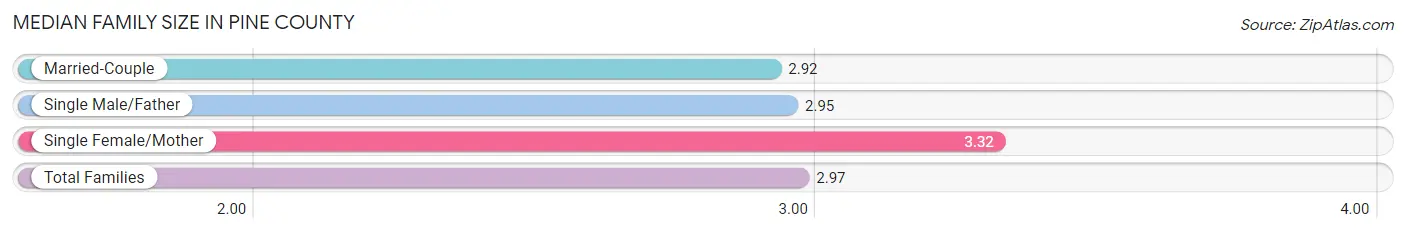
Median Family Size in Pine County
The median family size in Pine County is 2.97 persons per family, with single female/mother families (908 | 12.6%) accounting for the largest median family size of 3.32 persons per family. On the other hand, married-couple families (5,741 | 79.4%) represent the smallest median family size with 2.92 persons per family.
| Family Type | # Families | Family Size |
| Married-Couple | 5,741 (79.4%) | 2.92 |
| Single Male/Father | 584 (8.1%) | 2.95 |
| Single Female/Mother | 908 (12.6%) | 3.32 |
| Total Families | 7,233 (100.0%) | 2.97 |
Median Household Size in Pine County
The median household size in Pine County is 2.43 persons per household, with single female/mother households (908 | 8.0%) accounting for the largest median household size of 3.78 persons per household. non-family households (4,147 | 36.4%) represent the smallest median household size with 1.25 persons per household.

| Household Type | # Households | Household Size |
| Married-Couple | 5,741 (50.4%) | 2.95 |
| Single Male/Father | 584 (5.1%) | 3.58 |
| Single Female/Mother | 908 (8.0%) | 3.78 |
| Non-family | 4,147 (36.4%) | 1.25 |
| Total Households | 11,380 (100.0%) | 2.43 |
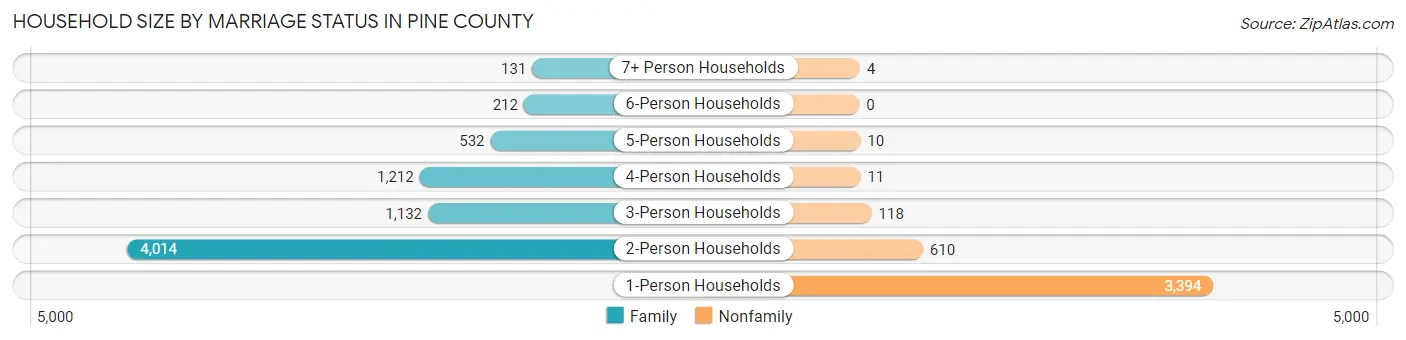
Household Size by Marriage Status in Pine County
Out of a total of 11,380 households in Pine County, 7,233 (63.6%) are family households, while 4,147 (36.4%) are nonfamily households. The most numerous type of family households are 2-person households, comprising 4,014, and the most common type of nonfamily households are 1-person households, comprising 3,394.
| Household Size | Family Households | Nonfamily Households |
| 1-Person Households | - | 3,394 (29.8%) |
| 2-Person Households | 4,014 (35.3%) | 610 (5.4%) |
| 3-Person Households | 1,132 (10.0%) | 118 (1.0%) |
| 4-Person Households | 1,212 (10.6%) | 11 (0.1%) |
| 5-Person Households | 532 (4.7%) | 10 (0.1%) |
| 6-Person Households | 212 (1.9%) | 0 (0.0%) |
| 7+ Person Households | 131 (1.1%) | 4 (0.0%) |
| Total | 7,233 (63.6%) | 4,147 (36.4%) |
Female Fertility in Pine County
Fertility by Age in Pine County
Average fertility rate in Pine County is 47.0 births per 1,000 women. Women in the age bracket of 20 to 34 years have the highest fertility rate with 114.0 births per 1,000 women. Women in the age bracket of 20 to 34 years acount for 86.0% of all women with births.
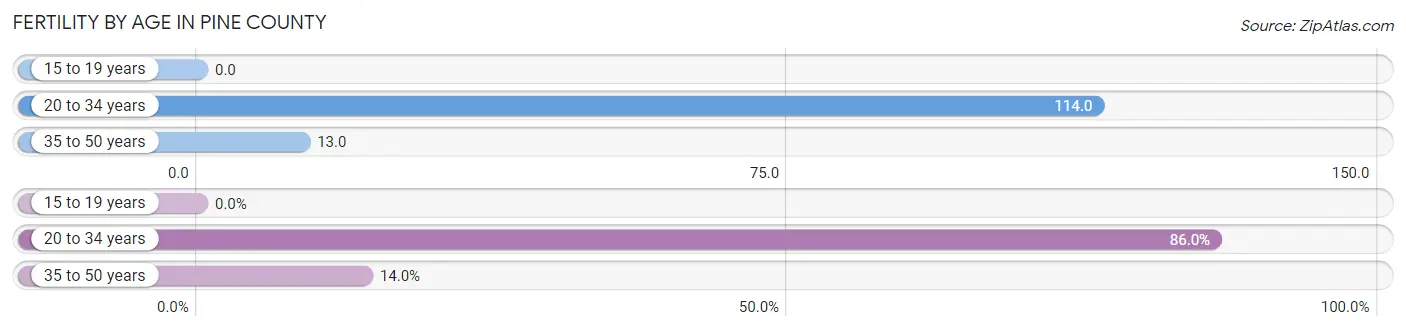
| Age Bracket | Women with Births | Births / 1,000 Women |
| 15 to 19 years | 0 (0.0%) | 0.0 |
| 20 to 34 years | 209 (86.0%) | 114.0 |
| 35 to 50 years | 34 (14.0%) | 13.0 |
| Total | 243 (100.0%) | 47.0 |
Fertility by Age by Marriage Status in Pine County
67.9% of women with births (243) in Pine County are married. The highest percentage of unmarried women with births falls into 35 to 50 years age bracket with 52.9% of them unmarried at the time of birth, while the lowest percentage of unmarried women with births belong to 20 to 34 years age bracket with 28.7% of them unmarried.
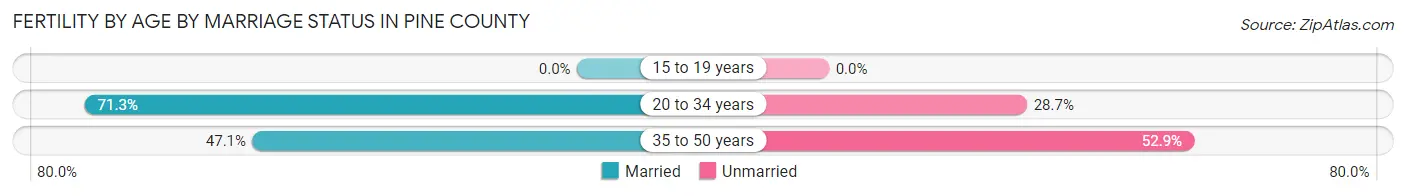
| Age Bracket | Married | Unmarried |
| 15 to 19 years | 0 (0.0%) | 0 (0.0%) |
| 20 to 34 years | 149 (71.3%) | 60 (28.7%) |
| 35 to 50 years | 16 (47.1%) | 18 (52.9%) |
| Total | 165 (67.9%) | 78 (32.1%) |
Fertility by Education in Pine County
Average fertility rate in Pine County is 47.0 births per 1,000 women. Women with the education attainment of college or associate's degree have the highest fertility rate of 57.0 births per 1,000 women, while women with the education attainment of less than high school have the lowest fertility at 21.0 births per 1,000 women. Women with the education attainment of college or associate's degree represent 46.5% of all women with births.
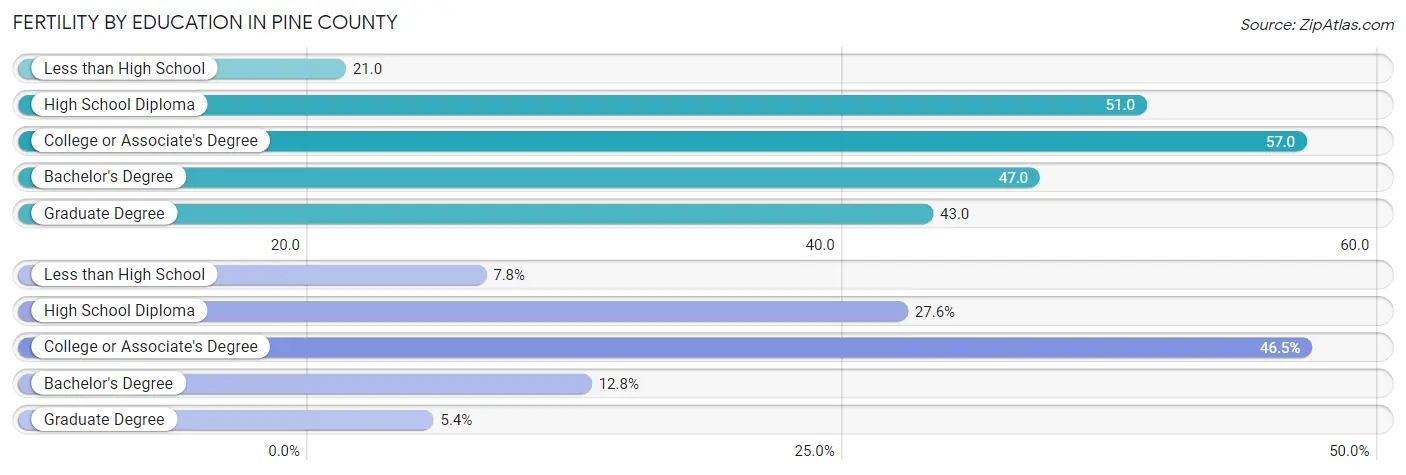
| Educational Attainment | Women with Births | Births / 1,000 Women |
| Less than High School | 19 (7.8%) | 21.0 |
| High School Diploma | 67 (27.6%) | 51.0 |
| College or Associate's Degree | 113 (46.5%) | 57.0 |
| Bachelor's Degree | 31 (12.8%) | 47.0 |
| Graduate Degree | 13 (5.3%) | 43.0 |
| Total | 243 (100.0%) | 47.0 |
Fertility by Education by Marriage Status in Pine County
32.1% of women with births in Pine County are unmarried. Women with the educational attainment of bachelor's degree are most likely to be married with 100.0% of them married at childbirth, while women with the educational attainment of less than high school are least likely to be married with 63.2% of them unmarried at childbirth.

| Educational Attainment | Married | Unmarried |
| Less than High School | 7 (36.8%) | 12 (63.2%) |
| High School Diploma | 49 (73.1%) | 18 (26.9%) |
| College or Associate's Degree | 65 (57.5%) | 48 (42.5%) |
| Bachelor's Degree | 31 (100.0%) | 0 (0.0%) |
| Graduate Degree | 13 (100.0%) | 0 (0.0%) |
| Total | 165 (67.9%) | 78 (32.1%) |
Employment Characteristics in Pine County
Employment by Class of Employer in Pine County
Among the 12,619 employed individuals in Pine County, private company employees (7,809 | 61.9%), local government employees (1,115 | 8.8%), and not-for-profit organizations (990 | 7.9%) make up the most common classes of employment.

| Employer Class | # Employees | % Employees |
| Private Company Employees | 7,809 | 61.9% |
| Self-Employed (Incorporated) | 520 | 4.1% |
| Self-Employed (Not Incorporated) | 878 | 7.0% |
| Not-for-profit Organizations | 990 | 7.9% |
| Local Government Employees | 1,115 | 8.8% |
| State Government Employees | 874 | 6.9% |
| Federal Government Employees | 416 | 3.3% |
| Unpaid Family Workers | 17 | 0.1% |
| Total | 12,619 | 100.0% |
Employment Status by Age in Pine County
According to the labor force statistics for Pine County, out of the total population over 16 years of age (24,177), 56.8% or 13,733 individuals are in the labor force, with 5.8% or 797 of them unemployed. The age group with the highest labor force participation rate is 30 to 34 years, with 79.2% or 1,293 individuals in the labor force. Within the labor force, the 20 to 24 years age range has the highest percentage of unemployed individuals, with 12.1% or 125 of them being unemployed.

| Age Bracket | In Labor Force | Unemployed |
| 16 to 19 Years | 741 (54.5%) | 63 (8.5%) |
| 20 to 24 Years | 1,035 (76.3%) | 125 (12.1%) |
| 25 to 29 Years | 1,106 (77.7%) | 103 (9.3%) |
| 30 to 34 Years | 1,293 (79.2%) | 132 (10.2%) |
| 35 to 44 Years | 2,821 (76.8%) | 116 (4.1%) |
| 45 to 54 Years | 2,841 (77.3%) | 111 (3.9%) |
| 55 to 59 Years | 1,667 (67.3%) | 48 (2.9%) |
| 60 to 64 Years | 1,296 (54.2%) | 45 (3.5%) |
| 65 to 74 Years | 787 (21.2%) | 55 (7.0%) |
| 75 Years and over | 141 (5.7%) | 4 (2.9%) |
| Total | 13,733 (56.8%) | 797 (5.8%) |
Employment Status by Educational Attainment in Pine County
According to labor force statistics for Pine County, 72.2% of individuals (11,027) out of the total population between 25 and 64 years of age (15,273) are in the labor force, with 5.0% or 551 of them being unemployed. The group with the highest labor force participation rate are those with the educational attainment of bachelor's degree or higher, with 85.7% or 1,959 individuals in the labor force. Within the labor force, individuals with less than high school education have the highest percentage of unemployment, with 17.6% or 114 of them being unemployed.

| Educational Attainment | In Labor Force | Unemployed |
| Less than High School | 649 (52.4%) | 218 (17.6%) |
| High School Diploma | 3,919 (64.5%) | 334 (5.5%) |
| College / Associate Degree | 4,499 (79.3%) | 238 (4.2%) |
| Bachelor's Degree or higher | 1,959 (85.7%) | 43 (1.9%) |
| Total | 11,027 (72.2%) | 764 (5.0%) |
Employment Occupations by Sex in Pine County
Management, Business, Science and Arts Occupations
The most common Management, Business, Science and Arts occupations in Pine County are Community & Social Service (1,171 | 9.1%), Management (1,066 | 8.3%), Health Diagnosing & Treating (816 | 6.3%), Education Instruction & Library (728 | 5.6%), and Health Technologists (492 | 3.8%).
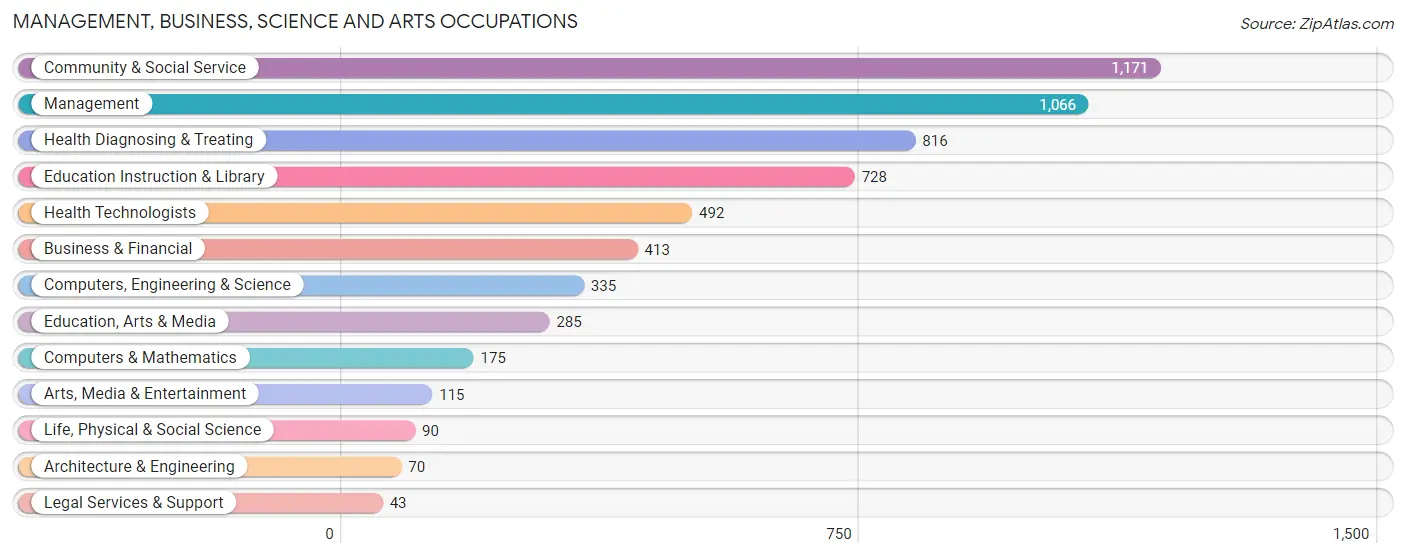
Management, Business, Science and Arts Occupations by Sex
Within the Management, Business, Science and Arts occupations in Pine County, the most male-oriented occupations are Architecture & Engineering (82.9%), Computers, Engineering & Science (70.8%), and Computers & Mathematics (68.0%), while the most female-oriented occupations are Health Technologists (83.9%), Health Diagnosing & Treating (82.5%), and Legal Services & Support (81.4%).

| Occupation | Male | Female |
| Management | 642 (60.2%) | 424 (39.8%) |
| Business & Financial | 130 (31.5%) | 283 (68.5%) |
| Computers, Engineering & Science | 237 (70.8%) | 98 (29.2%) |
| Computers & Mathematics | 119 (68.0%) | 56 (32.0%) |
| Architecture & Engineering | 58 (82.9%) | 12 (17.1%) |
| Life, Physical & Social Science | 60 (66.7%) | 30 (33.3%) |
| Community & Social Service | 306 (26.1%) | 865 (73.9%) |
| Education, Arts & Media | 73 (25.6%) | 212 (74.4%) |
| Legal Services & Support | 8 (18.6%) | 35 (81.4%) |
| Education Instruction & Library | 178 (24.4%) | 550 (75.5%) |
| Arts, Media & Entertainment | 47 (40.9%) | 68 (59.1%) |
| Health Diagnosing & Treating | 143 (17.5%) | 673 (82.5%) |
| Health Technologists | 79 (16.1%) | 413 (83.9%) |
| Total (Category) | 1,458 (38.4%) | 2,343 (61.6%) |
| Total (Overall) | 6,865 (53.1%) | 6,054 (46.9%) |
Services Occupations
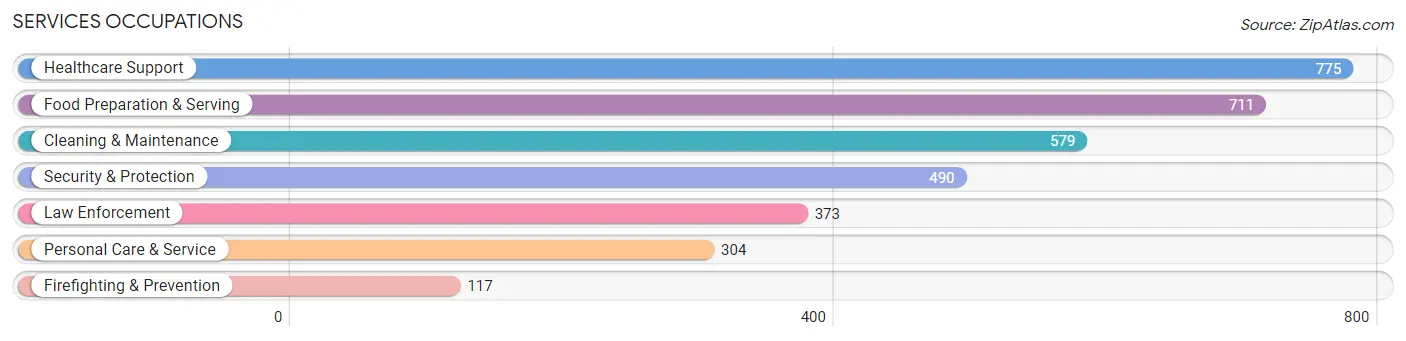
The most common Services occupations in Pine County are Healthcare Support (775 | 6.0%), Food Preparation & Serving (711 | 5.5%), Cleaning & Maintenance (579 | 4.5%), Security & Protection (490 | 3.8%), and Law Enforcement (373 | 2.9%).
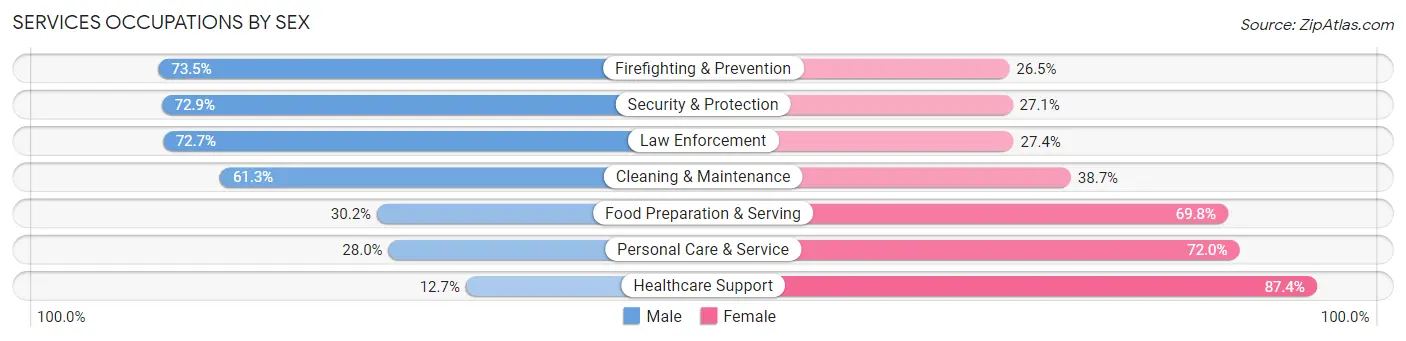
Services Occupations by Sex
Within the Services occupations in Pine County, the most male-oriented occupations are Firefighting & Prevention (73.5%), Security & Protection (72.9%), and Law Enforcement (72.7%), while the most female-oriented occupations are Healthcare Support (87.4%), Personal Care & Service (72.0%), and Food Preparation & Serving (69.8%).
| Occupation | Male | Female |
| Healthcare Support | 98 (12.7%) | 677 (87.4%) |
| Security & Protection | 357 (72.9%) | 133 (27.1%) |
| Firefighting & Prevention | 86 (73.5%) | 31 (26.5%) |
| Law Enforcement | 271 (72.7%) | 102 (27.4%) |
| Food Preparation & Serving | 215 (30.2%) | 496 (69.8%) |
| Cleaning & Maintenance | 355 (61.3%) | 224 (38.7%) |
| Personal Care & Service | 85 (28.0%) | 219 (72.0%) |
| Total (Category) | 1,110 (38.8%) | 1,749 (61.2%) |
| Total (Overall) | 6,865 (53.1%) | 6,054 (46.9%) |
Sales and Office Occupations
The most common Sales and Office occupations in Pine County are Office & Administration (1,204 | 9.3%), and Sales & Related (1,004 | 7.8%).

Sales and Office Occupations by Sex

| Occupation | Male | Female |
| Sales & Related | 512 (51.0%) | 492 (49.0%) |
| Office & Administration | 233 (19.4%) | 971 (80.6%) |
| Total (Category) | 745 (33.7%) | 1,463 (66.3%) |
| Total (Overall) | 6,865 (53.1%) | 6,054 (46.9%) |
Natural Resources, Construction and Maintenance Occupations
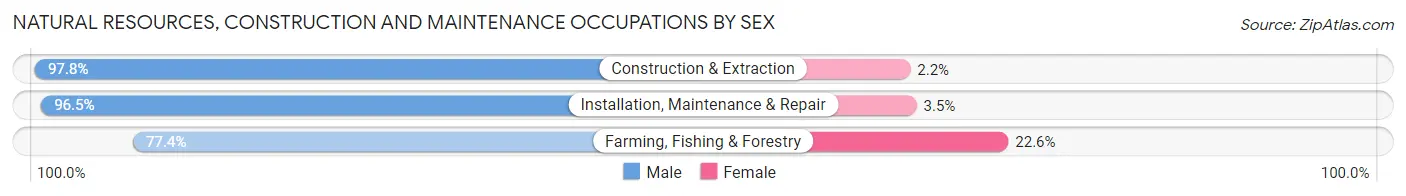
The most common Natural Resources, Construction and Maintenance occupations in Pine County are Construction & Extraction (1,151 | 8.9%), Installation, Maintenance & Repair (519 | 4.0%), and Farming, Fishing & Forestry (164 | 1.3%).

Natural Resources, Construction and Maintenance Occupations by Sex
| Occupation | Male | Female |
| Farming, Fishing & Forestry | 127 (77.4%) | 37 (22.6%) |
| Construction & Extraction | 1,126 (97.8%) | 25 (2.2%) |
| Installation, Maintenance & Repair | 501 (96.5%) | 18 (3.5%) |
| Total (Category) | 1,754 (95.6%) | 80 (4.4%) |
| Total (Overall) | 6,865 (53.1%) | 6,054 (46.9%) |
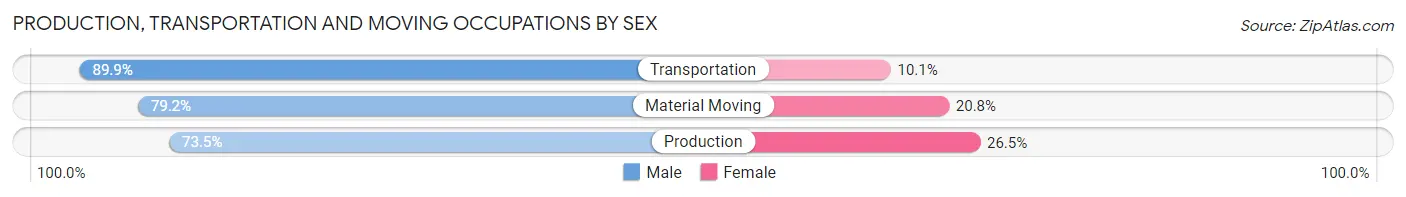
Production, Transportation and Moving Occupations
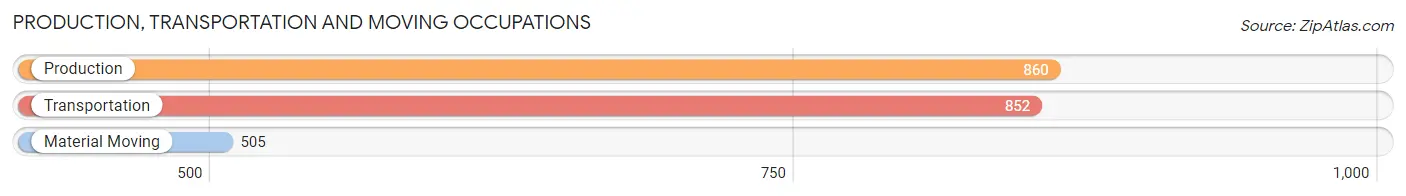
The most common Production, Transportation and Moving occupations in Pine County are Production (860 | 6.7%), Transportation (852 | 6.6%), and Material Moving (505 | 3.9%).
Production, Transportation and Moving Occupations by Sex
| Occupation | Male | Female |
| Production | 632 (73.5%) | 228 (26.5%) |
| Transportation | 766 (89.9%) | 86 (10.1%) |
| Material Moving | 400 (79.2%) | 105 (20.8%) |
| Total (Category) | 1,798 (81.1%) | 419 (18.9%) |
| Total (Overall) | 6,865 (53.1%) | 6,054 (46.9%) |
Employment Industries by Sex in Pine County
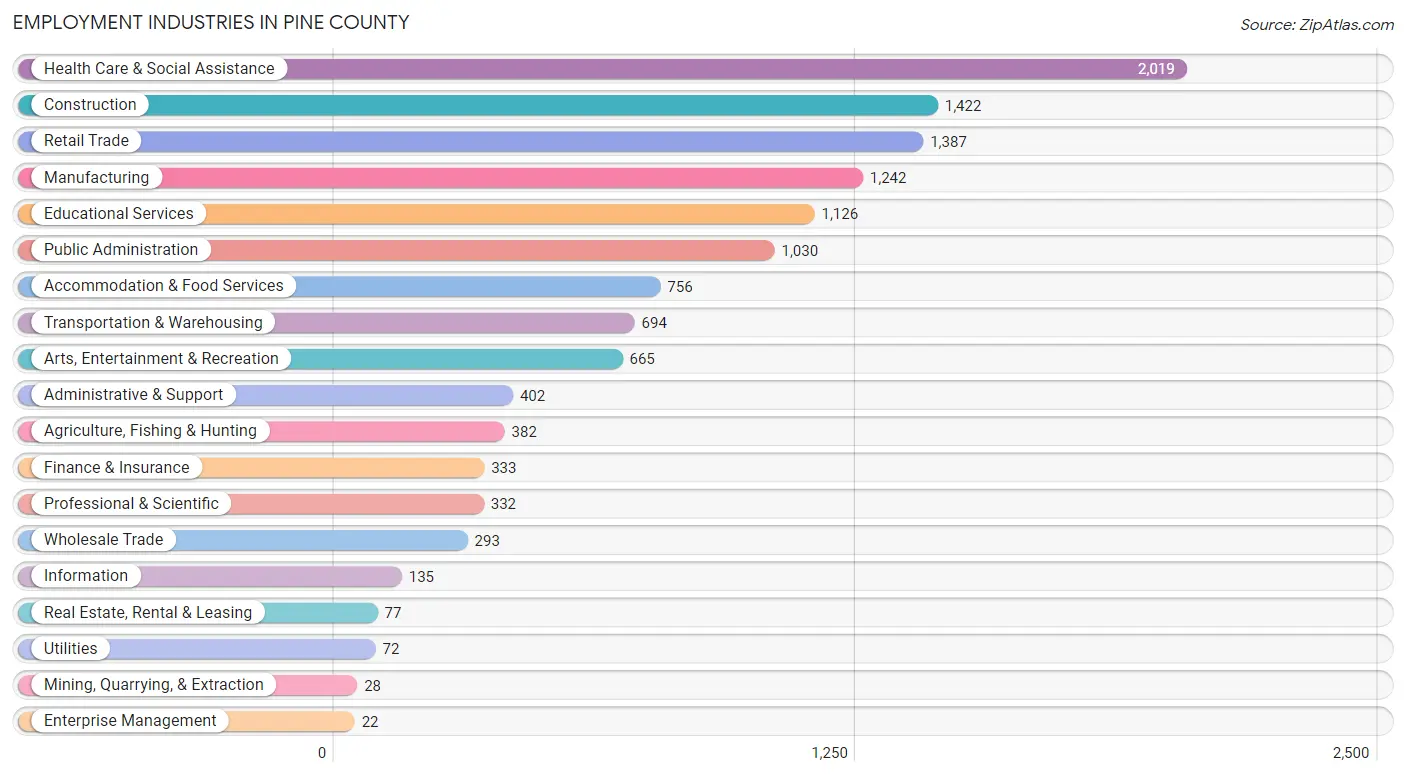
Employment Industries in Pine County
The major employment industries in Pine County include Health Care & Social Assistance (2,019 | 15.6%), Construction (1,422 | 11.0%), Retail Trade (1,387 | 10.7%), Manufacturing (1,242 | 9.6%), and Educational Services (1,126 | 8.7%).
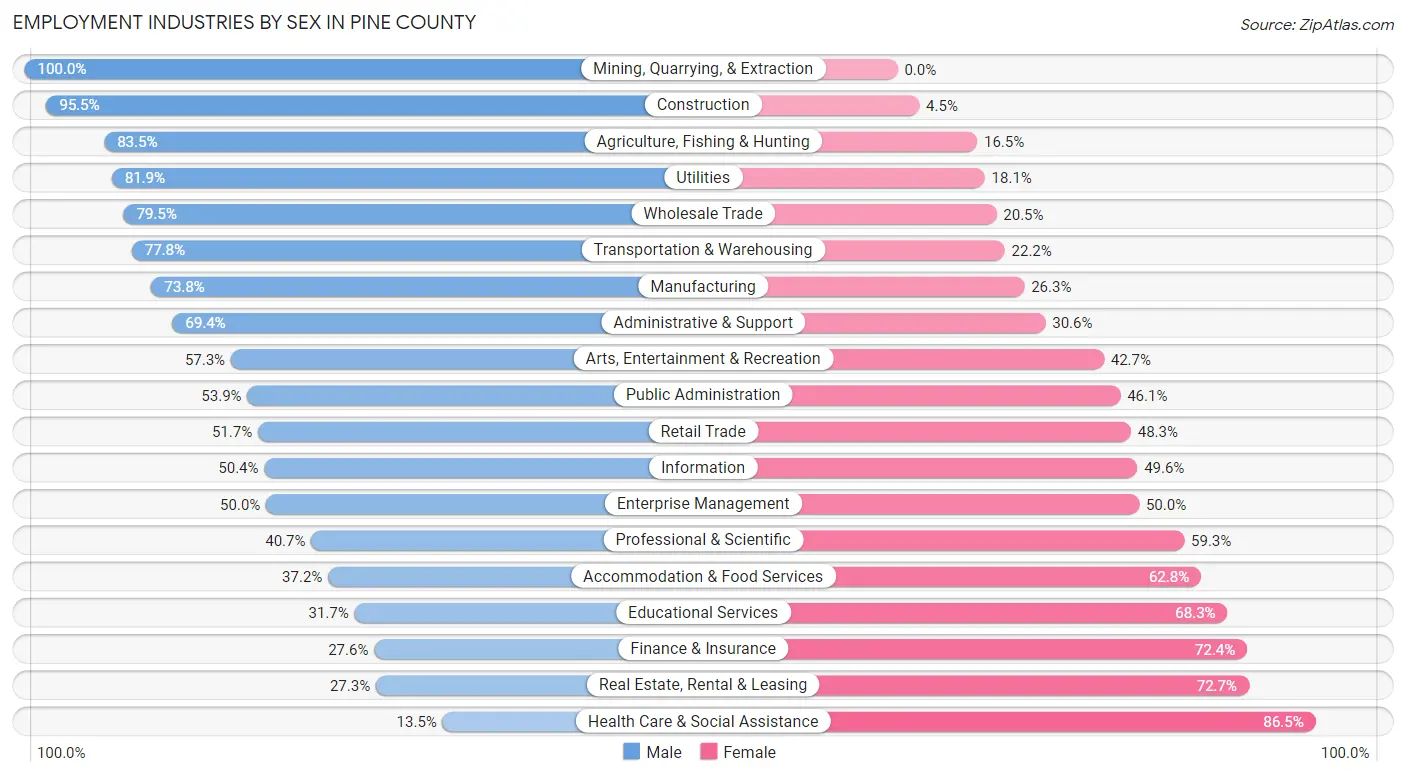
Employment Industries by Sex in Pine County
The Pine County industries that see more men than women are Mining, Quarrying, & Extraction (100.0%), Construction (95.5%), and Agriculture, Fishing & Hunting (83.5%), whereas the industries that tend to have a higher number of women are Health Care & Social Assistance (86.5%), Real Estate, Rental & Leasing (72.7%), and Finance & Insurance (72.4%).
| Industry | Male | Female |
| Agriculture, Fishing & Hunting | 319 (83.5%) | 63 (16.5%) |
| Mining, Quarrying, & Extraction | 28 (100.0%) | 0 (0.0%) |
| Construction | 1,358 (95.5%) | 64 (4.5%) |
| Manufacturing | 916 (73.8%) | 326 (26.3%) |
| Wholesale Trade | 233 (79.5%) | 60 (20.5%) |
| Retail Trade | 717 (51.7%) | 670 (48.3%) |
| Transportation & Warehousing | 540 (77.8%) | 154 (22.2%) |
| Utilities | 59 (81.9%) | 13 (18.1%) |
| Information | 68 (50.4%) | 67 (49.6%) |
| Finance & Insurance | 92 (27.6%) | 241 (72.4%) |
| Real Estate, Rental & Leasing | 21 (27.3%) | 56 (72.7%) |
| Professional & Scientific | 135 (40.7%) | 197 (59.3%) |
| Enterprise Management | 11 (50.0%) | 11 (50.0%) |
| Administrative & Support | 279 (69.4%) | 123 (30.6%) |
| Educational Services | 357 (31.7%) | 769 (68.3%) |
| Health Care & Social Assistance | 272 (13.5%) | 1,747 (86.5%) |
| Arts, Entertainment & Recreation | 381 (57.3%) | 284 (42.7%) |
| Accommodation & Food Services | 281 (37.2%) | 475 (62.8%) |
| Public Administration | 555 (53.9%) | 475 (46.1%) |
| Total | 6,865 (53.1%) | 6,054 (46.9%) |
Education in Pine County
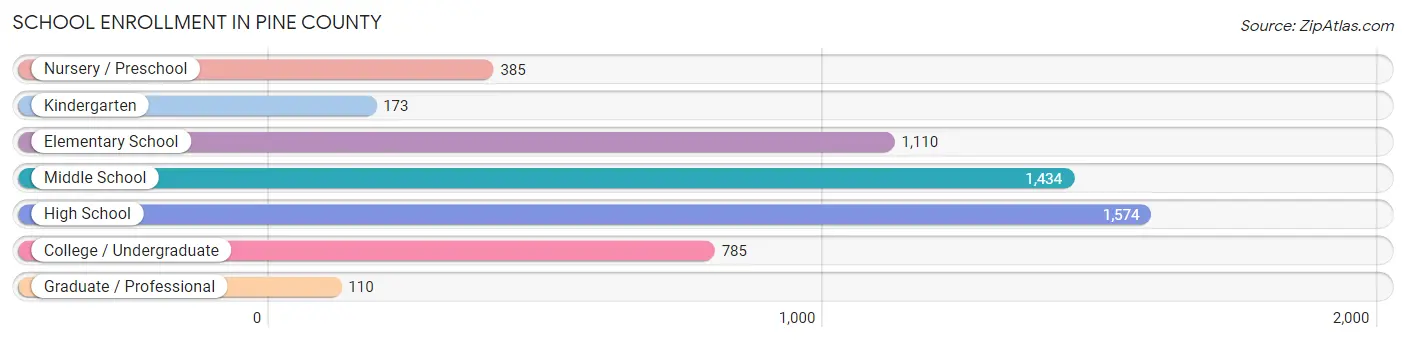
School Enrollment in Pine County
The most common levels of schooling among the 5,571 students in Pine County are high school (1,574 | 28.2%), middle school (1,434 | 25.7%), and elementary school (1,110 | 19.9%).
| School Level | # Students | % Students |
| Nursery / Preschool | 385 | 6.9% |
| Kindergarten | 173 | 3.1% |
| Elementary School | 1,110 | 19.9% |
| Middle School | 1,434 | 25.7% |
| High School | 1,574 | 28.2% |
| College / Undergraduate | 785 | 14.1% |
| Graduate / Professional | 110 | 2.0% |
| Total | 5,571 | 100.0% |
School Enrollment by Age by Funding Source in Pine County
Out of a total of 5,571 students who are enrolled in schools in Pine County, 641 (11.5%) attend a private institution, while the remaining 4,930 (88.5%) are enrolled in public schools. The age group of 3 to 4 year olds has the highest likelihood of being enrolled in private schools, with 94 (44.3% in the age bracket) enrolled. Conversely, the age group of 15 to 17 year olds has the lowest likelihood of being enrolled in a private school, with 1,000 (94.5% in the age bracket) attending a public institution.
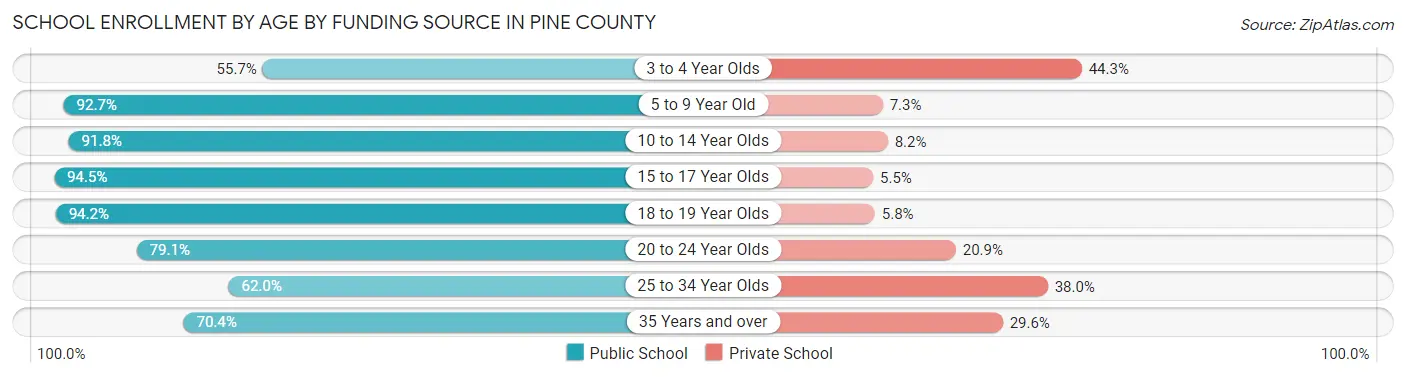
| Age Bracket | Public School | Private School |
| 3 to 4 Year Olds | 118 (55.7%) | 94 (44.3%) |
| 5 to 9 Year Old | 1,238 (92.7%) | 97 (7.3%) |
| 10 to 14 Year Olds | 1,577 (91.8%) | 141 (8.2%) |
| 15 to 17 Year Olds | 1,000 (94.5%) | 58 (5.5%) |
| 18 to 19 Year Olds | 422 (94.2%) | 26 (5.8%) |
| 20 to 24 Year Olds | 269 (79.1%) | 71 (20.9%) |
| 25 to 34 Year Olds | 124 (62.0%) | 76 (38.0%) |
| 35 Years and over | 183 (70.4%) | 77 (29.6%) |
| Total | 4,930 (88.5%) | 641 (11.5%) |
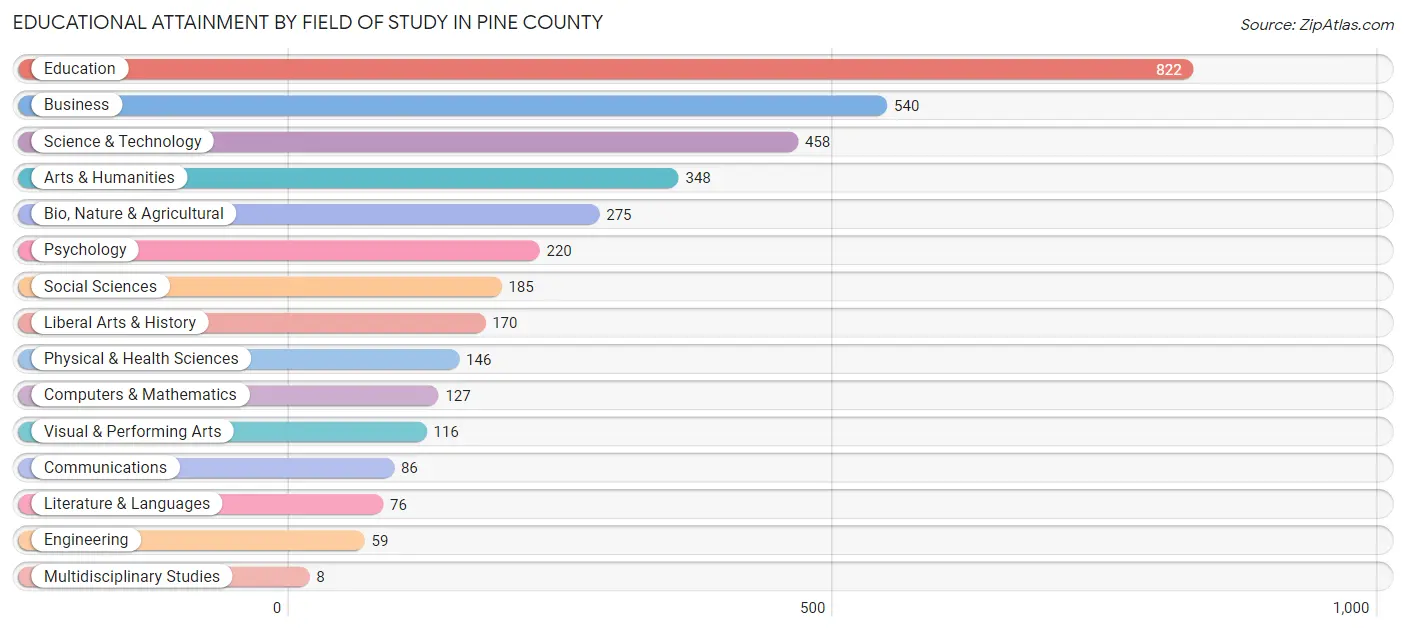
Educational Attainment by Field of Study in Pine County
Education (822 | 22.6%), business (540 | 14.8%), science & technology (458 | 12.6%), arts & humanities (348 | 9.6%), and bio, nature & agricultural (275 | 7.6%) are the most common fields of study among 3,636 individuals in Pine County who have obtained a bachelor's degree or higher.
| Field of Study | # Graduates | % Graduates |
| Computers & Mathematics | 127 | 3.5% |
| Bio, Nature & Agricultural | 275 | 7.6% |
| Physical & Health Sciences | 146 | 4.0% |
| Psychology | 220 | 6.0% |
| Social Sciences | 185 | 5.1% |
| Engineering | 59 | 1.6% |
| Multidisciplinary Studies | 8 | 0.2% |
| Science & Technology | 458 | 12.6% |
| Business | 540 | 14.8% |
| Education | 822 | 22.6% |
| Literature & Languages | 76 | 2.1% |
| Liberal Arts & History | 170 | 4.7% |
| Visual & Performing Arts | 116 | 3.2% |
| Communications | 86 | 2.4% |
| Arts & Humanities | 348 | 9.6% |
| Total | 3,636 | 100.0% |
Transportation & Commute in Pine County
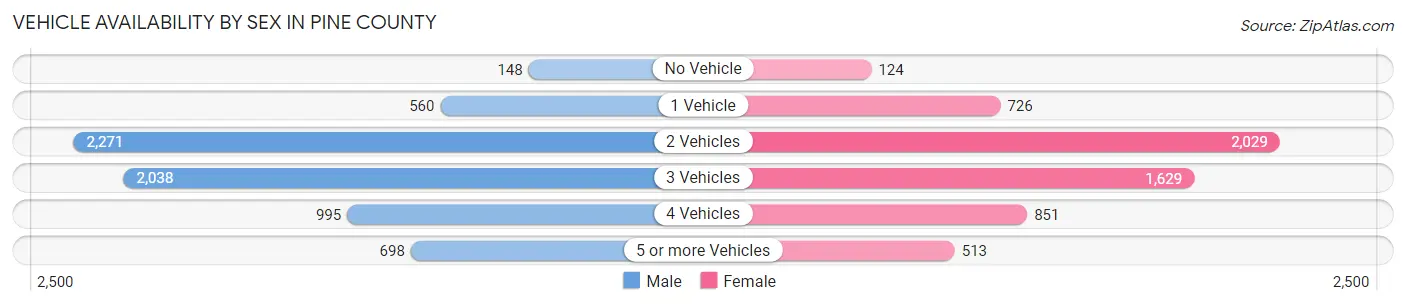
Vehicle Availability by Sex in Pine County
The most prevalent vehicle ownership categories in Pine County are males with 2 vehicles (2,271, accounting for 33.9%) and females with 2 vehicles (2,029, making up 38.7%).
| Vehicles Available | Male | Female |
| No Vehicle | 148 (2.2%) | 124 (2.1%) |
| 1 Vehicle | 560 (8.4%) | 726 (12.4%) |
| 2 Vehicles | 2,271 (33.9%) | 2,029 (34.5%) |
| 3 Vehicles | 2,038 (30.4%) | 1,629 (27.7%) |
| 4 Vehicles | 995 (14.8%) | 851 (14.5%) |
| 5 or more Vehicles | 698 (10.4%) | 513 (8.7%) |
| Total | 6,710 (100.0%) | 5,872 (100.0%) |
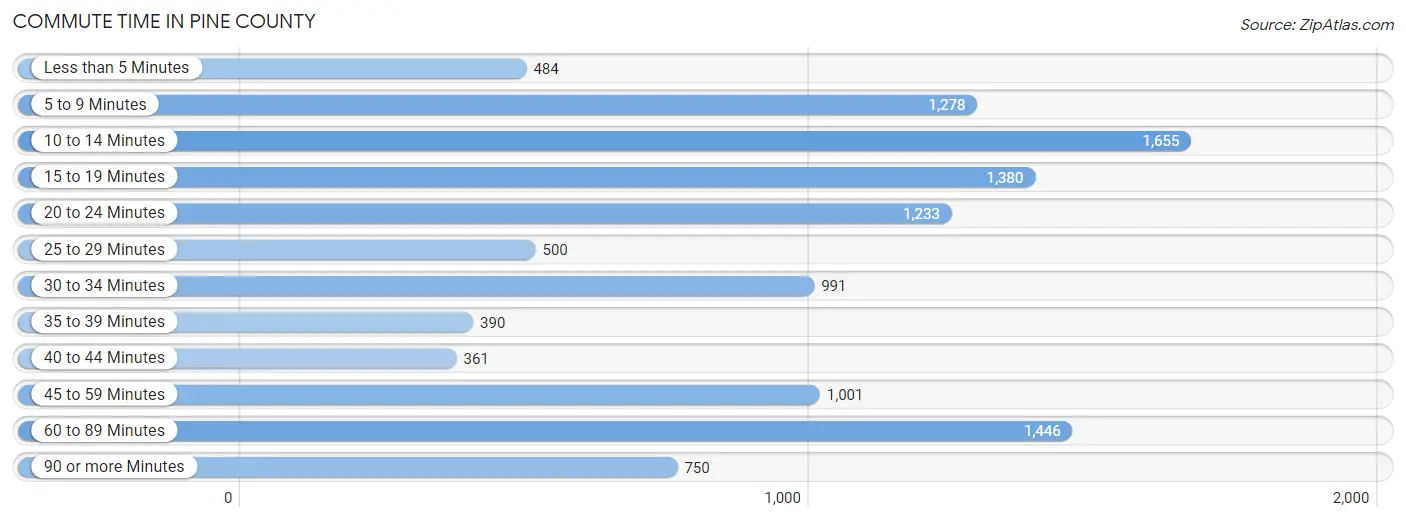
Commute Time in Pine County
The most frequently occuring commute durations in Pine County are 10 to 14 minutes (1,655 commuters, 14.4%), 60 to 89 minutes (1,446 commuters, 12.6%), and 15 to 19 minutes (1,380 commuters, 12.0%).
| Commute Time | # Commuters | % Commuters |
| Less than 5 Minutes | 484 | 4.2% |
| 5 to 9 Minutes | 1,278 | 11.1% |
| 10 to 14 Minutes | 1,655 | 14.4% |
| 15 to 19 Minutes | 1,380 | 12.0% |
| 20 to 24 Minutes | 1,233 | 10.7% |
| 25 to 29 Minutes | 500 | 4.4% |
| 30 to 34 Minutes | 991 | 8.6% |
| 35 to 39 Minutes | 390 | 3.4% |
| 40 to 44 Minutes | 361 | 3.2% |
| 45 to 59 Minutes | 1,001 | 8.7% |
| 60 to 89 Minutes | 1,446 | 12.6% |
| 90 or more Minutes | 750 | 6.5% |
Commute Time by Sex in Pine County
The most common commute times in Pine County are 60 to 89 minutes (973 commuters, 15.5%) for males and 10 to 14 minutes (941 commuters, 18.1%) for females.
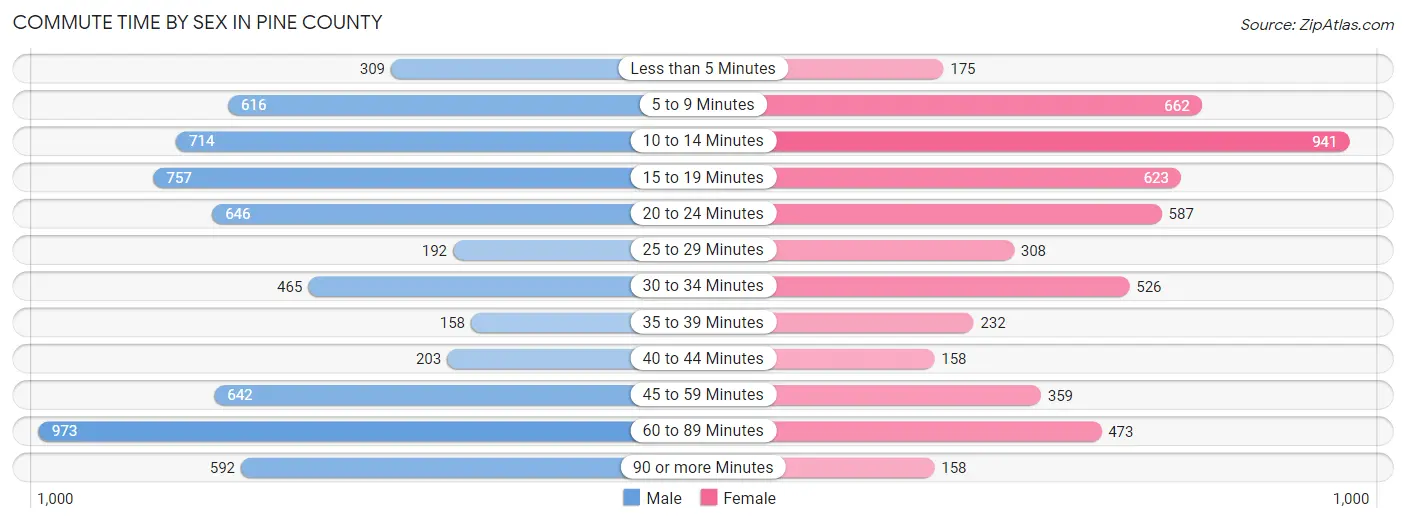
| Commute Time | Male | Female |
| Less than 5 Minutes | 309 (4.9%) | 175 (3.4%) |
| 5 to 9 Minutes | 616 (9.8%) | 662 (12.7%) |
| 10 to 14 Minutes | 714 (11.4%) | 941 (18.1%) |
| 15 to 19 Minutes | 757 (12.1%) | 623 (12.0%) |
| 20 to 24 Minutes | 646 (10.3%) | 587 (11.3%) |
| 25 to 29 Minutes | 192 (3.1%) | 308 (5.9%) |
| 30 to 34 Minutes | 465 (7.4%) | 526 (10.1%) |
| 35 to 39 Minutes | 158 (2.5%) | 232 (4.5%) |
| 40 to 44 Minutes | 203 (3.2%) | 158 (3.0%) |
| 45 to 59 Minutes | 642 (10.2%) | 359 (6.9%) |
| 60 to 89 Minutes | 973 (15.5%) | 473 (9.1%) |
| 90 or more Minutes | 592 (9.5%) | 158 (3.0%) |
Time of Departure to Work by Sex in Pine County
The most frequent times of departure to work in Pine County are 7:00 AM to 7:29 AM (829, 13.2%) for males and 7:00 AM to 7:29 AM (903, 17.4%) for females.
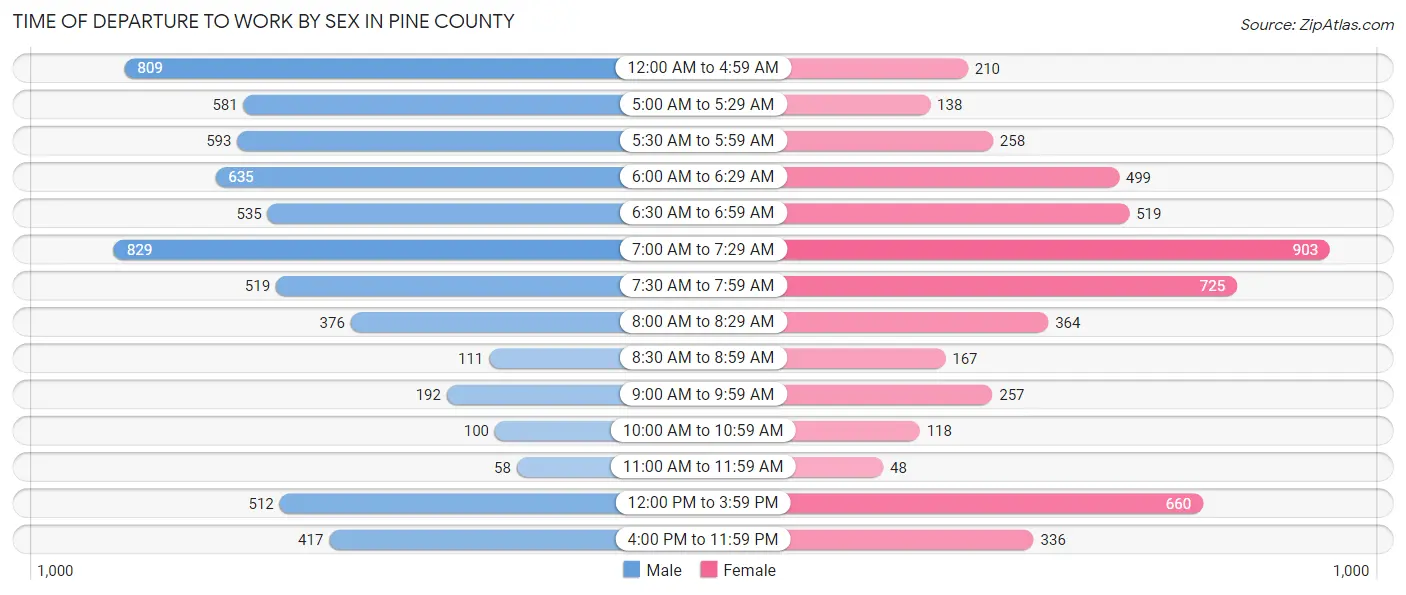
| Time of Departure | Male | Female |
| 12:00 AM to 4:59 AM | 809 (12.9%) | 210 (4.0%) |
| 5:00 AM to 5:29 AM | 581 (9.3%) | 138 (2.6%) |
| 5:30 AM to 5:59 AM | 593 (9.5%) | 258 (5.0%) |
| 6:00 AM to 6:29 AM | 635 (10.1%) | 499 (9.6%) |
| 6:30 AM to 6:59 AM | 535 (8.5%) | 519 (10.0%) |
| 7:00 AM to 7:29 AM | 829 (13.2%) | 903 (17.4%) |
| 7:30 AM to 7:59 AM | 519 (8.3%) | 725 (13.9%) |
| 8:00 AM to 8:29 AM | 376 (6.0%) | 364 (7.0%) |
| 8:30 AM to 8:59 AM | 111 (1.8%) | 167 (3.2%) |
| 9:00 AM to 9:59 AM | 192 (3.1%) | 257 (4.9%) |
| 10:00 AM to 10:59 AM | 100 (1.6%) | 118 (2.3%) |
| 11:00 AM to 11:59 AM | 58 (0.9%) | 48 (0.9%) |
| 12:00 PM to 3:59 PM | 512 (8.2%) | 660 (12.7%) |
| 4:00 PM to 11:59 PM | 417 (6.7%) | 336 (6.5%) |
| Total | 6,267 (100.0%) | 5,202 (100.0%) |
Housing Occupancy in Pine County
Occupancy by Ownership in Pine County
Of the total 11,380 dwellings in Pine County, owner-occupied units account for 9,518 (83.6%), while renter-occupied units make up 1,862 (16.4%).
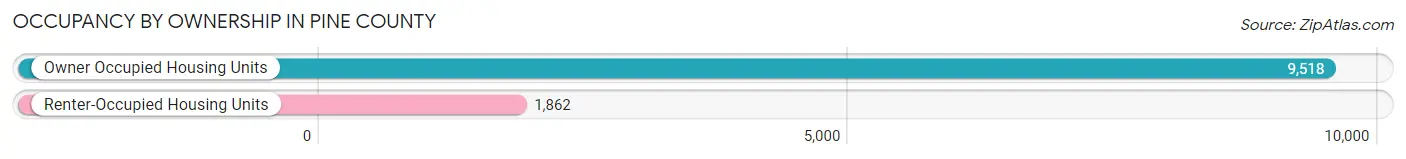
| Occupancy | # Housing Units | % Housing Units |
| Owner Occupied Housing Units | 9,518 | 83.6% |
| Renter-Occupied Housing Units | 1,862 | 16.4% |
| Total Occupied Housing Units | 11,380 | 100.0% |
Occupancy by Household Size in Pine County
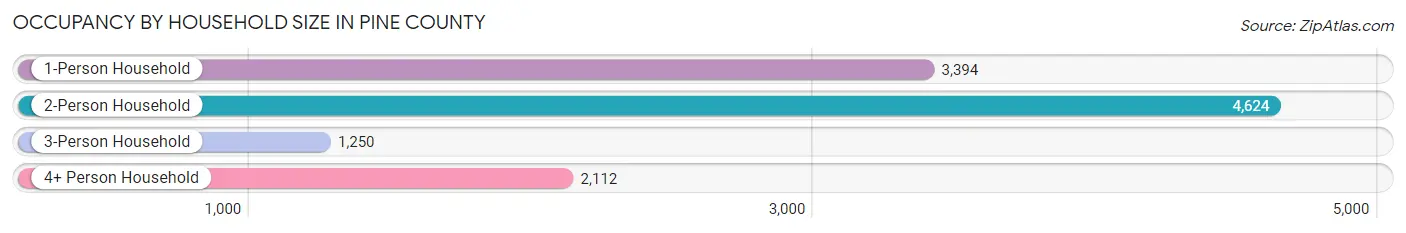
| Household Size | # Housing Units | % Housing Units |
| 1-Person Household | 3,394 | 29.8% |
| 2-Person Household | 4,624 | 40.6% |
| 3-Person Household | 1,250 | 11.0% |
| 4+ Person Household | 2,112 | 18.6% |
| Total Housing Units | 11,380 | 100.0% |
Occupancy by Ownership by Household Size in Pine County

| Household Size | Owner-occupied | Renter-occupied |
| 1-Person Household | 2,415 (71.2%) | 979 (28.8%) |
| 2-Person Household | 4,142 (89.6%) | 482 (10.4%) |
| 3-Person Household | 1,041 (83.3%) | 209 (16.7%) |
| 4+ Person Household | 1,920 (90.9%) | 192 (9.1%) |
| Total Housing Units | 9,518 (83.6%) | 1,862 (16.4%) |
Occupancy by Educational Attainment in Pine County
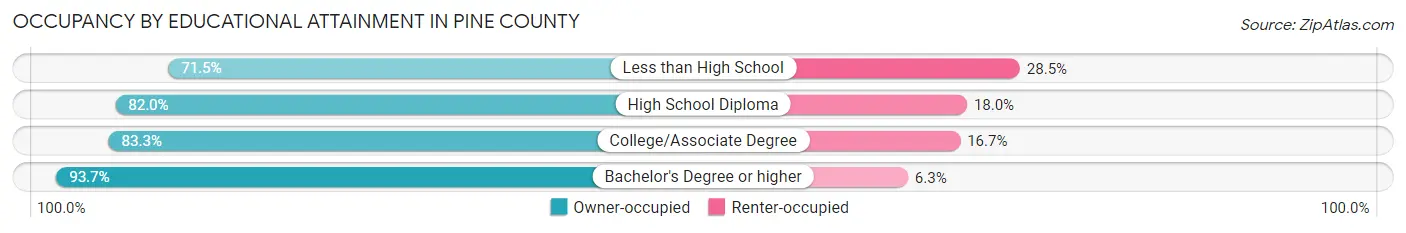
| Household Size | Owner-occupied | Renter-occupied |
| Less than High School | 705 (71.5%) | 281 (28.5%) |
| High School Diploma | 3,477 (82.0%) | 763 (18.0%) |
| College/Associate Degree | 3,458 (83.3%) | 692 (16.7%) |
| Bachelor's Degree or higher | 1,878 (93.7%) | 126 (6.3%) |
Occupancy by Age of Householder in Pine County
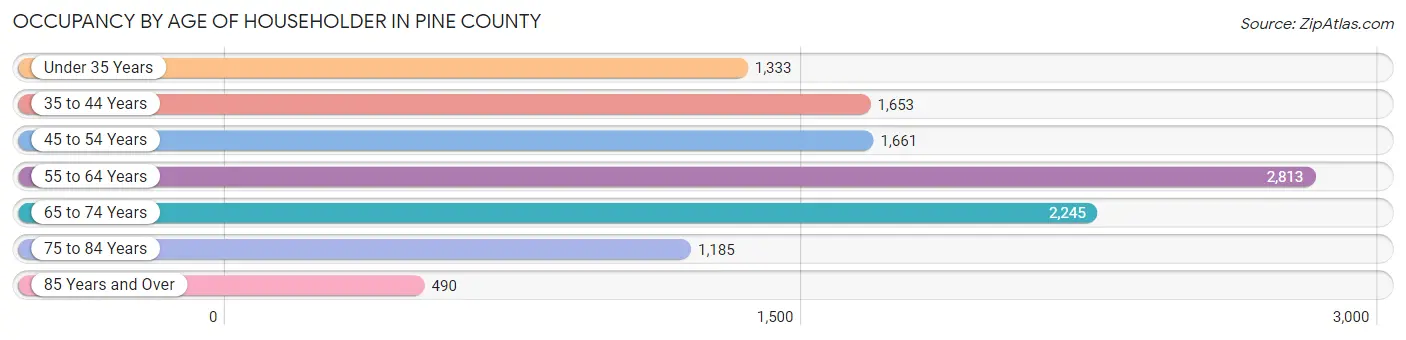
| Age Bracket | # Households | % Households |
| Under 35 Years | 1,333 | 11.7% |
| 35 to 44 Years | 1,653 | 14.5% |
| 45 to 54 Years | 1,661 | 14.6% |
| 55 to 64 Years | 2,813 | 24.7% |
| 65 to 74 Years | 2,245 | 19.7% |
| 75 to 84 Years | 1,185 | 10.4% |
| 85 Years and Over | 490 | 4.3% |
| Total | 11,380 | 100.0% |
Housing Finances in Pine County
Median Income by Occupancy in Pine County

| Occupancy Type | # Households | Median Income |
| Owner-Occupied | 9,518 (83.6%) | $72,216 |
| Renter-Occupied | 1,862 (16.4%) | $29,593 |
| Average | 11,380 (100.0%) | $65,059 |
Occupancy by Householder Income Bracket in Pine County
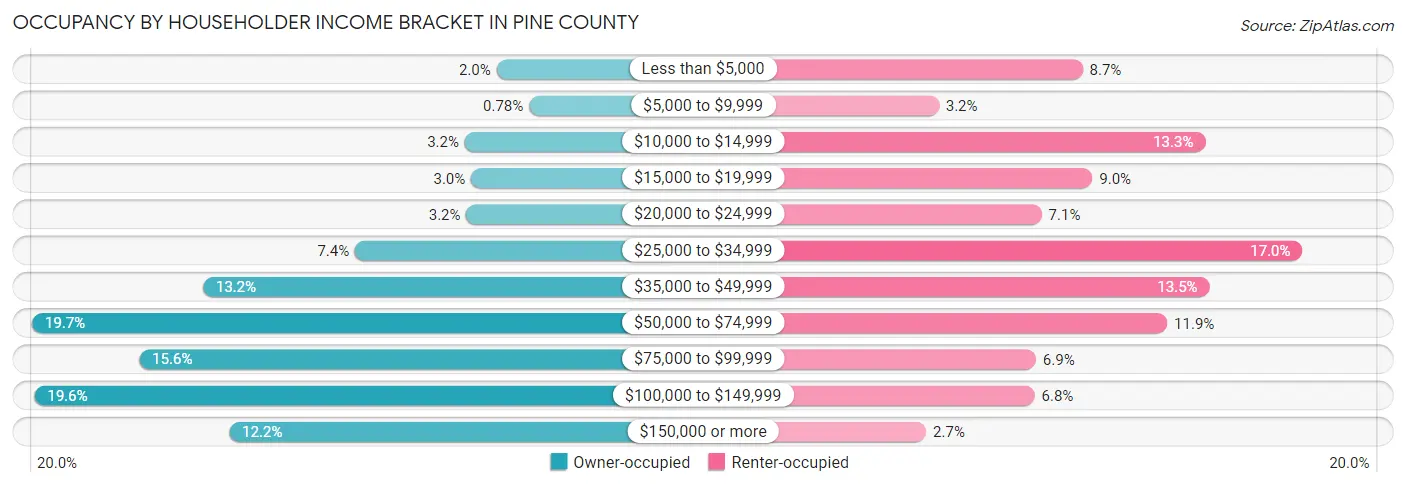
| Income Bracket | Owner-occupied | Renter-occupied |
| Less than $5,000 | 192 (2.0%) | 161 (8.6%) |
| $5,000 to $9,999 | 74 (0.8%) | 59 (3.2%) |
| $10,000 to $14,999 | 307 (3.2%) | 248 (13.3%) |
| $15,000 to $19,999 | 285 (3.0%) | 168 (9.0%) |
| $20,000 to $24,999 | 302 (3.2%) | 132 (7.1%) |
| $25,000 to $34,999 | 705 (7.4%) | 317 (17.0%) |
| $35,000 to $49,999 | 1,257 (13.2%) | 251 (13.5%) |
| $50,000 to $74,999 | 1,877 (19.7%) | 221 (11.9%) |
| $75,000 to $99,999 | 1,489 (15.6%) | 128 (6.9%) |
| $100,000 to $149,999 | 1,868 (19.6%) | 127 (6.8%) |
| $150,000 or more | 1,162 (12.2%) | 50 (2.7%) |
| Total | 9,518 (100.0%) | 1,862 (100.0%) |
Monthly Housing Cost Tiers in Pine County

| Monthly Cost | Owner-occupied | Renter-occupied |
| Less than $300 | 532 (5.6%) | 168 (9.0%) |
| $300 to $499 | 1,187 (12.5%) | 195 (10.5%) |
| $500 to $799 | 2,041 (21.4%) | 349 (18.7%) |
| $800 to $999 | 1,017 (10.7%) | 320 (17.2%) |
| $1,000 to $1,499 | 2,069 (21.7%) | 477 (25.6%) |
| $1,500 to $1,999 | 1,450 (15.2%) | 84 (4.5%) |
| $2,000 to $2,499 | 717 (7.5%) | 22 (1.2%) |
| $2,500 to $2,999 | 278 (2.9%) | 0 (0.0%) |
| $3,000 or more | 227 (2.4%) | 2 (0.1%) |
| Total | 9,518 (100.0%) | 1,862 (100.0%) |
Physical Housing Characteristics in Pine County
Housing Structures in Pine County
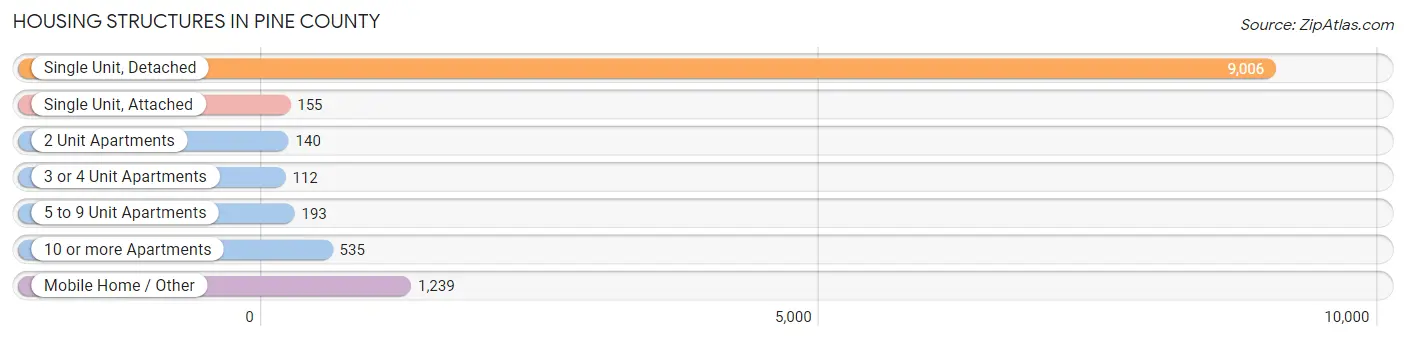
| Structure Type | # Housing Units | % Housing Units |
| Single Unit, Detached | 9,006 | 79.1% |
| Single Unit, Attached | 155 | 1.4% |
| 2 Unit Apartments | 140 | 1.2% |
| 3 or 4 Unit Apartments | 112 | 1.0% |
| 5 to 9 Unit Apartments | 193 | 1.7% |
| 10 or more Apartments | 535 | 4.7% |
| Mobile Home / Other | 1,239 | 10.9% |
| Total | 11,380 | 100.0% |
Housing Structures by Occupancy in Pine County
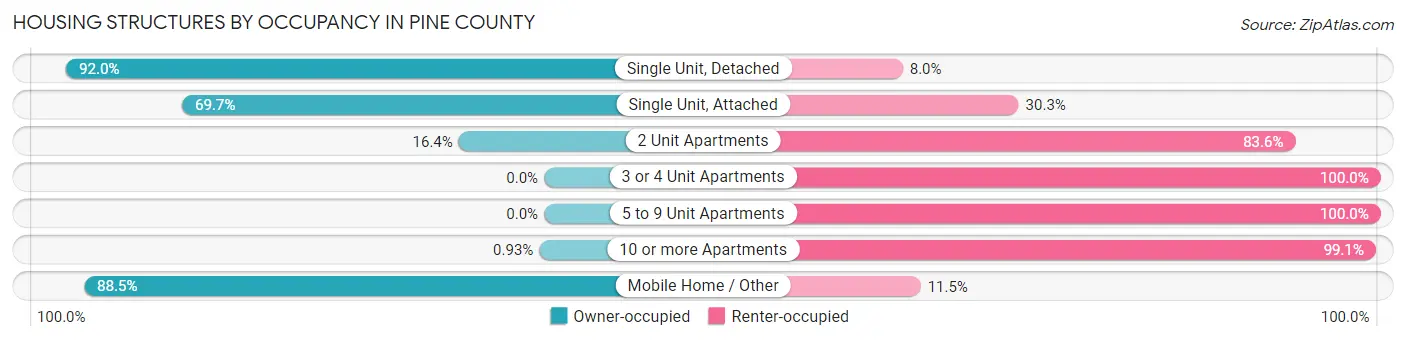
| Structure Type | Owner-occupied | Renter-occupied |
| Single Unit, Detached | 8,285 (92.0%) | 721 (8.0%) |
| Single Unit, Attached | 108 (69.7%) | 47 (30.3%) |
| 2 Unit Apartments | 23 (16.4%) | 117 (83.6%) |
| 3 or 4 Unit Apartments | 0 (0.0%) | 112 (100.0%) |
| 5 to 9 Unit Apartments | 0 (0.0%) | 193 (100.0%) |
| 10 or more Apartments | 5 (0.9%) | 530 (99.1%) |
| Mobile Home / Other | 1,097 (88.5%) | 142 (11.5%) |
| Total | 9,518 (83.6%) | 1,862 (16.4%) |
Housing Structures by Number of Rooms in Pine County
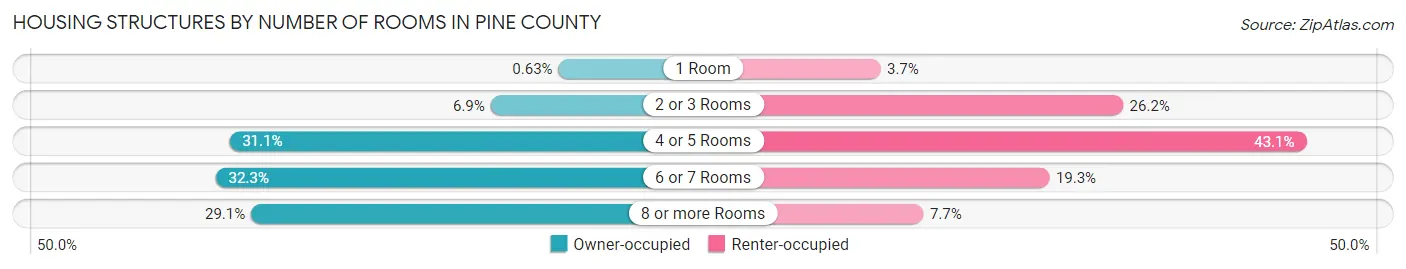
| Number of Rooms | Owner-occupied | Renter-occupied |
| 1 Room | 60 (0.6%) | 69 (3.7%) |
| 2 or 3 Rooms | 657 (6.9%) | 487 (26.2%) |
| 4 or 5 Rooms | 2,957 (31.1%) | 803 (43.1%) |
| 6 or 7 Rooms | 3,078 (32.3%) | 360 (19.3%) |
| 8 or more Rooms | 2,766 (29.1%) | 143 (7.7%) |
| Total | 9,518 (100.0%) | 1,862 (100.0%) |
Housing Structure by Heating Type in Pine County
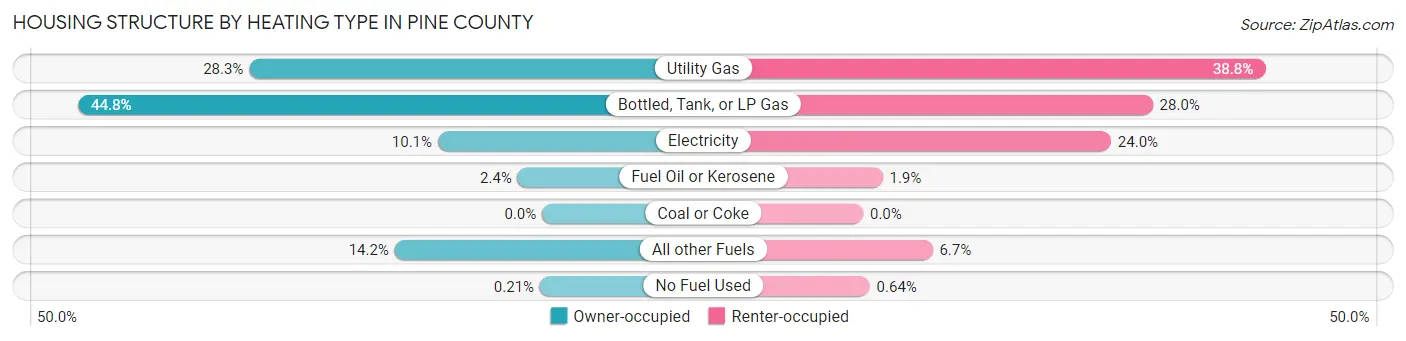
| Heating Type | Owner-occupied | Renter-occupied |
| Utility Gas | 2,694 (28.3%) | 723 (38.8%) |
| Bottled, Tank, or LP Gas | 4,266 (44.8%) | 521 (28.0%) |
| Electricity | 958 (10.1%) | 446 (23.9%) |
| Fuel Oil or Kerosene | 225 (2.4%) | 35 (1.9%) |
| Coal or Coke | 0 (0.0%) | 0 (0.0%) |
| All other Fuels | 1,355 (14.2%) | 125 (6.7%) |
| No Fuel Used | 20 (0.2%) | 12 (0.6%) |
| Total | 9,518 (100.0%) | 1,862 (100.0%) |
Household Vehicle Usage in Pine County

| Vehicles per Household | Owner-occupied | Renter-occupied |
| No Vehicle | 331 (3.5%) | 369 (19.8%) |
| 1 Vehicle | 1,770 (18.6%) | 861 (46.2%) |
| 2 Vehicles | 3,676 (38.6%) | 396 (21.3%) |
| 3 or more Vehicles | 3,741 (39.3%) | 236 (12.7%) |
| Total | 9,518 (100.0%) | 1,862 (100.0%) |
Real Estate & Mortgages in Pine County
Real Estate and Mortgage Overview in Pine County
| Characteristic | Without Mortgage | With Mortgage |
| Housing Units | 3,996 | 5,522 |
| Median Property Value | $192,400 | $215,600 |
| Median Household Income | $54,923 | $841 |
| Monthly Housing Costs | $549 | $219 |
| Real Estate Taxes | $1,797 | $51 |
Property Value by Mortgage Status in Pine County
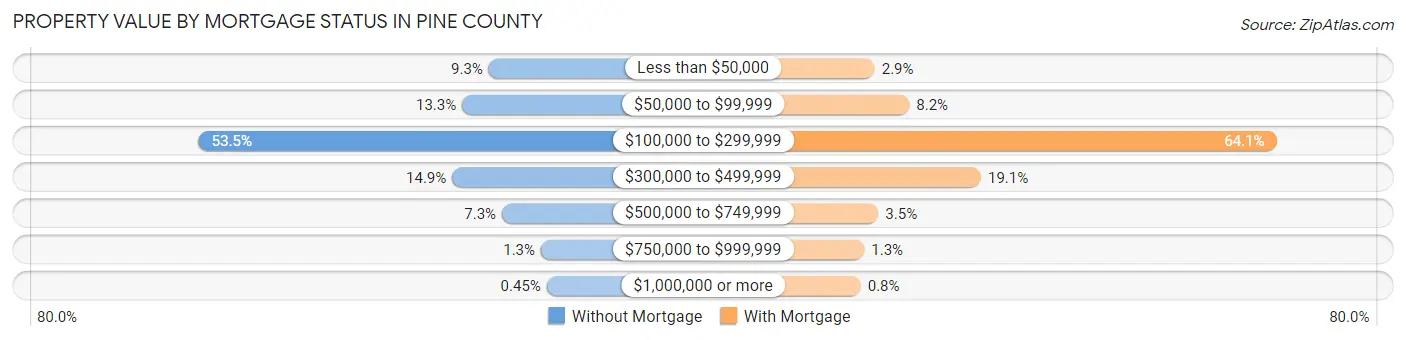
| Property Value | Without Mortgage | With Mortgage |
| Less than $50,000 | 371 (9.3%) | 162 (2.9%) |
| $50,000 to $99,999 | 533 (13.3%) | 453 (8.2%) |
| $100,000 to $299,999 | 2,137 (53.5%) | 3,541 (64.1%) |
| $300,000 to $499,999 | 594 (14.9%) | 1,056 (19.1%) |
| $500,000 to $749,999 | 290 (7.3%) | 192 (3.5%) |
| $750,000 to $999,999 | 53 (1.3%) | 74 (1.3%) |
| $1,000,000 or more | 18 (0.4%) | 44 (0.8%) |
| Total | 3,996 (100.0%) | 5,522 (100.0%) |
Household Income by Mortgage Status in Pine County

| Household Income | Without Mortgage | With Mortgage |
| Less than $10,000 | 163 (4.1%) | 130 (2.4%) |
| $10,000 to $24,999 | 537 (13.4%) | 103 (1.9%) |
| $25,000 to $34,999 | 439 (11.0%) | 357 (6.5%) |
| $35,000 to $49,999 | 667 (16.7%) | 266 (4.8%) |
| $50,000 to $74,999 | 851 (21.3%) | 590 (10.7%) |
| $75,000 to $99,999 | 466 (11.7%) | 1,026 (18.6%) |
| $100,000 to $149,999 | 552 (13.8%) | 1,023 (18.5%) |
| $150,000 or more | 321 (8.0%) | 1,316 (23.8%) |
| Total | 3,996 (100.0%) | 5,522 (100.0%) |
Property Value to Household Income Ratio in Pine County
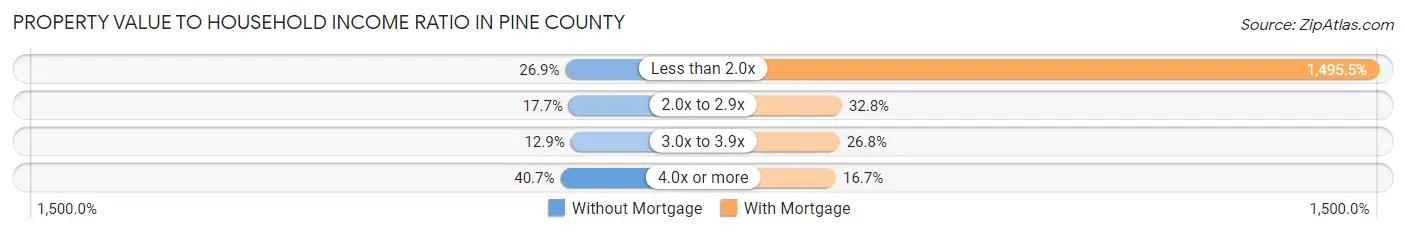
| Value-to-Income Ratio | Without Mortgage | With Mortgage |
| Less than 2.0x | 1,073 (26.9%) | 82,582 (1,495.5%) |
| 2.0x to 2.9x | 707 (17.7%) | 1,812 (32.8%) |
| 3.0x to 3.9x | 516 (12.9%) | 1,478 (26.8%) |
| 4.0x or more | 1,626 (40.7%) | 924 (16.7%) |
| Total | 3,996 (100.0%) | 5,522 (100.0%) |
Real Estate Taxes by Mortgage Status in Pine County
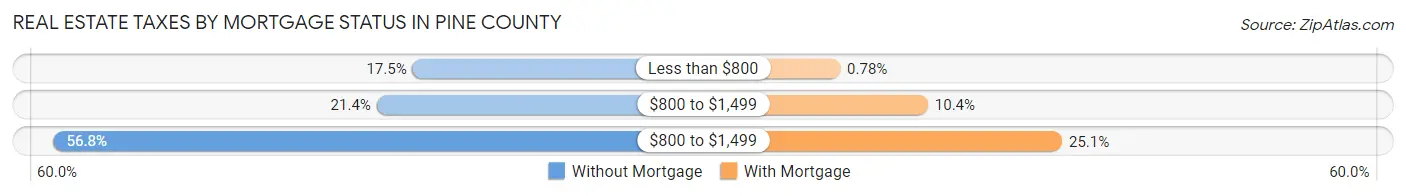
| Property Taxes | Without Mortgage | With Mortgage |
| Less than $800 | 699 (17.5%) | 43 (0.8%) |
| $800 to $1,499 | 856 (21.4%) | 574 (10.4%) |
| $800 to $1,499 | 2,270 (56.8%) | 1,386 (25.1%) |
| Total | 3,996 (100.0%) | 5,522 (100.0%) |
Health & Disability in Pine County
Health Insurance Coverage by Age in Pine County
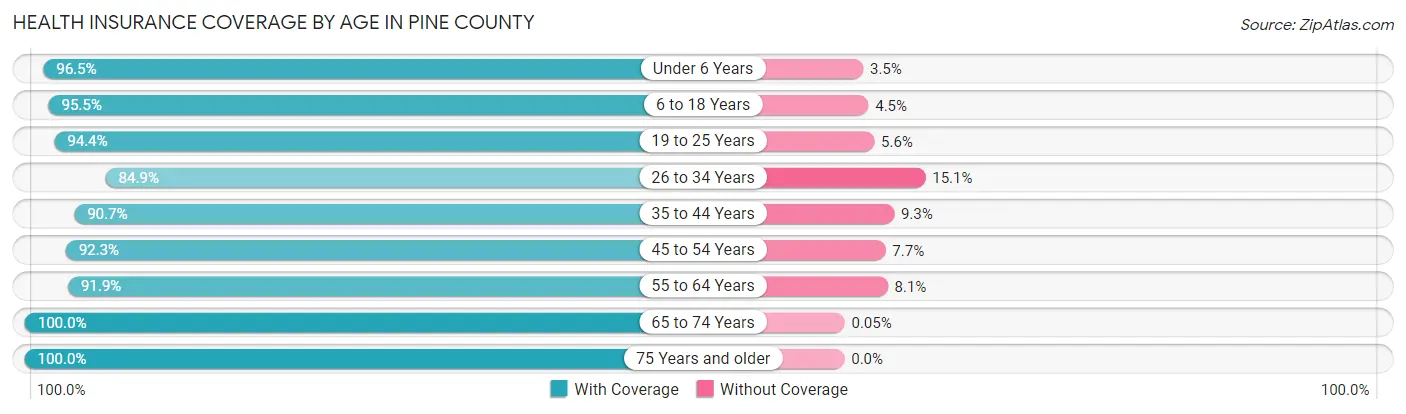
| Age Bracket | With Coverage | Without Coverage |
| Under 6 Years | 1,598 (96.5%) | 58 (3.5%) |
| 6 to 18 Years | 4,172 (95.5%) | 195 (4.5%) |
| 19 to 25 Years | 1,714 (94.4%) | 101 (5.6%) |
| 26 to 34 Years | 2,130 (84.9%) | 379 (15.1%) |
| 35 to 44 Years | 2,939 (90.7%) | 300 (9.3%) |
| 45 to 54 Years | 3,179 (92.3%) | 264 (7.7%) |
| 55 to 64 Years | 4,347 (91.9%) | 382 (8.1%) |
| 65 to 74 Years | 3,657 (100.0%) | 2 (0.1%) |
| 75 Years and older | 2,413 (100.0%) | 0 (0.0%) |
| Total | 26,149 (94.0%) | 1,681 (6.0%) |
Health Insurance Coverage by Citizenship Status in Pine County
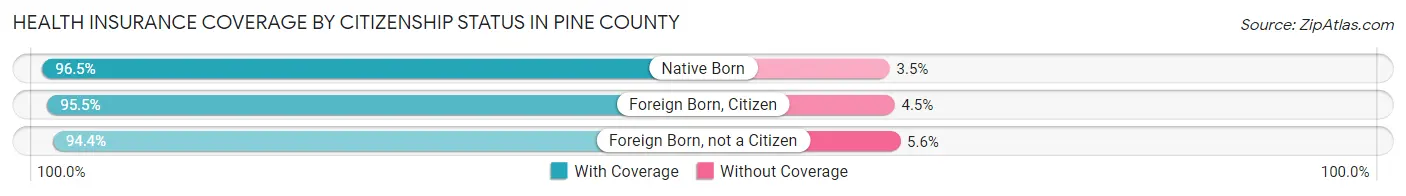
| Citizenship Status | With Coverage | Without Coverage |
| Native Born | 1,598 (96.5%) | 58 (3.5%) |
| Foreign Born, Citizen | 4,172 (95.5%) | 195 (4.5%) |
| Foreign Born, not a Citizen | 1,714 (94.4%) | 101 (5.6%) |
Health Insurance Coverage by Household Income in Pine County

| Household Income | With Coverage | Without Coverage |
| Under $25,000 | 2,633 (91.5%) | 246 (8.5%) |
| $25,000 to $49,999 | 4,509 (92.8%) | 351 (7.2%) |
| $50,000 to $74,999 | 4,796 (92.2%) | 406 (7.8%) |
| $75,000 to $99,999 | 4,112 (94.8%) | 227 (5.2%) |
| $100,000 and over | 9,912 (95.7%) | 451 (4.3%) |
Public vs Private Health Insurance Coverage by Age in Pine County
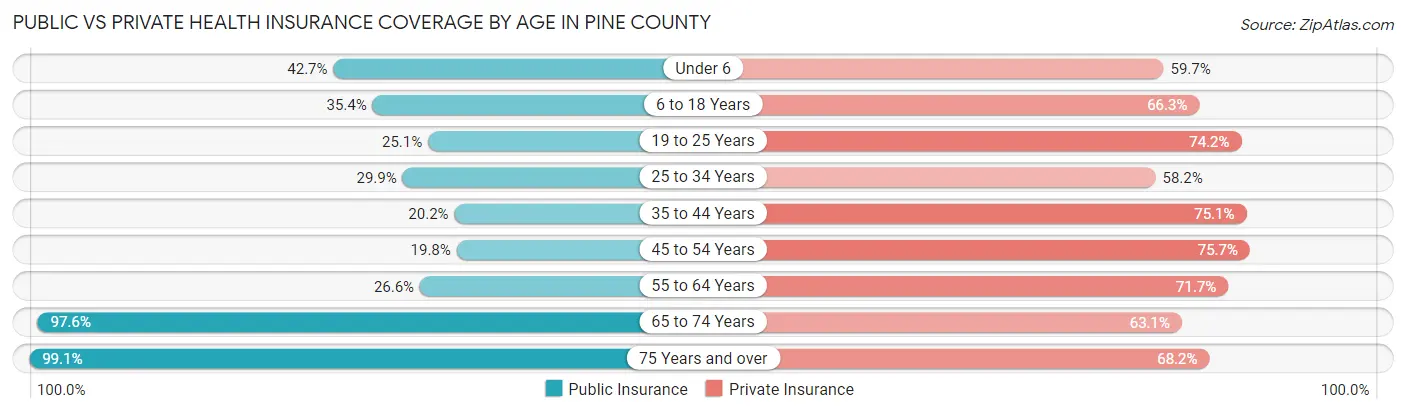
| Age Bracket | Public Insurance | Private Insurance |
| Under 6 | 707 (42.7%) | 989 (59.7%) |
| 6 to 18 Years | 1,547 (35.4%) | 2,897 (66.3%) |
| 19 to 25 Years | 456 (25.1%) | 1,346 (74.2%) |
| 25 to 34 Years | 749 (29.8%) | 1,461 (58.2%) |
| 35 to 44 Years | 655 (20.2%) | 2,432 (75.1%) |
| 45 to 54 Years | 682 (19.8%) | 2,607 (75.7%) |
| 55 to 64 Years | 1,259 (26.6%) | 3,391 (71.7%) |
| 65 to 74 Years | 3,571 (97.6%) | 2,309 (63.1%) |
| 75 Years and over | 2,392 (99.1%) | 1,646 (68.2%) |
| Total | 12,018 (43.2%) | 19,078 (68.5%) |
Disability Status by Sex by Age in Pine County
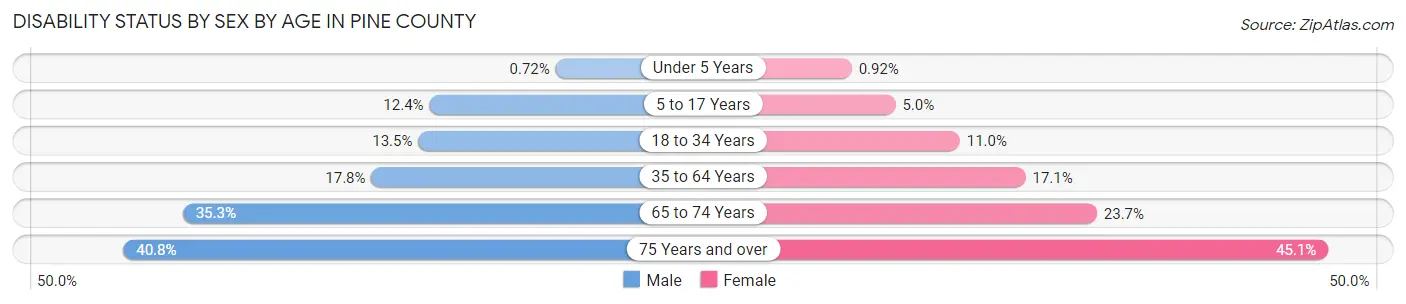
| Age Bracket | Male | Female |
| Under 5 Years | 5 (0.7%) | 6 (0.9%) |
| 5 to 17 Years | 276 (12.4%) | 103 (5.0%) |
| 18 to 34 Years | 355 (13.5%) | 228 (11.0%) |
| 35 to 64 Years | 1,057 (17.8%) | 934 (17.1%) |
| 65 to 74 Years | 670 (35.3%) | 417 (23.7%) |
| 75 Years and over | 448 (40.8%) | 594 (45.1%) |
Disability Class by Sex by Age in Pine County
Disability Class: Hearing Difficulty

| Age Bracket | Male | Female |
| Under 5 Years | 5 (0.7%) | 6 (0.9%) |
| 5 to 17 Years | 42 (1.9%) | 3 (0.2%) |
| 18 to 34 Years | 56 (2.1%) | 51 (2.5%) |
| 35 to 64 Years | 378 (6.4%) | 226 (4.1%) |
| 65 to 74 Years | 456 (24.0%) | 95 (5.4%) |
| 75 Years and over | 309 (28.2%) | 340 (25.8%) |
Disability Class: Vision Difficulty

| Age Bracket | Male | Female |
| Under 5 Years | 0 (0.0%) | 0 (0.0%) |
| 5 to 17 Years | 46 (2.1%) | 9 (0.4%) |
| 18 to 34 Years | 9 (0.3%) | 14 (0.7%) |
| 35 to 64 Years | 119 (2.0%) | 221 (4.0%) |
| 65 to 74 Years | 69 (3.6%) | 63 (3.6%) |
| 75 Years and over | 89 (8.1%) | 114 (8.7%) |
Disability Class: Cognitive Difficulty
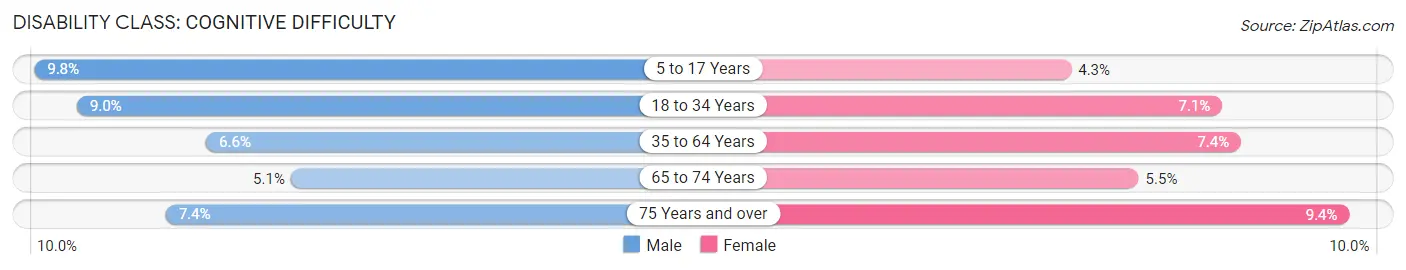
| Age Bracket | Male | Female |
| 5 to 17 Years | 218 (9.8%) | 88 (4.3%) |
| 18 to 34 Years | 238 (9.0%) | 147 (7.1%) |
| 35 to 64 Years | 393 (6.6%) | 406 (7.4%) |
| 65 to 74 Years | 96 (5.1%) | 97 (5.5%) |
| 75 Years and over | 81 (7.4%) | 124 (9.4%) |
Disability Class: Ambulatory Difficulty
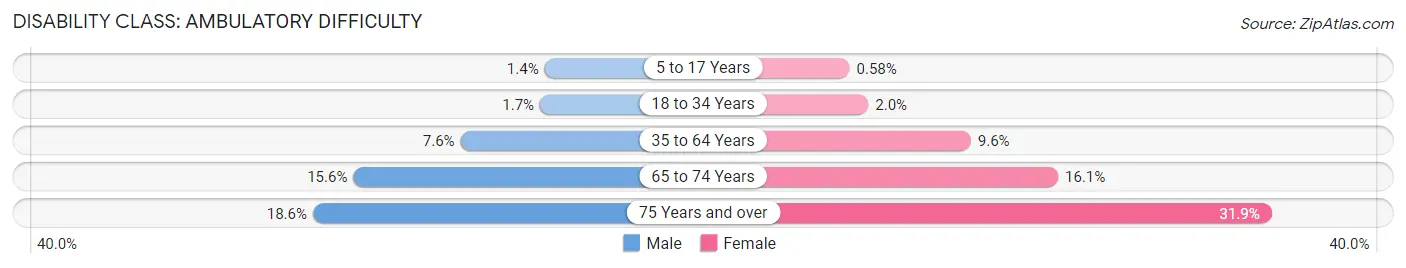
| Age Bracket | Male | Female |
| 5 to 17 Years | 31 (1.4%) | 12 (0.6%) |
| 18 to 34 Years | 46 (1.7%) | 41 (2.0%) |
| 35 to 64 Years | 453 (7.6%) | 525 (9.6%) |
| 65 to 74 Years | 296 (15.6%) | 283 (16.1%) |
| 75 Years and over | 204 (18.6%) | 420 (31.9%) |
Disability Class: Self-Care Difficulty
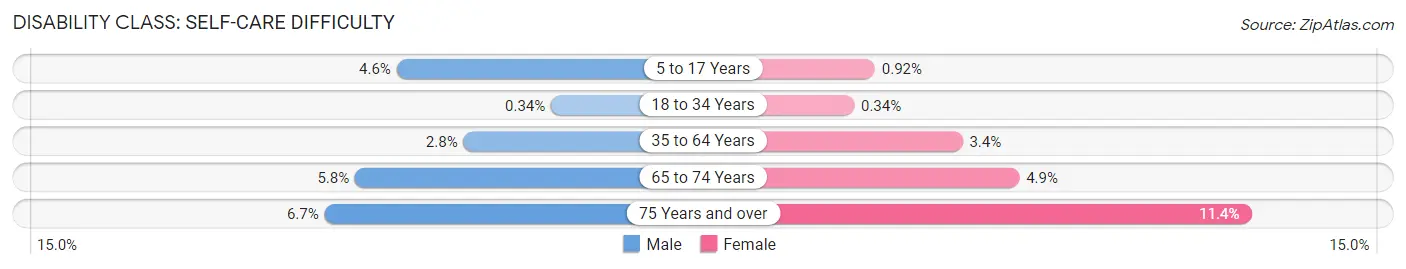
| Age Bracket | Male | Female |
| 5 to 17 Years | 103 (4.6%) | 19 (0.9%) |
| 18 to 34 Years | 9 (0.3%) | 7 (0.3%) |
| 35 to 64 Years | 165 (2.8%) | 184 (3.4%) |
| 65 to 74 Years | 110 (5.8%) | 87 (4.9%) |
| 75 Years and over | 73 (6.7%) | 150 (11.4%) |
Technology Access in Pine County
Computing Device Access in Pine County
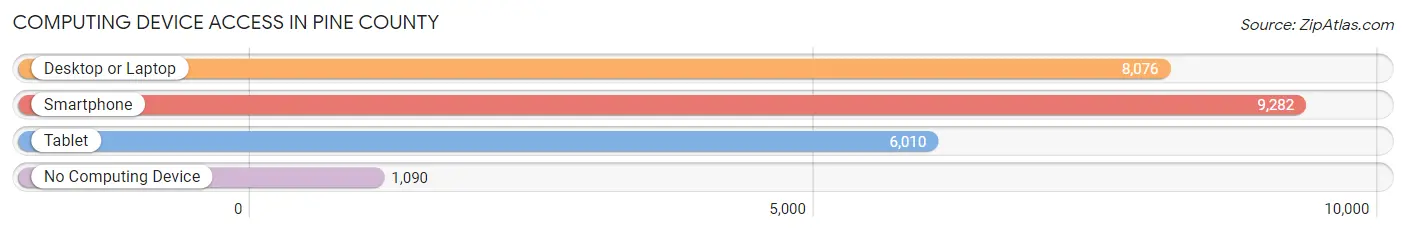
| Device Type | # Households | % Households |
| Desktop or Laptop | 8,076 | 71.0% |
| Smartphone | 9,282 | 81.6% |
| Tablet | 6,010 | 52.8% |
| No Computing Device | 1,090 | 9.6% |
| Total | 11,380 | 100.0% |
Internet Access in Pine County
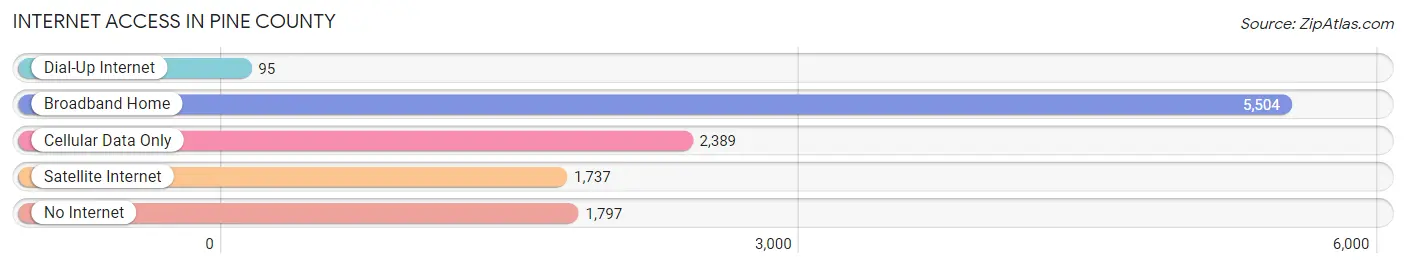
| Internet Type | # Households | % Households |
| Dial-Up Internet | 95 | 0.8% |
| Broadband Home | 5,504 | 48.4% |
| Cellular Data Only | 2,389 | 21.0% |
| Satellite Internet | 1,737 | 15.3% |
| No Internet | 1,797 | 15.8% |
| Total | 11,380 | 100.0% |
Pine County Summary
Pine County is a county located in the east-central part of the U.S. state of Minnesota. As of the 2010 census, the population was 29,750. Its county seat is Pine City. The county was formed in 1856 and organized in 1872.
Geography
Pine County is located in east-central Minnesota, and is bordered by Chisago County to the north, Kanabec County to the east, Isanti County to the south, and Carlton and Aitkin Counties to the west. The county has a total area of 845 square miles, of which 830 square miles is land and 15 square miles (1.8%) is water. The county is mostly forested, with the St. Croix River running through the center of the county.
Demographics
As of the 2010 census, there were 29,750 people, 11,845 households, and 8,072 families residing in the county. The population density was 36 people per square mile. There were 13,717 housing units at an average density of 17 per square mile. The racial makeup of the county was 95.2% White, 0.7% Black or African American, 0.7% Native American, 0.5% Asian, 0.1% Pacific Islander, 1.7% from other races, and 1.2% from two or more races. 3.7% of the population were Hispanic or Latino of any race.
Economy
Pine County is largely rural and agricultural, with a few small towns and cities. The county is home to several large farms, as well as several small businesses. The county is also home to several large logging and paper companies, as well as several small sawmills. The county is also home to several small manufacturing companies, as well as several small retail businesses.
The county is also home to several large state parks, including the St. Croix State Park, which is the largest state park in Minnesota. The county is also home to several small lakes, rivers, and streams, which provide recreational opportunities for residents and visitors alike.
History
Pine County was established in 1856, and was organized in 1872. The county was named for the abundance of pine trees in the area. The county was originally home to the Ojibwe people, who were the first inhabitants of the area. The first settlers in the county were mostly of Scandinavian descent, and the county was largely agricultural.
In the late 19th century, the logging industry began to take off in the county, and the area became known for its paper mills. The county was also home to several small towns, which grew up around the logging and paper mills.
In the early 20th century, the county began to diversify its economy, and several small manufacturing companies began to move into the area. The county also began to attract tourists, and several small resorts began to open up in the area.
Today, Pine County is a largely rural county, with a few small towns and cities. The county is home to several large farms, as well as several small businesses. The county is also home to several large logging and paper companies, as well as several small sawmills. The county is also home to several small manufacturing companies, as well as several small retail businesses. The county is also home to several large state parks, including the St. Croix State Park, which is the largest state park in Minnesota. The county is also home to several small lakes, rivers, and streams, which provide recreational opportunities for residents and visitors alike.
Common Questions
What is Per Capita Income in Pine County?
Per Capita income in Pine County is $32,335.
What is the Median Family Income in Pine County?
Median Family Income in Pine County is $79,482.
What is the Median Household income in Pine County?
Median Household Income in Pine County is $65,059.
What is Income or Wage Gap in Pine County?
Income or Wage Gap in Pine County is 32.9%.
Women in Pine County earn 67.1 cents for every dollar earned by a man.
What is Family Income Deficit in Pine County?
Family Income Deficit in Pine County is $10,301.
Families that are below poverty line in Pine County earn $10,301 less on average than the poverty threshold level.
What is Inequality or Gini Index in Pine County?
Inequality or Gini Index in Pine County is 0.42.
What is the Total Population of Pine County?
Total Population of Pine County is 29,090.
What is the Total Male Population of Pine County?
Total Male Population of Pine County is 15,605.
What is the Total Female Population of Pine County?
Total Female Population of Pine County is 13,485.
What is the Ratio of Males per 100 Females in Pine County?
There are 115.72 Males per 100 Females in Pine County.
What is the Ratio of Females per 100 Males in Pine County?
There are 86.41 Females per 100 Males in Pine County.
What is the Median Population Age in Pine County?
Median Population Age in Pine County is 45.6 Years.
What is the Average Family Size in Pine County
Average Family Size in Pine County is 3.0 People.
What is the Average Household Size in Pine County
Average Household Size in Pine County is 2.4 People.
How Large is the Labor Force in Pine County?
There are 13,733 People in the Labor Forcein in Pine County.
What is the Percentage of People in the Labor Force in Pine County?
56.8% of People are in the Labor Force in Pine County.
What is the Unemployment Rate in Pine County?
Unemployment Rate in Pine County is 5.8%.