Lake County, MN Map & Demographics
Lake County Map
Lake County Overview
$39,930
PER CAPITA INCOME
$90,540
AVG FAMILY INCOME
$73,860
AVG HOUSEHOLD INCOME
47.3%
WAGE / INCOME GAP [ % ]
52.7¢/ $1
WAGE / INCOME GAP [ $ ]
0.40
INEQUALITY / GINI INDEX
10,915
TOTAL POPULATION
5,608
MALE POPULATION
5,307
FEMALE POPULATION
105.67
MALES / 100 FEMALES
94.63
FEMALES / 100 MALES
49.7
MEDIAN AGE
2.6
AVG FAMILY SIZE
2.1
AVG HOUSEHOLD SIZE
5,068
LABOR FORCE [ PEOPLE ]
55.7%
PERCENT IN LABOR FORCE
2.8%
UNEMPLOYMENT RATE
Lake County Area Codes
Income in Lake County
Income Overview in Lake County
Per Capita Income in Lake County is $39,930, while median incomes of families and households are $90,540 and $73,860 respectively.
| Characteristic | Number | Measure |
| Per Capita Income | 10,915 | $39,930 |
| Median Family Income | 3,161 | $90,540 |
| Mean Family Income | 3,161 | $102,271 |
| Median Household Income | 5,036 | $73,860 |
| Mean Household Income | 5,036 | $85,459 |
| Income Deficit | 3,161 | $0 |
| Wage / Income Gap (%) | 10,915 | 47.27% |
| Wage / Income Gap ($) | 10,915 | 52.73¢ per $1 |
| Gini / Inequality Index | 10,915 | 0.40 |
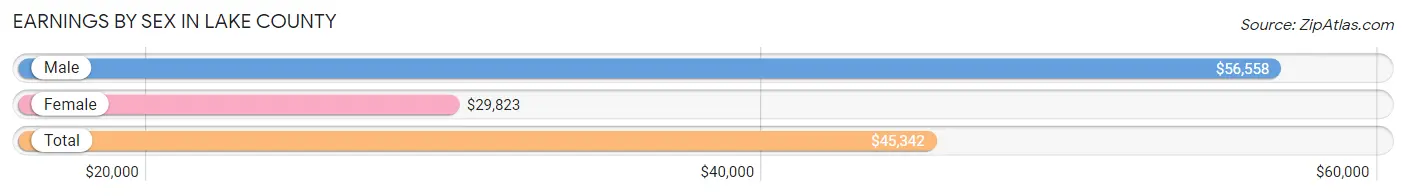
Earnings by Sex in Lake County
Average Earnings in Lake County are $45,342, $56,558 for men and $29,823 for women, a difference of 47.3%.
| Sex | Number | Average Earnings |
| Male | 3,002 (54.1%) | $56,558 |
| Female | 2,546 (45.9%) | $29,823 |
| Total | 5,548 (100.0%) | $45,342 |
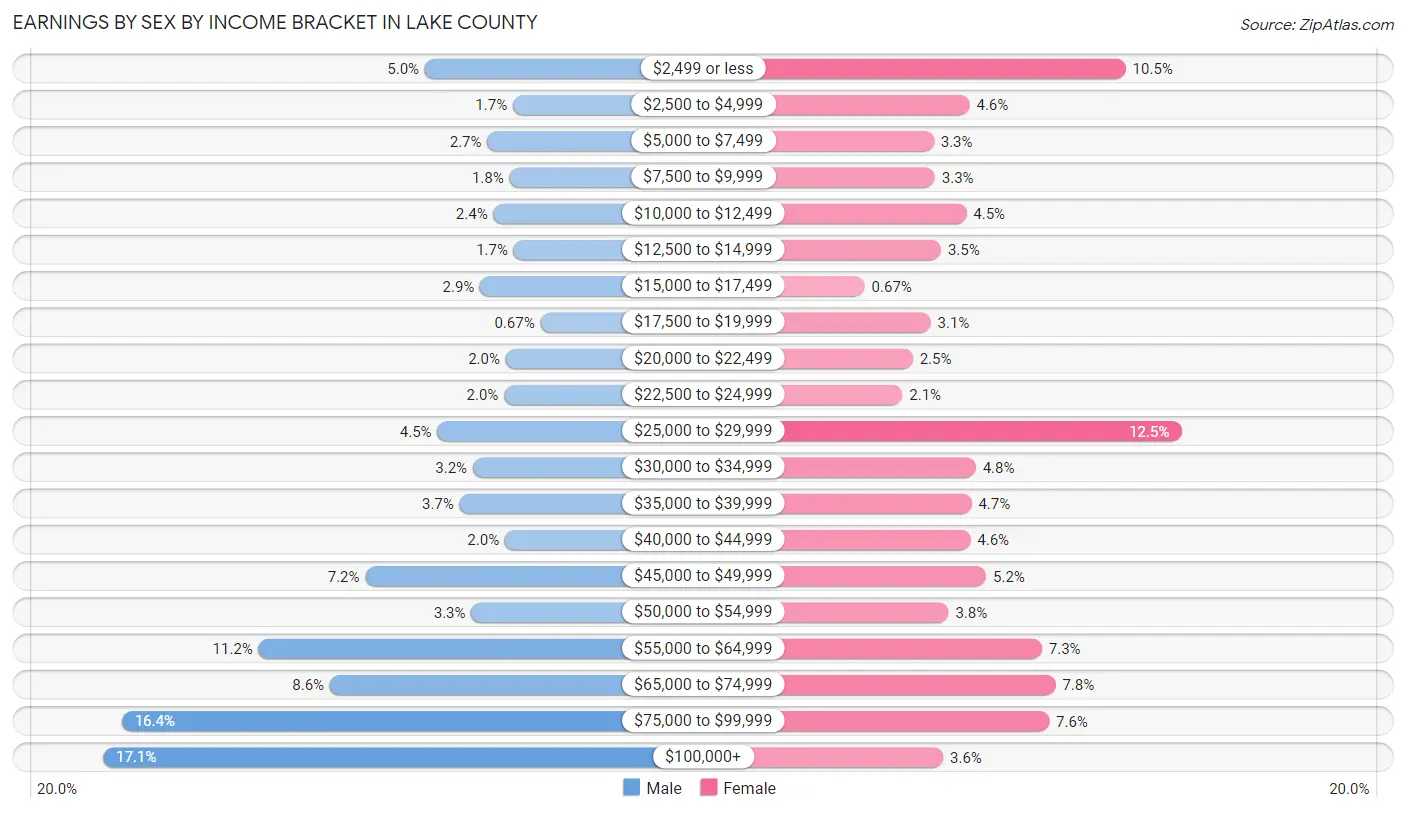
Earnings by Sex by Income Bracket in Lake County
The most common earnings brackets in Lake County are $100,000+ for men (512 | 17.1%) and $25,000 to $29,999 for women (319 | 12.5%).
| Income | Male | Female |
| $2,499 or less | 150 (5.0%) | 266 (10.4%) |
| $2,500 to $4,999 | 51 (1.7%) | 117 (4.6%) |
| $5,000 to $7,499 | 80 (2.7%) | 83 (3.3%) |
| $7,500 to $9,999 | 55 (1.8%) | 84 (3.3%) |
| $10,000 to $12,499 | 73 (2.4%) | 114 (4.5%) |
| $12,500 to $14,999 | 50 (1.7%) | 90 (3.5%) |
| $15,000 to $17,499 | 88 (2.9%) | 17 (0.7%) |
| $17,500 to $19,999 | 20 (0.7%) | 80 (3.1%) |
| $20,000 to $22,499 | 59 (2.0%) | 63 (2.5%) |
| $22,500 to $24,999 | 61 (2.0%) | 53 (2.1%) |
| $25,000 to $29,999 | 136 (4.5%) | 319 (12.5%) |
| $30,000 to $34,999 | 96 (3.2%) | 123 (4.8%) |
| $35,000 to $39,999 | 111 (3.7%) | 119 (4.7%) |
| $40,000 to $44,999 | 60 (2.0%) | 118 (4.6%) |
| $45,000 to $49,999 | 217 (7.2%) | 133 (5.2%) |
| $50,000 to $54,999 | 98 (3.3%) | 97 (3.8%) |
| $55,000 to $64,999 | 337 (11.2%) | 186 (7.3%) |
| $65,000 to $74,999 | 257 (8.6%) | 199 (7.8%) |
| $75,000 to $99,999 | 491 (16.4%) | 193 (7.6%) |
| $100,000+ | 512 (17.1%) | 92 (3.6%) |
| Total | 3,002 (100.0%) | 2,546 (100.0%) |
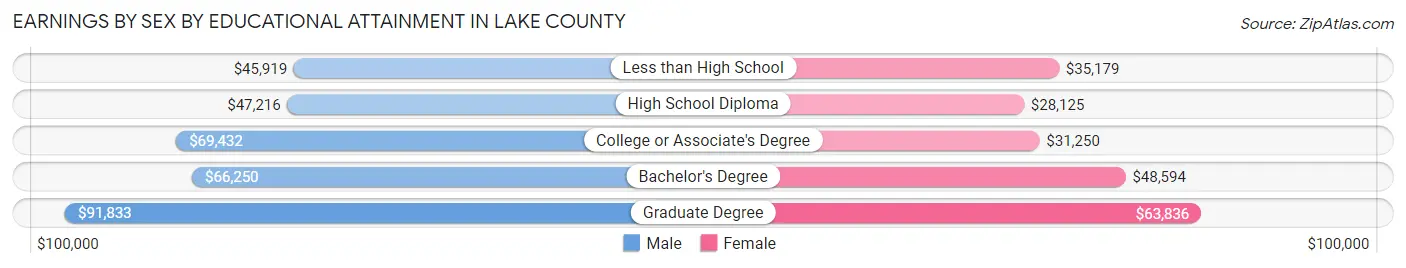
Earnings by Sex by Educational Attainment in Lake County
Average earnings in Lake County are $58,395 for men and $34,620 for women, a difference of 40.7%. Men with an educational attainment of graduate degree enjoy the highest average annual earnings of $91,833, while those with less than high school education earn the least with $45,919. Women with an educational attainment of graduate degree earn the most with the average annual earnings of $63,836, while those with high school diploma education have the smallest earnings of $28,125.
| Educational Attainment | Male Income | Female Income |
| Less than High School | $45,919 | $35,179 |
| High School Diploma | $47,216 | $28,125 |
| College or Associate's Degree | $69,432 | $31,250 |
| Bachelor's Degree | $66,250 | $48,594 |
| Graduate Degree | $91,833 | $63,836 |
| Total | $58,395 | $34,620 |
Family Income in Lake County
Family Income Brackets in Lake County
According to the Lake County family income data, there are 920 families falling into the $100,000 to $149,999 income range, which is the most common income bracket and makes up 29.1% of all families. Conversely, the $10,000 to $14,999 income bracket is the least frequent group with only 47 families (1.5%) belonging to this category.
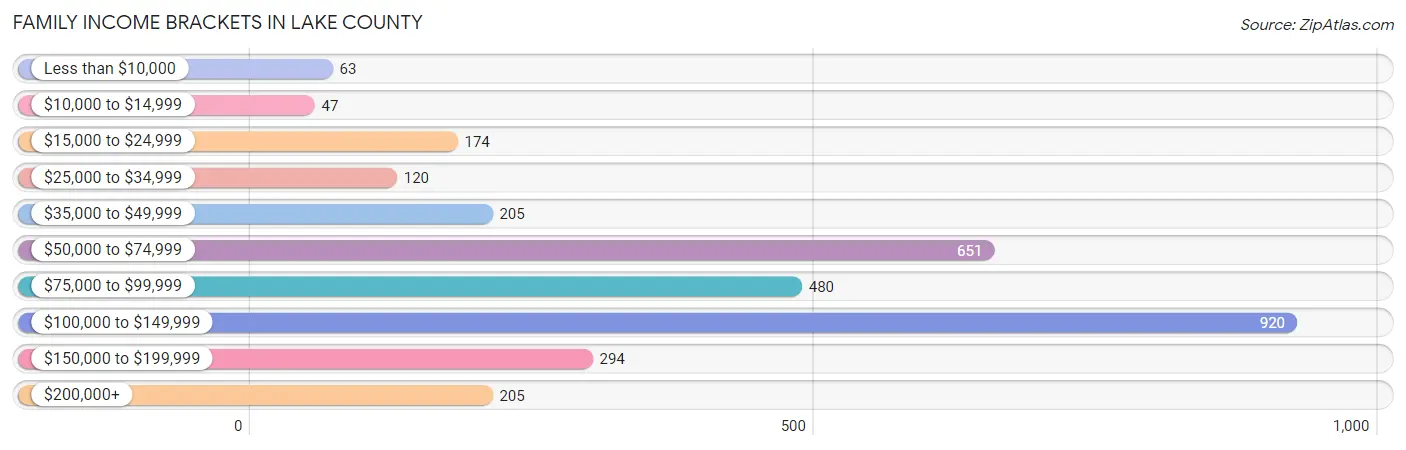
| Income Bracket | # Families | % Families |
| Less than $10,000 | 63 | 2.0% |
| $10,000 to $14,999 | 47 | 1.5% |
| $15,000 to $24,999 | 174 | 5.5% |
| $25,000 to $34,999 | 120 | 3.8% |
| $35,000 to $49,999 | 205 | 6.5% |
| $50,000 to $74,999 | 651 | 20.6% |
| $75,000 to $99,999 | 480 | 15.2% |
| $100,000 to $149,999 | 920 | 29.1% |
| $150,000 to $199,999 | 294 | 9.3% |
| $200,000+ | 205 | 6.5% |
Family Income by Famaliy Size in Lake County
7+ person families (51 | 1.6%) account for the highest median family income in Lake County with $220,223 per family, while 2-person families (1,896 | 60.0%) have the highest median income of $39,483 per family member.
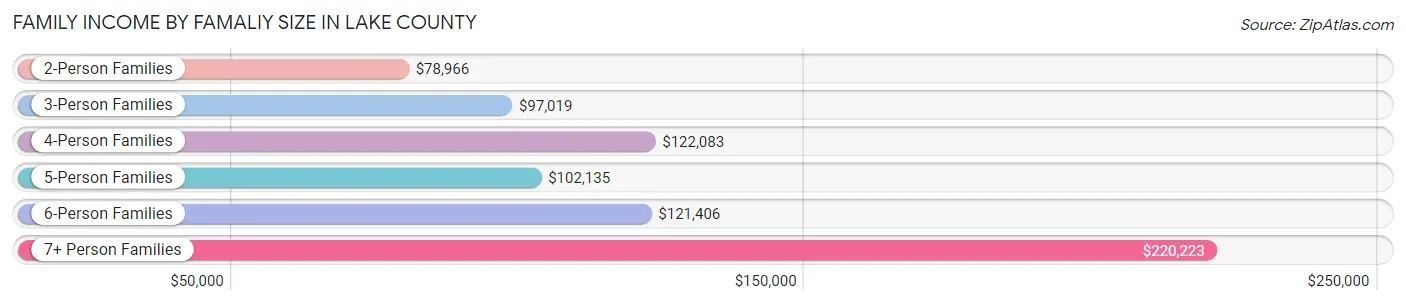
| Income Bracket | # Families | Median Income |
| 2-Person Families | 1,896 (60.0%) | $78,966 |
| 3-Person Families | 595 (18.8%) | $97,019 |
| 4-Person Families | 382 (12.1%) | $122,083 |
| 5-Person Families | 133 (4.2%) | $102,135 |
| 6-Person Families | 104 (3.3%) | $121,406 |
| 7+ Person Families | 51 (1.6%) | $220,223 |
| Total | 3,161 (100.0%) | $90,540 |
Family Income by Number of Earners in Lake County
The median family income in Lake County is $90,540, with families comprising 2 earners (1,161) having the highest median family income of $122,422, while families with 1 earner (952) have the lowest median family income of $69,625, accounting for 36.7% and 30.1% of families, respectively.
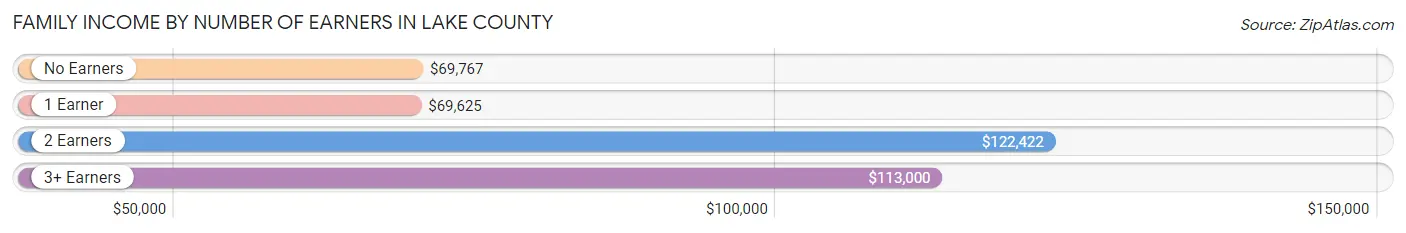
| Number of Earners | # Families | Median Income |
| No Earners | 694 (22.0%) | $69,767 |
| 1 Earner | 952 (30.1%) | $69,625 |
| 2 Earners | 1,161 (36.7%) | $122,422 |
| 3+ Earners | 354 (11.2%) | $113,000 |
| Total | 3,161 (100.0%) | $90,540 |
Household Income in Lake County
Household Income Brackets in Lake County
With 1,123 households falling in the category, the $100,000 to $149,999 income range is the most frequent in Lake County, accounting for 22.3% of all households. In contrast, only 166 households (3.3%) fall into the $10,000 to $14,999 income bracket, making it the least populous group.
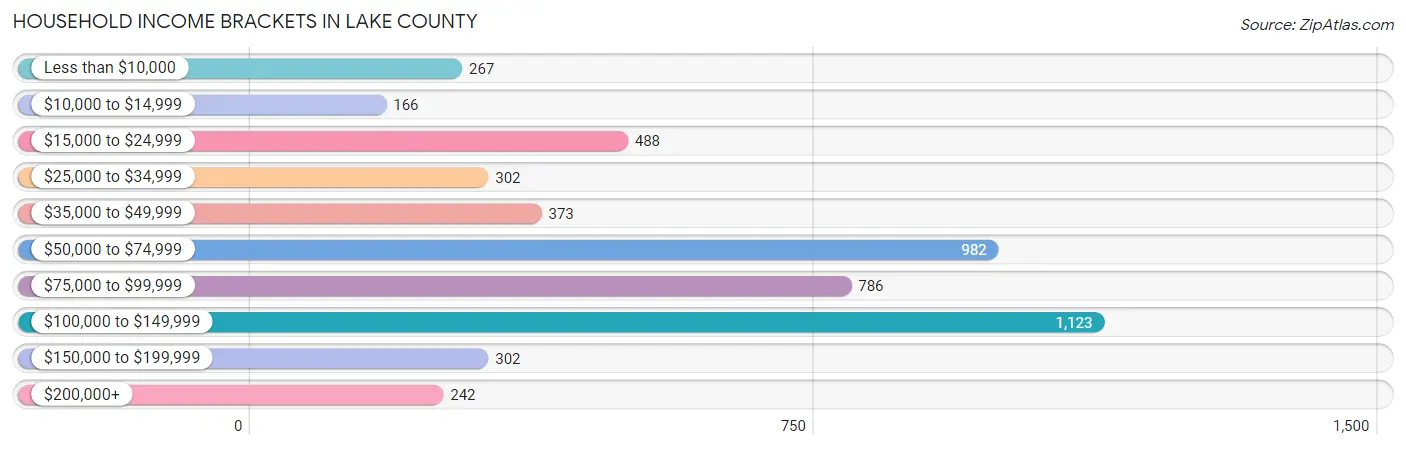
| Income Bracket | # Households | % Households |
| Less than $10,000 | 267 | 5.3% |
| $10,000 to $14,999 | 166 | 3.3% |
| $15,000 to $24,999 | 488 | 9.7% |
| $25,000 to $34,999 | 302 | 6.0% |
| $35,000 to $49,999 | 373 | 7.4% |
| $50,000 to $74,999 | 982 | 19.5% |
| $75,000 to $99,999 | 786 | 15.6% |
| $100,000 to $149,999 | 1,123 | 22.3% |
| $150,000 to $199,999 | 302 | 6.0% |
| $200,000+ | 242 | 4.8% |
Household Income by Householder Age in Lake County
The median household income in Lake County is $73,860, with the highest median household income of $99,219 found in the 15 to 24 years age bracket for the primary householder. A total of 177 households (3.5%) fall into this category. Meanwhile, the 65+ years age bracket for the primary householder has the lowest median household income of $57,661, with 1,918 households (38.1%) in this group.

| Income Bracket | # Households | Median Income |
| 15 to 24 Years | 177 (3.5%) | $99,219 |
| 25 to 44 Years | 1,239 (24.6%) | $88,591 |
| 45 to 64 Years | 1,702 (33.8%) | $81,750 |
| 65+ Years | 1,918 (38.1%) | $57,661 |
| Total | 5,036 (100.0%) | $73,860 |
Poverty in Lake County
Income Below Poverty by Sex and Age in Lake County
With 7.2% poverty level for males and 10.2% for females among the residents of Lake County, 45 to 54 year old males and 15 year old females are the most vulnerable to poverty, with 70 males (11.3%) and 11 females (22.9%) in their respective age groups living below the poverty level.
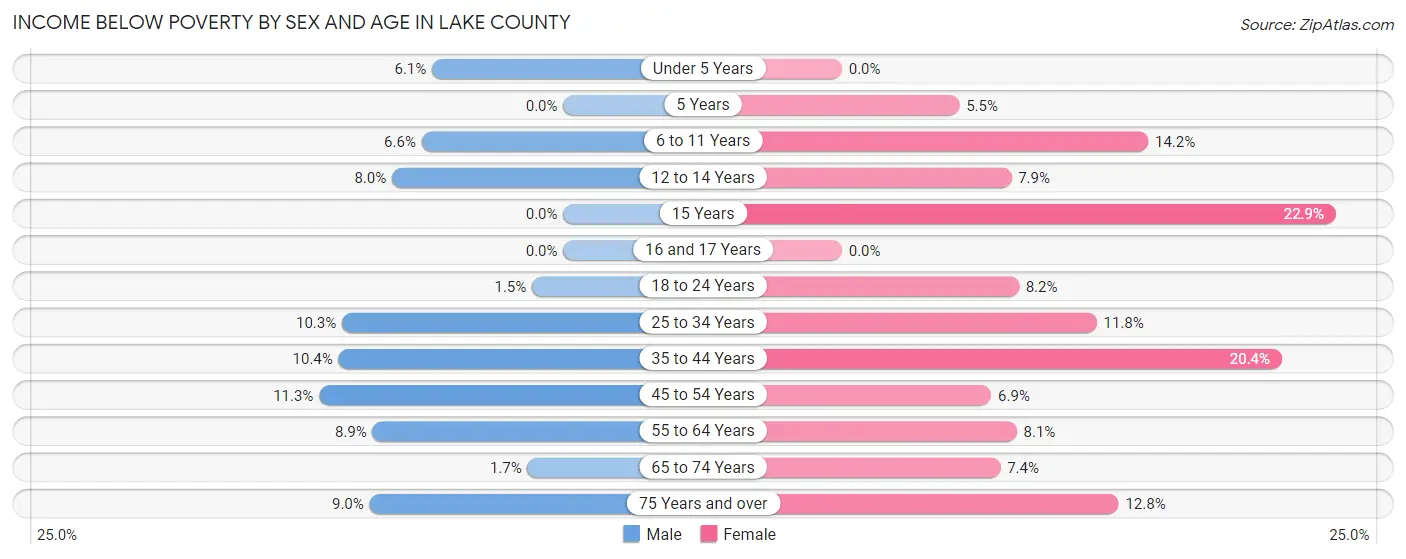
| Age Bracket | Male | Female |
| Under 5 Years | 17 (6.1%) | 0 (0.0%) |
| 5 Years | 0 (0.0%) | 3 (5.4%) |
| 6 to 11 Years | 27 (6.6%) | 51 (14.2%) |
| 12 to 14 Years | 12 (8.0%) | 11 (7.9%) |
| 15 Years | 0 (0.0%) | 11 (22.9%) |
| 16 and 17 Years | 0 (0.0%) | 0 (0.0%) |
| 18 to 24 Years | 5 (1.5%) | 23 (8.2%) |
| 25 to 34 Years | 49 (10.3%) | 59 (11.8%) |
| 35 to 44 Years | 68 (10.4%) | 117 (20.4%) |
| 45 to 54 Years | 70 (11.3%) | 41 (6.9%) |
| 55 to 64 Years | 86 (8.8%) | 71 (8.1%) |
| 65 to 74 Years | 14 (1.7%) | 55 (7.3%) |
| 75 Years and over | 50 (9.0%) | 81 (12.8%) |
| Total | 398 (7.2%) | 523 (10.2%) |
Income Above Poverty by Sex and Age in Lake County
According to the poverty statistics in Lake County, males aged 5 years and females aged under 5 years are the age groups that are most secure financially, with 100.0% of males and 100.0% of females in these age groups living above the poverty line.
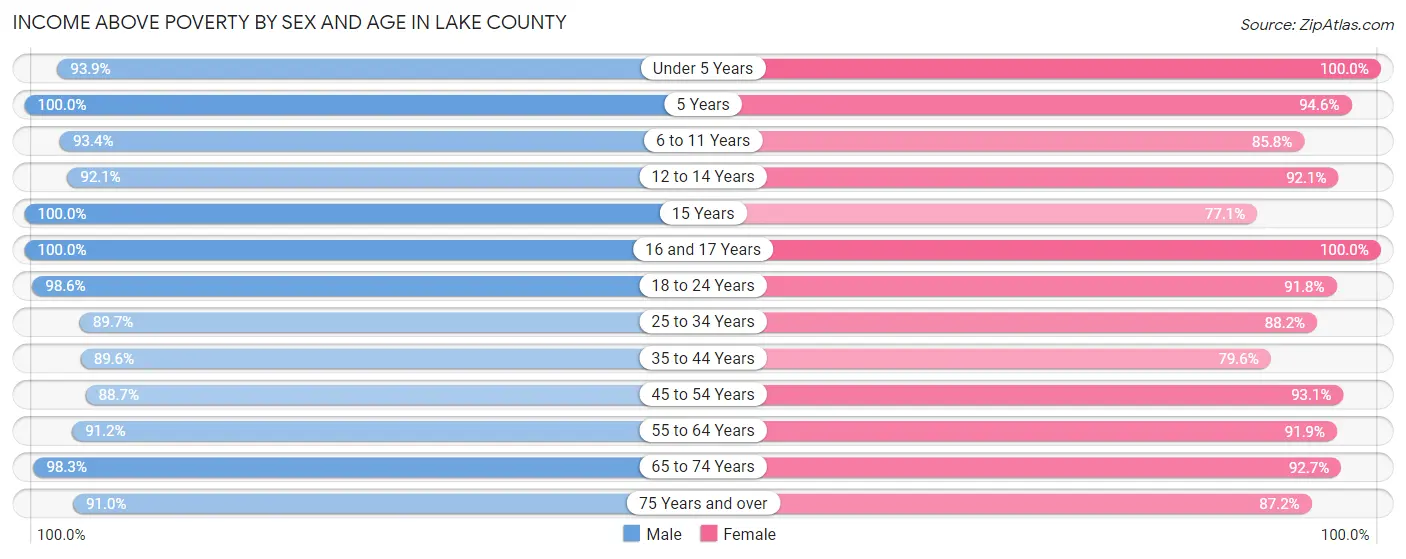
| Age Bracket | Male | Female |
| Under 5 Years | 262 (93.9%) | 220 (100.0%) |
| 5 Years | 61 (100.0%) | 52 (94.6%) |
| 6 to 11 Years | 384 (93.4%) | 308 (85.8%) |
| 12 to 14 Years | 139 (92.0%) | 129 (92.1%) |
| 15 Years | 62 (100.0%) | 37 (77.1%) |
| 16 and 17 Years | 131 (100.0%) | 128 (100.0%) |
| 18 to 24 Years | 340 (98.6%) | 257 (91.8%) |
| 25 to 34 Years | 428 (89.7%) | 440 (88.2%) |
| 35 to 44 Years | 584 (89.6%) | 456 (79.6%) |
| 45 to 54 Years | 548 (88.7%) | 551 (93.1%) |
| 55 to 64 Years | 886 (91.1%) | 804 (91.9%) |
| 65 to 74 Years | 828 (98.3%) | 693 (92.6%) |
| 75 Years and over | 506 (91.0%) | 550 (87.2%) |
| Total | 5,159 (92.8%) | 4,625 (89.8%) |
Income Below Poverty Among Married-Couple Families in Lake County
The poverty statistics for married-couple families in Lake County show that 2.7% or 69 of the total 2,571 families live below the poverty line. Families with no children have the highest poverty rate of 2.9%, comprising of 53 families. On the other hand, families with 3 or 4 children have the lowest poverty rate of 0.0%, which includes 0 families.
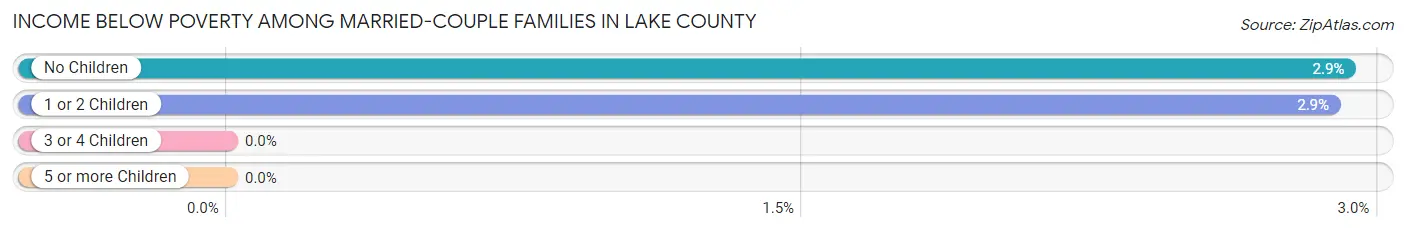
| Children | Above Poverty | Below Poverty |
| No Children | 1,759 (97.1%) | 53 (2.9%) |
| 1 or 2 Children | 540 (97.1%) | 16 (2.9%) |
| 3 or 4 Children | 155 (100.0%) | 0 (0.0%) |
| 5 or more Children | 48 (100.0%) | 0 (0.0%) |
| Total | 2,502 (97.3%) | 69 (2.7%) |
Income Below Poverty Among Single-Parent Households in Lake County
According to the poverty data in Lake County, 1.5% or 3 single-father households and 23.6% or 92 single-mother households are living below the poverty line. Among single-father households, those with no children have the highest poverty rate, with 3 households (5.6%) experiencing poverty. Likewise, among single-mother households, those with 3 or 4 children have the highest poverty rate, with 12 households (44.4%) falling below the poverty line.

| Children | Single Father | Single Mother |
| No Children | 3 (5.6%) | 10 (5.6%) |
| 1 or 2 Children | 0 (0.0%) | 70 (37.8%) |
| 3 or 4 Children | 0 (0.0%) | 12 (44.4%) |
| 5 or more Children | 0 (0.0%) | 0 (0.0%) |
| Total | 3 (1.5%) | 92 (23.6%) |
Income Below Poverty Among Married-Couple vs Single-Parent Households in Lake County
The poverty data for Lake County shows that 69 of the married-couple family households (2.7%) and 95 of the single-parent households (16.1%) are living below the poverty level. Within the married-couple family households, those with no children have the highest poverty rate, with 53 households (2.9%) falling below the poverty line. Among the single-parent households, those with 1 or 2 children have the highest poverty rate, with 70 household (24.7%) living below poverty.
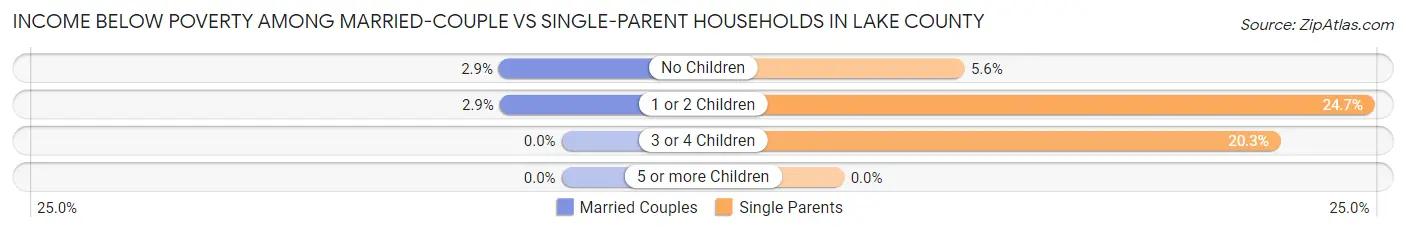
| Children | Married-Couple Families | Single-Parent Households |
| No Children | 53 (2.9%) | 13 (5.6%) |
| 1 or 2 Children | 16 (2.9%) | 70 (24.7%) |
| 3 or 4 Children | 0 (0.0%) | 12 (20.3%) |
| 5 or more Children | 0 (0.0%) | 0 (0.0%) |
| Total | 69 (2.7%) | 95 (16.1%) |
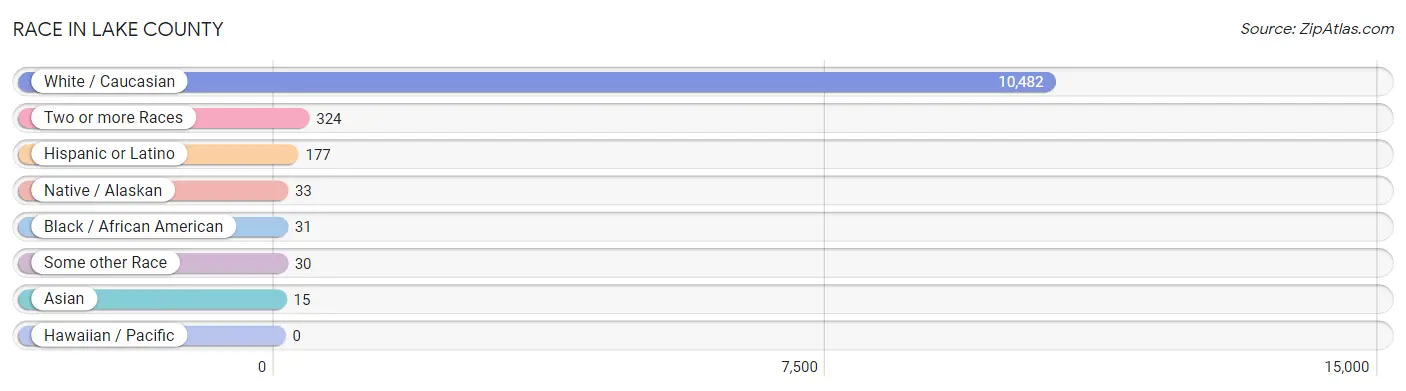
Race in Lake County
The most populous races in Lake County are White / Caucasian (10,482 | 96.0%), Two or more Races (324 | 3.0%), and Hispanic or Latino (177 | 1.6%).
| Race | # Population | % Population |
| Asian | 15 | 0.1% |
| Black / African American | 31 | 0.3% |
| Hawaiian / Pacific | 0 | 0.0% |
| Hispanic or Latino | 177 | 1.6% |
| Native / Alaskan | 33 | 0.3% |
| White / Caucasian | 10,482 | 96.0% |
| Two or more Races | 324 | 3.0% |
| Some other Race | 30 | 0.3% |
| Total | 10,915 | 100.0% |
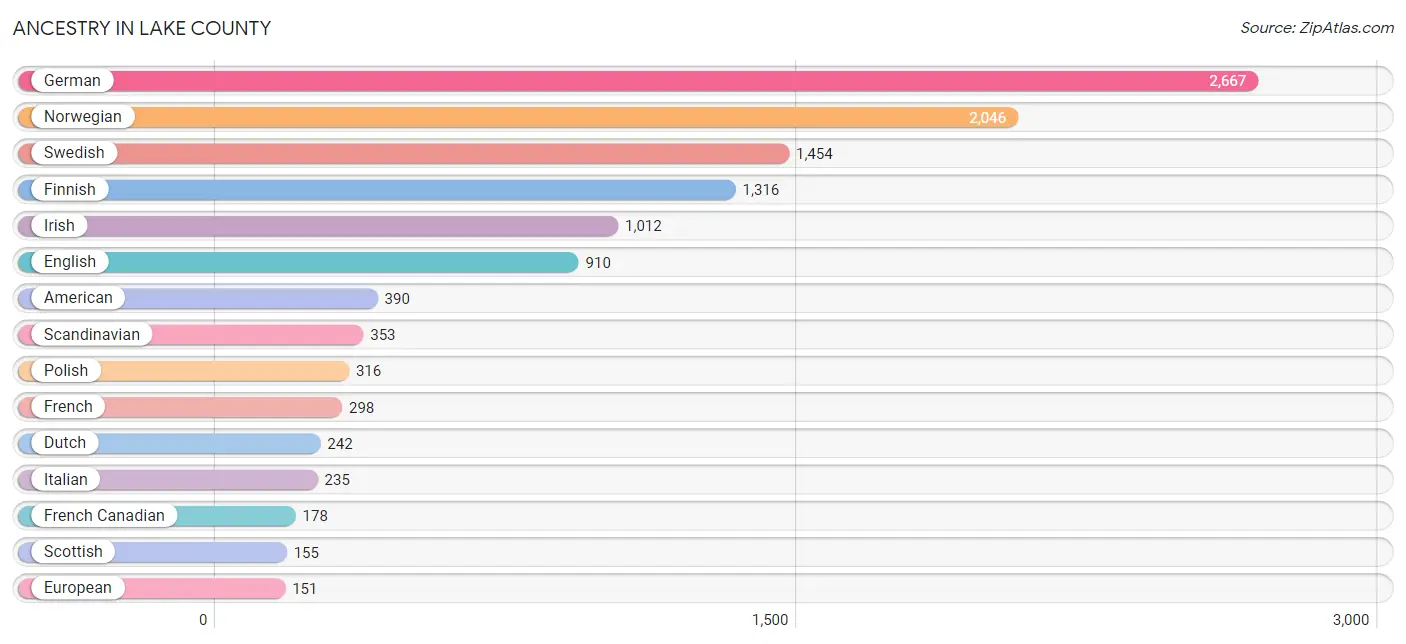
Ancestry in Lake County
The most populous ancestries reported in Lake County are German (2,667 | 24.4%), Norwegian (2,046 | 18.7%), Swedish (1,454 | 13.3%), Finnish (1,316 | 12.1%), and Irish (1,012 | 9.3%), together accounting for 77.8% of all Lake County residents.
| Ancestry | # Population | % Population |
| African | 41 | 0.4% |
| Alaska Native | 11 | 0.1% |
| American | 390 | 3.6% |
| Arab | 6 | 0.1% |
| Austrian | 55 | 0.5% |
| Belgian | 7 | 0.1% |
| Bhutanese | 5 | 0.1% |
| British | 22 | 0.2% |
| Bulgarian | 2 | 0.0% |
| Burmese | 15 | 0.1% |
| Canadian | 21 | 0.2% |
| Central American | 19 | 0.2% |
| Cherokee | 45 | 0.4% |
| Chippewa | 77 | 0.7% |
| Choctaw | 2 | 0.0% |
| Cree | 5 | 0.1% |
| Croatian | 25 | 0.2% |
| Czech | 62 | 0.6% |
| Czechoslovakian | 26 | 0.2% |
| Danish | 87 | 0.8% |
| Dutch | 242 | 2.2% |
| Eastern European | 2 | 0.0% |
| English | 910 | 8.3% |
| European | 151 | 1.4% |
| Finnish | 1,316 | 12.1% |
| French | 298 | 2.7% |
| French American Indian | 5 | 0.1% |
| French Canadian | 178 | 1.6% |
| German | 2,667 | 24.4% |
| Greek | 7 | 0.1% |
| Guatemalan | 11 | 0.1% |
| Hungarian | 4 | 0.0% |
| Icelander | 2 | 0.0% |
| Irish | 1,012 | 9.3% |
| Italian | 235 | 2.1% |
| Korean | 19 | 0.2% |
| Latvian | 3 | 0.0% |
| Lebanese | 6 | 0.1% |
| Lithuanian | 2 | 0.0% |
| Luxembourger | 22 | 0.2% |
| Mexican | 109 | 1.0% |
| Northern European | 5 | 0.1% |
| Norwegian | 2,046 | 18.7% |
| Polish | 316 | 2.9% |
| Puerto Rican | 18 | 0.2% |
| Romanian | 3 | 0.0% |
| Russian | 27 | 0.3% |
| Salvadoran | 8 | 0.1% |
| Scandinavian | 353 | 3.2% |
| Scotch-Irish | 71 | 0.6% |
| Scottish | 155 | 1.4% |
| Serbian | 8 | 0.1% |
| Slavic | 5 | 0.1% |
| Slovak | 7 | 0.1% |
| Slovene | 103 | 0.9% |
| Somali | 2 | 0.0% |
| Spaniard | 10 | 0.1% |
| Spanish | 3 | 0.0% |
| Spanish American | 11 | 0.1% |
| Sri Lankan | 10 | 0.1% |
| Subsaharan African | 47 | 0.4% |
| Swedish | 1,454 | 13.3% |
| Swiss | 31 | 0.3% |
| Ukrainian | 37 | 0.3% |
| Welsh | 51 | 0.5% |
| Yugoslavian | 3 | 0.0% |
| Yup'ik | 9 | 0.1% | View All 67 Rows |
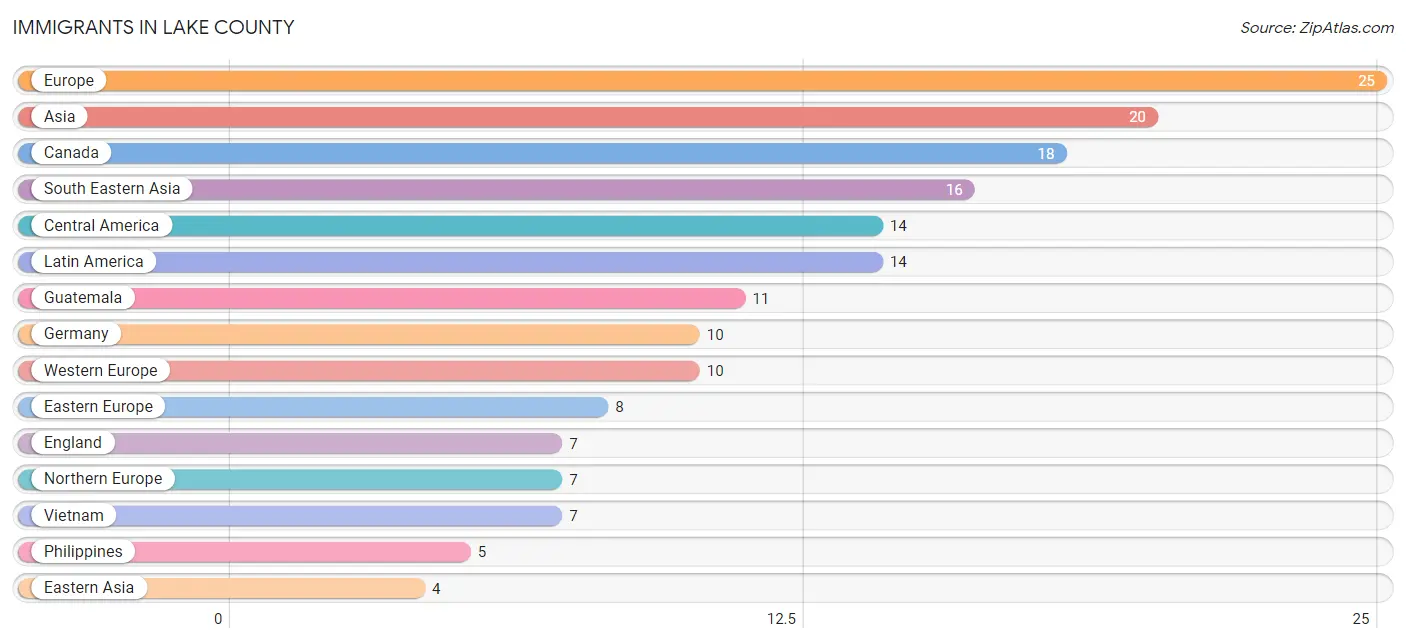
Immigrants in Lake County
The most numerous immigrant groups reported in Lake County came from Europe (25 | 0.2%), Asia (20 | 0.2%), Canada (18 | 0.2%), South Eastern Asia (16 | 0.2%), and Central America (14 | 0.1%), together accounting for 0.9% of all Lake County residents.
| Immigration Origin | # Population | % Population |
| Asia | 20 | 0.2% |
| Cambodia | 3 | 0.0% |
| Canada | 18 | 0.2% |
| Central America | 14 | 0.1% |
| Eastern Asia | 4 | 0.0% |
| Eastern Europe | 8 | 0.1% |
| England | 7 | 0.1% |
| Europe | 25 | 0.2% |
| Germany | 10 | 0.1% |
| Guatemala | 11 | 0.1% |
| Korea | 4 | 0.0% |
| Latin America | 14 | 0.1% |
| Latvia | 3 | 0.0% |
| Mexico | 3 | 0.0% |
| Northern Europe | 7 | 0.1% |
| Philippines | 5 | 0.1% |
| South Eastern Asia | 16 | 0.2% |
| Thailand | 1 | 0.0% |
| Vietnam | 7 | 0.1% |
| Western Europe | 10 | 0.1% | View All 20 Rows |
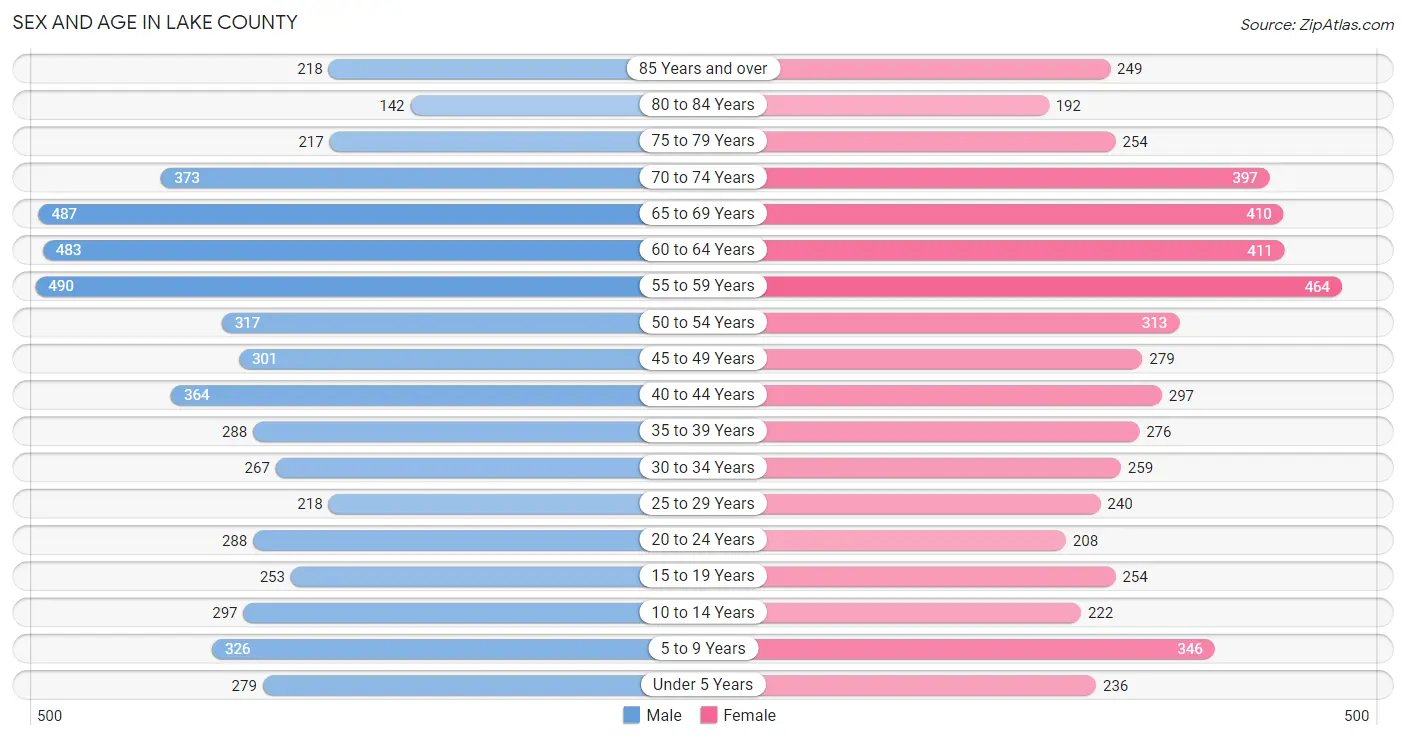
Sex and Age in Lake County
Sex and Age in Lake County
The most populous age groups in Lake County are 55 to 59 Years (490 | 8.7%) for men and 55 to 59 Years (464 | 8.7%) for women.
| Age Bracket | Male | Female |
| Under 5 Years | 279 (5.0%) | 236 (4.4%) |
| 5 to 9 Years | 326 (5.8%) | 346 (6.5%) |
| 10 to 14 Years | 297 (5.3%) | 222 (4.2%) |
| 15 to 19 Years | 253 (4.5%) | 254 (4.8%) |
| 20 to 24 Years | 288 (5.1%) | 208 (3.9%) |
| 25 to 29 Years | 218 (3.9%) | 240 (4.5%) |
| 30 to 34 Years | 267 (4.8%) | 259 (4.9%) |
| 35 to 39 Years | 288 (5.1%) | 276 (5.2%) |
| 40 to 44 Years | 364 (6.5%) | 297 (5.6%) |
| 45 to 49 Years | 301 (5.4%) | 279 (5.3%) |
| 50 to 54 Years | 317 (5.7%) | 313 (5.9%) |
| 55 to 59 Years | 490 (8.7%) | 464 (8.7%) |
| 60 to 64 Years | 483 (8.6%) | 411 (7.7%) |
| 65 to 69 Years | 487 (8.7%) | 410 (7.7%) |
| 70 to 74 Years | 373 (6.7%) | 397 (7.5%) |
| 75 to 79 Years | 217 (3.9%) | 254 (4.8%) |
| 80 to 84 Years | 142 (2.5%) | 192 (3.6%) |
| 85 Years and over | 218 (3.9%) | 249 (4.7%) |
| Total | 5,608 (100.0%) | 5,307 (100.0%) |
Families and Households in Lake County
Median Family Size in Lake County
The median family size in Lake County is 2.62 persons per family, with married-couple families (2,571 | 81.3%) accounting for the largest median family size of 2.7 persons per family. On the other hand, single female/mother families (390 | 12.3%) represent the smallest median family size with 2.18 persons per family.
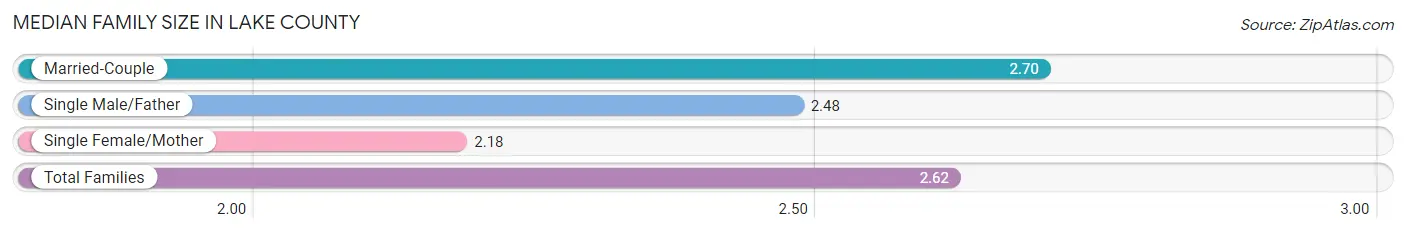
| Family Type | # Families | Family Size |
| Married-Couple | 2,571 (81.3%) | 2.70 |
| Single Male/Father | 200 (6.3%) | 2.48 |
| Single Female/Mother | 390 (12.3%) | 2.18 |
| Total Families | 3,161 (100.0%) | 2.62 |
Median Household Size in Lake County
The median household size in Lake County is 2.11 persons per household, with married-couple households (2,571 | 51.0%) accounting for the largest median household size of 2.71 persons per household. non-family households (1,875 | 37.2%) represent the smallest median household size with 1.17 persons per household.
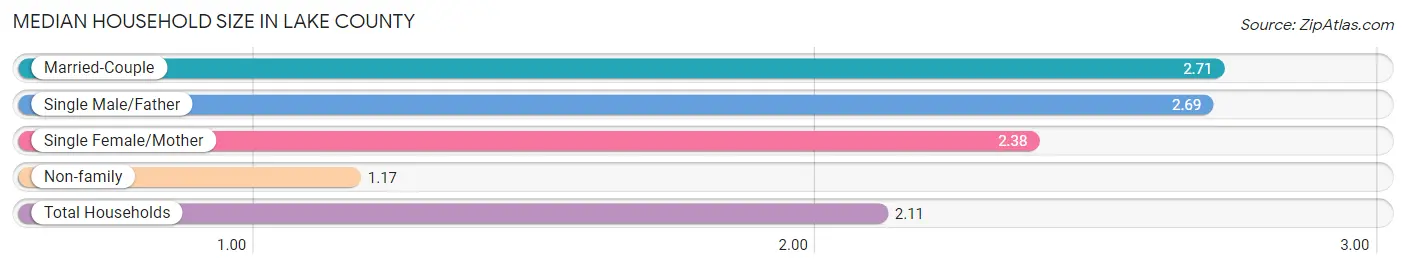
| Household Type | # Households | Household Size |
| Married-Couple | 2,571 (51.0%) | 2.71 |
| Single Male/Father | 200 (4.0%) | 2.69 |
| Single Female/Mother | 390 (7.7%) | 2.38 |
| Non-family | 1,875 (37.2%) | 1.17 |
| Total Households | 5,036 (100.0%) | 2.11 |
Household Size by Marriage Status in Lake County
Out of a total of 5,036 households in Lake County, 3,161 (62.8%) are family households, while 1,875 (37.2%) are nonfamily households. The most numerous type of family households are 2-person households, comprising 1,843, and the most common type of nonfamily households are 1-person households, comprising 1,566.

| Household Size | Family Households | Nonfamily Households |
| 1-Person Households | - | 1,566 (31.1%) |
| 2-Person Households | 1,843 (36.6%) | 299 (5.9%) |
| 3-Person Households | 543 (10.8%) | 8 (0.2%) |
| 4-Person Households | 475 (9.4%) | 2 (0.0%) |
| 5-Person Households | 132 (2.6%) | 0 (0.0%) |
| 6-Person Households | 117 (2.3%) | 0 (0.0%) |
| 7+ Person Households | 51 (1.0%) | 0 (0.0%) |
| Total | 3,161 (62.8%) | 1,875 (37.2%) |
Female Fertility in Lake County
Fertility by Age in Lake County
Average fertility rate in Lake County is 44.0 births per 1,000 women. Women in the age bracket of 20 to 34 years have the highest fertility rate with 95.0 births per 1,000 women. Women in the age bracket of 20 to 34 years acount for 79.8% of all women with births.
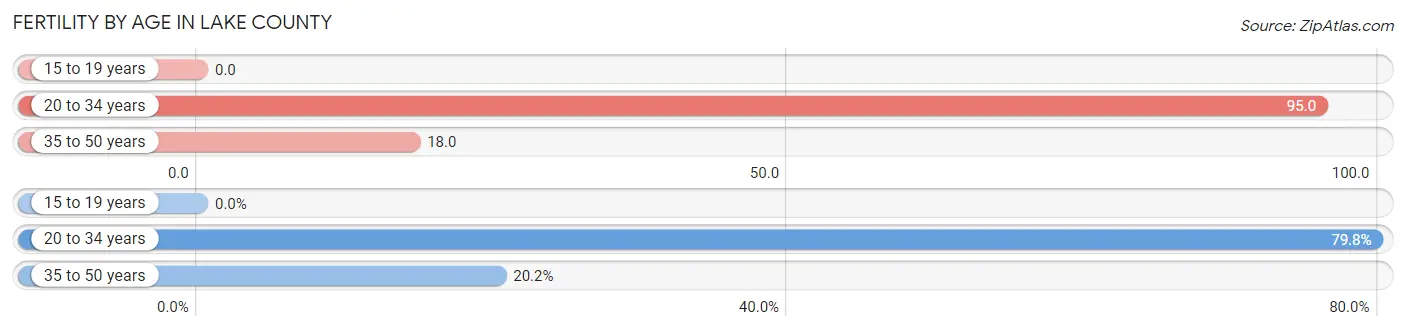
| Age Bracket | Women with Births | Births / 1,000 Women |
| 15 to 19 years | 0 (0.0%) | 0.0 |
| 20 to 34 years | 67 (79.8%) | 95.0 |
| 35 to 50 years | 17 (20.2%) | 18.0 |
| Total | 84 (100.0%) | 44.0 |
Fertility by Age by Marriage Status in Lake County
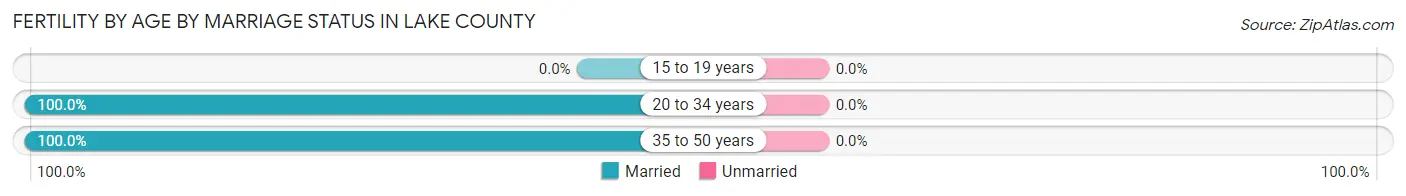
| Age Bracket | Married | Unmarried |
| 15 to 19 years | 0 (0.0%) | 0 (0.0%) |
| 20 to 34 years | 67 (100.0%) | 0 (0.0%) |
| 35 to 50 years | 17 (100.0%) | 0 (0.0%) |
| Total | 84 (100.0%) | 0 (0.0%) |
Fertility by Education in Lake County
Average fertility rate in Lake County is 44.0 births per 1,000 women. Women with the education attainment of bachelor's degree have the highest fertility rate of 55.0 births per 1,000 women, while women with the education attainment of less than high school have the lowest fertility at 13.0 births per 1,000 women. Women with the education attainment of college or associate's degree represent 48.8% of all women with births.

| Educational Attainment | Women with Births | Births / 1,000 Women |
| Less than High School | 4 (4.8%) | 13.0 |
| High School Diploma | 18 (21.4%) | 52.0 |
| College or Associate's Degree | 41 (48.8%) | 48.0 |
| Bachelor's Degree | 17 (20.2%) | 55.0 |
| Graduate Degree | 4 (4.8%) | 34.0 |
| Total | 84 (100.0%) | 44.0 |
Fertility by Education by Marriage Status in Lake County
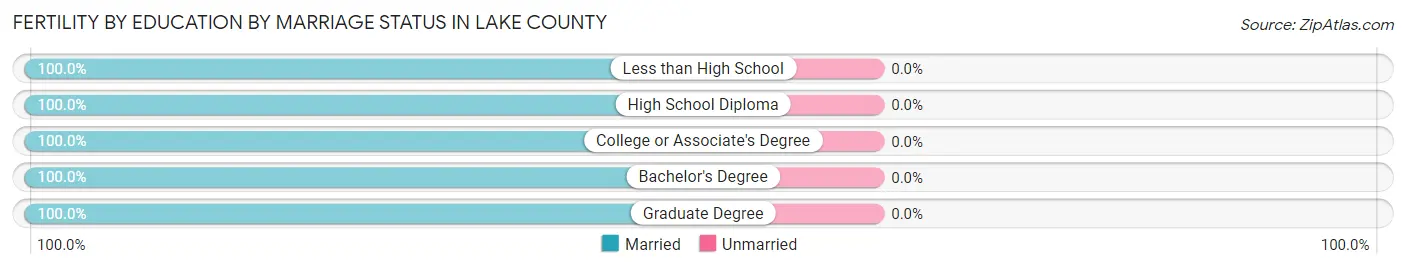
| Educational Attainment | Married | Unmarried |
| Less than High School | 4 (100.0%) | 0 (0.0%) |
| High School Diploma | 18 (100.0%) | 0 (0.0%) |
| College or Associate's Degree | 41 (100.0%) | 0 (0.0%) |
| Bachelor's Degree | 17 (100.0%) | 0 (0.0%) |
| Graduate Degree | 4 (100.0%) | 0 (0.0%) |
| Total | 84 (100.0%) | 0 (0.0%) |
Employment Characteristics in Lake County
Employment by Class of Employer in Lake County
Among the 4,850 employed individuals in Lake County, private company employees (3,083 | 63.6%), not-for-profit organizations (482 | 9.9%), and local government employees (397 | 8.2%) make up the most common classes of employment.
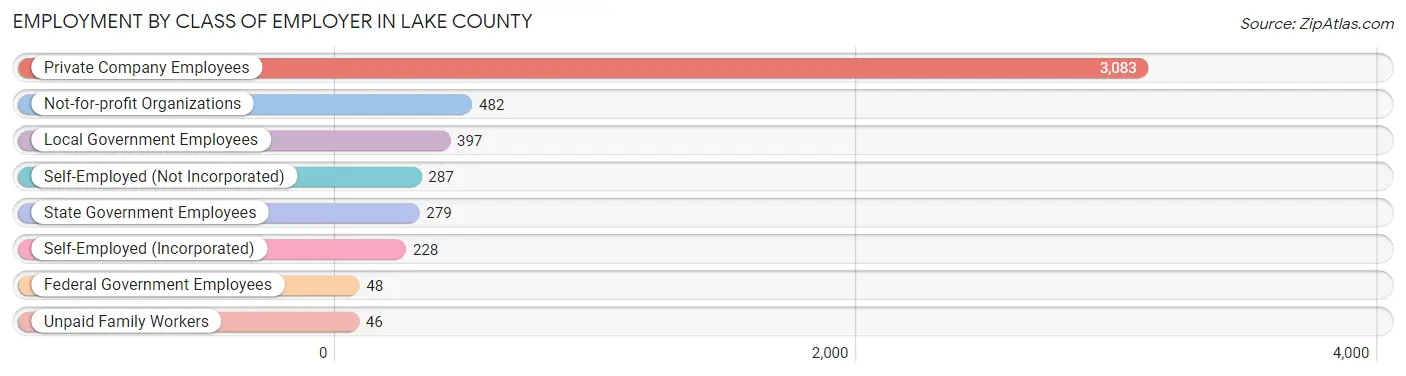
| Employer Class | # Employees | % Employees |
| Private Company Employees | 3,083 | 63.6% |
| Self-Employed (Incorporated) | 228 | 4.7% |
| Self-Employed (Not Incorporated) | 287 | 5.9% |
| Not-for-profit Organizations | 482 | 9.9% |
| Local Government Employees | 397 | 8.2% |
| State Government Employees | 279 | 5.8% |
| Federal Government Employees | 48 | 1.0% |
| Unpaid Family Workers | 46 | 0.9% |
| Total | 4,850 | 100.0% |
Employment Status by Age in Lake County
According to the labor force statistics for Lake County, out of the total population over 16 years of age (9,099), 55.7% or 5,068 individuals are in the labor force, with 2.8% or 142 of them unemployed. The age group with the highest labor force participation rate is 20 to 24 years, with 88.3% or 438 individuals in the labor force. Within the labor force, the 25 to 29 years age range has the highest percentage of unemployed individuals, with 11.1% or 38 of them being unemployed.
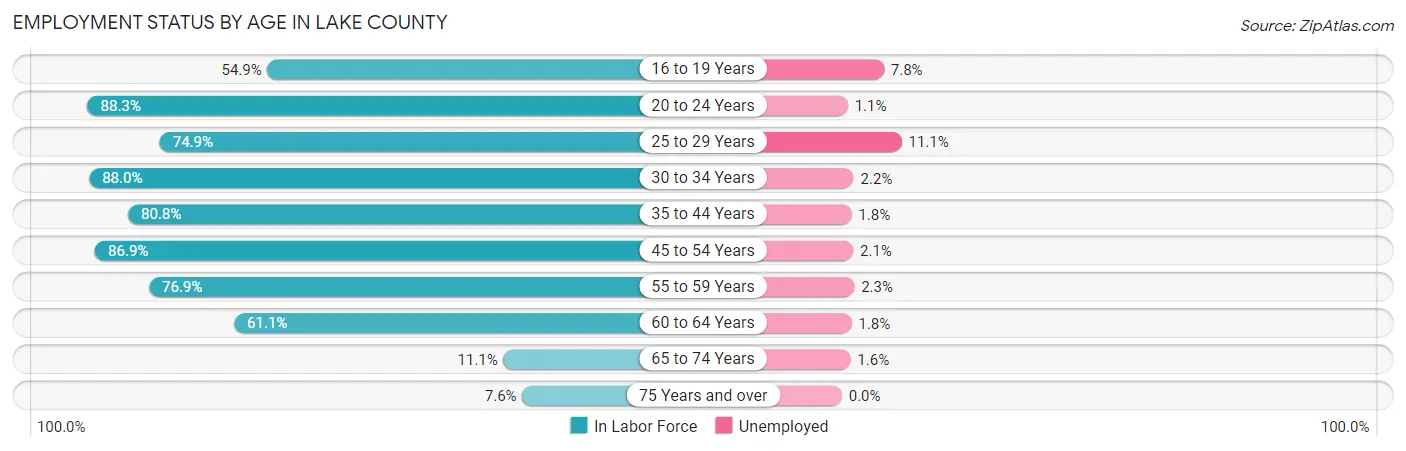
| Age Bracket | In Labor Force | Unemployed |
| 16 to 19 Years | 218 (54.9%) | 17 (7.8%) |
| 20 to 24 Years | 438 (88.3%) | 5 (1.1%) |
| 25 to 29 Years | 343 (74.9%) | 38 (11.1%) |
| 30 to 34 Years | 463 (88.0%) | 10 (2.2%) |
| 35 to 44 Years | 990 (80.8%) | 18 (1.8%) |
| 45 to 54 Years | 1,051 (86.9%) | 22 (2.1%) |
| 55 to 59 Years | 734 (76.9%) | 17 (2.3%) |
| 60 to 64 Years | 546 (61.1%) | 10 (1.8%) |
| 65 to 74 Years | 185 (11.1%) | 3 (1.6%) |
| 75 Years and over | 97 (7.6%) | 0 (0.0%) |
| Total | 5,068 (55.7%) | 142 (2.8%) |
Employment Status by Educational Attainment in Lake County
According to labor force statistics for Lake County, 78.4% of individuals (4,129) out of the total population between 25 and 64 years of age (5,267) are in the labor force, with 2.8% or 116 of them being unemployed. The group with the highest labor force participation rate are those with the educational attainment of bachelor's degree or higher, with 85.4% or 1,128 individuals in the labor force. Within the labor force, individuals with high school diploma education have the highest percentage of unemployment, with 4.2% or 44 of them being unemployed.
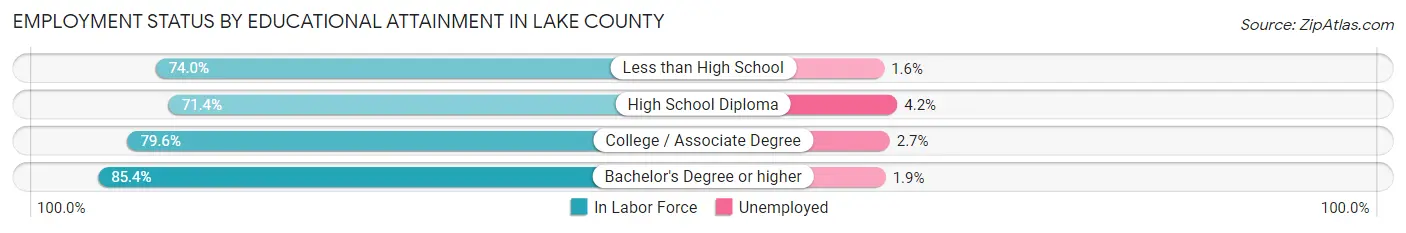
| Educational Attainment | In Labor Force | Unemployed |
| Less than High School | 256 (74.0%) | 6 (1.6%) |
| High School Diploma | 1,059 (71.4%) | 62 (4.2%) |
| College / Associate Degree | 1,685 (79.6%) | 57 (2.7%) |
| Bachelor's Degree or higher | 1,128 (85.4%) | 25 (1.9%) |
| Total | 4,129 (78.4%) | 147 (2.8%) |
Employment Occupations by Sex in Lake County
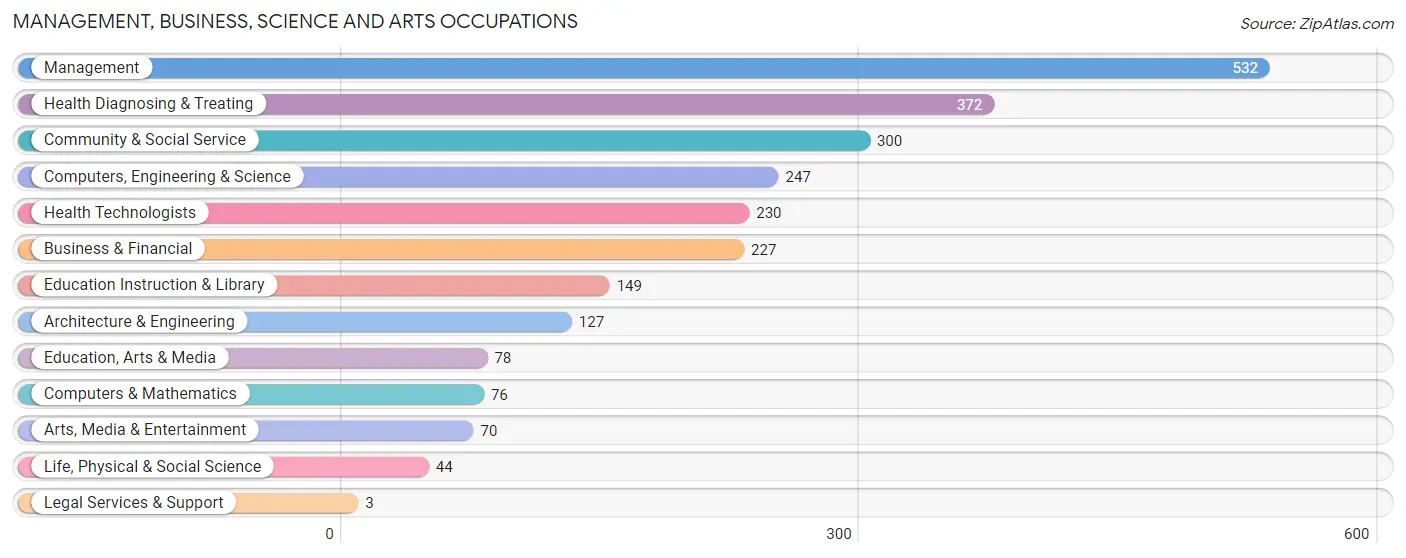
Management, Business, Science and Arts Occupations
The most common Management, Business, Science and Arts occupations in Lake County are Management (532 | 10.8%), Health Diagnosing & Treating (372 | 7.5%), Community & Social Service (300 | 6.1%), Computers, Engineering & Science (247 | 5.0%), and Health Technologists (230 | 4.7%).
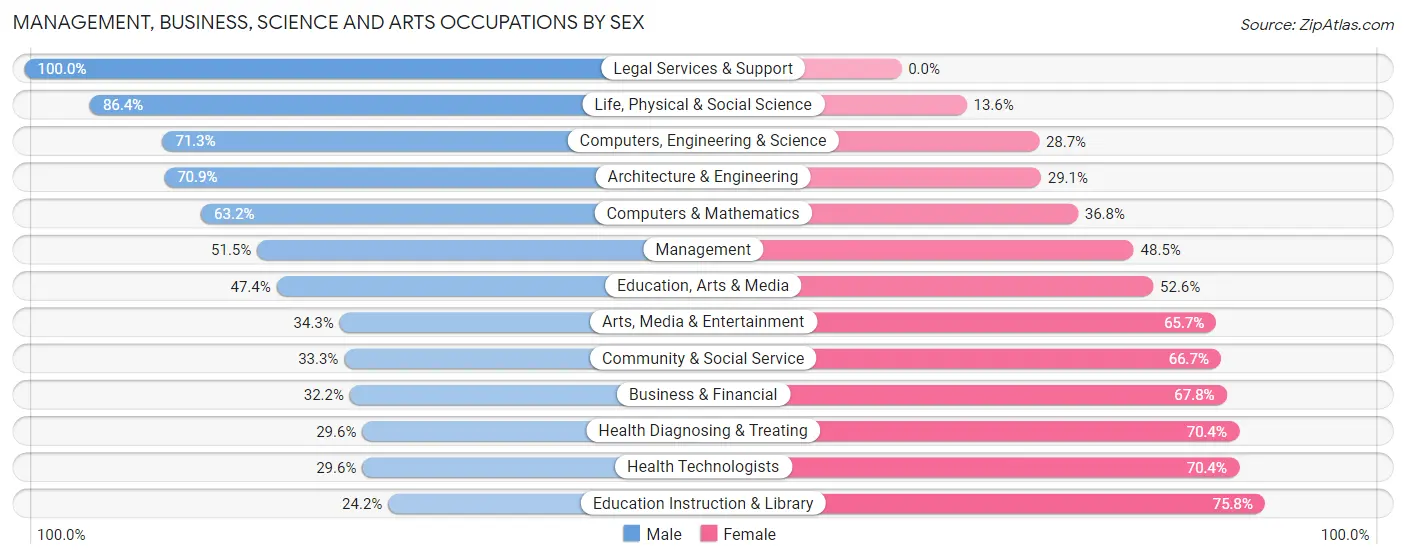
Management, Business, Science and Arts Occupations by Sex
Within the Management, Business, Science and Arts occupations in Lake County, the most male-oriented occupations are Legal Services & Support (100.0%), Life, Physical & Social Science (86.4%), and Computers, Engineering & Science (71.3%), while the most female-oriented occupations are Education Instruction & Library (75.8%), Health Diagnosing & Treating (70.4%), and Health Technologists (70.4%).
| Occupation | Male | Female |
| Management | 274 (51.5%) | 258 (48.5%) |
| Business & Financial | 73 (32.2%) | 154 (67.8%) |
| Computers, Engineering & Science | 176 (71.3%) | 71 (28.7%) |
| Computers & Mathematics | 48 (63.2%) | 28 (36.8%) |
| Architecture & Engineering | 90 (70.9%) | 37 (29.1%) |
| Life, Physical & Social Science | 38 (86.4%) | 6 (13.6%) |
| Community & Social Service | 100 (33.3%) | 200 (66.7%) |
| Education, Arts & Media | 37 (47.4%) | 41 (52.6%) |
| Legal Services & Support | 3 (100.0%) | 0 (0.0%) |
| Education Instruction & Library | 36 (24.2%) | 113 (75.8%) |
| Arts, Media & Entertainment | 24 (34.3%) | 46 (65.7%) |
| Health Diagnosing & Treating | 110 (29.6%) | 262 (70.4%) |
| Health Technologists | 68 (29.6%) | 162 (70.4%) |
| Total (Category) | 733 (43.7%) | 945 (56.3%) |
| Total (Overall) | 2,742 (55.7%) | 2,184 (44.3%) |
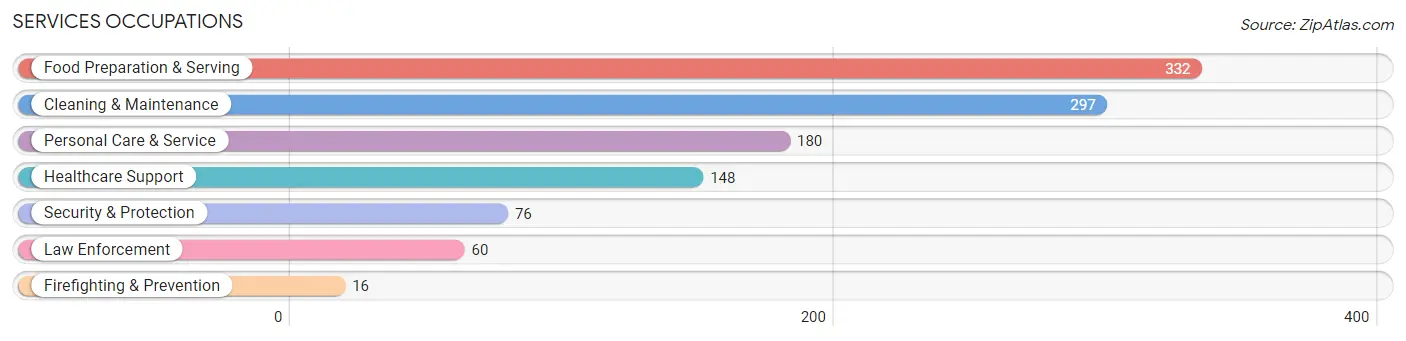
Services Occupations
The most common Services occupations in Lake County are Food Preparation & Serving (332 | 6.7%), Cleaning & Maintenance (297 | 6.0%), Personal Care & Service (180 | 3.6%), Healthcare Support (148 | 3.0%), and Security & Protection (76 | 1.5%).
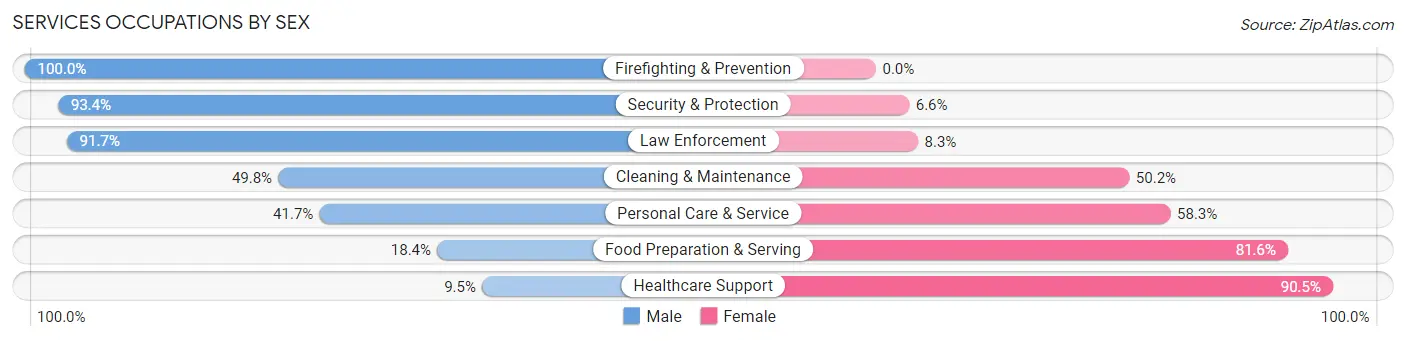
Services Occupations by Sex
Within the Services occupations in Lake County, the most male-oriented occupations are Firefighting & Prevention (100.0%), Security & Protection (93.4%), and Law Enforcement (91.7%), while the most female-oriented occupations are Healthcare Support (90.5%), Food Preparation & Serving (81.6%), and Personal Care & Service (58.3%).
| Occupation | Male | Female |
| Healthcare Support | 14 (9.5%) | 134 (90.5%) |
| Security & Protection | 71 (93.4%) | 5 (6.6%) |
| Firefighting & Prevention | 16 (100.0%) | 0 (0.0%) |
| Law Enforcement | 55 (91.7%) | 5 (8.3%) |
| Food Preparation & Serving | 61 (18.4%) | 271 (81.6%) |
| Cleaning & Maintenance | 148 (49.8%) | 149 (50.2%) |
| Personal Care & Service | 75 (41.7%) | 105 (58.3%) |
| Total (Category) | 369 (35.7%) | 664 (64.3%) |
| Total (Overall) | 2,742 (55.7%) | 2,184 (44.3%) |
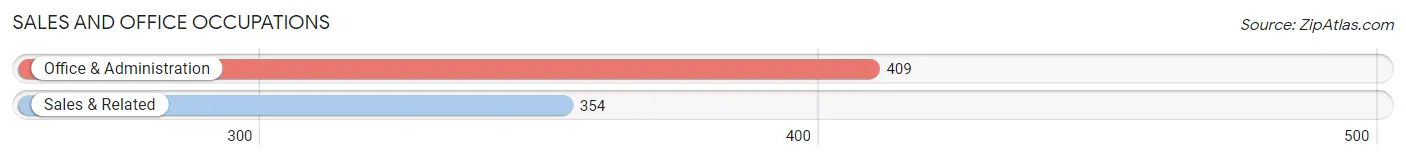
Sales and Office Occupations
The most common Sales and Office occupations in Lake County are Office & Administration (409 | 8.3%), and Sales & Related (354 | 7.2%).
Sales and Office Occupations by Sex
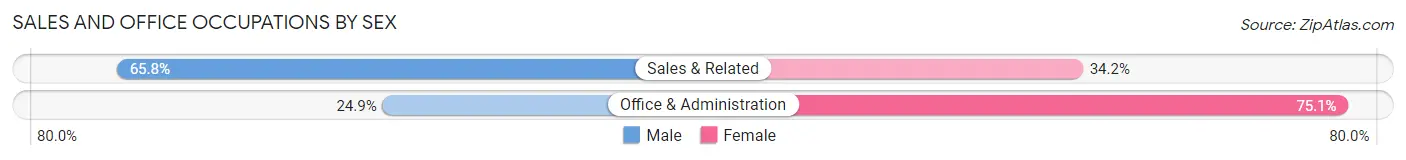
| Occupation | Male | Female |
| Sales & Related | 233 (65.8%) | 121 (34.2%) |
| Office & Administration | 102 (24.9%) | 307 (75.1%) |
| Total (Category) | 335 (43.9%) | 428 (56.1%) |
| Total (Overall) | 2,742 (55.7%) | 2,184 (44.3%) |
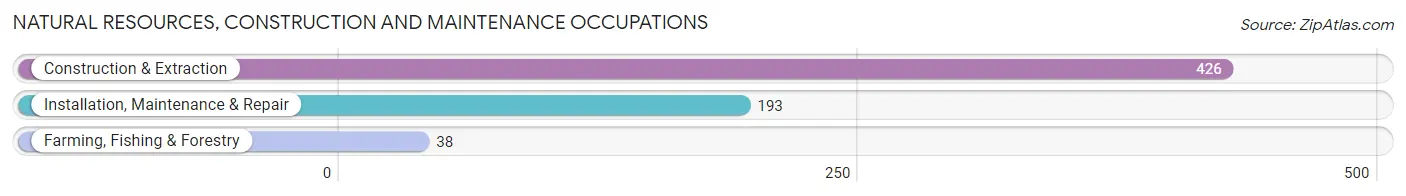
Natural Resources, Construction and Maintenance Occupations
The most common Natural Resources, Construction and Maintenance occupations in Lake County are Construction & Extraction (426 | 8.6%), Installation, Maintenance & Repair (193 | 3.9%), and Farming, Fishing & Forestry (38 | 0.8%).
Natural Resources, Construction and Maintenance Occupations by Sex
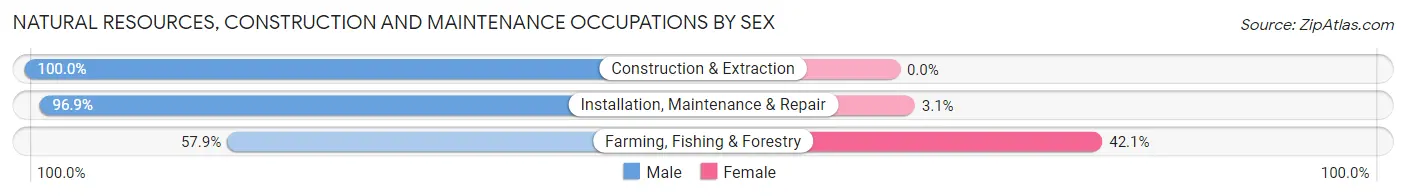
| Occupation | Male | Female |
| Farming, Fishing & Forestry | 22 (57.9%) | 16 (42.1%) |
| Construction & Extraction | 426 (100.0%) | 0 (0.0%) |
| Installation, Maintenance & Repair | 187 (96.9%) | 6 (3.1%) |
| Total (Category) | 635 (96.7%) | 22 (3.4%) |
| Total (Overall) | 2,742 (55.7%) | 2,184 (44.3%) |
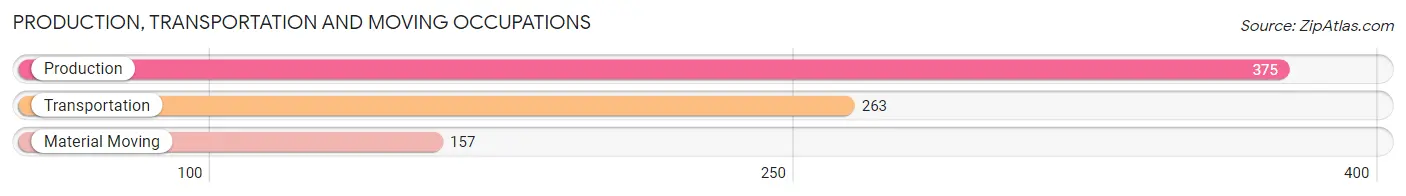
Production, Transportation and Moving Occupations
The most common Production, Transportation and Moving occupations in Lake County are Production (375 | 7.6%), Transportation (263 | 5.3%), and Material Moving (157 | 3.2%).
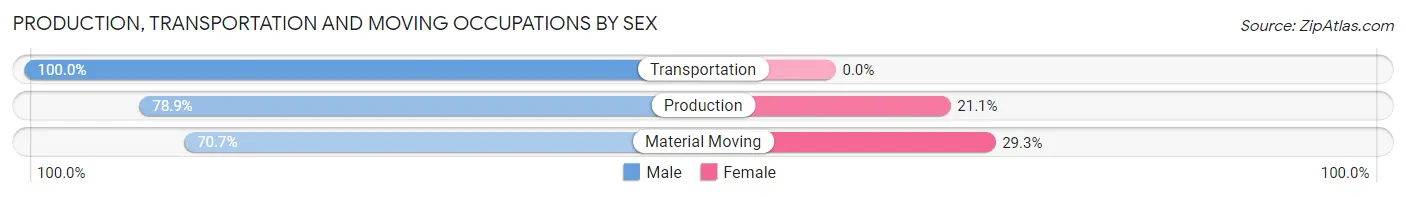
Production, Transportation and Moving Occupations by Sex
| Occupation | Male | Female |
| Production | 296 (78.9%) | 79 (21.1%) |
| Transportation | 263 (100.0%) | 0 (0.0%) |
| Material Moving | 111 (70.7%) | 46 (29.3%) |
| Total (Category) | 670 (84.3%) | 125 (15.7%) |
| Total (Overall) | 2,742 (55.7%) | 2,184 (44.3%) |
Employment Industries by Sex in Lake County
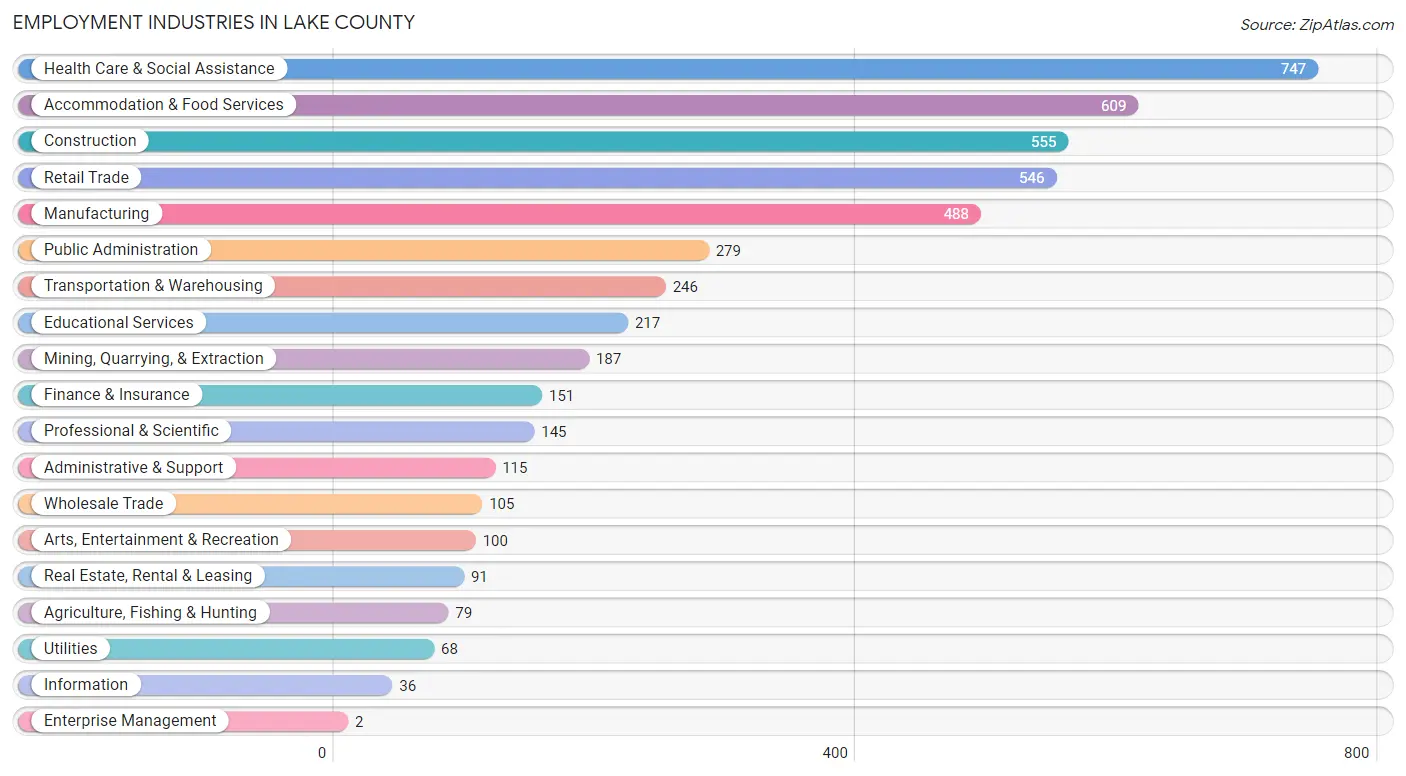
Employment Industries in Lake County
The major employment industries in Lake County include Health Care & Social Assistance (747 | 15.2%), Accommodation & Food Services (609 | 12.4%), Construction (555 | 11.3%), Retail Trade (546 | 11.1%), and Manufacturing (488 | 9.9%).
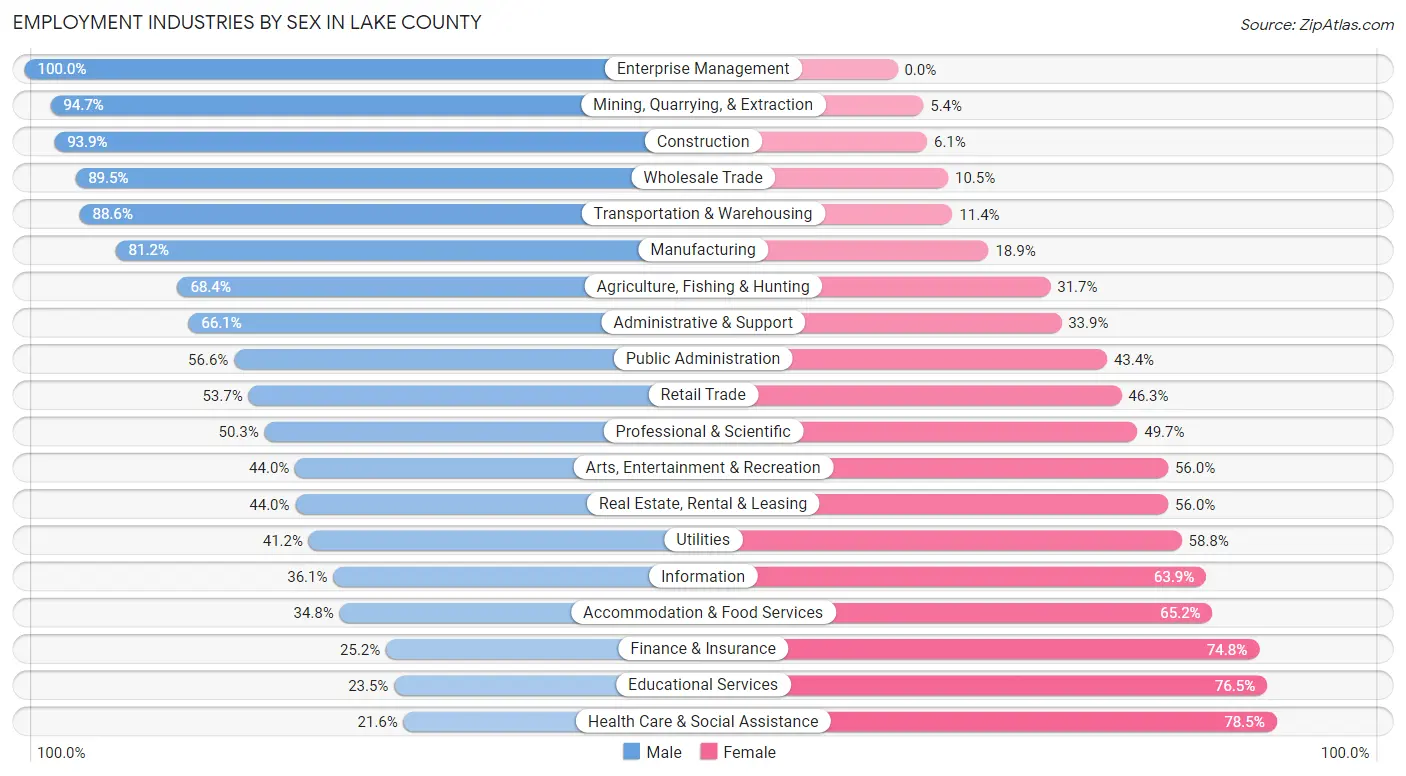
Employment Industries by Sex in Lake County
The Lake County industries that see more men than women are Enterprise Management (100.0%), Mining, Quarrying, & Extraction (94.7%), and Construction (93.9%), whereas the industries that tend to have a higher number of women are Health Care & Social Assistance (78.4%), Educational Services (76.5%), and Finance & Insurance (74.8%).
| Industry | Male | Female |
| Agriculture, Fishing & Hunting | 54 (68.3%) | 25 (31.7%) |
| Mining, Quarrying, & Extraction | 177 (94.7%) | 10 (5.3%) |
| Construction | 521 (93.9%) | 34 (6.1%) |
| Manufacturing | 396 (81.1%) | 92 (18.9%) |
| Wholesale Trade | 94 (89.5%) | 11 (10.5%) |
| Retail Trade | 293 (53.7%) | 253 (46.3%) |
| Transportation & Warehousing | 218 (88.6%) | 28 (11.4%) |
| Utilities | 28 (41.2%) | 40 (58.8%) |
| Information | 13 (36.1%) | 23 (63.9%) |
| Finance & Insurance | 38 (25.2%) | 113 (74.8%) |
| Real Estate, Rental & Leasing | 40 (44.0%) | 51 (56.0%) |
| Professional & Scientific | 73 (50.3%) | 72 (49.7%) |
| Enterprise Management | 2 (100.0%) | 0 (0.0%) |
| Administrative & Support | 76 (66.1%) | 39 (33.9%) |
| Educational Services | 51 (23.5%) | 166 (76.5%) |
| Health Care & Social Assistance | 161 (21.5%) | 586 (78.4%) |
| Arts, Entertainment & Recreation | 44 (44.0%) | 56 (56.0%) |
| Accommodation & Food Services | 212 (34.8%) | 397 (65.2%) |
| Public Administration | 158 (56.6%) | 121 (43.4%) |
| Total | 2,742 (55.7%) | 2,184 (44.3%) |
Education in Lake County
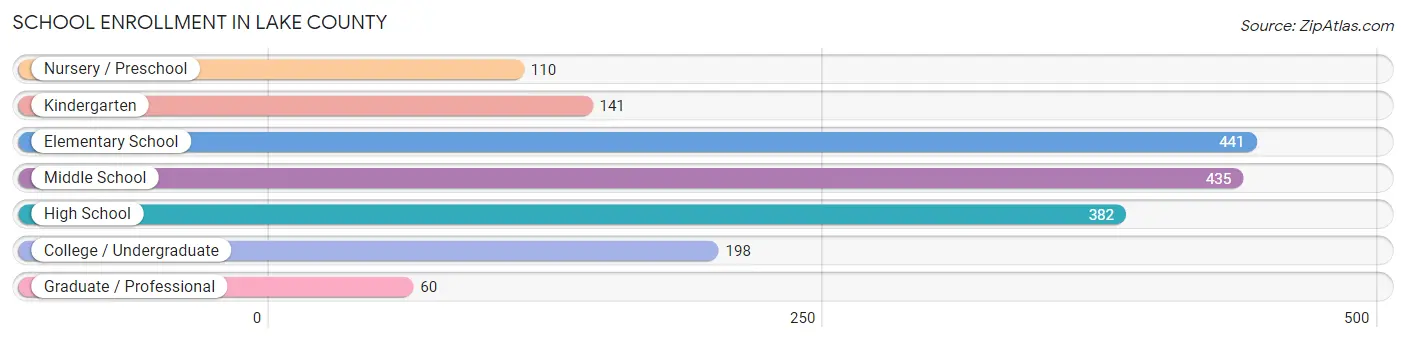
School Enrollment in Lake County
The most common levels of schooling among the 1,767 students in Lake County are elementary school (441 | 25.0%), middle school (435 | 24.6%), and high school (382 | 21.6%).
| School Level | # Students | % Students |
| Nursery / Preschool | 110 | 6.2% |
| Kindergarten | 141 | 8.0% |
| Elementary School | 441 | 25.0% |
| Middle School | 435 | 24.6% |
| High School | 382 | 21.6% |
| College / Undergraduate | 198 | 11.2% |
| Graduate / Professional | 60 | 3.4% |
| Total | 1,767 | 100.0% |
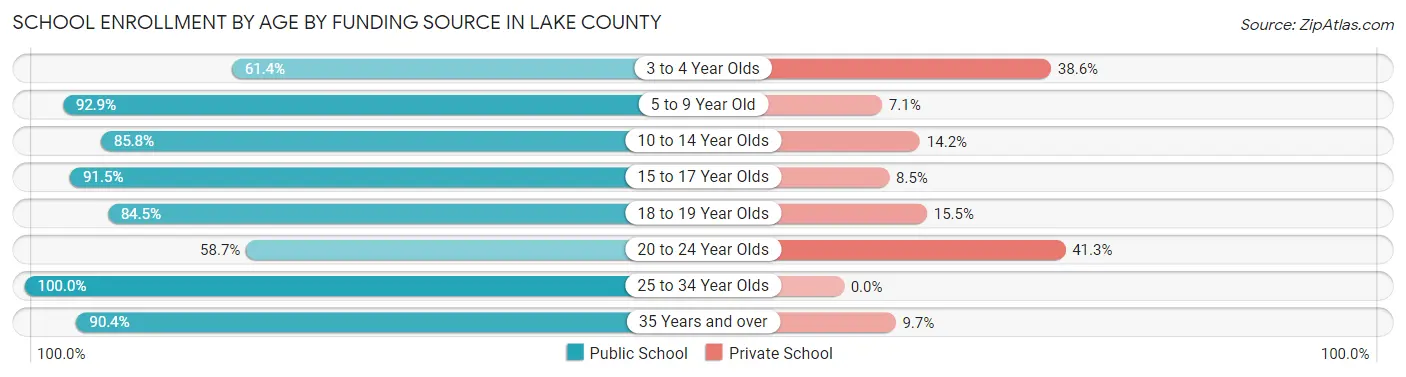
School Enrollment by Age by Funding Source in Lake County
Out of a total of 1,767 students who are enrolled in schools in Lake County, 209 (11.8%) attend a private institution, while the remaining 1,558 (88.2%) are enrolled in public schools. The age group of 20 to 24 year olds has the highest likelihood of being enrolled in private schools, with 26 (41.3% in the age bracket) enrolled. Conversely, the age group of 25 to 34 year olds has the lowest likelihood of being enrolled in a private school, with 60 (100.0% in the age bracket) attending a public institution.
| Age Bracket | Public School | Private School |
| 3 to 4 Year Olds | 35 (61.4%) | 22 (38.6%) |
| 5 to 9 Year Old | 561 (92.9%) | 43 (7.1%) |
| 10 to 14 Year Olds | 411 (85.8%) | 68 (14.2%) |
| 15 to 17 Year Olds | 292 (91.5%) | 27 (8.5%) |
| 18 to 19 Year Olds | 60 (84.5%) | 11 (15.5%) |
| 20 to 24 Year Olds | 37 (58.7%) | 26 (41.3%) |
| 25 to 34 Year Olds | 60 (100.0%) | 0 (0.0%) |
| 35 Years and over | 103 (90.3%) | 11 (9.7%) |
| Total | 1,558 (88.2%) | 209 (11.8%) |
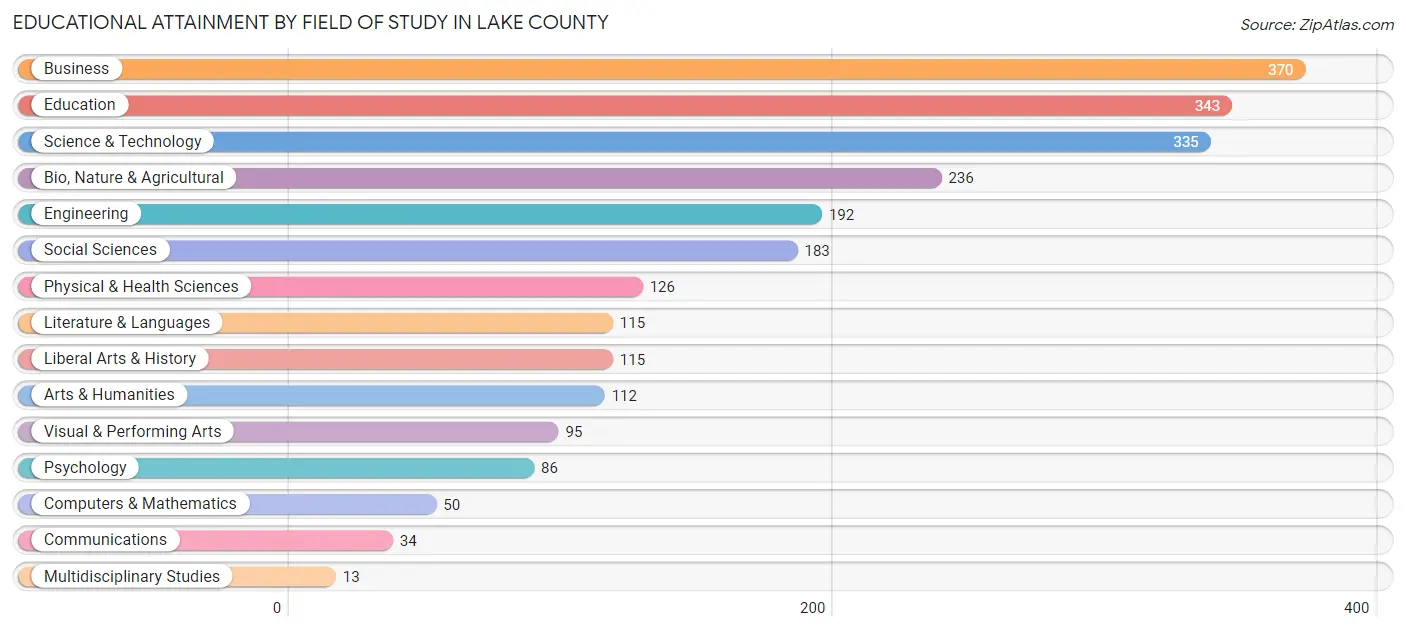
Educational Attainment by Field of Study in Lake County
Business (370 | 15.4%), education (343 | 14.3%), science & technology (335 | 13.9%), bio, nature & agricultural (236 | 9.8%), and engineering (192 | 8.0%) are the most common fields of study among 2,405 individuals in Lake County who have obtained a bachelor's degree or higher.
| Field of Study | # Graduates | % Graduates |
| Computers & Mathematics | 50 | 2.1% |
| Bio, Nature & Agricultural | 236 | 9.8% |
| Physical & Health Sciences | 126 | 5.2% |
| Psychology | 86 | 3.6% |
| Social Sciences | 183 | 7.6% |
| Engineering | 192 | 8.0% |
| Multidisciplinary Studies | 13 | 0.5% |
| Science & Technology | 335 | 13.9% |
| Business | 370 | 15.4% |
| Education | 343 | 14.3% |
| Literature & Languages | 115 | 4.8% |
| Liberal Arts & History | 115 | 4.8% |
| Visual & Performing Arts | 95 | 4.0% |
| Communications | 34 | 1.4% |
| Arts & Humanities | 112 | 4.7% |
| Total | 2,405 | 100.0% |
Transportation & Commute in Lake County
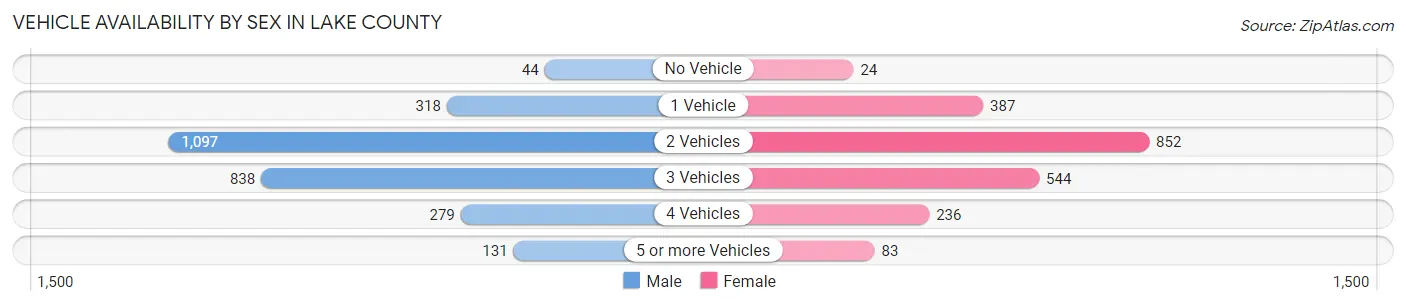
Vehicle Availability by Sex in Lake County
The most prevalent vehicle ownership categories in Lake County are males with 2 vehicles (1,097, accounting for 40.5%) and females with 2 vehicles (852, making up 51.6%).
| Vehicles Available | Male | Female |
| No Vehicle | 44 (1.6%) | 24 (1.1%) |
| 1 Vehicle | 318 (11.7%) | 387 (18.2%) |
| 2 Vehicles | 1,097 (40.5%) | 852 (40.1%) |
| 3 Vehicles | 838 (31.0%) | 544 (25.6%) |
| 4 Vehicles | 279 (10.3%) | 236 (11.1%) |
| 5 or more Vehicles | 131 (4.8%) | 83 (3.9%) |
| Total | 2,707 (100.0%) | 2,126 (100.0%) |
Commute Time in Lake County
The most frequently occuring commute durations in Lake County are 5 to 9 minutes (922 commuters, 21.4%), 10 to 14 minutes (557 commuters, 12.9%), and 15 to 19 minutes (430 commuters, 10.0%).
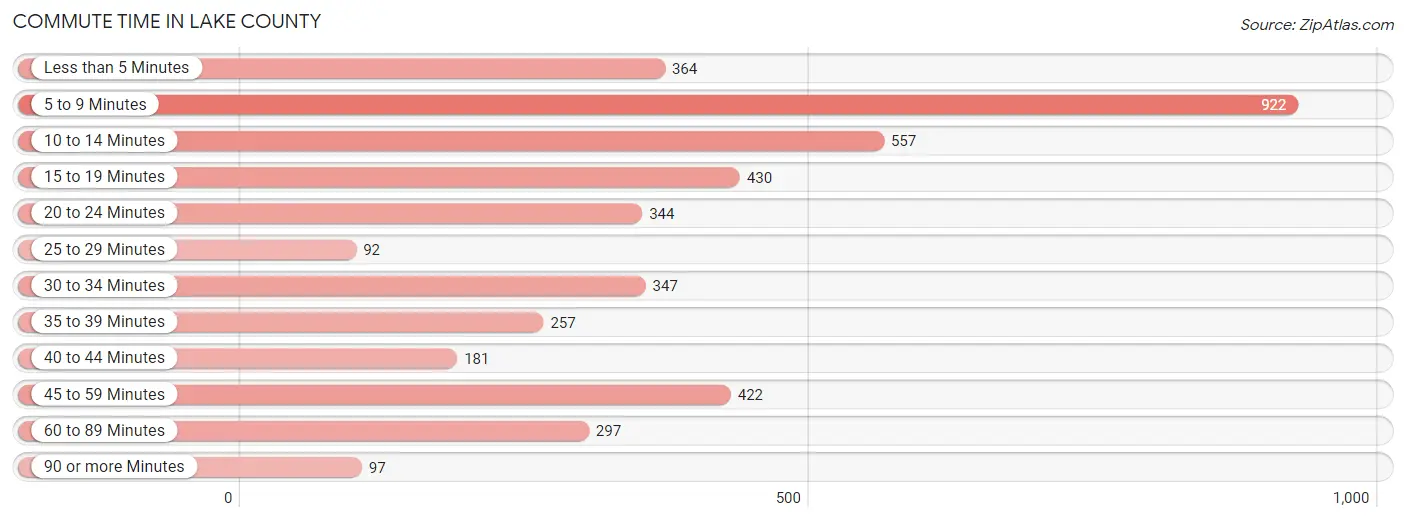
| Commute Time | # Commuters | % Commuters |
| Less than 5 Minutes | 364 | 8.5% |
| 5 to 9 Minutes | 922 | 21.4% |
| 10 to 14 Minutes | 557 | 12.9% |
| 15 to 19 Minutes | 430 | 10.0% |
| 20 to 24 Minutes | 344 | 8.0% |
| 25 to 29 Minutes | 92 | 2.1% |
| 30 to 34 Minutes | 347 | 8.1% |
| 35 to 39 Minutes | 257 | 6.0% |
| 40 to 44 Minutes | 181 | 4.2% |
| 45 to 59 Minutes | 422 | 9.8% |
| 60 to 89 Minutes | 297 | 6.9% |
| 90 or more Minutes | 97 | 2.2% |
Commute Time by Sex in Lake County
The most common commute times in Lake County are 5 to 9 minutes (511 commuters, 20.9%) for males and 5 to 9 minutes (411 commuters, 22.0%) for females.
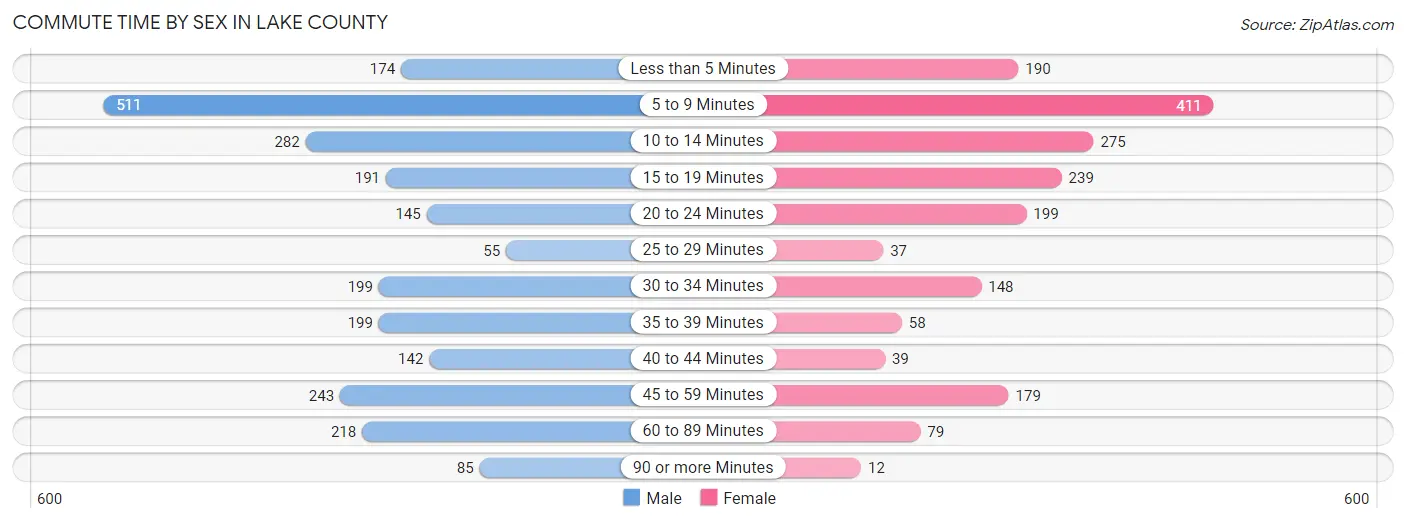
| Commute Time | Male | Female |
| Less than 5 Minutes | 174 (7.1%) | 190 (10.2%) |
| 5 to 9 Minutes | 511 (20.9%) | 411 (22.0%) |
| 10 to 14 Minutes | 282 (11.5%) | 275 (14.7%) |
| 15 to 19 Minutes | 191 (7.8%) | 239 (12.8%) |
| 20 to 24 Minutes | 145 (5.9%) | 199 (10.7%) |
| 25 to 29 Minutes | 55 (2.2%) | 37 (2.0%) |
| 30 to 34 Minutes | 199 (8.1%) | 148 (7.9%) |
| 35 to 39 Minutes | 199 (8.1%) | 58 (3.1%) |
| 40 to 44 Minutes | 142 (5.8%) | 39 (2.1%) |
| 45 to 59 Minutes | 243 (9.9%) | 179 (9.6%) |
| 60 to 89 Minutes | 218 (8.9%) | 79 (4.2%) |
| 90 or more Minutes | 85 (3.5%) | 12 (0.6%) |
Time of Departure to Work by Sex in Lake County
The most frequent times of departure to work in Lake County are 6:30 AM to 6:59 AM (370, 15.1%) for males and 7:30 AM to 7:59 AM (462, 24.8%) for females.
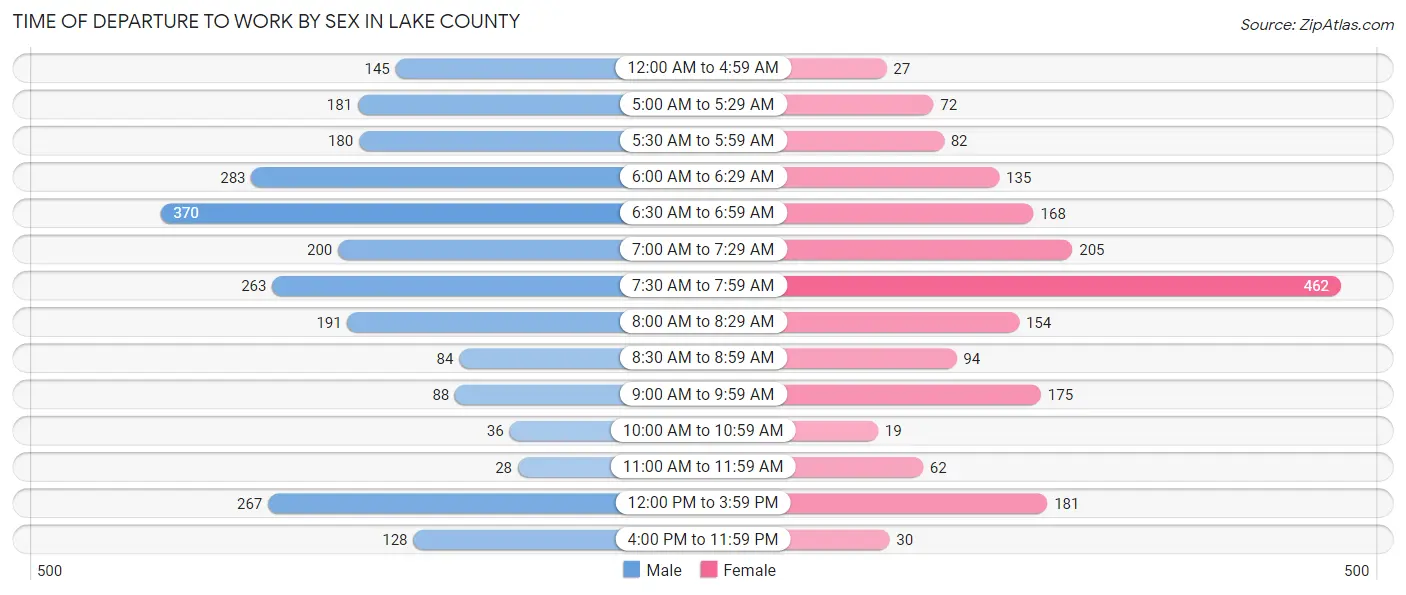
| Time of Departure | Male | Female |
| 12:00 AM to 4:59 AM | 145 (5.9%) | 27 (1.5%) |
| 5:00 AM to 5:29 AM | 181 (7.4%) | 72 (3.9%) |
| 5:30 AM to 5:59 AM | 180 (7.4%) | 82 (4.4%) |
| 6:00 AM to 6:29 AM | 283 (11.6%) | 135 (7.2%) |
| 6:30 AM to 6:59 AM | 370 (15.1%) | 168 (9.0%) |
| 7:00 AM to 7:29 AM | 200 (8.2%) | 205 (11.0%) |
| 7:30 AM to 7:59 AM | 263 (10.8%) | 462 (24.8%) |
| 8:00 AM to 8:29 AM | 191 (7.8%) | 154 (8.3%) |
| 8:30 AM to 8:59 AM | 84 (3.4%) | 94 (5.0%) |
| 9:00 AM to 9:59 AM | 88 (3.6%) | 175 (9.4%) |
| 10:00 AM to 10:59 AM | 36 (1.5%) | 19 (1.0%) |
| 11:00 AM to 11:59 AM | 28 (1.1%) | 62 (3.3%) |
| 12:00 PM to 3:59 PM | 267 (10.9%) | 181 (9.7%) |
| 4:00 PM to 11:59 PM | 128 (5.2%) | 30 (1.6%) |
| Total | 2,444 (100.0%) | 1,866 (100.0%) |
Housing Occupancy in Lake County
Occupancy by Ownership in Lake County
Of the total 5,036 dwellings in Lake County, owner-occupied units account for 4,182 (83.0%), while renter-occupied units make up 854 (17.0%).
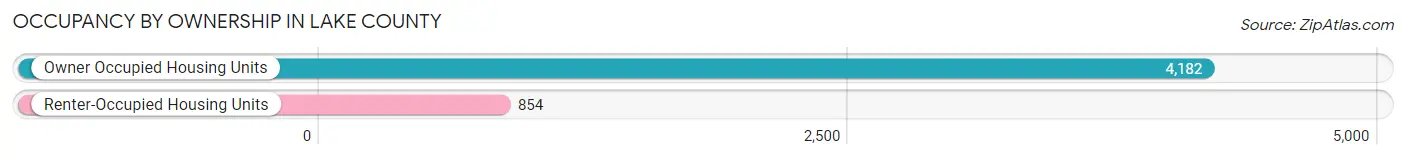
| Occupancy | # Housing Units | % Housing Units |
| Owner Occupied Housing Units | 4,182 | 83.0% |
| Renter-Occupied Housing Units | 854 | 17.0% |
| Total Occupied Housing Units | 5,036 | 100.0% |
Occupancy by Household Size in Lake County
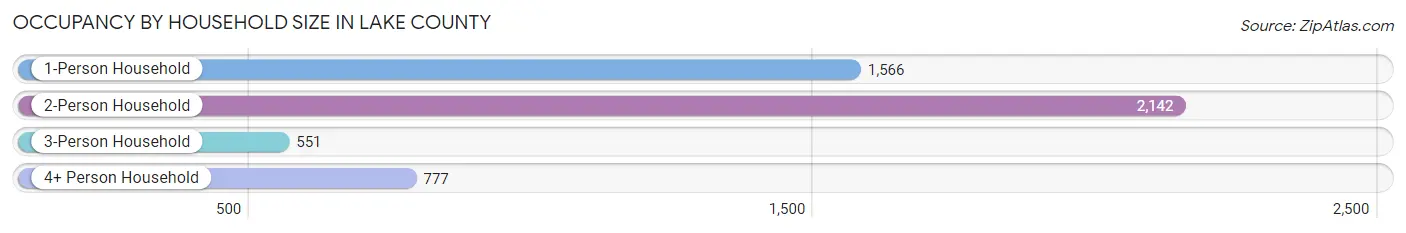
| Household Size | # Housing Units | % Housing Units |
| 1-Person Household | 1,566 | 31.1% |
| 2-Person Household | 2,142 | 42.5% |
| 3-Person Household | 551 | 10.9% |
| 4+ Person Household | 777 | 15.4% |
| Total Housing Units | 5,036 | 100.0% |
Occupancy by Ownership by Household Size in Lake County
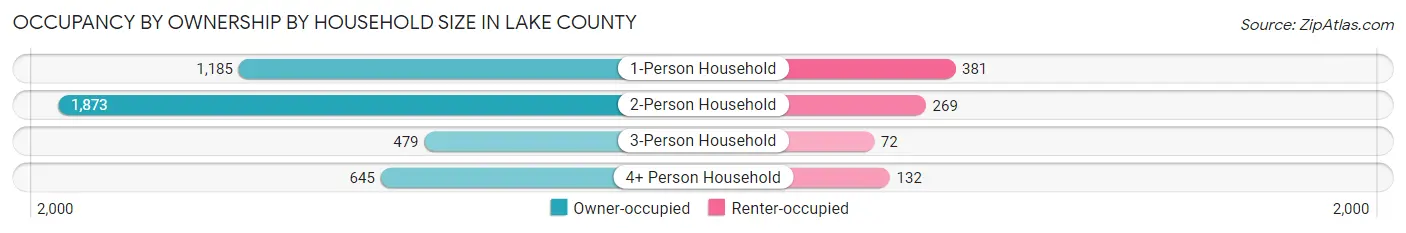
| Household Size | Owner-occupied | Renter-occupied |
| 1-Person Household | 1,185 (75.7%) | 381 (24.3%) |
| 2-Person Household | 1,873 (87.4%) | 269 (12.6%) |
| 3-Person Household | 479 (86.9%) | 72 (13.1%) |
| 4+ Person Household | 645 (83.0%) | 132 (17.0%) |
| Total Housing Units | 4,182 (83.0%) | 854 (17.0%) |
Occupancy by Educational Attainment in Lake County
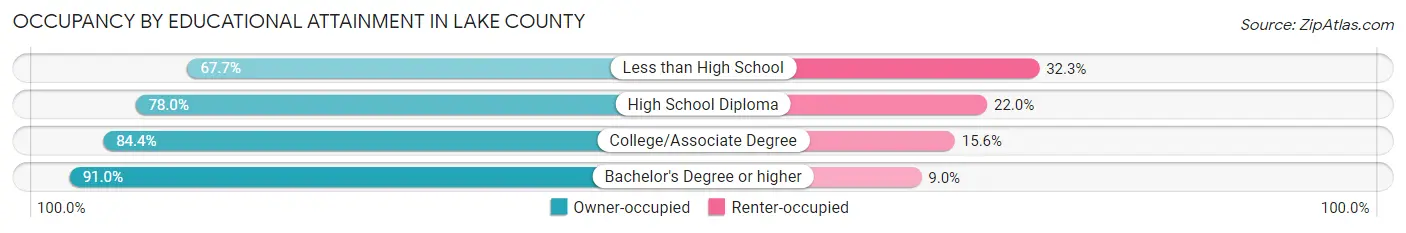
| Household Size | Owner-occupied | Renter-occupied |
| Less than High School | 201 (67.7%) | 96 (32.3%) |
| High School Diploma | 1,270 (78.0%) | 358 (22.0%) |
| College/Associate Degree | 1,542 (84.4%) | 285 (15.6%) |
| Bachelor's Degree or higher | 1,169 (91.0%) | 115 (9.0%) |
Occupancy by Age of Householder in Lake County
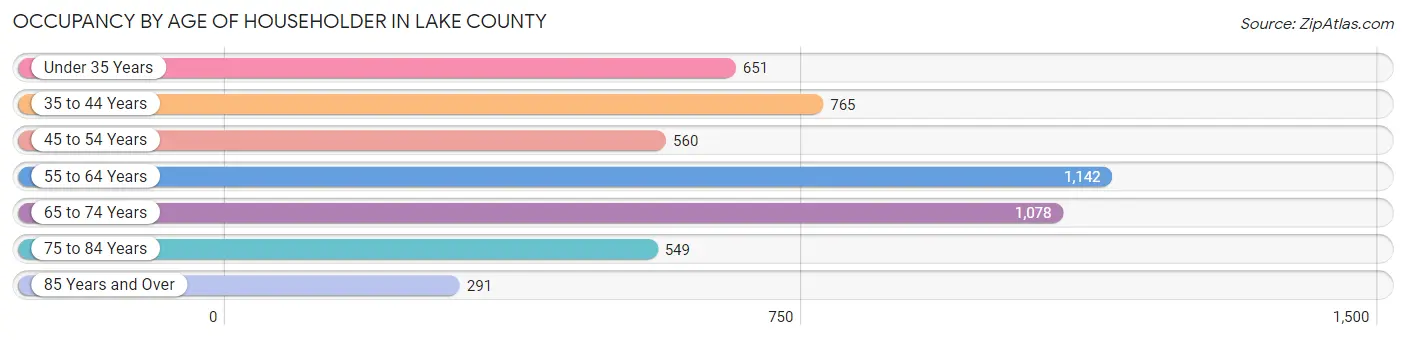
| Age Bracket | # Households | % Households |
| Under 35 Years | 651 | 12.9% |
| 35 to 44 Years | 765 | 15.2% |
| 45 to 54 Years | 560 | 11.1% |
| 55 to 64 Years | 1,142 | 22.7% |
| 65 to 74 Years | 1,078 | 21.4% |
| 75 to 84 Years | 549 | 10.9% |
| 85 Years and Over | 291 | 5.8% |
| Total | 5,036 | 100.0% |
Housing Finances in Lake County
Median Income by Occupancy in Lake County
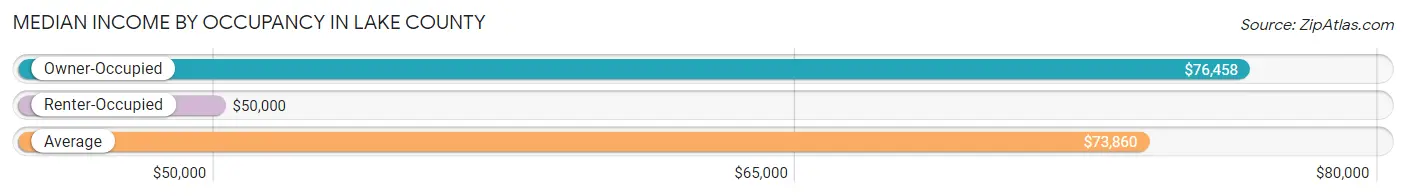
| Occupancy Type | # Households | Median Income |
| Owner-Occupied | 4,182 (83.0%) | $76,458 |
| Renter-Occupied | 854 (17.0%) | $50,000 |
| Average | 5,036 (100.0%) | $73,860 |
Occupancy by Householder Income Bracket in Lake County
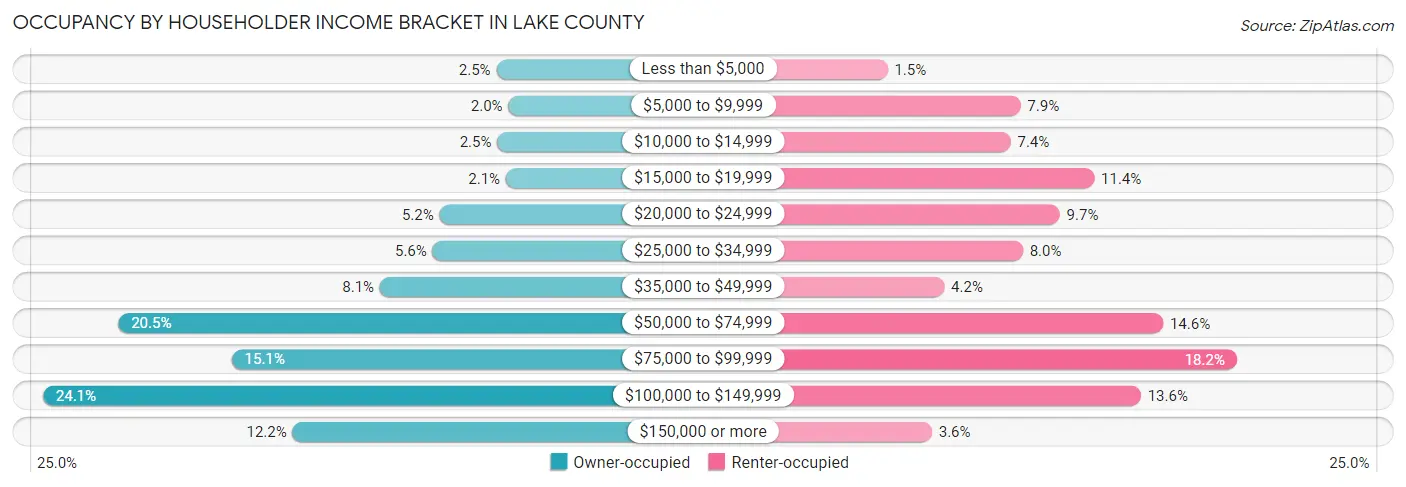
| Income Bracket | Owner-occupied | Renter-occupied |
| Less than $5,000 | 106 (2.5%) | 13 (1.5%) |
| $5,000 to $9,999 | 82 (2.0%) | 67 (7.9%) |
| $10,000 to $14,999 | 104 (2.5%) | 63 (7.4%) |
| $15,000 to $19,999 | 87 (2.1%) | 97 (11.4%) |
| $20,000 to $24,999 | 219 (5.2%) | 83 (9.7%) |
| $25,000 to $34,999 | 233 (5.6%) | 68 (8.0%) |
| $35,000 to $49,999 | 338 (8.1%) | 36 (4.2%) |
| $50,000 to $74,999 | 859 (20.5%) | 125 (14.6%) |
| $75,000 to $99,999 | 633 (15.1%) | 155 (18.1%) |
| $100,000 to $149,999 | 1,009 (24.1%) | 116 (13.6%) |
| $150,000 or more | 512 (12.2%) | 31 (3.6%) |
| Total | 4,182 (100.0%) | 854 (100.0%) |
Monthly Housing Cost Tiers in Lake County
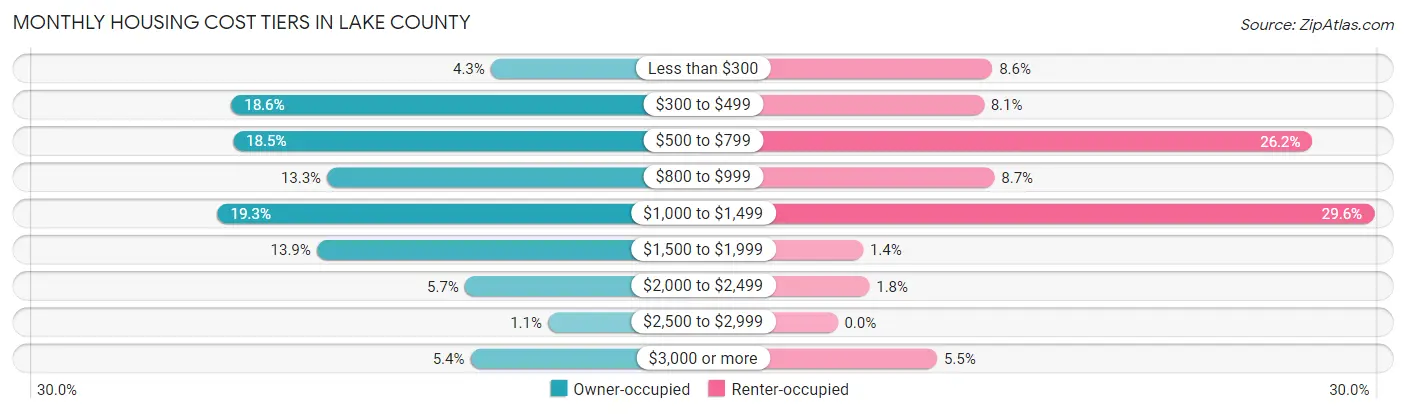
| Monthly Cost | Owner-occupied | Renter-occupied |
| Less than $300 | 178 (4.3%) | 73 (8.6%) |
| $300 to $499 | 777 (18.6%) | 69 (8.1%) |
| $500 to $799 | 773 (18.5%) | 224 (26.2%) |
| $800 to $999 | 556 (13.3%) | 74 (8.7%) |
| $1,000 to $1,499 | 809 (19.3%) | 253 (29.6%) |
| $1,500 to $1,999 | 580 (13.9%) | 12 (1.4%) |
| $2,000 to $2,499 | 238 (5.7%) | 15 (1.8%) |
| $2,500 to $2,999 | 46 (1.1%) | 0 (0.0%) |
| $3,000 or more | 225 (5.4%) | 47 (5.5%) |
| Total | 4,182 (100.0%) | 854 (100.0%) |
Physical Housing Characteristics in Lake County
Housing Structures in Lake County
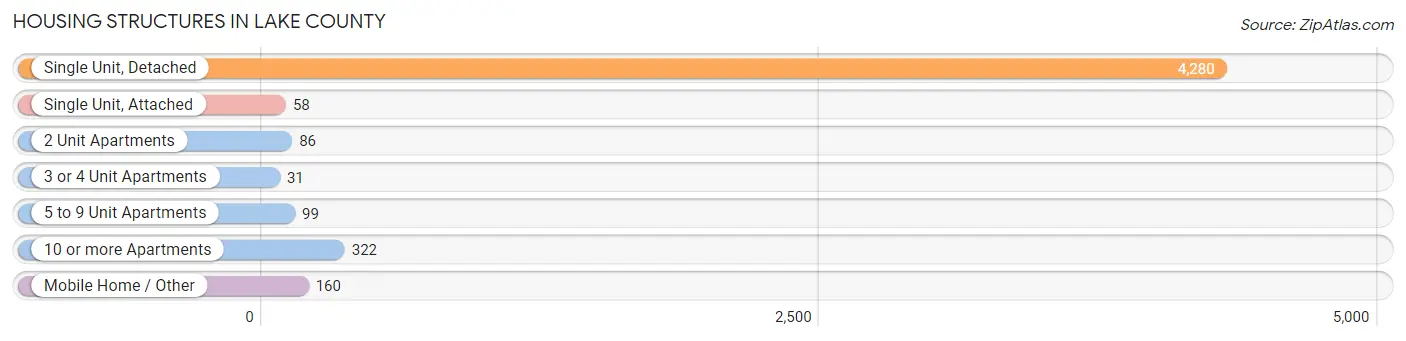
| Structure Type | # Housing Units | % Housing Units |
| Single Unit, Detached | 4,280 | 85.0% |
| Single Unit, Attached | 58 | 1.1% |
| 2 Unit Apartments | 86 | 1.7% |
| 3 or 4 Unit Apartments | 31 | 0.6% |
| 5 to 9 Unit Apartments | 99 | 2.0% |
| 10 or more Apartments | 322 | 6.4% |
| Mobile Home / Other | 160 | 3.2% |
| Total | 5,036 | 100.0% |
Housing Structures by Occupancy in Lake County
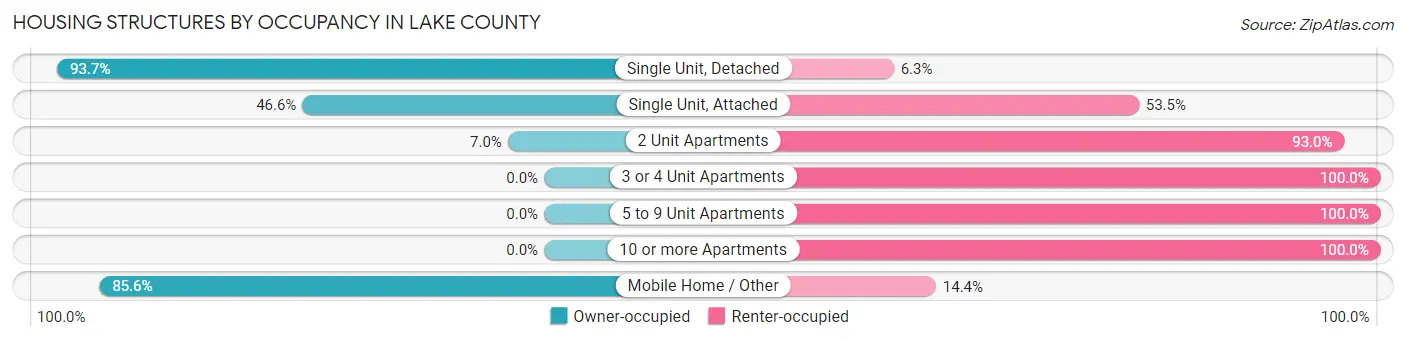
| Structure Type | Owner-occupied | Renter-occupied |
| Single Unit, Detached | 4,012 (93.7%) | 268 (6.3%) |
| Single Unit, Attached | 27 (46.6%) | 31 (53.4%) |
| 2 Unit Apartments | 6 (7.0%) | 80 (93.0%) |
| 3 or 4 Unit Apartments | 0 (0.0%) | 31 (100.0%) |
| 5 to 9 Unit Apartments | 0 (0.0%) | 99 (100.0%) |
| 10 or more Apartments | 0 (0.0%) | 322 (100.0%) |
| Mobile Home / Other | 137 (85.6%) | 23 (14.4%) |
| Total | 4,182 (83.0%) | 854 (17.0%) |
Housing Structures by Number of Rooms in Lake County
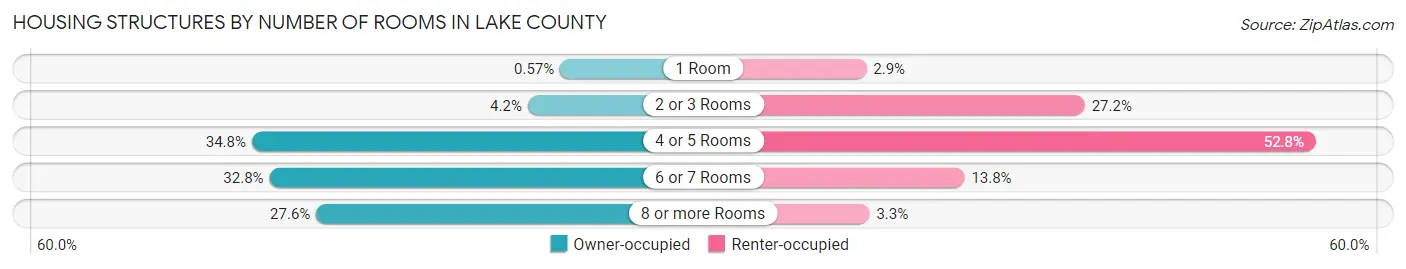
| Number of Rooms | Owner-occupied | Renter-occupied |
| 1 Room | 24 (0.6%) | 25 (2.9%) |
| 2 or 3 Rooms | 174 (4.2%) | 232 (27.2%) |
| 4 or 5 Rooms | 1,455 (34.8%) | 451 (52.8%) |
| 6 or 7 Rooms | 1,373 (32.8%) | 118 (13.8%) |
| 8 or more Rooms | 1,156 (27.6%) | 28 (3.3%) |
| Total | 4,182 (100.0%) | 854 (100.0%) |
Housing Structure by Heating Type in Lake County
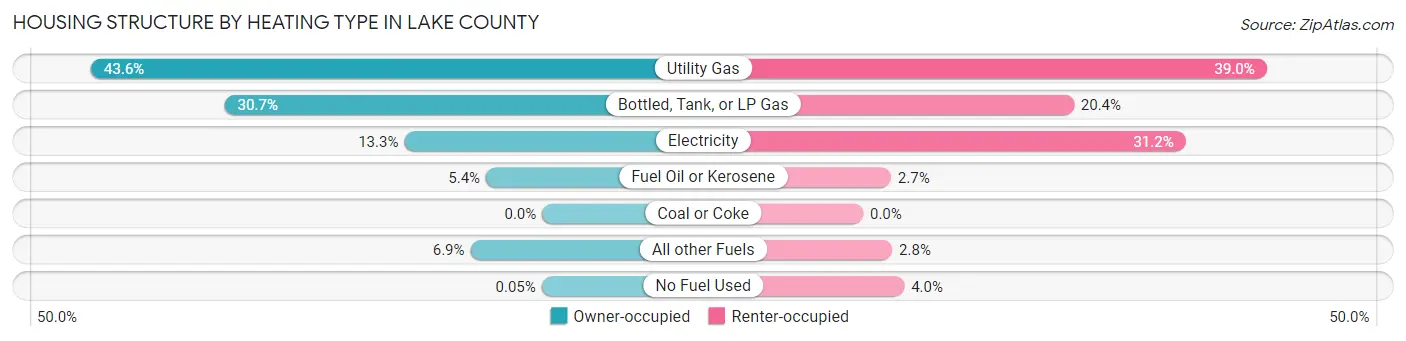
| Heating Type | Owner-occupied | Renter-occupied |
| Utility Gas | 1,823 (43.6%) | 333 (39.0%) |
| Bottled, Tank, or LP Gas | 1,283 (30.7%) | 174 (20.4%) |
| Electricity | 557 (13.3%) | 266 (31.1%) |
| Fuel Oil or Kerosene | 227 (5.4%) | 23 (2.7%) |
| Coal or Coke | 0 (0.0%) | 0 (0.0%) |
| All other Fuels | 290 (6.9%) | 24 (2.8%) |
| No Fuel Used | 2 (0.1%) | 34 (4.0%) |
| Total | 4,182 (100.0%) | 854 (100.0%) |
Household Vehicle Usage in Lake County
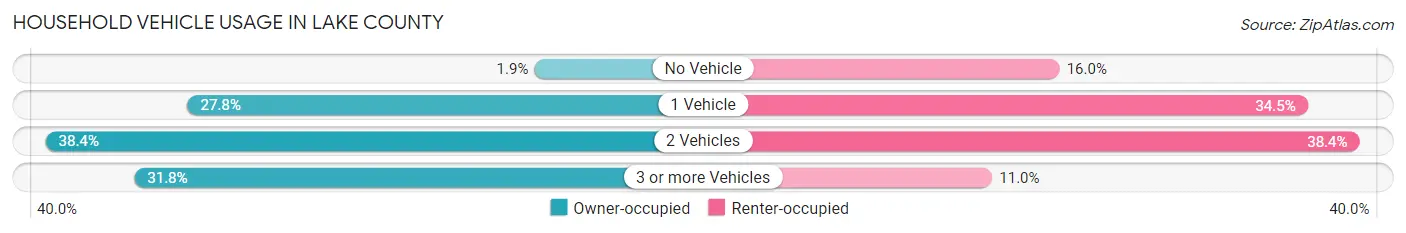
| Vehicles per Household | Owner-occupied | Renter-occupied |
| No Vehicle | 81 (1.9%) | 137 (16.0%) |
| 1 Vehicle | 1,164 (27.8%) | 295 (34.5%) |
| 2 Vehicles | 1,607 (38.4%) | 328 (38.4%) |
| 3 or more Vehicles | 1,330 (31.8%) | 94 (11.0%) |
| Total | 4,182 (100.0%) | 854 (100.0%) |
Real Estate & Mortgages in Lake County
Real Estate and Mortgage Overview in Lake County
| Characteristic | Without Mortgage | With Mortgage |
| Housing Units | 1,782 | 2,400 |
| Median Property Value | $198,400 | $203,500 |
| Median Household Income | $65,893 | $405 |
| Monthly Housing Costs | $490 | $225 |
| Real Estate Taxes | $1,532 | $26 |
Property Value by Mortgage Status in Lake County
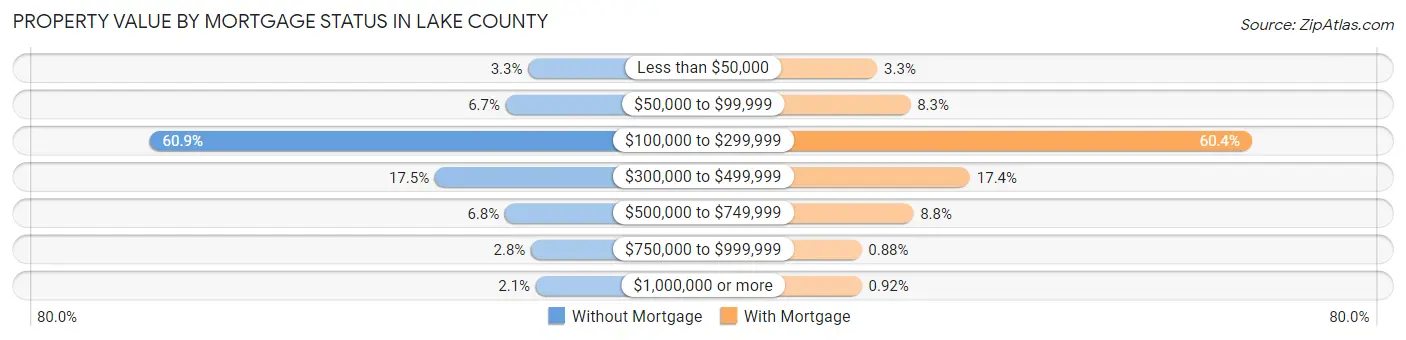
| Property Value | Without Mortgage | With Mortgage |
| Less than $50,000 | 58 (3.3%) | 79 (3.3%) |
| $50,000 to $99,999 | 119 (6.7%) | 200 (8.3%) |
| $100,000 to $299,999 | 1,086 (60.9%) | 1,449 (60.4%) |
| $300,000 to $499,999 | 311 (17.4%) | 418 (17.4%) |
| $500,000 to $749,999 | 121 (6.8%) | 211 (8.8%) |
| $750,000 to $999,999 | 50 (2.8%) | 21 (0.9%) |
| $1,000,000 or more | 37 (2.1%) | 22 (0.9%) |
| Total | 1,782 (100.0%) | 2,400 (100.0%) |
Household Income by Mortgage Status in Lake County
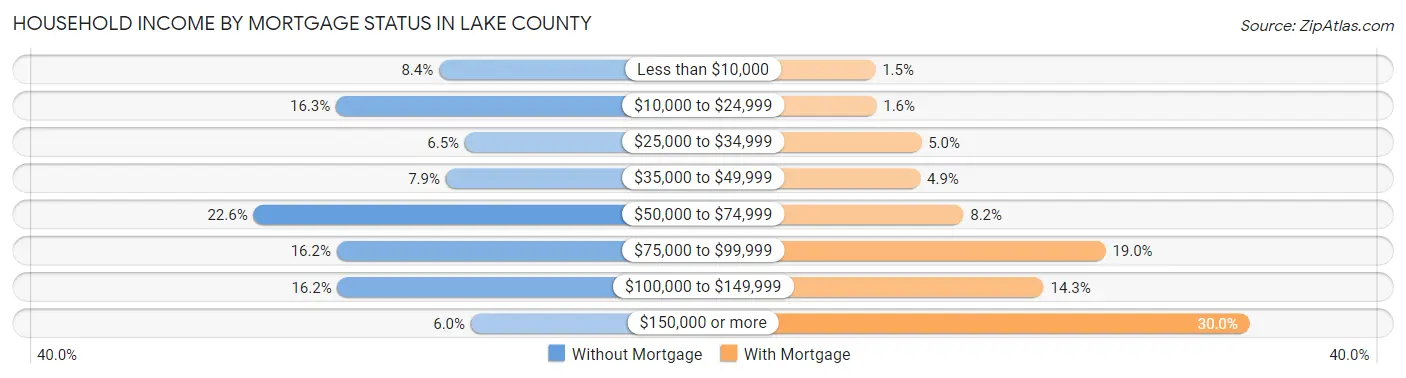
| Household Income | Without Mortgage | With Mortgage |
| Less than $10,000 | 150 (8.4%) | 36 (1.5%) |
| $10,000 to $24,999 | 290 (16.3%) | 38 (1.6%) |
| $25,000 to $34,999 | 115 (6.5%) | 120 (5.0%) |
| $35,000 to $49,999 | 141 (7.9%) | 118 (4.9%) |
| $50,000 to $74,999 | 402 (22.6%) | 197 (8.2%) |
| $75,000 to $99,999 | 289 (16.2%) | 457 (19.0%) |
| $100,000 to $149,999 | 288 (16.2%) | 344 (14.3%) |
| $150,000 or more | 107 (6.0%) | 721 (30.0%) |
| Total | 1,782 (100.0%) | 2,400 (100.0%) |
Property Value to Household Income Ratio in Lake County
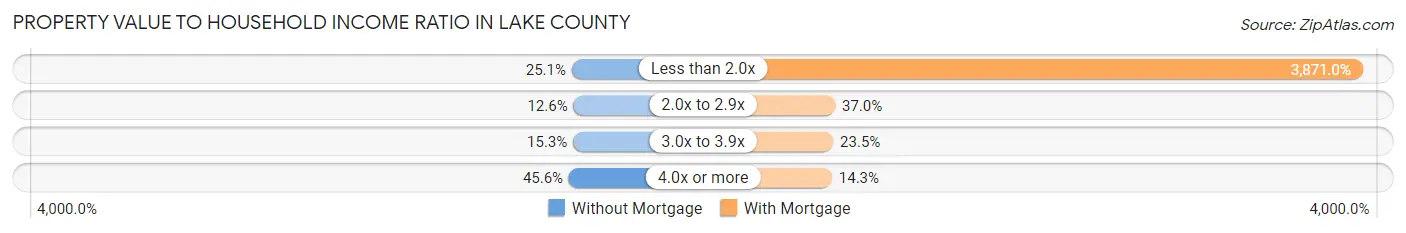
| Value-to-Income Ratio | Without Mortgage | With Mortgage |
| Less than 2.0x | 448 (25.1%) | 92,903 (3,871.0%) |
| 2.0x to 2.9x | 225 (12.6%) | 889 (37.0%) |
| 3.0x to 3.9x | 272 (15.3%) | 564 (23.5%) |
| 4.0x or more | 813 (45.6%) | 344 (14.3%) |
| Total | 1,782 (100.0%) | 2,400 (100.0%) |
Real Estate Taxes by Mortgage Status in Lake County
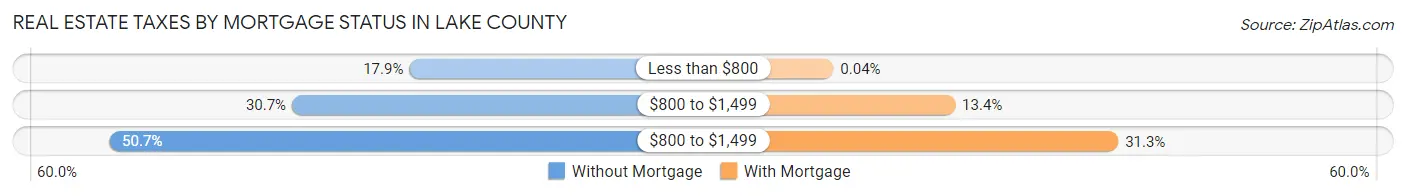
| Property Taxes | Without Mortgage | With Mortgage |
| Less than $800 | 318 (17.8%) | 1 (0.0%) |
| $800 to $1,499 | 547 (30.7%) | 321 (13.4%) |
| $800 to $1,499 | 904 (50.7%) | 750 (31.2%) |
| Total | 1,782 (100.0%) | 2,400 (100.0%) |
Health & Disability in Lake County
Health Insurance Coverage by Age in Lake County
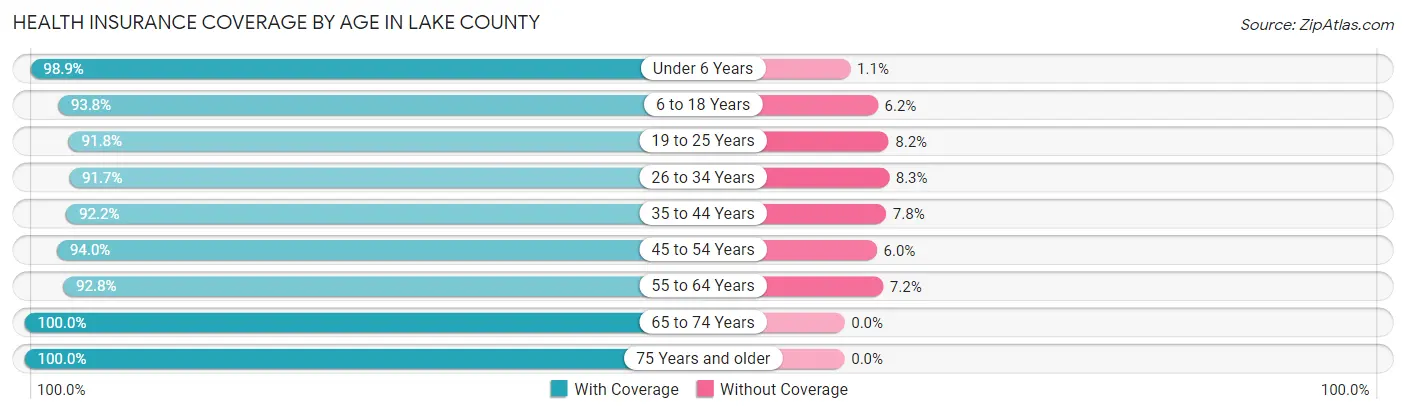
| Age Bracket | With Coverage | Without Coverage |
| Under 6 Years | 635 (98.9%) | 7 (1.1%) |
| 6 to 18 Years | 1,420 (93.8%) | 94 (6.2%) |
| 19 to 25 Years | 614 (91.8%) | 55 (8.2%) |
| 26 to 34 Years | 785 (91.7%) | 71 (8.3%) |
| 35 to 44 Years | 1,130 (92.2%) | 95 (7.8%) |
| 45 to 54 Years | 1,137 (94.0%) | 73 (6.0%) |
| 55 to 64 Years | 1,714 (92.8%) | 133 (7.2%) |
| 65 to 74 Years | 1,590 (100.0%) | 0 (0.0%) |
| 75 Years and older | 1,187 (100.0%) | 0 (0.0%) |
| Total | 10,212 (95.1%) | 528 (4.9%) |
Health Insurance Coverage by Citizenship Status in Lake County
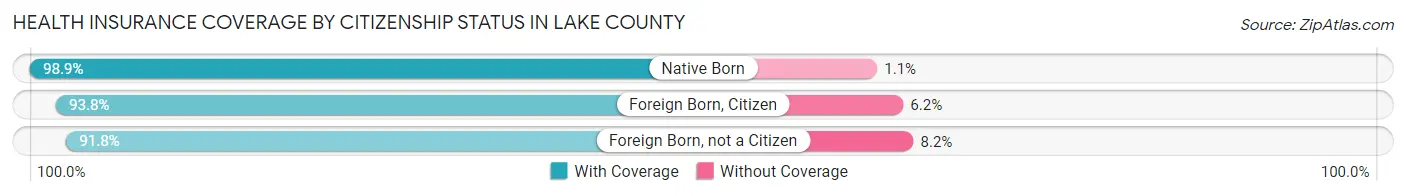
| Citizenship Status | With Coverage | Without Coverage |
| Native Born | 635 (98.9%) | 7 (1.1%) |
| Foreign Born, Citizen | 1,420 (93.8%) | 94 (6.2%) |
| Foreign Born, not a Citizen | 614 (91.8%) | 55 (8.2%) |
Health Insurance Coverage by Household Income in Lake County
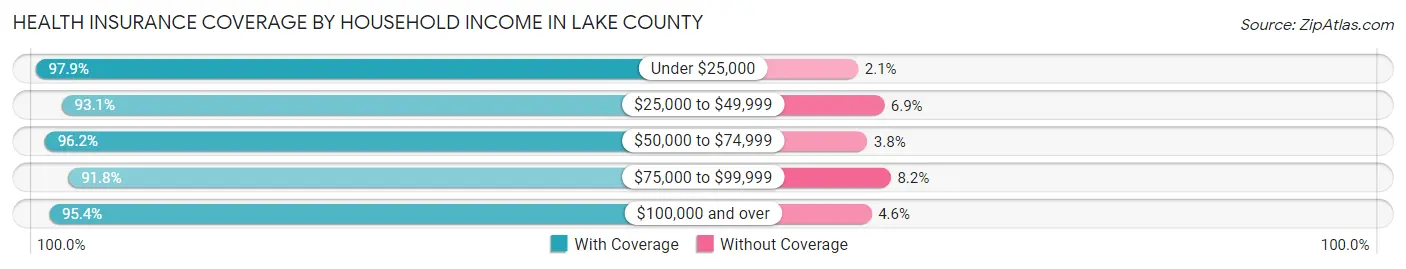
| Household Income | With Coverage | Without Coverage |
| Under $25,000 | 1,233 (97.9%) | 26 (2.1%) |
| $25,000 to $49,999 | 1,046 (93.1%) | 78 (6.9%) |
| $50,000 to $74,999 | 2,017 (96.2%) | 79 (3.8%) |
| $75,000 to $99,999 | 1,369 (91.8%) | 122 (8.2%) |
| $100,000 and over | 4,450 (95.4%) | 213 (4.6%) |
Public vs Private Health Insurance Coverage by Age in Lake County
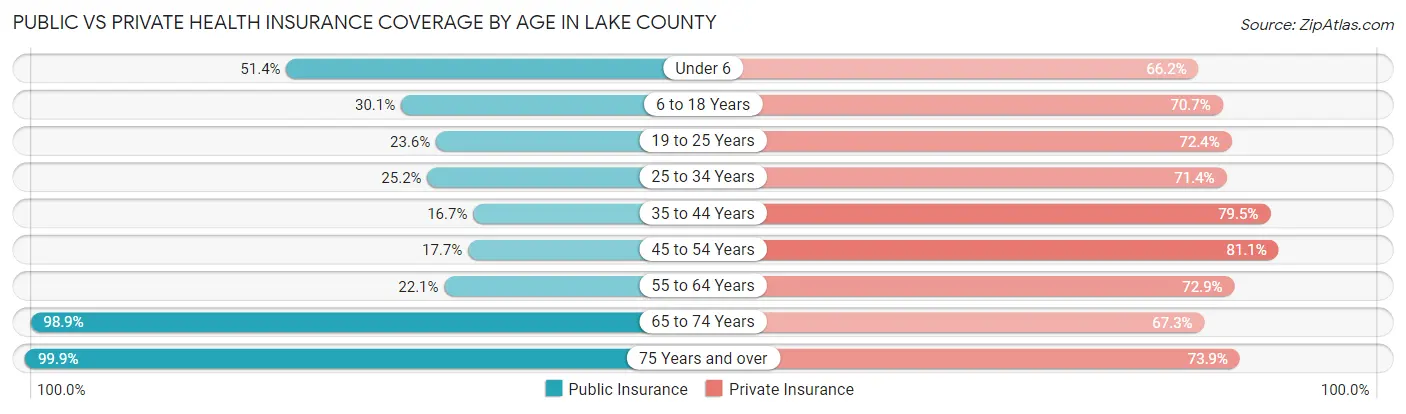
| Age Bracket | Public Insurance | Private Insurance |
| Under 6 | 330 (51.4%) | 425 (66.2%) |
| 6 to 18 Years | 456 (30.1%) | 1,070 (70.7%) |
| 19 to 25 Years | 158 (23.6%) | 484 (72.4%) |
| 25 to 34 Years | 216 (25.2%) | 611 (71.4%) |
| 35 to 44 Years | 205 (16.7%) | 974 (79.5%) |
| 45 to 54 Years | 214 (17.7%) | 981 (81.1%) |
| 55 to 64 Years | 408 (22.1%) | 1,346 (72.9%) |
| 65 to 74 Years | 1,573 (98.9%) | 1,070 (67.3%) |
| 75 Years and over | 1,186 (99.9%) | 877 (73.9%) |
| Total | 4,746 (44.2%) | 7,838 (73.0%) |
Disability Status by Sex by Age in Lake County
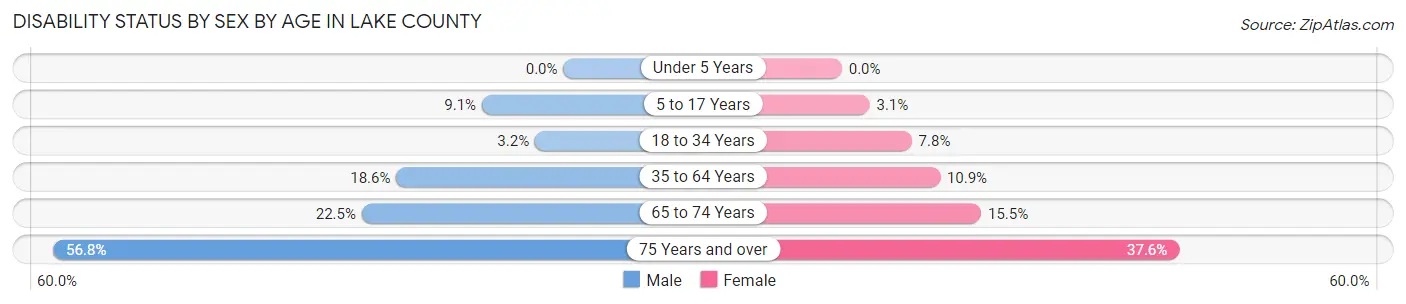
| Age Bracket | Male | Female |
| Under 5 Years | 0 (0.0%) | 0 (0.0%) |
| 5 to 17 Years | 74 (9.1%) | 23 (3.1%) |
| 18 to 34 Years | 26 (3.2%) | 61 (7.8%) |
| 35 to 64 Years | 417 (18.6%) | 223 (10.9%) |
| 65 to 74 Years | 189 (22.5%) | 116 (15.5%) |
| 75 Years and over | 316 (56.8%) | 237 (37.6%) |
Disability Class by Sex by Age in Lake County
Disability Class: Hearing Difficulty
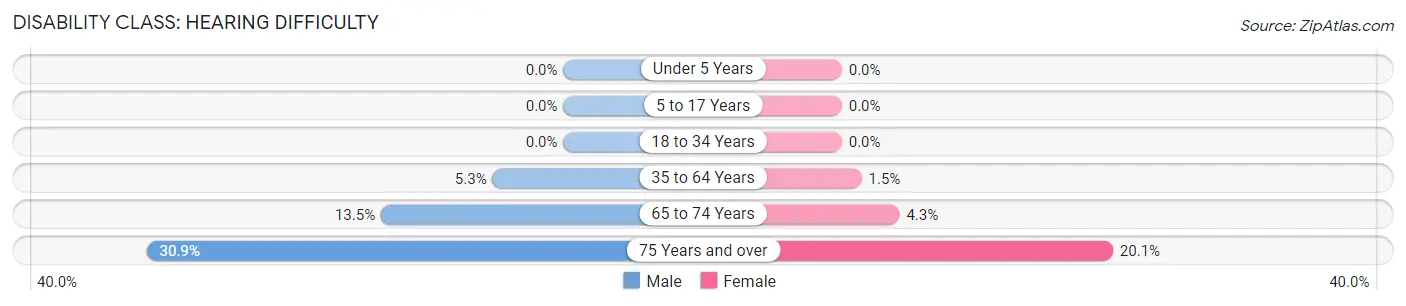
| Age Bracket | Male | Female |
| Under 5 Years | 0 (0.0%) | 0 (0.0%) |
| 5 to 17 Years | 0 (0.0%) | 0 (0.0%) |
| 18 to 34 Years | 0 (0.0%) | 0 (0.0%) |
| 35 to 64 Years | 118 (5.3%) | 30 (1.5%) |
| 65 to 74 Years | 114 (13.5%) | 32 (4.3%) |
| 75 Years and over | 172 (30.9%) | 127 (20.1%) |
Disability Class: Vision Difficulty
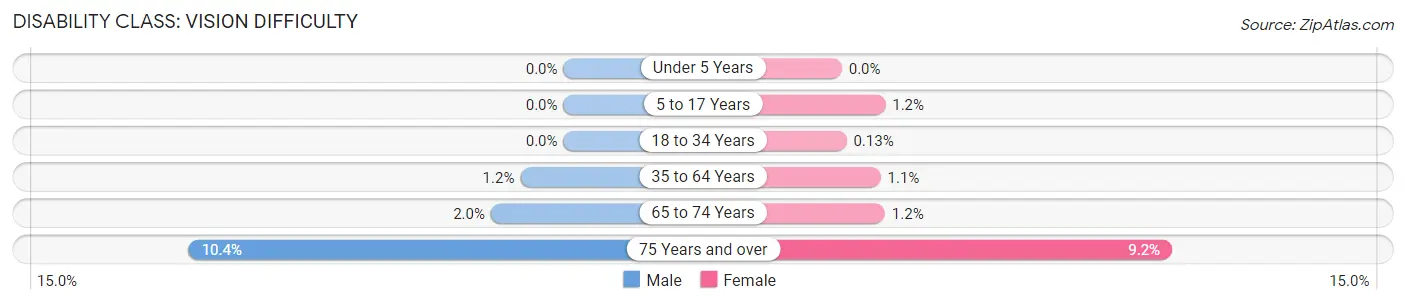
| Age Bracket | Male | Female |
| Under 5 Years | 0 (0.0%) | 0 (0.0%) |
| 5 to 17 Years | 0 (0.0%) | 9 (1.2%) |
| 18 to 34 Years | 0 (0.0%) | 1 (0.1%) |
| 35 to 64 Years | 27 (1.2%) | 22 (1.1%) |
| 65 to 74 Years | 17 (2.0%) | 9 (1.2%) |
| 75 Years and over | 58 (10.4%) | 58 (9.2%) |
Disability Class: Cognitive Difficulty
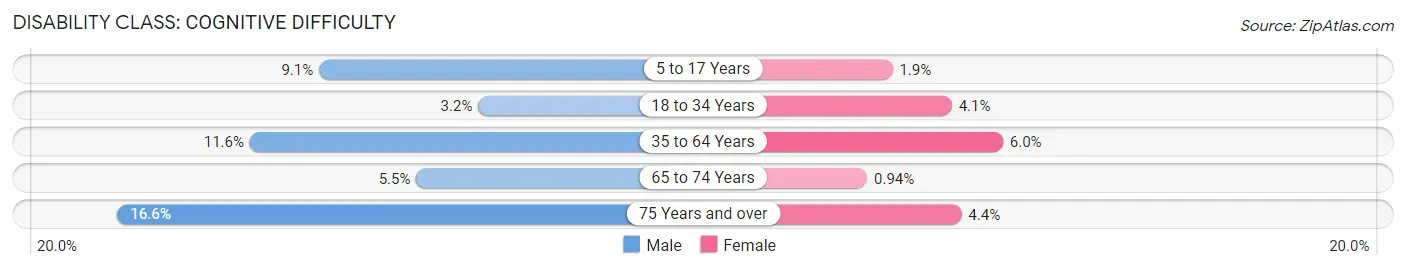
| Age Bracket | Male | Female |
| 5 to 17 Years | 74 (9.1%) | 14 (1.9%) |
| 18 to 34 Years | 26 (3.2%) | 32 (4.1%) |
| 35 to 64 Years | 261 (11.6%) | 122 (6.0%) |
| 65 to 74 Years | 46 (5.5%) | 7 (0.9%) |
| 75 Years and over | 92 (16.6%) | 28 (4.4%) |
Disability Class: Ambulatory Difficulty
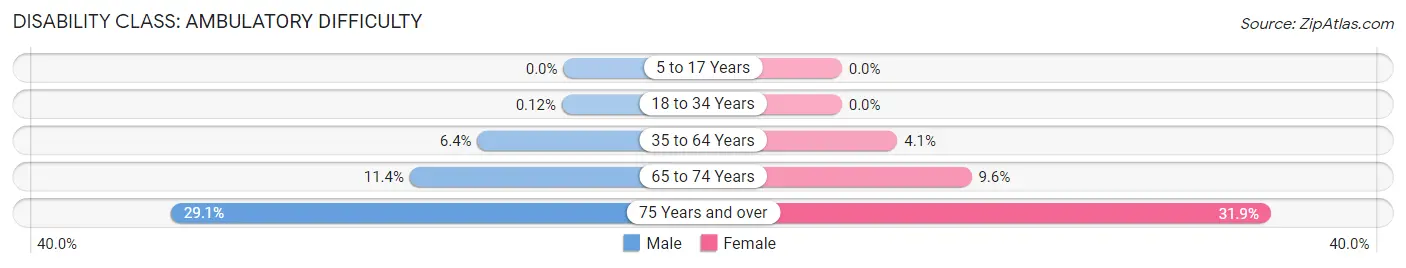
| Age Bracket | Male | Female |
| 5 to 17 Years | 0 (0.0%) | 0 (0.0%) |
| 18 to 34 Years | 1 (0.1%) | 0 (0.0%) |
| 35 to 64 Years | 143 (6.4%) | 84 (4.1%) |
| 65 to 74 Years | 96 (11.4%) | 72 (9.6%) |
| 75 Years and over | 162 (29.1%) | 201 (31.9%) |
Disability Class: Self-Care Difficulty
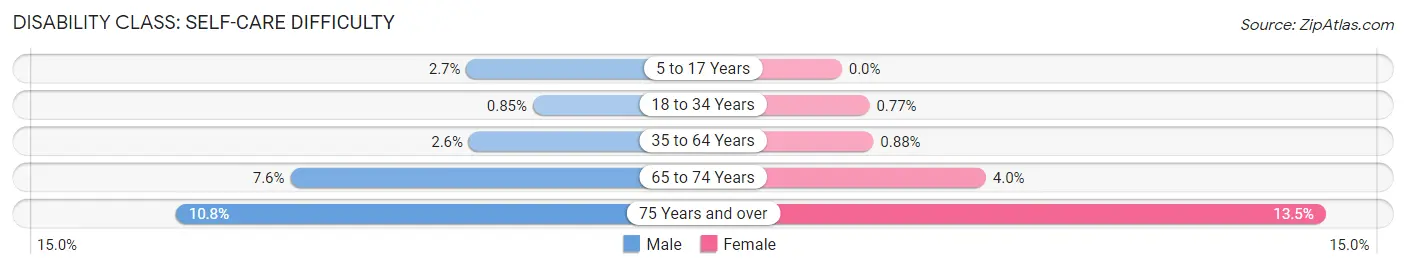
| Age Bracket | Male | Female |
| 5 to 17 Years | 22 (2.7%) | 0 (0.0%) |
| 18 to 34 Years | 7 (0.9%) | 6 (0.8%) |
| 35 to 64 Years | 59 (2.6%) | 18 (0.9%) |
| 65 to 74 Years | 64 (7.6%) | 30 (4.0%) |
| 75 Years and over | 60 (10.8%) | 85 (13.5%) |
Technology Access in Lake County
Computing Device Access in Lake County

| Device Type | # Households | % Households |
| Desktop or Laptop | 4,003 | 79.5% |
| Smartphone | 3,981 | 79.0% |
| Tablet | 2,959 | 58.8% |
| No Computing Device | 443 | 8.8% |
| Total | 5,036 | 100.0% |
Internet Access in Lake County
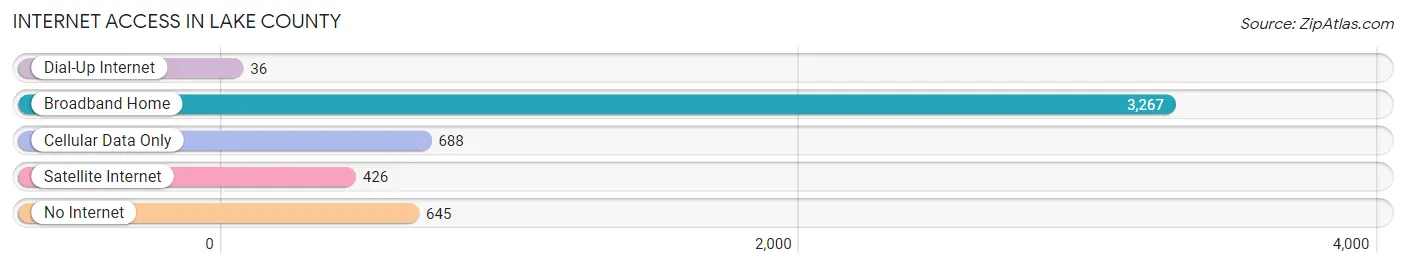
| Internet Type | # Households | % Households |
| Dial-Up Internet | 36 | 0.7% |
| Broadband Home | 3,267 | 64.9% |
| Cellular Data Only | 688 | 13.7% |
| Satellite Internet | 426 | 8.5% |
| No Internet | 645 | 12.8% |
| Total | 5,036 | 100.0% |
Lake County Summary
Lake County is located in the northeastern corner of Minnesota, and is the second largest county in the state. It is bordered by St. Louis County to the north, Cook County to the east, and Carlton County to the south. The county seat is Two Harbors, and the largest city is Silver Bay. The county was established in 1855 and named for its many lakes.
History
The area that is now Lake County was originally inhabited by the Ojibwe people. The first European settlers arrived in the area in the late 1800s, and the county was officially established in 1855. The county was originally part of St. Louis County, but was split off in 1871.
The area was heavily logged in the late 1800s and early 1900s, and the logging industry was the main source of employment for many years. The county was also home to several iron ore mines, which provided jobs for many of the residents.
Geography
Lake County is located in the northeastern corner of Minnesota, and is the second largest county in the state. It is bordered by St. Louis County to the north, Cook County to the east, and Carlton County to the south. The county has a total area of 2,845 square miles, of which 2,717 square miles is land and 128 square miles is water.
The county is mostly covered by forests, with some areas of wetlands and grasslands. The highest point in the county is Eagle Mountain, which has an elevation of 2,301 feet. The county is home to numerous lakes, including Lake Superior, which forms the county’s northern border.
Economy
The economy of Lake County is largely based on tourism and natural resources. The county is home to several state parks, including Gooseberry Falls State Park and Split Rock Lighthouse State Park. These parks attract thousands of visitors each year, and provide jobs for many of the county’s residents.
The county is also home to several iron ore mines, which provide jobs for many of the residents. The county is also home to several logging companies, which provide jobs for many of the residents.
Demographics
As of the 2010 census, the population of Lake County was 11,196. The population is mostly white (94.3%), with small percentages of Native American (2.2%), African American (0.7%), Asian (0.4%), and other races (2.4%). The median household income is $45,845, and the median age is 44.7.
Conclusion
Lake County is a large county located in the northeastern corner of Minnesota. It is home to numerous lakes, state parks, and natural resources, and is a popular tourist destination. The county is also home to several iron ore mines and logging companies, which provide jobs for many of the residents. The population of the county is mostly white, with small percentages of Native American, African American, Asian, and other races. The median household income is $45,845, and the median age is 44.7.
Common Questions
What is Per Capita Income in Lake County?
Per Capita income in Lake County is $39,930.
What is the Median Family Income in Lake County?
Median Family Income in Lake County is $90,540.
What is the Median Household income in Lake County?
Median Household Income in Lake County is $73,860.
What is Income or Wage Gap in Lake County?
Income or Wage Gap in Lake County is 47.3%.
Women in Lake County earn 52.7 cents for every dollar earned by a man.
What is Inequality or Gini Index in Lake County?
Inequality or Gini Index in Lake County is 0.40.
What is the Total Population of Lake County?
Total Population of Lake County is 10,915.
What is the Total Male Population of Lake County?
Total Male Population of Lake County is 5,608.
What is the Total Female Population of Lake County?
Total Female Population of Lake County is 5,307.
What is the Ratio of Males per 100 Females in Lake County?
There are 105.67 Males per 100 Females in Lake County.
What is the Ratio of Females per 100 Males in Lake County?
There are 94.63 Females per 100 Males in Lake County.
What is the Median Population Age in Lake County?
Median Population Age in Lake County is 49.7 Years.
What is the Average Family Size in Lake County
Average Family Size in Lake County is 2.6 People.
What is the Average Household Size in Lake County
Average Household Size in Lake County is 2.1 People.
How Large is the Labor Force in Lake County?
There are 5,068 People in the Labor Forcein in Lake County.
What is the Percentage of People in the Labor Force in Lake County?
55.7% of People are in the Labor Force in Lake County.
What is the Unemployment Rate in Lake County?
Unemployment Rate in Lake County is 2.8%.