Grant County, MN Map & Demographics
Grant County Map
Grant County Overview
$36,750
PER CAPITA INCOME
$82,007
AVG FAMILY INCOME
$67,600
AVG HOUSEHOLD INCOME
35.1%
WAGE / INCOME GAP [ % ]
64.9¢/ $1
WAGE / INCOME GAP [ $ ]
$11,293
FAMILY INCOME DEFICIT
0.45
INEQUALITY / GINI INDEX
6,091
TOTAL POPULATION
3,133
MALE POPULATION
2,958
FEMALE POPULATION
105.92
MALES / 100 FEMALES
94.41
FEMALES / 100 MALES
44.3
MEDIAN AGE
2.9
AVG FAMILY SIZE
2.4
AVG HOUSEHOLD SIZE
3,022
LABOR FORCE [ PEOPLE ]
62.2%
PERCENT IN LABOR FORCE
3.7%
UNEMPLOYMENT RATE
Income in Grant County
Income Overview in Grant County
Per Capita Income in Grant County is $36,750, while median incomes of families and households are $82,007 and $67,600 respectively.
| Characteristic | Number | Measure |
| Per Capita Income | 6,091 | $36,750 |
| Median Family Income | 1,703 | $82,007 |
| Mean Family Income | 1,703 | $103,777 |
| Median Household Income | 2,540 | $67,600 |
| Mean Household Income | 2,540 | $86,753 |
| Income Deficit | 1,703 | $11,293 |
| Wage / Income Gap (%) | 6,091 | 35.10% |
| Wage / Income Gap ($) | 6,091 | 64.90¢ per $1 |
| Gini / Inequality Index | 6,091 | 0.45 |
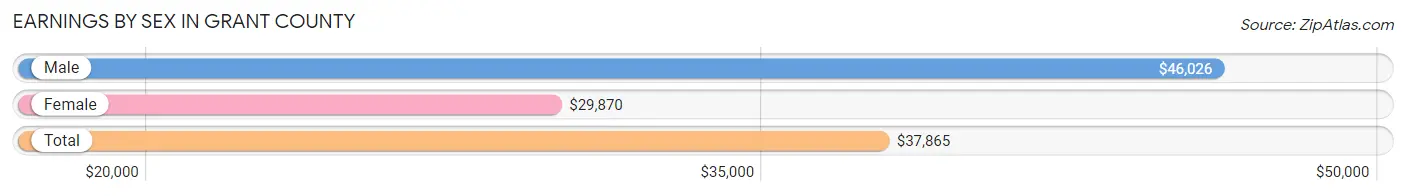
Earnings by Sex in Grant County
Average Earnings in Grant County are $37,865, $46,026 for men and $29,870 for women, a difference of 35.1%.
| Sex | Number | Average Earnings |
| Male | 1,802 (54.9%) | $46,026 |
| Female | 1,483 (45.1%) | $29,870 |
| Total | 3,285 (100.0%) | $37,865 |
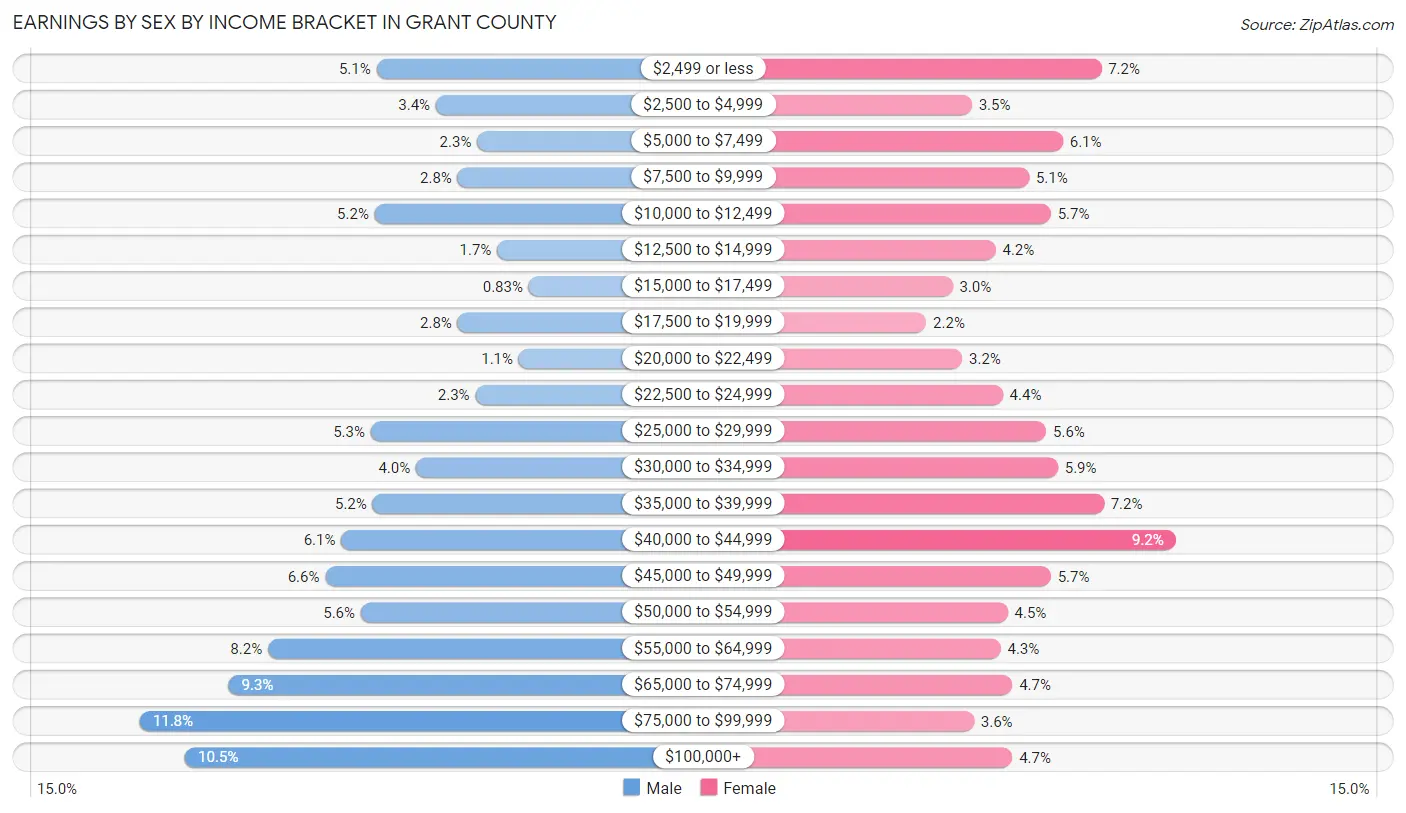
Earnings by Sex by Income Bracket in Grant County
The most common earnings brackets in Grant County are $75,000 to $99,999 for men (212 | 11.8%) and $40,000 to $44,999 for women (137 | 9.2%).
| Income | Male | Female |
| $2,499 or less | 92 (5.1%) | 106 (7.1%) |
| $2,500 to $4,999 | 62 (3.4%) | 52 (3.5%) |
| $5,000 to $7,499 | 41 (2.3%) | 90 (6.1%) |
| $7,500 to $9,999 | 51 (2.8%) | 76 (5.1%) |
| $10,000 to $12,499 | 93 (5.2%) | 85 (5.7%) |
| $12,500 to $14,999 | 31 (1.7%) | 62 (4.2%) |
| $15,000 to $17,499 | 15 (0.8%) | 44 (3.0%) |
| $17,500 to $19,999 | 51 (2.8%) | 33 (2.2%) |
| $20,000 to $22,499 | 20 (1.1%) | 48 (3.2%) |
| $22,500 to $24,999 | 42 (2.3%) | 65 (4.4%) |
| $25,000 to $29,999 | 95 (5.3%) | 83 (5.6%) |
| $30,000 to $34,999 | 72 (4.0%) | 88 (5.9%) |
| $35,000 to $39,999 | 94 (5.2%) | 107 (7.2%) |
| $40,000 to $44,999 | 110 (6.1%) | 137 (9.2%) |
| $45,000 to $49,999 | 118 (6.6%) | 85 (5.7%) |
| $50,000 to $54,999 | 100 (5.6%) | 67 (4.5%) |
| $55,000 to $64,999 | 147 (8.2%) | 64 (4.3%) |
| $65,000 to $74,999 | 167 (9.3%) | 69 (4.6%) |
| $75,000 to $99,999 | 212 (11.8%) | 53 (3.6%) |
| $100,000+ | 189 (10.5%) | 69 (4.6%) |
| Total | 1,802 (100.0%) | 1,483 (100.0%) |
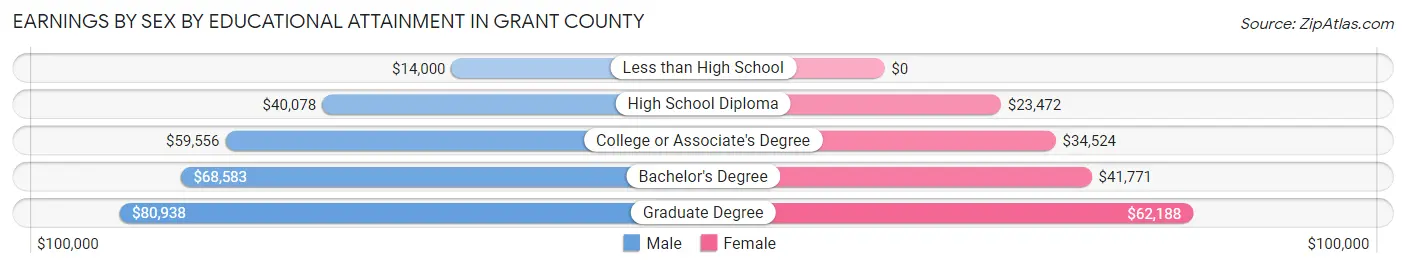
Earnings by Sex by Educational Attainment in Grant County
Average earnings in Grant County are $50,785 for men and $34,311 for women, a difference of 32.4%. Men with an educational attainment of graduate degree enjoy the highest average annual earnings of $80,938, while those with less than high school education earn the least with $14,000. Women with an educational attainment of graduate degree earn the most with the average annual earnings of $62,188, while those with high school diploma education have the smallest earnings of $23,472.
| Educational Attainment | Male Income | Female Income |
| Less than High School | $14,000 | $0 |
| High School Diploma | $40,078 | $23,472 |
| College or Associate's Degree | $59,556 | $34,524 |
| Bachelor's Degree | $68,583 | $41,771 |
| Graduate Degree | $80,938 | $62,188 |
| Total | $50,785 | $34,311 |
Family Income in Grant County
Family Income Brackets in Grant County
According to the Grant County family income data, there are 404 families falling into the $100,000 to $149,999 income range, which is the most common income bracket and makes up 23.7% of all families. Conversely, the $10,000 to $14,999 income bracket is the least frequent group with only 26 families (1.5%) belonging to this category.
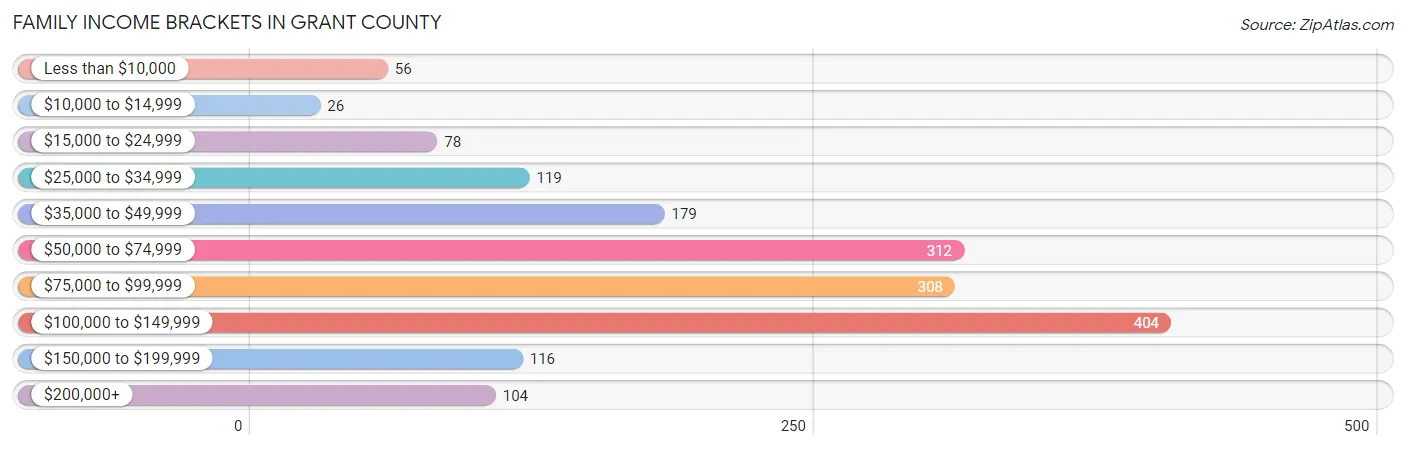
| Income Bracket | # Families | % Families |
| Less than $10,000 | 56 | 3.3% |
| $10,000 to $14,999 | 26 | 1.5% |
| $15,000 to $24,999 | 78 | 4.6% |
| $25,000 to $34,999 | 119 | 7.0% |
| $35,000 to $49,999 | 179 | 10.5% |
| $50,000 to $74,999 | 312 | 18.3% |
| $75,000 to $99,999 | 308 | 18.1% |
| $100,000 to $149,999 | 404 | 23.7% |
| $150,000 to $199,999 | 116 | 6.8% |
| $200,000+ | 104 | 6.1% |
Family Income by Famaliy Size in Grant County
5-person families (140 | 8.2%) account for the highest median family income in Grant County with $103,190 per family, while 2-person families (948 | 55.7%) have the highest median income of $39,808 per family member.

| Income Bracket | # Families | Median Income |
| 2-Person Families | 948 (55.7%) | $79,615 |
| 3-Person Families | 321 (18.9%) | $61,042 |
| 4-Person Families | 228 (13.4%) | $89,167 |
| 5-Person Families | 140 (8.2%) | $103,190 |
| 6-Person Families | 37 (2.2%) | $98,750 |
| 7+ Person Families | 29 (1.7%) | $94,688 |
| Total | 1,703 (100.0%) | $82,007 |
Family Income by Number of Earners in Grant County
The median family income in Grant County is $82,007, with families comprising 3+ earners (157) having the highest median family income of $111,750, while families with no earners (309) have the lowest median family income of $46,339, accounting for 9.2% and 18.1% of families, respectively.
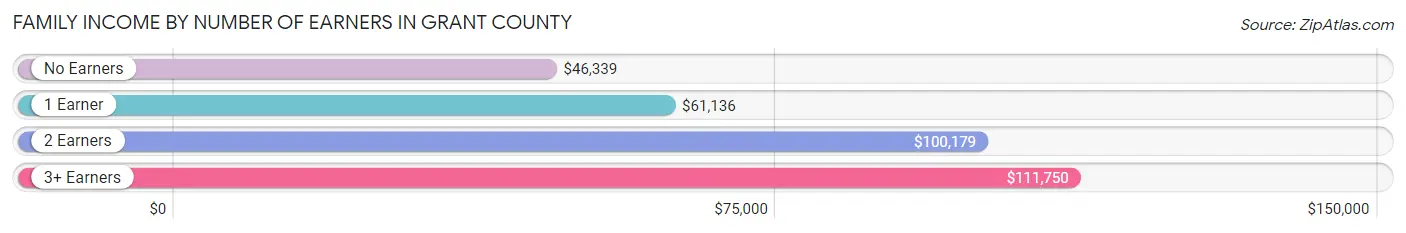
| Number of Earners | # Families | Median Income |
| No Earners | 309 (18.1%) | $46,339 |
| 1 Earner | 442 (26.0%) | $61,136 |
| 2 Earners | 795 (46.7%) | $100,179 |
| 3+ Earners | 157 (9.2%) | $111,750 |
| Total | 1,703 (100.0%) | $82,007 |
Household Income in Grant County
Household Income Brackets in Grant County
With 460 households falling in the category, the $50,000 to $74,999 income range is the most frequent in Grant County, accounting for 18.1% of all households. In contrast, only 94 households (3.7%) fall into the less than $10,000 income bracket, making it the least populous group.
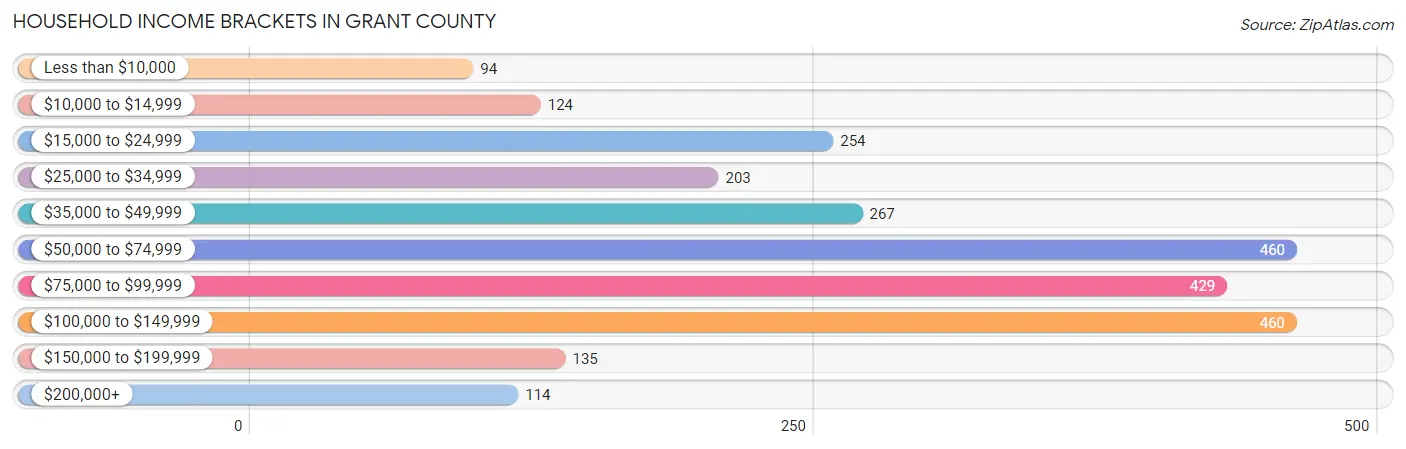
| Income Bracket | # Households | % Households |
| Less than $10,000 | 94 | 3.7% |
| $10,000 to $14,999 | 124 | 4.9% |
| $15,000 to $24,999 | 254 | 10.0% |
| $25,000 to $34,999 | 203 | 8.0% |
| $35,000 to $49,999 | 267 | 10.5% |
| $50,000 to $74,999 | 460 | 18.1% |
| $75,000 to $99,999 | 429 | 16.9% |
| $100,000 to $149,999 | 460 | 18.1% |
| $150,000 to $199,999 | 135 | 5.3% |
| $200,000+ | 114 | 4.5% |
Household Income by Householder Age in Grant County
The median household income in Grant County is $67,600, with the highest median household income of $85,179 found in the 25 to 44 years age bracket for the primary householder. A total of 674 households (26.5%) fall into this category. Meanwhile, the 65+ years age bracket for the primary householder has the lowest median household income of $47,404, with 858 households (33.8%) in this group.
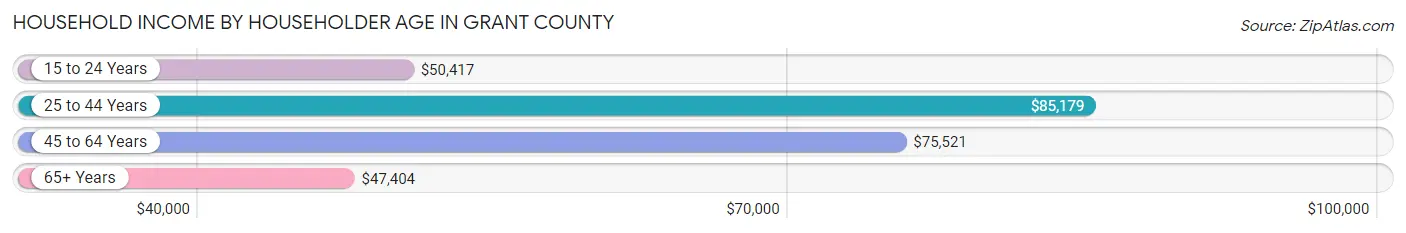
| Income Bracket | # Households | Median Income |
| 15 to 24 Years | 73 (2.9%) | $50,417 |
| 25 to 44 Years | 674 (26.5%) | $85,179 |
| 45 to 64 Years | 935 (36.8%) | $75,521 |
| 65+ Years | 858 (33.8%) | $47,404 |
| Total | 2,540 (100.0%) | $67,600 |
Poverty in Grant County
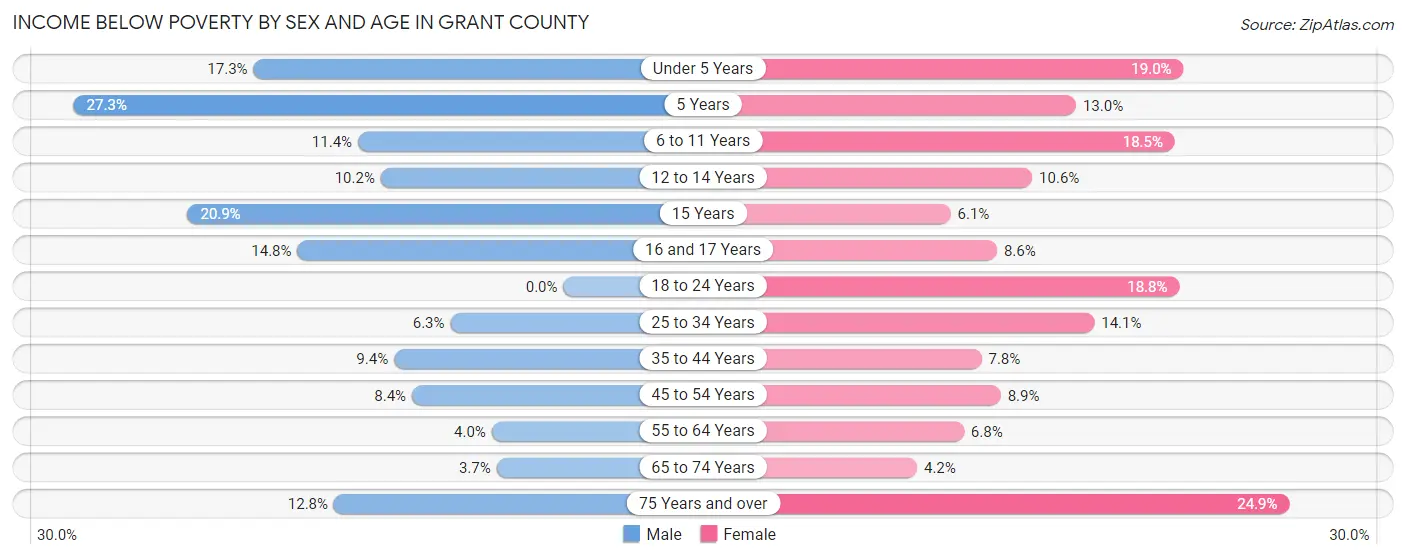
Income Below Poverty by Sex and Age in Grant County
With 8.4% poverty level for males and 11.9% for females among the residents of Grant County, 5 year old males and 75 year old and over females are the most vulnerable to poverty, with 15 males (27.3%) and 78 females (24.9%) in their respective age groups living below the poverty level.
| Age Bracket | Male | Female |
| Under 5 Years | 29 (17.3%) | 31 (19.0%) |
| 5 Years | 15 (27.3%) | 6 (13.0%) |
| 6 to 11 Years | 27 (11.4%) | 33 (18.5%) |
| 12 to 14 Years | 12 (10.2%) | 16 (10.6%) |
| 15 Years | 9 (20.9%) | 2 (6.1%) |
| 16 and 17 Years | 12 (14.8%) | 7 (8.6%) |
| 18 to 24 Years | 0 (0.0%) | 28 (18.8%) |
| 25 to 34 Years | 20 (6.3%) | 45 (14.1%) |
| 35 to 44 Years | 35 (9.4%) | 26 (7.8%) |
| 45 to 54 Years | 30 (8.4%) | 27 (8.8%) |
| 55 to 64 Years | 18 (4.0%) | 31 (6.8%) |
| 65 to 74 Years | 14 (3.7%) | 16 (4.2%) |
| 75 Years and over | 40 (12.8%) | 78 (24.9%) |
| Total | 261 (8.4%) | 346 (11.9%) |
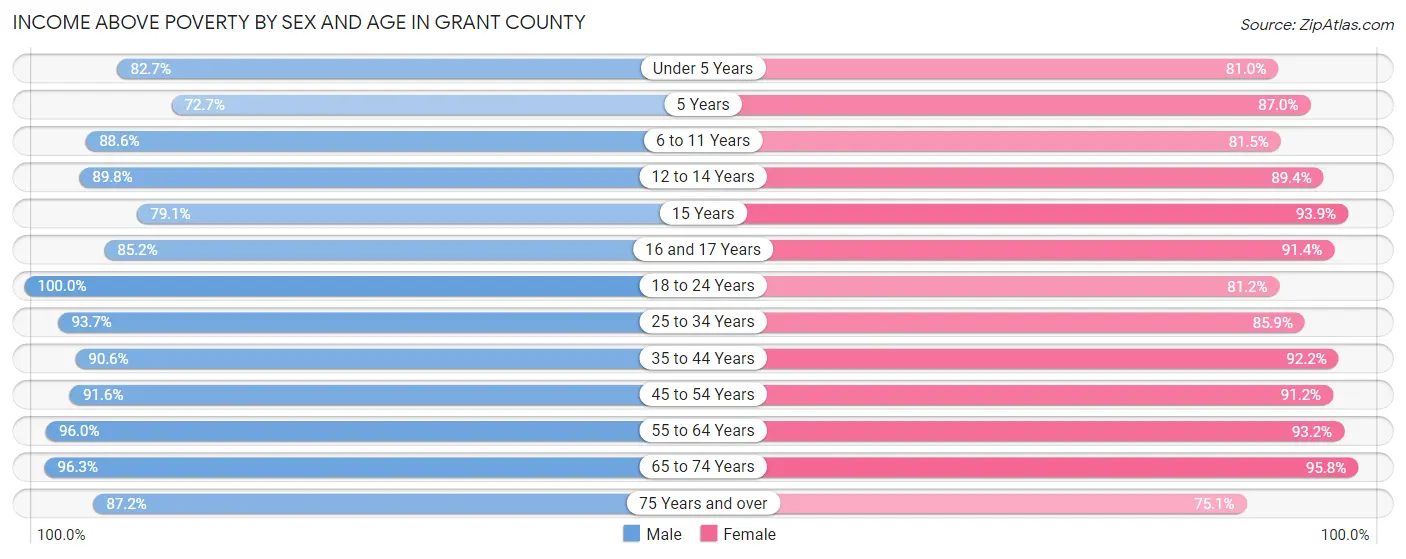
Income Above Poverty by Sex and Age in Grant County
According to the poverty statistics in Grant County, males aged 18 to 24 years and females aged 65 to 74 years are the age groups that are most secure financially, with 100.0% of males and 95.8% of females in these age groups living above the poverty line.
| Age Bracket | Male | Female |
| Under 5 Years | 139 (82.7%) | 132 (81.0%) |
| 5 Years | 40 (72.7%) | 40 (87.0%) |
| 6 to 11 Years | 209 (88.6%) | 145 (81.5%) |
| 12 to 14 Years | 106 (89.8%) | 135 (89.4%) |
| 15 Years | 34 (79.1%) | 31 (93.9%) |
| 16 and 17 Years | 69 (85.2%) | 74 (91.4%) |
| 18 to 24 Years | 208 (100.0%) | 121 (81.2%) |
| 25 to 34 Years | 298 (93.7%) | 275 (85.9%) |
| 35 to 44 Years | 336 (90.6%) | 308 (92.2%) |
| 45 to 54 Years | 326 (91.6%) | 278 (91.1%) |
| 55 to 64 Years | 433 (96.0%) | 425 (93.2%) |
| 65 to 74 Years | 362 (96.3%) | 366 (95.8%) |
| 75 Years and over | 273 (87.2%) | 235 (75.1%) |
| Total | 2,833 (91.6%) | 2,565 (88.1%) |
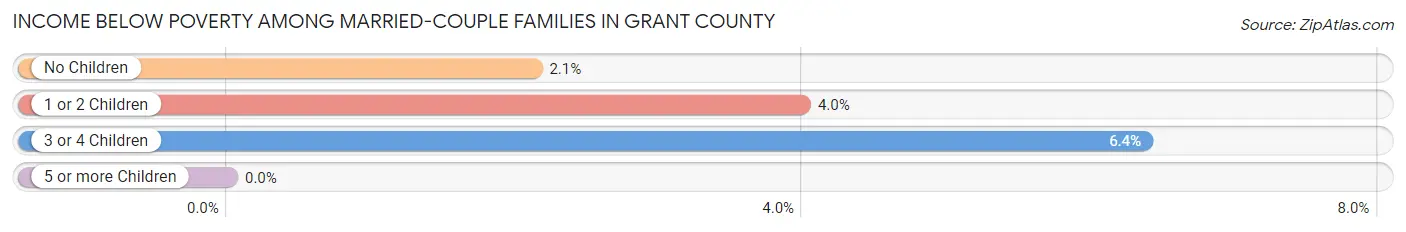
Income Below Poverty Among Married-Couple Families in Grant County
The poverty statistics for married-couple families in Grant County show that 3.0% or 40 of the total 1,332 families live below the poverty line. Families with 3 or 4 children have the highest poverty rate of 6.4%, comprising of 10 families. On the other hand, families with 5 or more children have the lowest poverty rate of 0.0%, which includes 0 families.
| Children | Above Poverty | Below Poverty |
| No Children | 832 (97.9%) | 18 (2.1%) |
| 1 or 2 Children | 289 (96.0%) | 12 (4.0%) |
| 3 or 4 Children | 147 (93.6%) | 10 (6.4%) |
| 5 or more Children | 24 (100.0%) | 0 (0.0%) |
| Total | 1,292 (97.0%) | 40 (3.0%) |
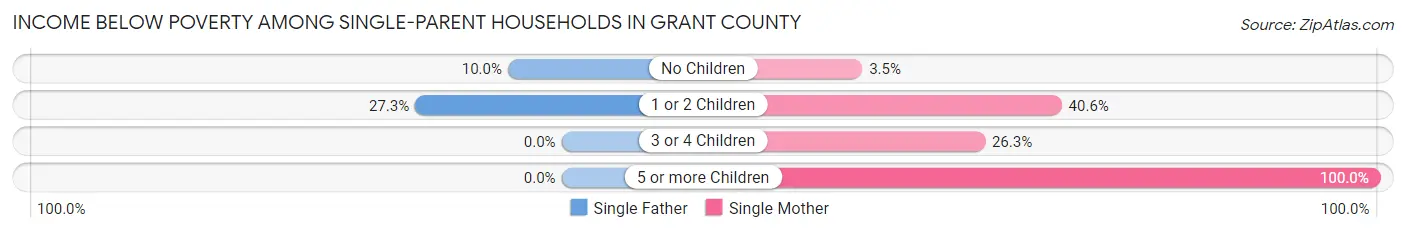
Income Below Poverty Among Single-Parent Households in Grant County
According to the poverty data in Grant County, 18.9% or 24 single-father households and 27.5% or 67 single-mother households are living below the poverty line. Among single-father households, those with 1 or 2 children have the highest poverty rate, with 18 households (27.3%) experiencing poverty. Likewise, among single-mother households, those with 5 or more children have the highest poverty rate, with 5 households (100.0%) falling below the poverty line.
| Children | Single Father | Single Mother |
| No Children | 6 (10.0%) | 3 (3.5%) |
| 1 or 2 Children | 18 (27.3%) | 54 (40.6%) |
| 3 or 4 Children | 0 (0.0%) | 5 (26.3%) |
| 5 or more Children | 0 (0.0%) | 5 (100.0%) |
| Total | 24 (18.9%) | 67 (27.5%) |
Income Below Poverty Among Married-Couple vs Single-Parent Households in Grant County
The poverty data for Grant County shows that 40 of the married-couple family households (3.0%) and 91 of the single-parent households (24.5%) are living below the poverty level. Within the married-couple family households, those with 3 or 4 children have the highest poverty rate, with 10 households (6.4%) falling below the poverty line. Among the single-parent households, those with 5 or more children have the highest poverty rate, with 5 household (100.0%) living below poverty.
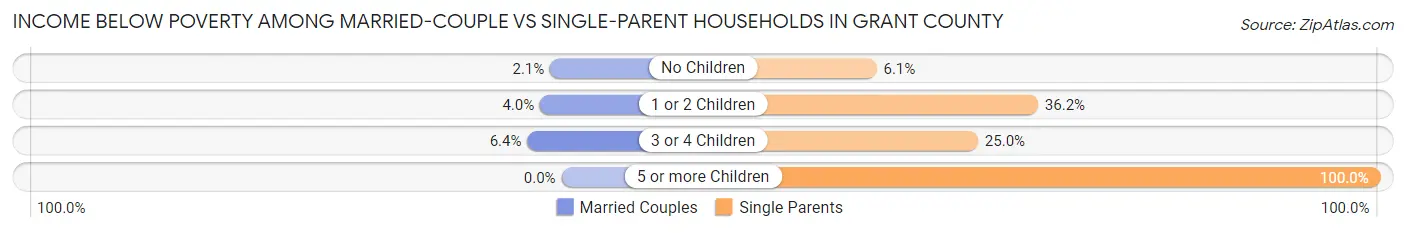
| Children | Married-Couple Families | Single-Parent Households |
| No Children | 18 (2.1%) | 9 (6.1%) |
| 1 or 2 Children | 12 (4.0%) | 72 (36.2%) |
| 3 or 4 Children | 10 (6.4%) | 5 (25.0%) |
| 5 or more Children | 0 (0.0%) | 5 (100.0%) |
| Total | 40 (3.0%) | 91 (24.5%) |
Race in Grant County
The most populous races in Grant County are White / Caucasian (5,762 | 94.6%), Two or more Races (182 | 3.0%), and Hispanic or Latino (154 | 2.5%).

| Race | # Population | % Population |
| Asian | 8 | 0.1% |
| Black / African American | 39 | 0.6% |
| Hawaiian / Pacific | 1 | 0.0% |
| Hispanic or Latino | 154 | 2.5% |
| Native / Alaskan | 28 | 0.5% |
| White / Caucasian | 5,762 | 94.6% |
| Two or more Races | 182 | 3.0% |
| Some other Race | 71 | 1.2% |
| Total | 6,091 | 100.0% |
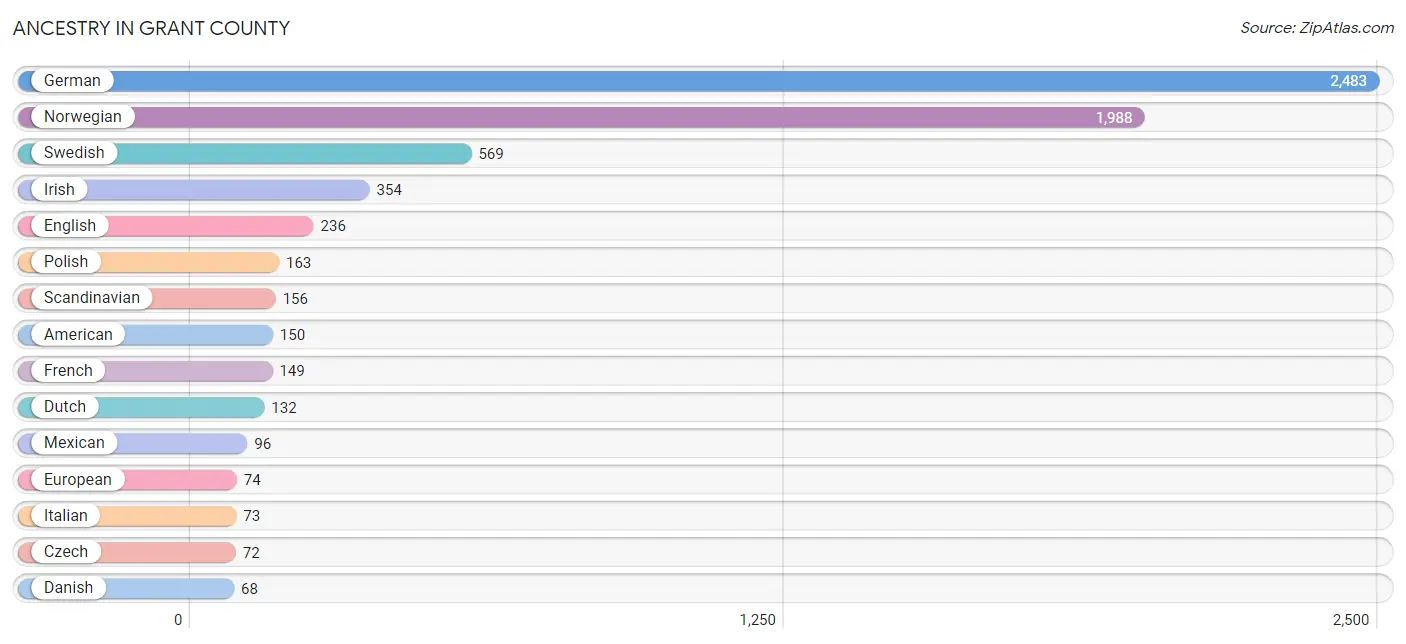
Ancestry in Grant County
The most populous ancestries reported in Grant County are German (2,483 | 40.8%), Norwegian (1,988 | 32.6%), Swedish (569 | 9.3%), Irish (354 | 5.8%), and English (236 | 3.9%), together accounting for 92.4% of all Grant County residents.
| Ancestry | # Population | % Population |
| Alaskan Athabascan | 1 | 0.0% |
| American | 150 | 2.5% |
| Armenian | 4 | 0.1% |
| Austrian | 5 | 0.1% |
| Belgian | 9 | 0.2% |
| Bhutanese | 10 | 0.2% |
| Blackfeet | 3 | 0.1% |
| Brazilian | 9 | 0.2% |
| Burmese | 12 | 0.2% |
| Canadian | 2 | 0.0% |
| Central American | 25 | 0.4% |
| Cherokee | 6 | 0.1% |
| Chippewa | 44 | 0.7% |
| Colombian | 5 | 0.1% |
| Cree | 2 | 0.0% |
| Creek | 1 | 0.0% |
| Croatian | 9 | 0.2% |
| Cuban | 2 | 0.0% |
| Czech | 72 | 1.2% |
| Czechoslovakian | 6 | 0.1% |
| Danish | 68 | 1.1% |
| Dutch | 132 | 2.2% |
| English | 236 | 3.9% |
| Ethiopian | 25 | 0.4% |
| European | 74 | 1.2% |
| Finnish | 56 | 0.9% |
| French | 149 | 2.5% |
| French Canadian | 31 | 0.5% |
| German | 2,483 | 40.8% |
| Greek | 9 | 0.2% |
| Guamanian / Chamorro | 2 | 0.0% |
| Guatemalan | 16 | 0.3% |
| Honduran | 2 | 0.0% |
| Hungarian | 14 | 0.2% |
| Icelander | 2 | 0.0% |
| Irish | 354 | 5.8% |
| Iroquois | 2 | 0.0% |
| Italian | 73 | 1.2% |
| Jamaican | 6 | 0.1% |
| Korean | 17 | 0.3% |
| Luxembourger | 3 | 0.1% |
| Mexican | 96 | 1.6% |
| Mexican American Indian | 1 | 0.0% |
| Nicaraguan | 7 | 0.1% |
| Northern European | 2 | 0.0% |
| Norwegian | 1,988 | 32.6% |
| Paraguayan | 3 | 0.1% |
| Pennsylvania German | 2 | 0.0% |
| Peruvian | 4 | 0.1% |
| Polish | 163 | 2.7% |
| Puerto Rican | 12 | 0.2% |
| Romanian | 26 | 0.4% |
| Russian | 14 | 0.2% |
| Scandinavian | 156 | 2.6% |
| Scotch-Irish | 27 | 0.4% |
| Scottish | 62 | 1.0% |
| Sioux | 8 | 0.1% |
| Slovak | 2 | 0.0% |
| South American | 12 | 0.2% |
| Subsaharan African | 25 | 0.4% |
| Swedish | 569 | 9.3% |
| Swiss | 54 | 0.9% |
| Ukrainian | 4 | 0.1% |
| Welsh | 22 | 0.4% | View All 64 Rows |
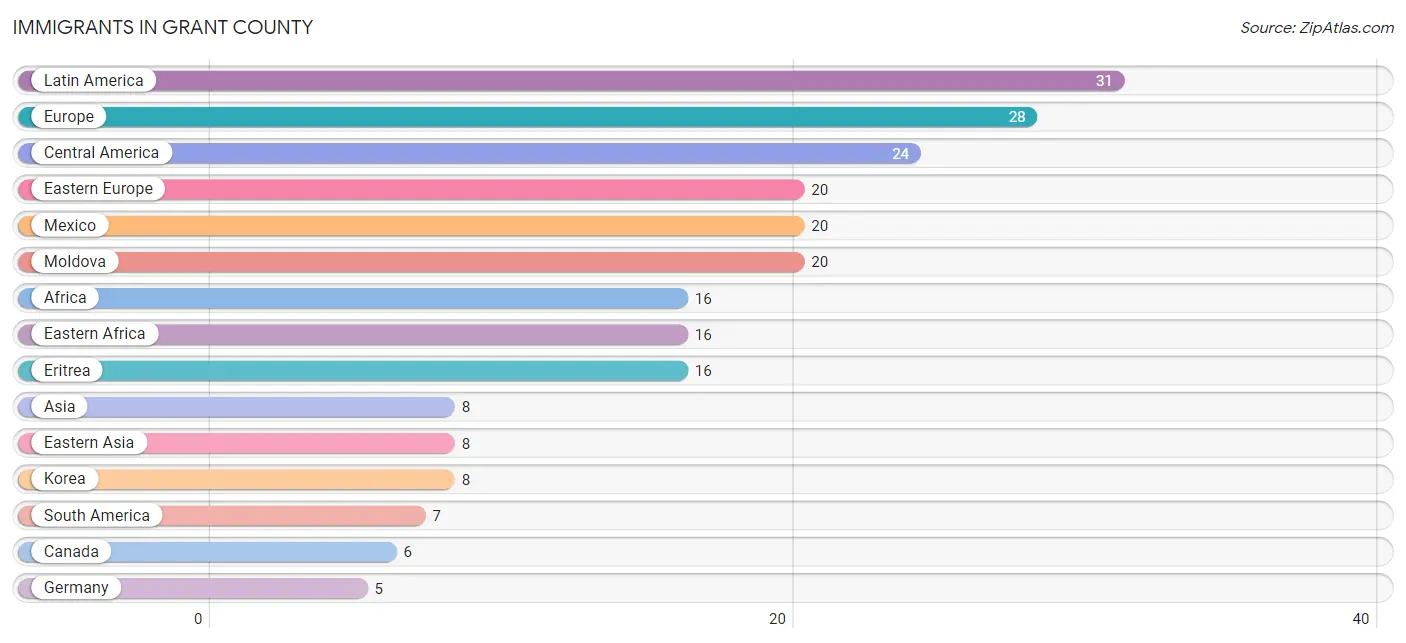
Immigrants in Grant County
The most numerous immigrant groups reported in Grant County came from Latin America (31 | 0.5%), Europe (28 | 0.5%), Central America (24 | 0.4%), Eastern Europe (20 | 0.3%), and Mexico (20 | 0.3%), together accounting for 2.0% of all Grant County residents.
| Immigration Origin | # Population | % Population |
| Africa | 16 | 0.3% |
| Asia | 8 | 0.1% |
| Brazil | 2 | 0.0% |
| Canada | 6 | 0.1% |
| Central America | 24 | 0.4% |
| Eastern Africa | 16 | 0.3% |
| Eastern Asia | 8 | 0.1% |
| Eastern Europe | 20 | 0.3% |
| England | 1 | 0.0% |
| Eritrea | 16 | 0.3% |
| Europe | 28 | 0.5% |
| Germany | 5 | 0.1% |
| Guatemala | 1 | 0.0% |
| Ireland | 2 | 0.0% |
| Korea | 8 | 0.1% |
| Latin America | 31 | 0.5% |
| Mexico | 20 | 0.3% |
| Moldova | 20 | 0.3% |
| Nicaragua | 3 | 0.1% |
| Northern Europe | 3 | 0.1% |
| Peru | 2 | 0.0% |
| South America | 7 | 0.1% |
| Western Europe | 5 | 0.1% | View All 23 Rows |
Sex and Age in Grant County
Sex and Age in Grant County
The most populous age groups in Grant County are 5 to 9 Years (239 | 7.6%) for men and 55 to 59 Years (229 | 7.7%) for women.
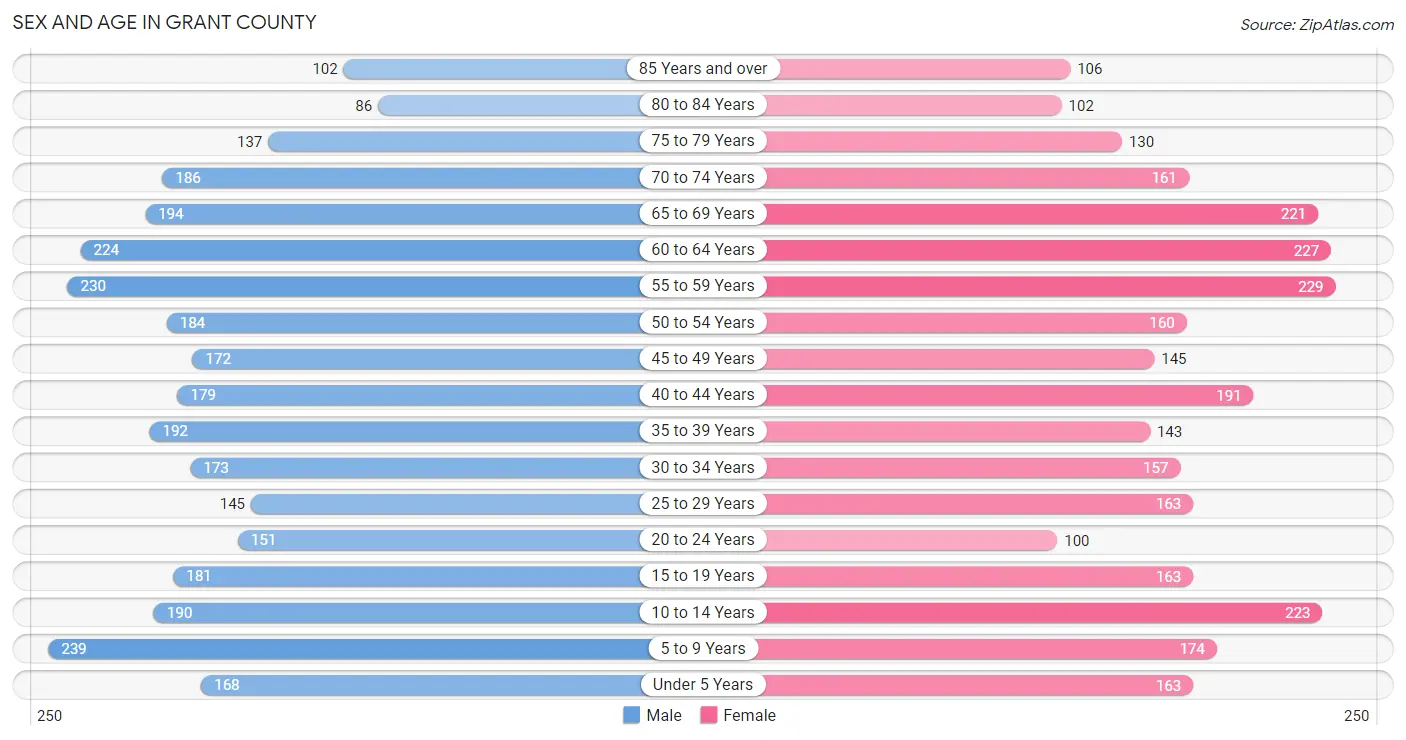
| Age Bracket | Male | Female |
| Under 5 Years | 168 (5.4%) | 163 (5.5%) |
| 5 to 9 Years | 239 (7.6%) | 174 (5.9%) |
| 10 to 14 Years | 190 (6.1%) | 223 (7.5%) |
| 15 to 19 Years | 181 (5.8%) | 163 (5.5%) |
| 20 to 24 Years | 151 (4.8%) | 100 (3.4%) |
| 25 to 29 Years | 145 (4.6%) | 163 (5.5%) |
| 30 to 34 Years | 173 (5.5%) | 157 (5.3%) |
| 35 to 39 Years | 192 (6.1%) | 143 (4.8%) |
| 40 to 44 Years | 179 (5.7%) | 191 (6.5%) |
| 45 to 49 Years | 172 (5.5%) | 145 (4.9%) |
| 50 to 54 Years | 184 (5.9%) | 160 (5.4%) |
| 55 to 59 Years | 230 (7.3%) | 229 (7.7%) |
| 60 to 64 Years | 224 (7.1%) | 227 (7.7%) |
| 65 to 69 Years | 194 (6.2%) | 221 (7.5%) |
| 70 to 74 Years | 186 (5.9%) | 161 (5.4%) |
| 75 to 79 Years | 137 (4.4%) | 130 (4.4%) |
| 80 to 84 Years | 86 (2.7%) | 102 (3.5%) |
| 85 Years and over | 102 (3.3%) | 106 (3.6%) |
| Total | 3,133 (100.0%) | 2,958 (100.0%) |
Families and Households in Grant County
Median Family Size in Grant County
The median family size in Grant County is 2.88 persons per family, with single female/mother families (244 | 14.3%) accounting for the largest median family size of 3.01 persons per family. On the other hand, single male/father families (127 | 7.5%) represent the smallest median family size with 2.39 persons per family.

| Family Type | # Families | Family Size |
| Married-Couple | 1,332 (78.2%) | 2.91 |
| Single Male/Father | 127 (7.5%) | 2.39 |
| Single Female/Mother | 244 (14.3%) | 3.01 |
| Total Families | 1,703 (100.0%) | 2.88 |
Median Household Size in Grant County
The median household size in Grant County is 2.36 persons per household, with single female/mother households (244 | 9.6%) accounting for the largest median household size of 3.27 persons per household. non-family households (837 | 33.0%) represent the smallest median household size with 1.11 persons per household.

| Household Type | # Households | Household Size |
| Married-Couple | 1,332 (52.4%) | 2.95 |
| Single Male/Father | 127 (5.0%) | 2.71 |
| Single Female/Mother | 244 (9.6%) | 3.27 |
| Non-family | 837 (33.0%) | 1.11 |
| Total Households | 2,540 (100.0%) | 2.36 |
Household Size by Marriage Status in Grant County
Out of a total of 2,540 households in Grant County, 1,703 (67.0%) are family households, while 837 (33.0%) are nonfamily households. The most numerous type of family households are 2-person households, comprising 891, and the most common type of nonfamily households are 1-person households, comprising 756.

| Household Size | Family Households | Nonfamily Households |
| 1-Person Households | - | 756 (29.8%) |
| 2-Person Households | 891 (35.1%) | 81 (3.2%) |
| 3-Person Households | 323 (12.7%) | 0 (0.0%) |
| 4-Person Households | 255 (10.0%) | 0 (0.0%) |
| 5-Person Households | 165 (6.5%) | 0 (0.0%) |
| 6-Person Households | 39 (1.5%) | 0 (0.0%) |
| 7+ Person Households | 30 (1.2%) | 0 (0.0%) |
| Total | 1,703 (67.0%) | 837 (33.0%) |
Female Fertility in Grant County
Fertility by Age in Grant County
Average fertility rate in Grant County is 57.0 births per 1,000 women. Women in the age bracket of 20 to 34 years have the highest fertility rate with 121.0 births per 1,000 women. Women in the age bracket of 20 to 34 years acount for 80.9% of all women with births.
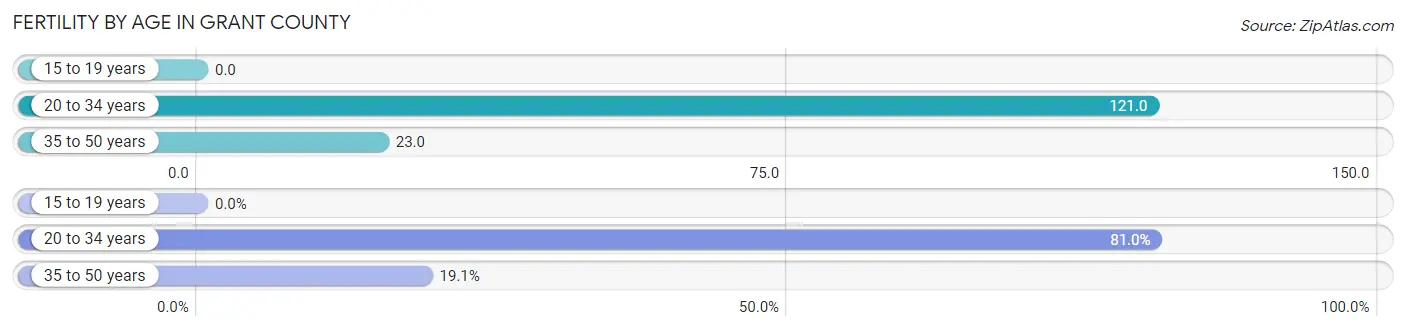
| Age Bracket | Women with Births | Births / 1,000 Women |
| 15 to 19 years | 0 (0.0%) | 0.0 |
| 20 to 34 years | 51 (80.9%) | 121.0 |
| 35 to 50 years | 12 (19.1%) | 23.0 |
| Total | 63 (100.0%) | 57.0 |
Fertility by Age by Marriage Status in Grant County
73.0% of women with births (63) in Grant County are married. The highest percentage of unmarried women with births falls into 35 to 50 years age bracket with 33.3% of them unmarried at the time of birth, while the lowest percentage of unmarried women with births belong to 20 to 34 years age bracket with 25.5% of them unmarried.
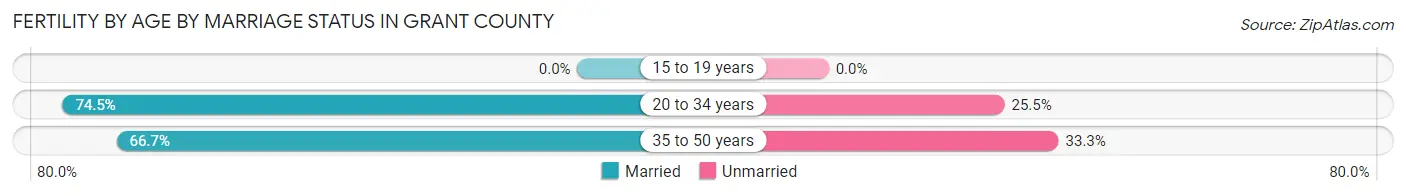
| Age Bracket | Married | Unmarried |
| 15 to 19 years | 0 (0.0%) | 0 (0.0%) |
| 20 to 34 years | 38 (74.5%) | 13 (25.5%) |
| 35 to 50 years | 8 (66.7%) | 4 (33.3%) |
| Total | 46 (73.0%) | 17 (27.0%) |
Fertility by Education in Grant County

| Educational Attainment | Women with Births | Births / 1,000 Women |
| Less than High School | 0 (0.0%) | 0.0 |
| High School Diploma | 12 (19.1%) | 57.0 |
| College or Associate's Degree | 32 (50.8%) | 66.0 |
| Bachelor's Degree | 18 (28.6%) | 91.0 |
| Graduate Degree | 1 (1.6%) | 21.0 |
| Total | 63 (100.0%) | 57.0 |
Fertility by Education by Marriage Status in Grant County
27.0% of women with births in Grant County are unmarried. Women with the educational attainment of graduate degree are most likely to be married with 100.0% of them married at childbirth, while women with the educational attainment of high school diploma are least likely to be married with 41.7% of them unmarried at childbirth.
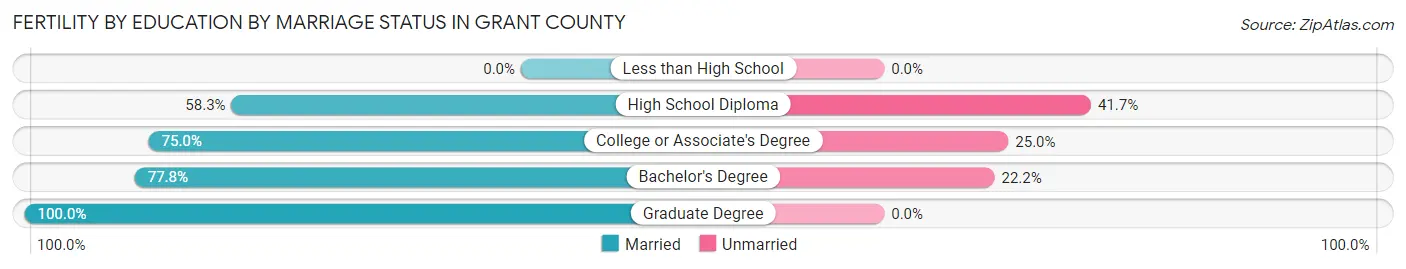
| Educational Attainment | Married | Unmarried |
| Less than High School | 0 (0.0%) | 0 (0.0%) |
| High School Diploma | 7 (58.3%) | 5 (41.7%) |
| College or Associate's Degree | 24 (75.0%) | 8 (25.0%) |
| Bachelor's Degree | 14 (77.8%) | 4 (22.2%) |
| Graduate Degree | 1 (100.0%) | 0 (0.0%) |
| Total | 46 (73.0%) | 17 (27.0%) |
Employment Characteristics in Grant County
Employment by Class of Employer in Grant County
Among the 2,864 employed individuals in Grant County, private company employees (1,696 | 59.2%), self-employed (not incorporated) (409 | 14.3%), and local government employees (248 | 8.7%) make up the most common classes of employment.
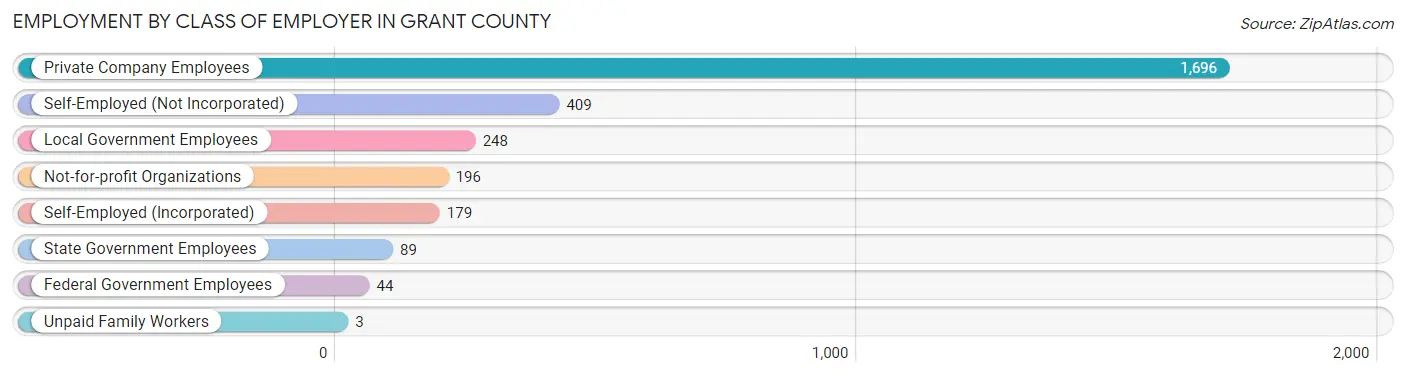
| Employer Class | # Employees | % Employees |
| Private Company Employees | 1,696 | 59.2% |
| Self-Employed (Incorporated) | 179 | 6.2% |
| Self-Employed (Not Incorporated) | 409 | 14.3% |
| Not-for-profit Organizations | 196 | 6.8% |
| Local Government Employees | 248 | 8.7% |
| State Government Employees | 89 | 3.1% |
| Federal Government Employees | 44 | 1.5% |
| Unpaid Family Workers | 3 | 0.1% |
| Total | 2,864 | 100.0% |
Employment Status by Age in Grant County
According to the labor force statistics for Grant County, out of the total population over 16 years of age (4,858), 62.2% or 3,022 individuals are in the labor force, with 3.7% or 112 of them unemployed. The age group with the highest labor force participation rate is 20 to 24 years, with 96.4% or 242 individuals in the labor force. Within the labor force, the 20 to 24 years age range has the highest percentage of unemployed individuals, with 18.2% or 44 of them being unemployed.
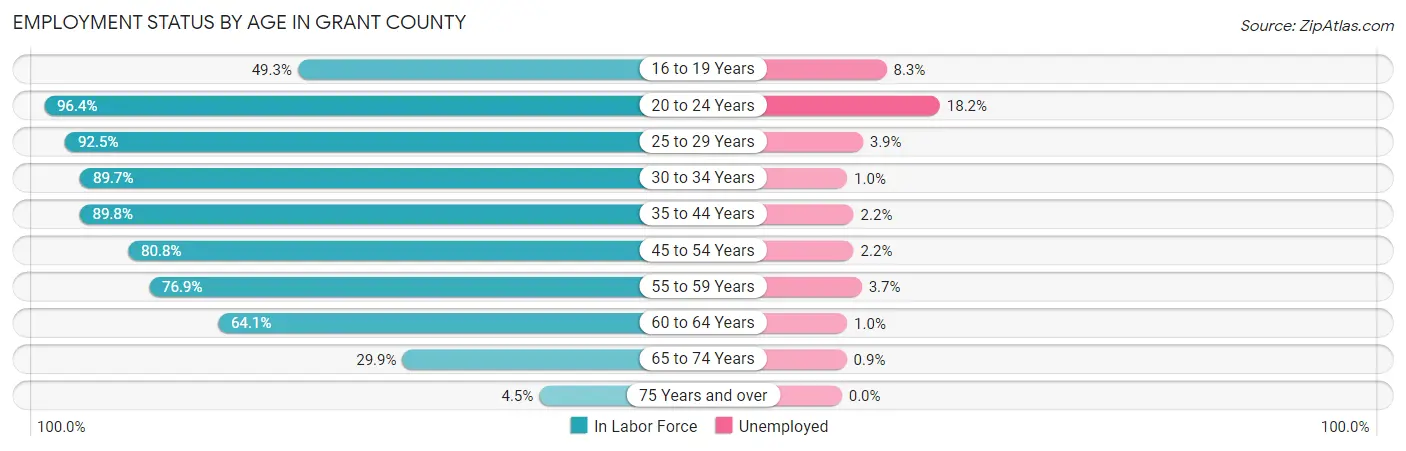
| Age Bracket | In Labor Force | Unemployed |
| 16 to 19 Years | 132 (49.3%) | 11 (8.3%) |
| 20 to 24 Years | 242 (96.4%) | 44 (18.2%) |
| 25 to 29 Years | 285 (92.5%) | 11 (3.9%) |
| 30 to 34 Years | 296 (89.7%) | 3 (1.0%) |
| 35 to 44 Years | 633 (89.8%) | 14 (2.2%) |
| 45 to 54 Years | 534 (80.8%) | 12 (2.2%) |
| 55 to 59 Years | 353 (76.9%) | 13 (3.7%) |
| 60 to 64 Years | 289 (64.1%) | 3 (1.0%) |
| 65 to 74 Years | 228 (29.9%) | 2 (0.9%) |
| 75 Years and over | 30 (4.5%) | 0 (0.0%) |
| Total | 3,022 (62.2%) | 112 (3.7%) |
Employment Status by Educational Attainment in Grant County
According to labor force statistics for Grant County, 82.0% of individuals (2,389) out of the total population between 25 and 64 years of age (2,914) are in the labor force, with 2.3% or 55 of them being unemployed. The group with the highest labor force participation rate are those with the educational attainment of bachelor's degree or higher, with 88.8% or 529 individuals in the labor force. Within the labor force, individuals with less than high school education have the highest percentage of unemployment, with 3.7% or 4 of them being unemployed.
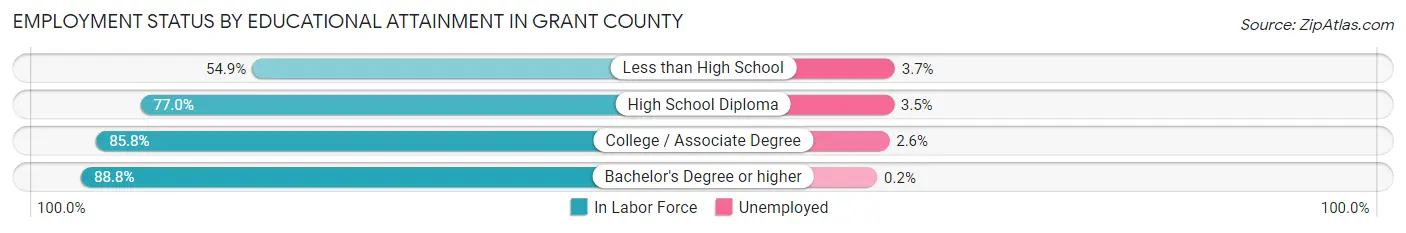
| Educational Attainment | In Labor Force | Unemployed |
| Less than High School | 107 (54.9%) | 7 (3.7%) |
| High School Diploma | 597 (77.0%) | 27 (3.5%) |
| College / Associate Degree | 1,157 (85.8%) | 35 (2.6%) |
| Bachelor's Degree or higher | 529 (88.8%) | 1 (0.2%) |
| Total | 2,389 (82.0%) | 67 (2.3%) |
Employment Occupations by Sex in Grant County
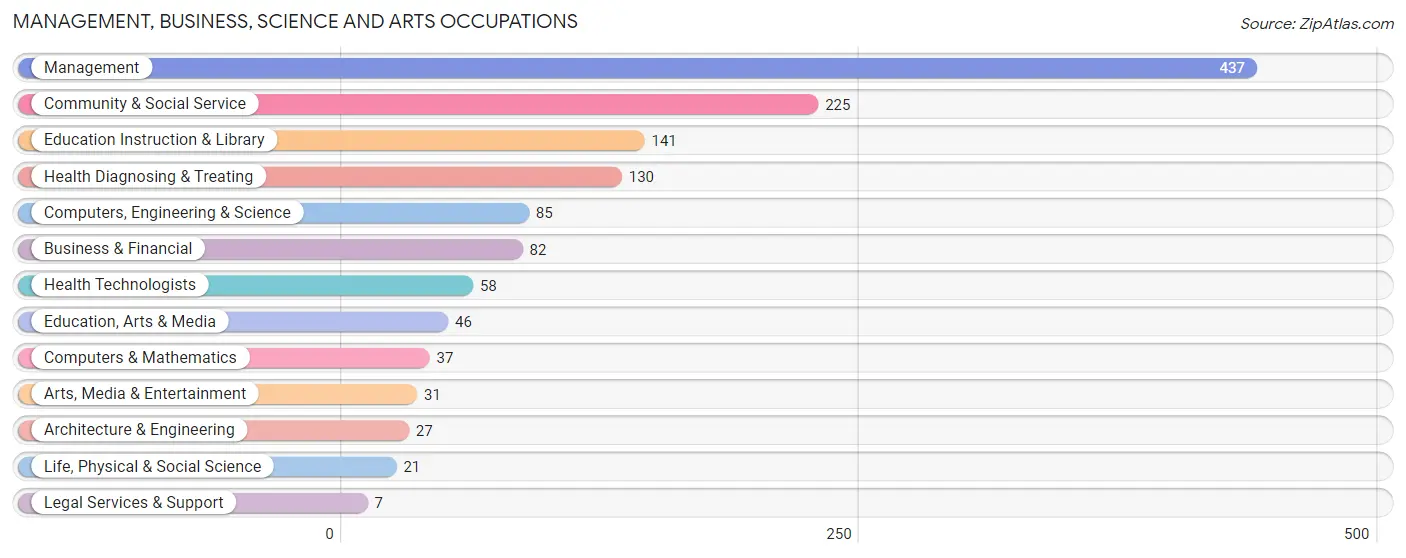
Management, Business, Science and Arts Occupations
The most common Management, Business, Science and Arts occupations in Grant County are Management (437 | 15.0%), Community & Social Service (225 | 7.7%), Education Instruction & Library (141 | 4.9%), Health Diagnosing & Treating (130 | 4.5%), and Computers, Engineering & Science (85 | 2.9%).
Management, Business, Science and Arts Occupations by Sex
Within the Management, Business, Science and Arts occupations in Grant County, the most male-oriented occupations are Architecture & Engineering (100.0%), Management (73.0%), and Computers, Engineering & Science (67.1%), while the most female-oriented occupations are Health Diagnosing & Treating (88.5%), Education Instruction & Library (84.4%), and Health Technologists (82.8%).
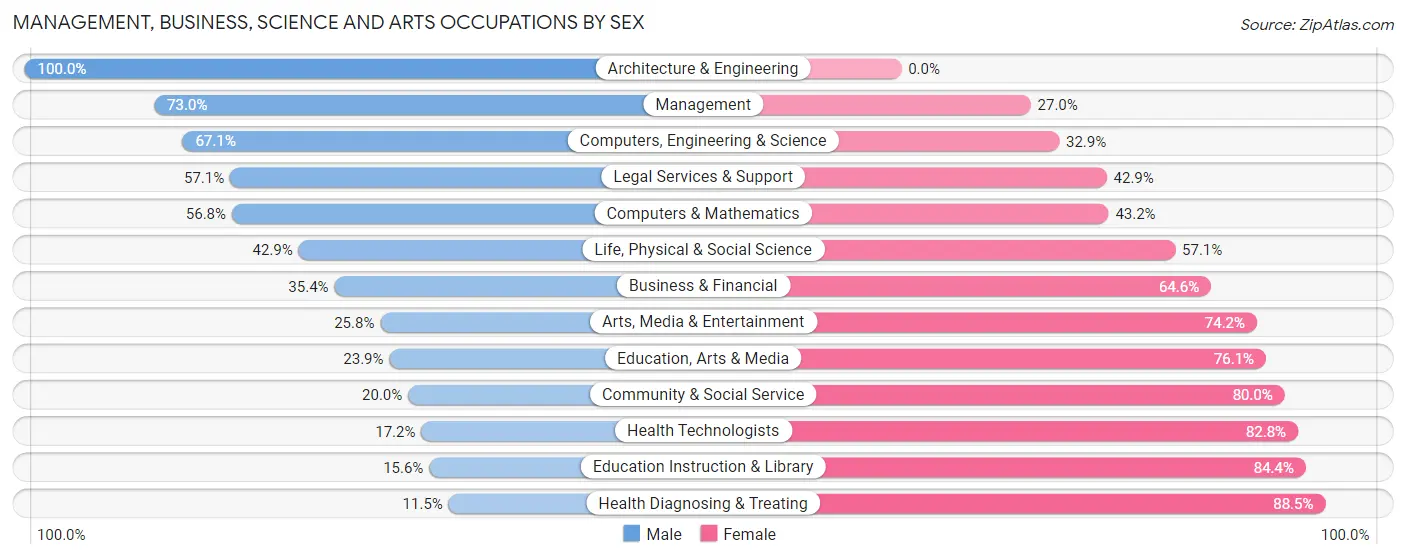
| Occupation | Male | Female |
| Management | 319 (73.0%) | 118 (27.0%) |
| Business & Financial | 29 (35.4%) | 53 (64.6%) |
| Computers, Engineering & Science | 57 (67.1%) | 28 (32.9%) |
| Computers & Mathematics | 21 (56.8%) | 16 (43.2%) |
| Architecture & Engineering | 27 (100.0%) | 0 (0.0%) |
| Life, Physical & Social Science | 9 (42.9%) | 12 (57.1%) |
| Community & Social Service | 45 (20.0%) | 180 (80.0%) |
| Education, Arts & Media | 11 (23.9%) | 35 (76.1%) |
| Legal Services & Support | 4 (57.1%) | 3 (42.9%) |
| Education Instruction & Library | 22 (15.6%) | 119 (84.4%) |
| Arts, Media & Entertainment | 8 (25.8%) | 23 (74.2%) |
| Health Diagnosing & Treating | 15 (11.5%) | 115 (88.5%) |
| Health Technologists | 10 (17.2%) | 48 (82.8%) |
| Total (Category) | 465 (48.5%) | 494 (51.5%) |
| Total (Overall) | 1,592 (54.7%) | 1,316 (45.3%) |
Services Occupations
The most common Services occupations in Grant County are Food Preparation & Serving (153 | 5.3%), Healthcare Support (142 | 4.9%), Personal Care & Service (104 | 3.6%), Cleaning & Maintenance (102 | 3.5%), and Security & Protection (26 | 0.9%).

Services Occupations by Sex
Within the Services occupations in Grant County, the most male-oriented occupations are Security & Protection (100.0%), Firefighting & Prevention (100.0%), and Law Enforcement (100.0%), while the most female-oriented occupations are Healthcare Support (96.5%), Personal Care & Service (85.6%), and Food Preparation & Serving (71.2%).
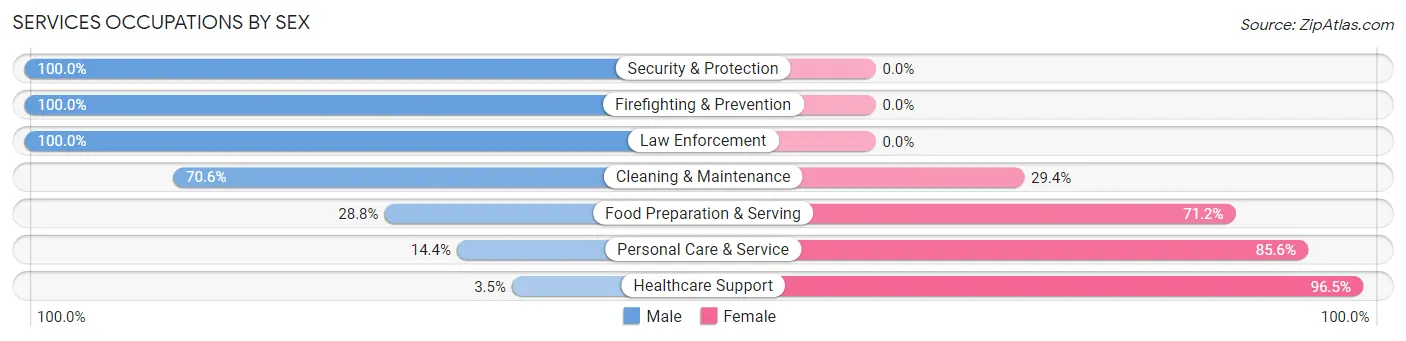
| Occupation | Male | Female |
| Healthcare Support | 5 (3.5%) | 137 (96.5%) |
| Security & Protection | 26 (100.0%) | 0 (0.0%) |
| Firefighting & Prevention | 9 (100.0%) | 0 (0.0%) |
| Law Enforcement | 17 (100.0%) | 0 (0.0%) |
| Food Preparation & Serving | 44 (28.8%) | 109 (71.2%) |
| Cleaning & Maintenance | 72 (70.6%) | 30 (29.4%) |
| Personal Care & Service | 15 (14.4%) | 89 (85.6%) |
| Total (Category) | 162 (30.7%) | 365 (69.3%) |
| Total (Overall) | 1,592 (54.7%) | 1,316 (45.3%) |
Sales and Office Occupations
The most common Sales and Office occupations in Grant County are Office & Administration (290 | 10.0%), and Sales & Related (272 | 9.3%).
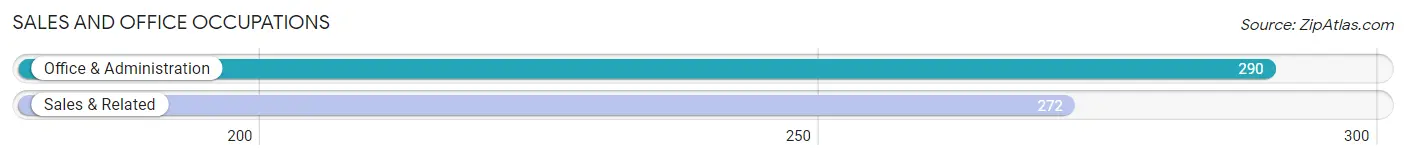
Sales and Office Occupations by Sex

| Occupation | Male | Female |
| Sales & Related | 137 (50.4%) | 135 (49.6%) |
| Office & Administration | 56 (19.3%) | 234 (80.7%) |
| Total (Category) | 193 (34.3%) | 369 (65.7%) |
| Total (Overall) | 1,592 (54.7%) | 1,316 (45.3%) |
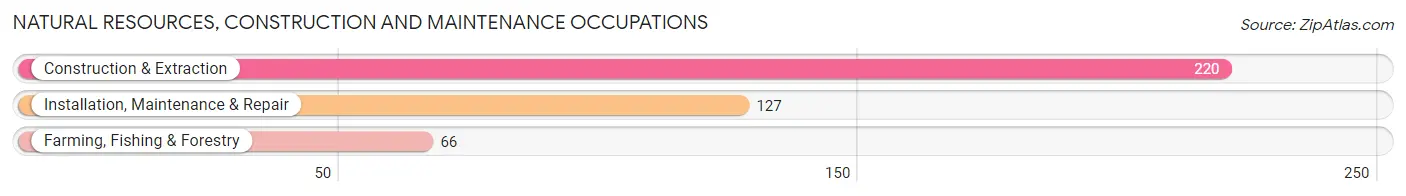
Natural Resources, Construction and Maintenance Occupations
The most common Natural Resources, Construction and Maintenance occupations in Grant County are Construction & Extraction (220 | 7.6%), Installation, Maintenance & Repair (127 | 4.4%), and Farming, Fishing & Forestry (66 | 2.3%).
Natural Resources, Construction and Maintenance Occupations by Sex
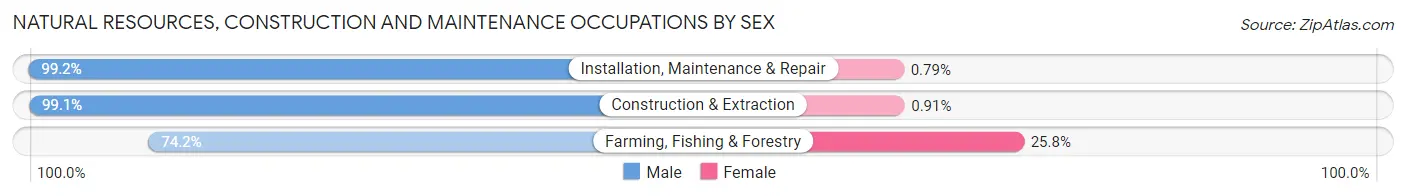
| Occupation | Male | Female |
| Farming, Fishing & Forestry | 49 (74.2%) | 17 (25.8%) |
| Construction & Extraction | 218 (99.1%) | 2 (0.9%) |
| Installation, Maintenance & Repair | 126 (99.2%) | 1 (0.8%) |
| Total (Category) | 393 (95.2%) | 20 (4.8%) |
| Total (Overall) | 1,592 (54.7%) | 1,316 (45.3%) |
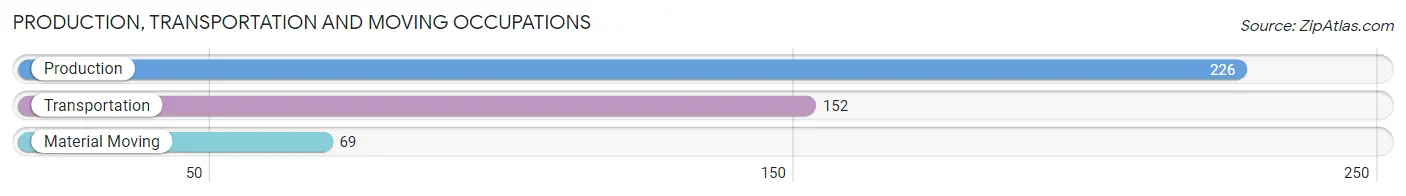
Production, Transportation and Moving Occupations
The most common Production, Transportation and Moving occupations in Grant County are Production (226 | 7.8%), Transportation (152 | 5.2%), and Material Moving (69 | 2.4%).
Production, Transportation and Moving Occupations by Sex
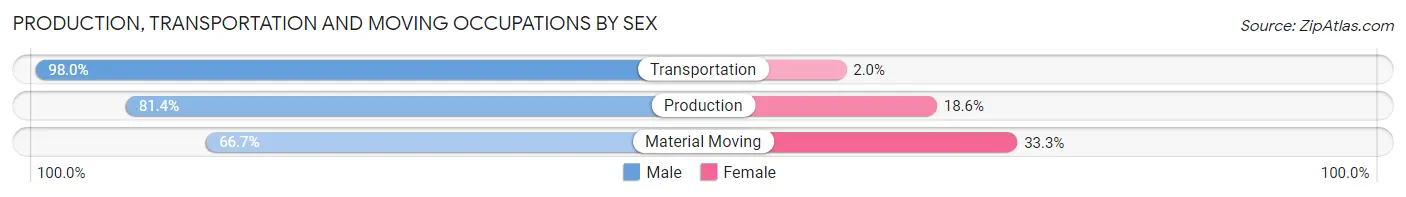
| Occupation | Male | Female |
| Production | 184 (81.4%) | 42 (18.6%) |
| Transportation | 149 (98.0%) | 3 (2.0%) |
| Material Moving | 46 (66.7%) | 23 (33.3%) |
| Total (Category) | 379 (84.8%) | 68 (15.2%) |
| Total (Overall) | 1,592 (54.7%) | 1,316 (45.3%) |
Employment Industries by Sex in Grant County
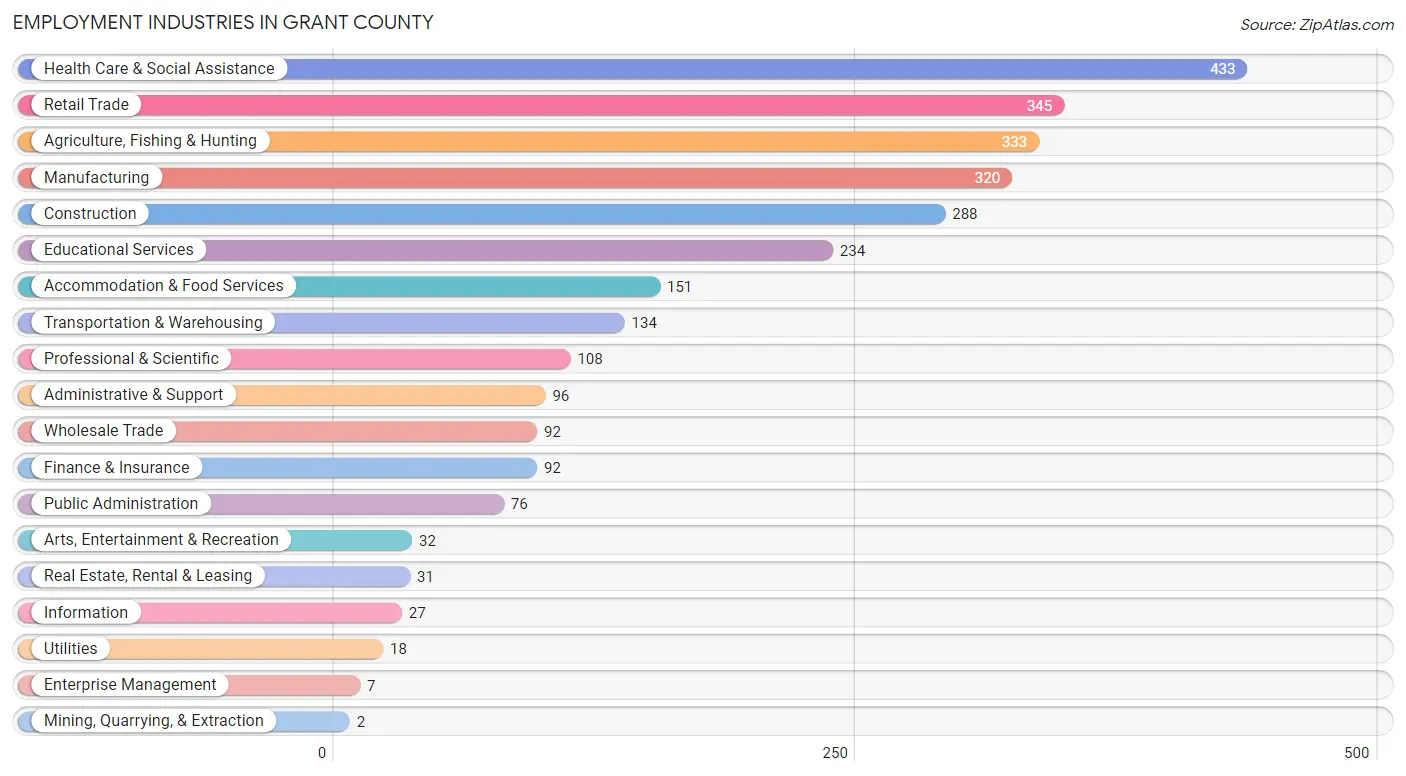
Employment Industries in Grant County
The major employment industries in Grant County include Health Care & Social Assistance (433 | 14.9%), Retail Trade (345 | 11.9%), Agriculture, Fishing & Hunting (333 | 11.5%), Manufacturing (320 | 11.0%), and Construction (288 | 9.9%).
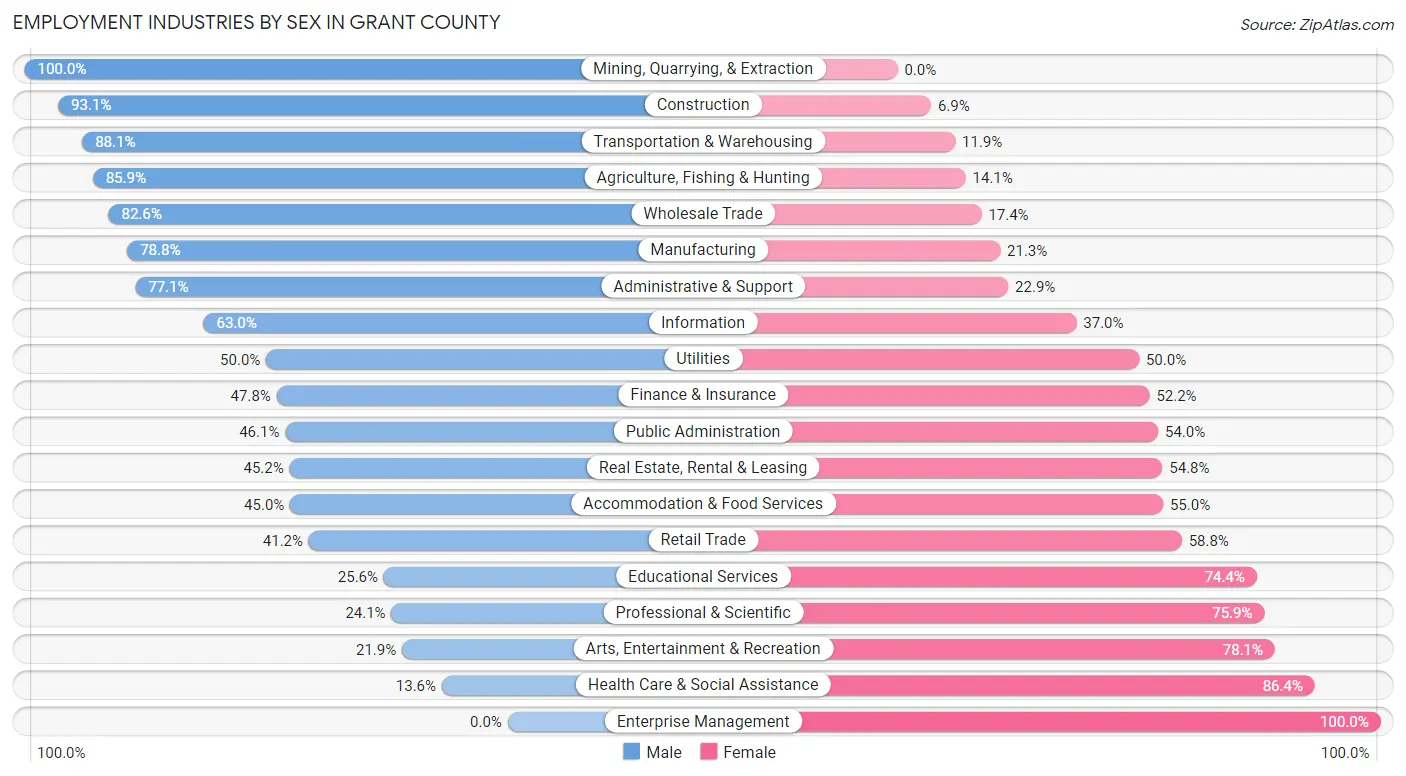
Employment Industries by Sex in Grant County
The Grant County industries that see more men than women are Mining, Quarrying, & Extraction (100.0%), Construction (93.1%), and Transportation & Warehousing (88.1%), whereas the industries that tend to have a higher number of women are Enterprise Management (100.0%), Health Care & Social Assistance (86.4%), and Arts, Entertainment & Recreation (78.1%).
| Industry | Male | Female |
| Agriculture, Fishing & Hunting | 286 (85.9%) | 47 (14.1%) |
| Mining, Quarrying, & Extraction | 2 (100.0%) | 0 (0.0%) |
| Construction | 268 (93.1%) | 20 (6.9%) |
| Manufacturing | 252 (78.7%) | 68 (21.2%) |
| Wholesale Trade | 76 (82.6%) | 16 (17.4%) |
| Retail Trade | 142 (41.2%) | 203 (58.8%) |
| Transportation & Warehousing | 118 (88.1%) | 16 (11.9%) |
| Utilities | 9 (50.0%) | 9 (50.0%) |
| Information | 17 (63.0%) | 10 (37.0%) |
| Finance & Insurance | 44 (47.8%) | 48 (52.2%) |
| Real Estate, Rental & Leasing | 14 (45.2%) | 17 (54.8%) |
| Professional & Scientific | 26 (24.1%) | 82 (75.9%) |
| Enterprise Management | 0 (0.0%) | 7 (100.0%) |
| Administrative & Support | 74 (77.1%) | 22 (22.9%) |
| Educational Services | 60 (25.6%) | 174 (74.4%) |
| Health Care & Social Assistance | 59 (13.6%) | 374 (86.4%) |
| Arts, Entertainment & Recreation | 7 (21.9%) | 25 (78.1%) |
| Accommodation & Food Services | 68 (45.0%) | 83 (55.0%) |
| Public Administration | 35 (46.1%) | 41 (53.9%) |
| Total | 1,592 (54.7%) | 1,316 (45.3%) |
Education in Grant County
School Enrollment in Grant County
The most common levels of schooling among the 1,323 students in Grant County are middle school (351 | 26.5%), high school (307 | 23.2%), and elementary school (290 | 21.9%).

| School Level | # Students | % Students |
| Nursery / Preschool | 118 | 8.9% |
| Kindergarten | 93 | 7.0% |
| Elementary School | 290 | 21.9% |
| Middle School | 351 | 26.5% |
| High School | 307 | 23.2% |
| College / Undergraduate | 120 | 9.1% |
| Graduate / Professional | 44 | 3.3% |
| Total | 1,323 | 100.0% |
School Enrollment by Age by Funding Source in Grant County
Out of a total of 1,323 students who are enrolled in schools in Grant County, 74 (5.6%) attend a private institution, while the remaining 1,249 (94.4%) are enrolled in public schools. The age group of 20 to 24 year olds has the highest likelihood of being enrolled in private schools, with 15 (28.3% in the age bracket) enrolled. Conversely, the age group of 3 to 4 year olds has the lowest likelihood of being enrolled in a private school, with 99 (100.0% in the age bracket) attending a public institution.
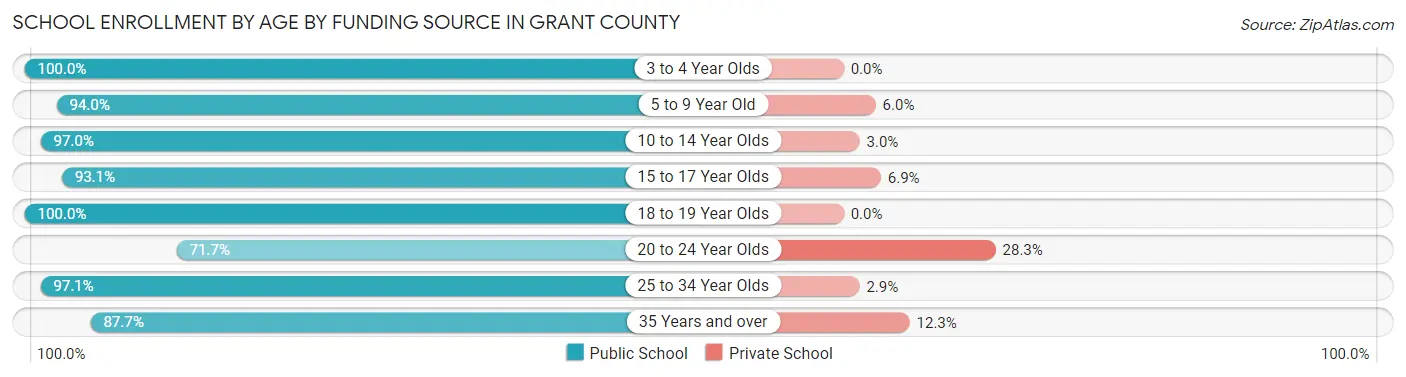
| Age Bracket | Public School | Private School |
| 3 to 4 Year Olds | 99 (100.0%) | 0 (0.0%) |
| 5 to 9 Year Old | 363 (94.0%) | 23 (6.0%) |
| 10 to 14 Year Olds | 392 (97.0%) | 12 (3.0%) |
| 15 to 17 Year Olds | 215 (93.1%) | 16 (6.9%) |
| 18 to 19 Year Olds | 59 (100.0%) | 0 (0.0%) |
| 20 to 24 Year Olds | 38 (71.7%) | 15 (28.3%) |
| 25 to 34 Year Olds | 33 (97.1%) | 1 (2.9%) |
| 35 Years and over | 50 (87.7%) | 7 (12.3%) |
| Total | 1,249 (94.4%) | 74 (5.6%) |
Educational Attainment by Field of Study in Grant County
Education (211 | 24.2%), business (136 | 15.6%), bio, nature & agricultural (119 | 13.7%), science & technology (96 | 11.0%), and engineering (56 | 6.4%) are the most common fields of study among 872 individuals in Grant County who have obtained a bachelor's degree or higher.
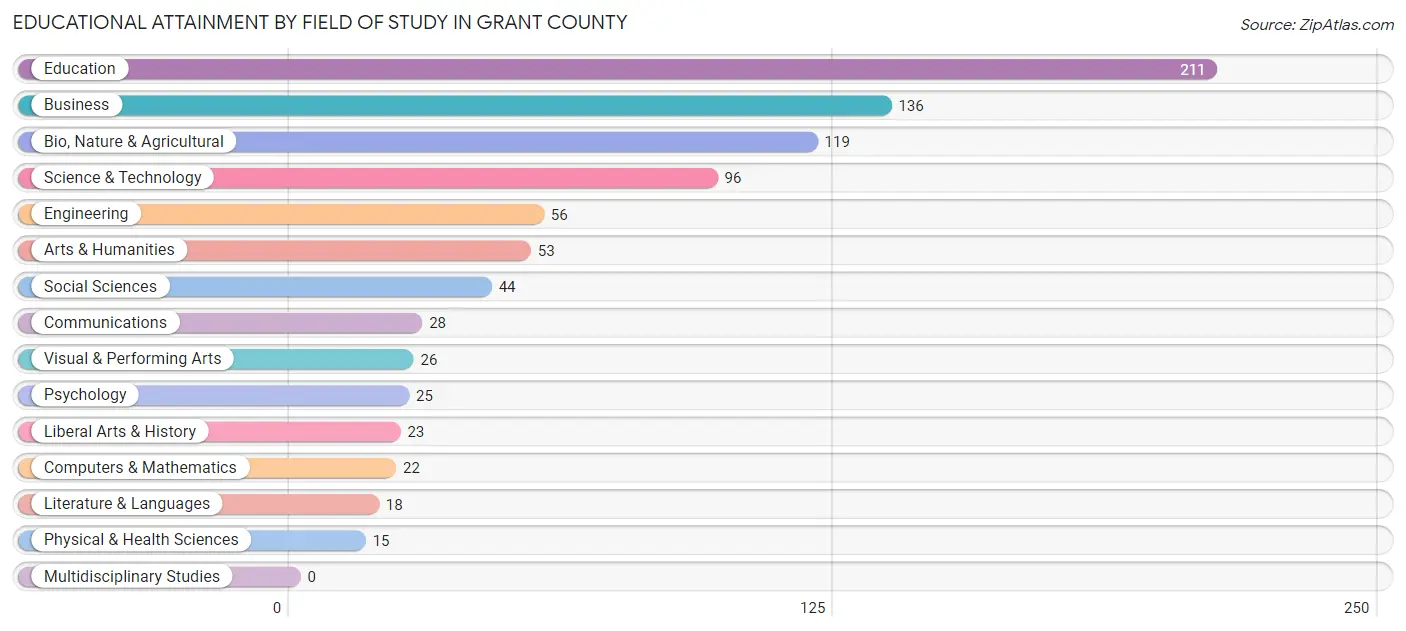
| Field of Study | # Graduates | % Graduates |
| Computers & Mathematics | 22 | 2.5% |
| Bio, Nature & Agricultural | 119 | 13.7% |
| Physical & Health Sciences | 15 | 1.7% |
| Psychology | 25 | 2.9% |
| Social Sciences | 44 | 5.1% |
| Engineering | 56 | 6.4% |
| Multidisciplinary Studies | 0 | 0.0% |
| Science & Technology | 96 | 11.0% |
| Business | 136 | 15.6% |
| Education | 211 | 24.2% |
| Literature & Languages | 18 | 2.1% |
| Liberal Arts & History | 23 | 2.6% |
| Visual & Performing Arts | 26 | 3.0% |
| Communications | 28 | 3.2% |
| Arts & Humanities | 53 | 6.1% |
| Total | 872 | 100.0% |
Transportation & Commute in Grant County
Vehicle Availability by Sex in Grant County
The most prevalent vehicle ownership categories in Grant County are males with 2 vehicles (473, accounting for 30.1%) and females with 2 vehicles (440, making up 36.9%).
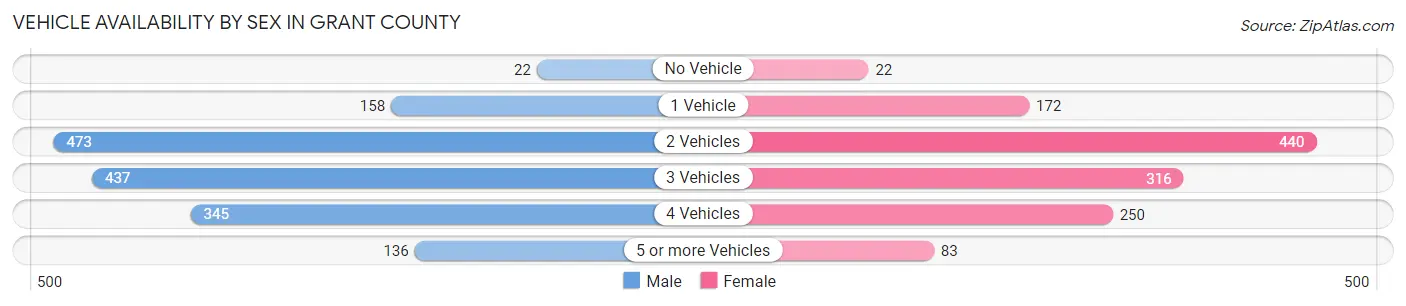
| Vehicles Available | Male | Female |
| No Vehicle | 22 (1.4%) | 22 (1.7%) |
| 1 Vehicle | 158 (10.1%) | 172 (13.4%) |
| 2 Vehicles | 473 (30.1%) | 440 (34.3%) |
| 3 Vehicles | 437 (27.8%) | 316 (24.6%) |
| 4 Vehicles | 345 (22.0%) | 250 (19.5%) |
| 5 or more Vehicles | 136 (8.7%) | 83 (6.5%) |
| Total | 1,571 (100.0%) | 1,283 (100.0%) |
Commute Time in Grant County
The most frequently occuring commute durations in Grant County are 30 to 34 minutes (390 commuters, 15.7%), 20 to 24 minutes (319 commuters, 12.9%), and 5 to 9 minutes (297 commuters, 12.0%).
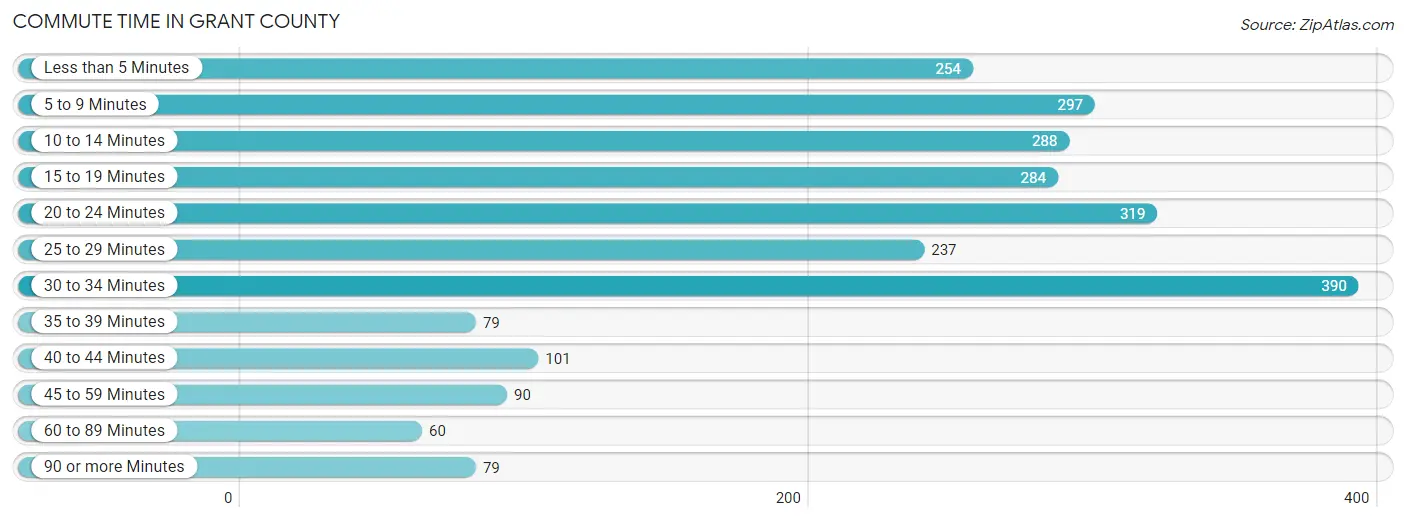
| Commute Time | # Commuters | % Commuters |
| Less than 5 Minutes | 254 | 10.2% |
| 5 to 9 Minutes | 297 | 12.0% |
| 10 to 14 Minutes | 288 | 11.6% |
| 15 to 19 Minutes | 284 | 11.5% |
| 20 to 24 Minutes | 319 | 12.9% |
| 25 to 29 Minutes | 237 | 9.6% |
| 30 to 34 Minutes | 390 | 15.7% |
| 35 to 39 Minutes | 79 | 3.2% |
| 40 to 44 Minutes | 101 | 4.1% |
| 45 to 59 Minutes | 90 | 3.6% |
| 60 to 89 Minutes | 60 | 2.4% |
| 90 or more Minutes | 79 | 3.2% |
Commute Time by Sex in Grant County
The most common commute times in Grant County are 30 to 34 minutes (194 commuters, 14.2%) for males and 30 to 34 minutes (196 commuters, 17.7%) for females.

| Commute Time | Male | Female |
| Less than 5 Minutes | 160 (11.7%) | 94 (8.5%) |
| 5 to 9 Minutes | 140 (10.2%) | 157 (14.1%) |
| 10 to 14 Minutes | 149 (10.9%) | 139 (12.5%) |
| 15 to 19 Minutes | 186 (13.6%) | 98 (8.8%) |
| 20 to 24 Minutes | 193 (14.1%) | 126 (11.4%) |
| 25 to 29 Minutes | 106 (7.7%) | 131 (11.8%) |
| 30 to 34 Minutes | 194 (14.2%) | 196 (17.7%) |
| 35 to 39 Minutes | 44 (3.2%) | 35 (3.2%) |
| 40 to 44 Minutes | 51 (3.7%) | 50 (4.5%) |
| 45 to 59 Minutes | 58 (4.2%) | 32 (2.9%) |
| 60 to 89 Minutes | 33 (2.4%) | 27 (2.4%) |
| 90 or more Minutes | 54 (4.0%) | 25 (2.2%) |
Time of Departure to Work by Sex in Grant County
The most frequent times of departure to work in Grant County are 7:30 AM to 7:59 AM (224, 16.4%) for males and 7:30 AM to 7:59 AM (272, 24.5%) for females.
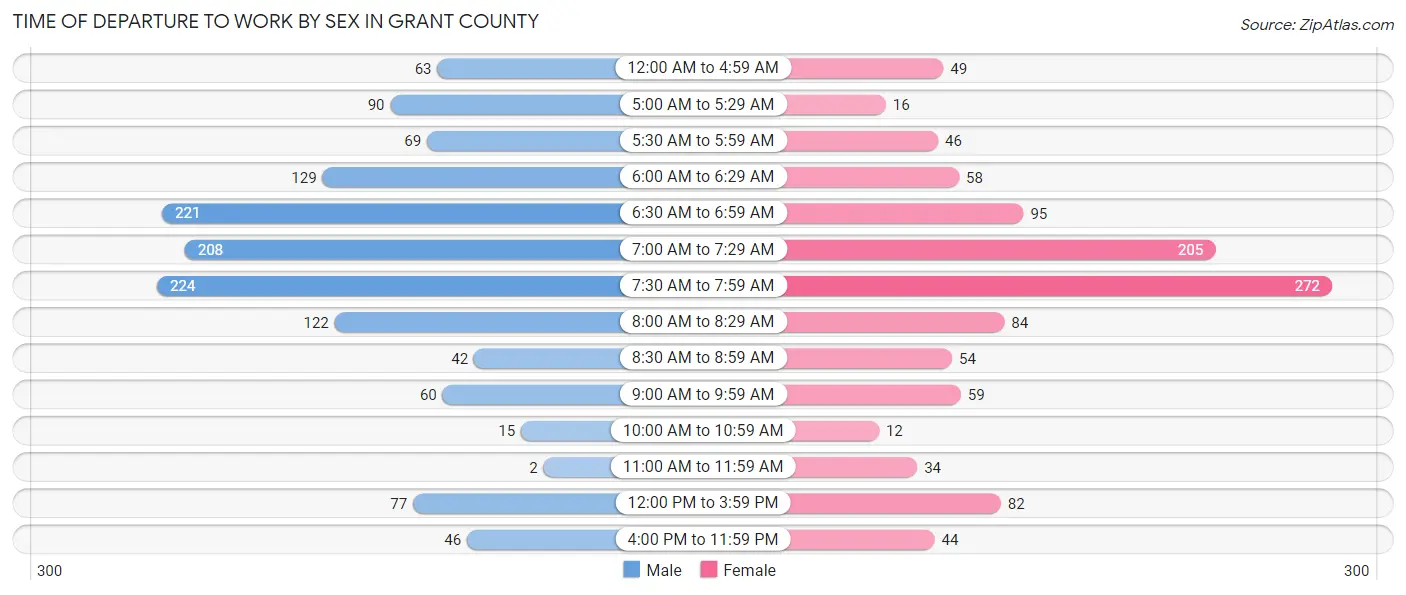
| Time of Departure | Male | Female |
| 12:00 AM to 4:59 AM | 63 (4.6%) | 49 (4.4%) |
| 5:00 AM to 5:29 AM | 90 (6.6%) | 16 (1.4%) |
| 5:30 AM to 5:59 AM | 69 (5.0%) | 46 (4.1%) |
| 6:00 AM to 6:29 AM | 129 (9.4%) | 58 (5.2%) |
| 6:30 AM to 6:59 AM | 221 (16.2%) | 95 (8.6%) |
| 7:00 AM to 7:29 AM | 208 (15.2%) | 205 (18.5%) |
| 7:30 AM to 7:59 AM | 224 (16.4%) | 272 (24.5%) |
| 8:00 AM to 8:29 AM | 122 (8.9%) | 84 (7.6%) |
| 8:30 AM to 8:59 AM | 42 (3.1%) | 54 (4.9%) |
| 9:00 AM to 9:59 AM | 60 (4.4%) | 59 (5.3%) |
| 10:00 AM to 10:59 AM | 15 (1.1%) | 12 (1.1%) |
| 11:00 AM to 11:59 AM | 2 (0.2%) | 34 (3.1%) |
| 12:00 PM to 3:59 PM | 77 (5.6%) | 82 (7.4%) |
| 4:00 PM to 11:59 PM | 46 (3.4%) | 44 (4.0%) |
| Total | 1,368 (100.0%) | 1,110 (100.0%) |
Housing Occupancy in Grant County
Occupancy by Ownership in Grant County
Of the total 2,540 dwellings in Grant County, owner-occupied units account for 2,030 (79.9%), while renter-occupied units make up 510 (20.1%).

| Occupancy | # Housing Units | % Housing Units |
| Owner Occupied Housing Units | 2,030 | 79.9% |
| Renter-Occupied Housing Units | 510 | 20.1% |
| Total Occupied Housing Units | 2,540 | 100.0% |
Occupancy by Household Size in Grant County
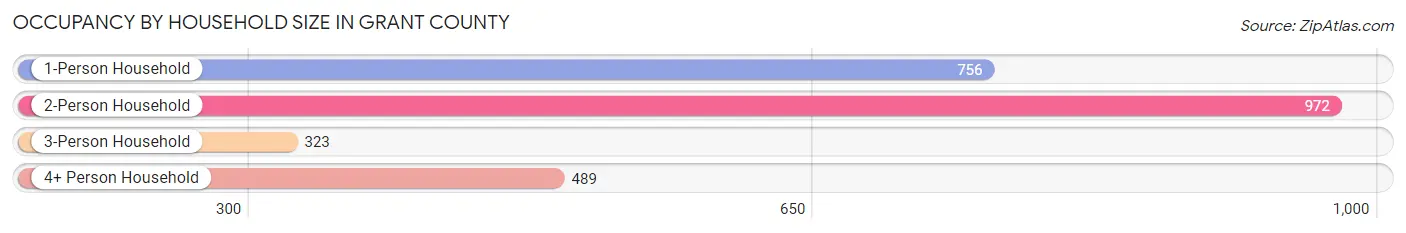
| Household Size | # Housing Units | % Housing Units |
| 1-Person Household | 756 | 29.8% |
| 2-Person Household | 972 | 38.3% |
| 3-Person Household | 323 | 12.7% |
| 4+ Person Household | 489 | 19.3% |
| Total Housing Units | 2,540 | 100.0% |
Occupancy by Ownership by Household Size in Grant County
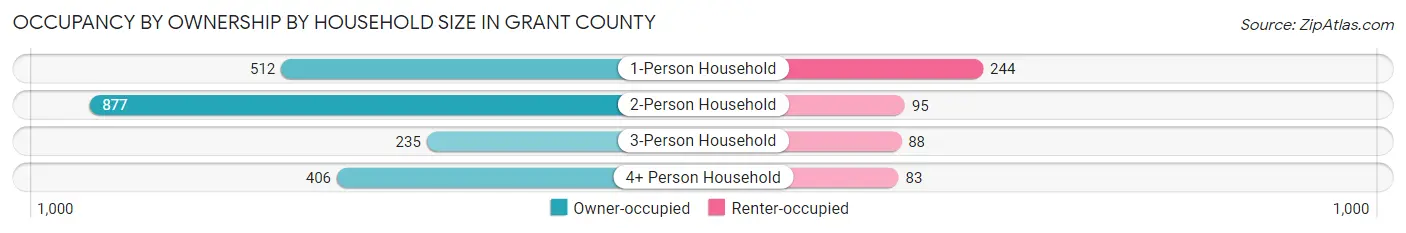
| Household Size | Owner-occupied | Renter-occupied |
| 1-Person Household | 512 (67.7%) | 244 (32.3%) |
| 2-Person Household | 877 (90.2%) | 95 (9.8%) |
| 3-Person Household | 235 (72.8%) | 88 (27.2%) |
| 4+ Person Household | 406 (83.0%) | 83 (17.0%) |
| Total Housing Units | 2,030 (79.9%) | 510 (20.1%) |
Occupancy by Educational Attainment in Grant County

| Household Size | Owner-occupied | Renter-occupied |
| Less than High School | 88 (74.0%) | 31 (26.1%) |
| High School Diploma | 544 (74.7%) | 184 (25.3%) |
| College/Associate Degree | 973 (82.6%) | 205 (17.4%) |
| Bachelor's Degree or higher | 425 (82.5%) | 90 (17.5%) |
Occupancy by Age of Householder in Grant County

| Age Bracket | # Households | % Households |
| Under 35 Years | 368 | 14.5% |
| 35 to 44 Years | 379 | 14.9% |
| 45 to 54 Years | 381 | 15.0% |
| 55 to 64 Years | 554 | 21.8% |
| 65 to 74 Years | 444 | 17.5% |
| 75 to 84 Years | 279 | 11.0% |
| 85 Years and Over | 135 | 5.3% |
| Total | 2,540 | 100.0% |
Housing Finances in Grant County
Median Income by Occupancy in Grant County
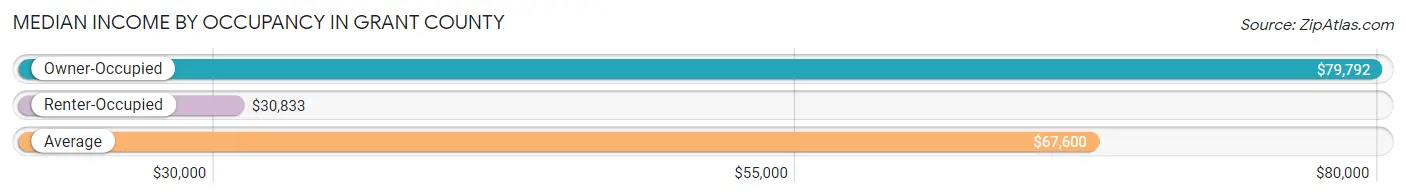
| Occupancy Type | # Households | Median Income |
| Owner-Occupied | 2,030 (79.9%) | $79,792 |
| Renter-Occupied | 510 (20.1%) | $30,833 |
| Average | 2,540 (100.0%) | $67,600 |
Occupancy by Householder Income Bracket in Grant County
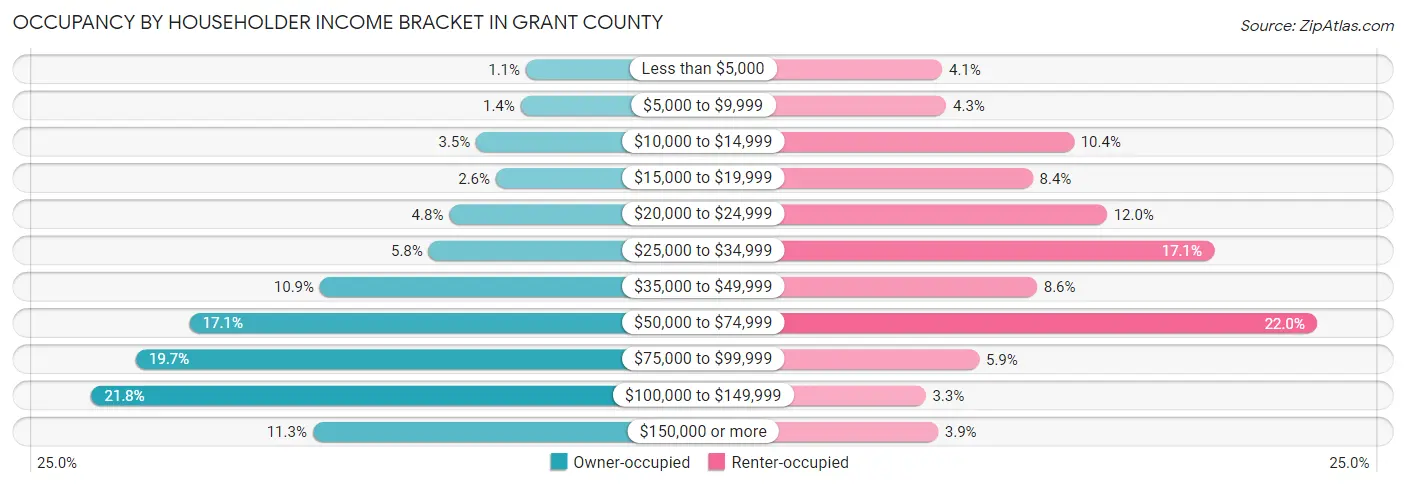
| Income Bracket | Owner-occupied | Renter-occupied |
| Less than $5,000 | 23 (1.1%) | 21 (4.1%) |
| $5,000 to $9,999 | 28 (1.4%) | 22 (4.3%) |
| $10,000 to $14,999 | 71 (3.5%) | 53 (10.4%) |
| $15,000 to $19,999 | 52 (2.6%) | 43 (8.4%) |
| $20,000 to $24,999 | 97 (4.8%) | 61 (12.0%) |
| $25,000 to $34,999 | 117 (5.8%) | 87 (17.1%) |
| $35,000 to $49,999 | 222 (10.9%) | 44 (8.6%) |
| $50,000 to $74,999 | 348 (17.1%) | 112 (22.0%) |
| $75,000 to $99,999 | 400 (19.7%) | 30 (5.9%) |
| $100,000 to $149,999 | 443 (21.8%) | 17 (3.3%) |
| $150,000 or more | 229 (11.3%) | 20 (3.9%) |
| Total | 2,030 (100.0%) | 510 (100.0%) |
Monthly Housing Cost Tiers in Grant County
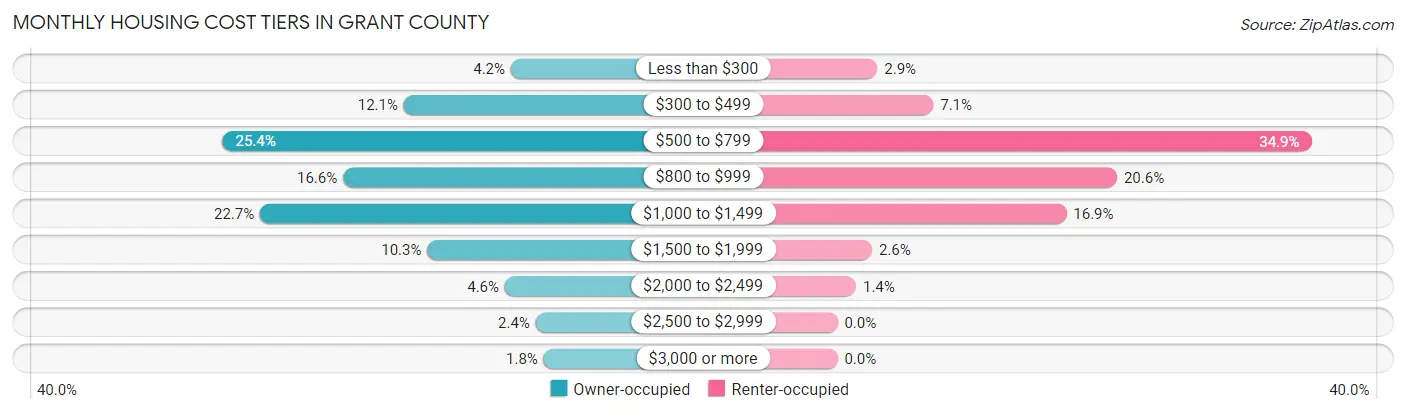
| Monthly Cost | Owner-occupied | Renter-occupied |
| Less than $300 | 85 (4.2%) | 15 (2.9%) |
| $300 to $499 | 245 (12.1%) | 36 (7.1%) |
| $500 to $799 | 516 (25.4%) | 178 (34.9%) |
| $800 to $999 | 336 (16.6%) | 105 (20.6%) |
| $1,000 to $1,499 | 460 (22.7%) | 86 (16.9%) |
| $1,500 to $1,999 | 210 (10.3%) | 13 (2.5%) |
| $2,000 to $2,499 | 94 (4.6%) | 7 (1.4%) |
| $2,500 to $2,999 | 48 (2.4%) | 0 (0.0%) |
| $3,000 or more | 36 (1.8%) | 0 (0.0%) |
| Total | 2,030 (100.0%) | 510 (100.0%) |
Physical Housing Characteristics in Grant County
Housing Structures in Grant County
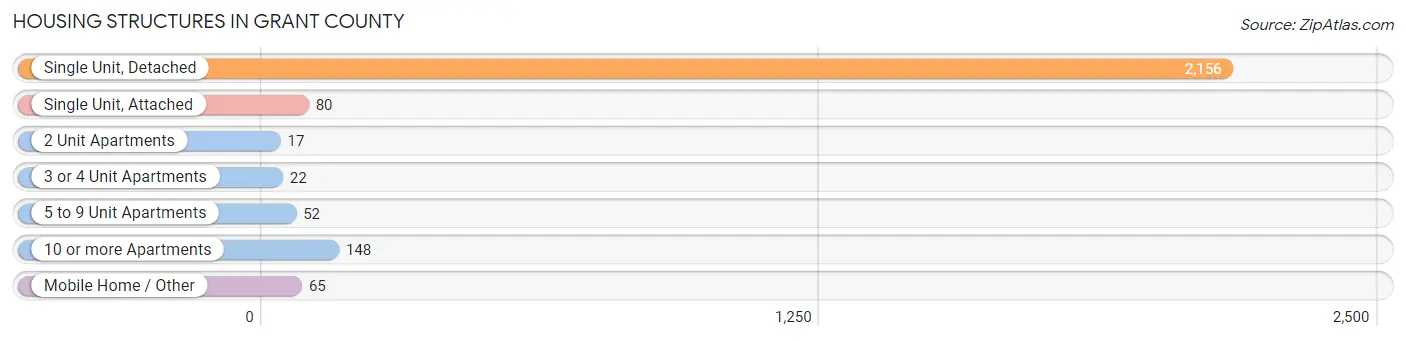
| Structure Type | # Housing Units | % Housing Units |
| Single Unit, Detached | 2,156 | 84.9% |
| Single Unit, Attached | 80 | 3.2% |
| 2 Unit Apartments | 17 | 0.7% |
| 3 or 4 Unit Apartments | 22 | 0.9% |
| 5 to 9 Unit Apartments | 52 | 2.1% |
| 10 or more Apartments | 148 | 5.8% |
| Mobile Home / Other | 65 | 2.6% |
| Total | 2,540 | 100.0% |
Housing Structures by Occupancy in Grant County
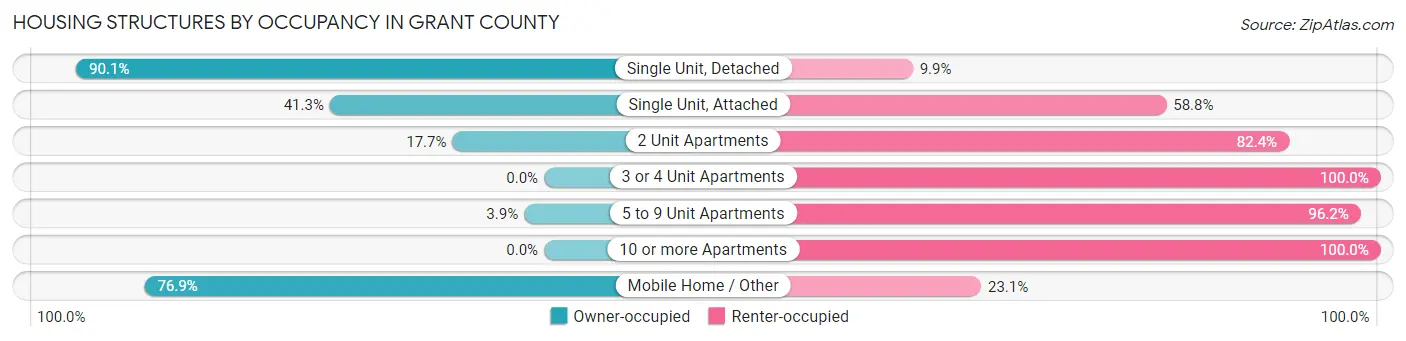
| Structure Type | Owner-occupied | Renter-occupied |
| Single Unit, Detached | 1,942 (90.1%) | 214 (9.9%) |
| Single Unit, Attached | 33 (41.2%) | 47 (58.8%) |
| 2 Unit Apartments | 3 (17.6%) | 14 (82.4%) |
| 3 or 4 Unit Apartments | 0 (0.0%) | 22 (100.0%) |
| 5 to 9 Unit Apartments | 2 (3.8%) | 50 (96.2%) |
| 10 or more Apartments | 0 (0.0%) | 148 (100.0%) |
| Mobile Home / Other | 50 (76.9%) | 15 (23.1%) |
| Total | 2,030 (79.9%) | 510 (20.1%) |
Housing Structures by Number of Rooms in Grant County
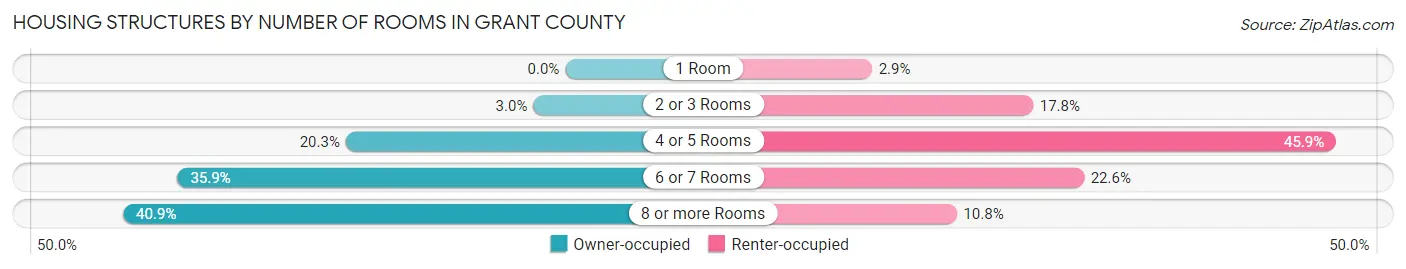
| Number of Rooms | Owner-occupied | Renter-occupied |
| 1 Room | 0 (0.0%) | 15 (2.9%) |
| 2 or 3 Rooms | 60 (3.0%) | 91 (17.8%) |
| 4 or 5 Rooms | 412 (20.3%) | 234 (45.9%) |
| 6 or 7 Rooms | 728 (35.9%) | 115 (22.6%) |
| 8 or more Rooms | 830 (40.9%) | 55 (10.8%) |
| Total | 2,030 (100.0%) | 510 (100.0%) |
Housing Structure by Heating Type in Grant County
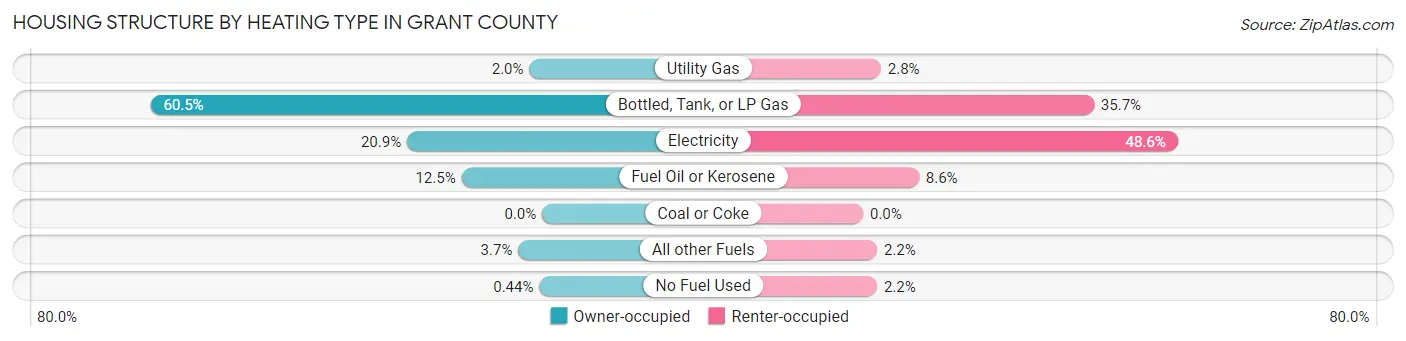
| Heating Type | Owner-occupied | Renter-occupied |
| Utility Gas | 40 (2.0%) | 14 (2.8%) |
| Bottled, Tank, or LP Gas | 1,229 (60.5%) | 182 (35.7%) |
| Electricity | 424 (20.9%) | 248 (48.6%) |
| Fuel Oil or Kerosene | 253 (12.5%) | 44 (8.6%) |
| Coal or Coke | 0 (0.0%) | 0 (0.0%) |
| All other Fuels | 75 (3.7%) | 11 (2.2%) |
| No Fuel Used | 9 (0.4%) | 11 (2.2%) |
| Total | 2,030 (100.0%) | 510 (100.0%) |
Household Vehicle Usage in Grant County
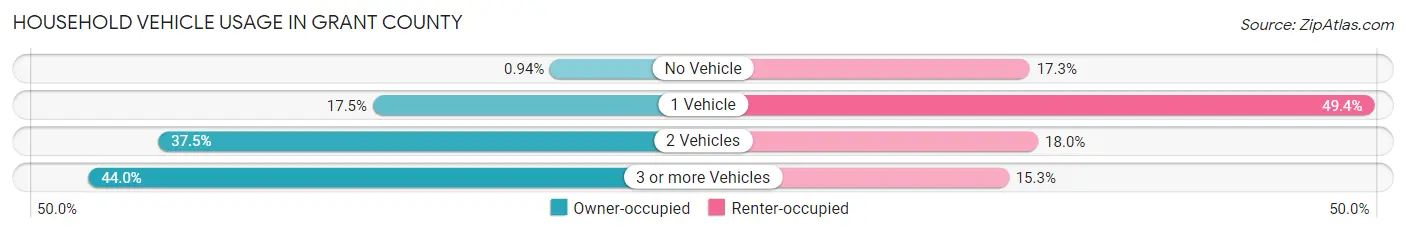
| Vehicles per Household | Owner-occupied | Renter-occupied |
| No Vehicle | 19 (0.9%) | 88 (17.2%) |
| 1 Vehicle | 355 (17.5%) | 252 (49.4%) |
| 2 Vehicles | 762 (37.5%) | 92 (18.0%) |
| 3 or more Vehicles | 894 (44.0%) | 78 (15.3%) |
| Total | 2,030 (100.0%) | 510 (100.0%) |
Real Estate & Mortgages in Grant County
Real Estate and Mortgage Overview in Grant County
| Characteristic | Without Mortgage | With Mortgage |
| Housing Units | 955 | 1,075 |
| Median Property Value | $171,700 | $154,100 |
| Median Household Income | $67,656 | $121 |
| Monthly Housing Costs | $625 | $34 |
| Real Estate Taxes | $1,778 | $10 |
Property Value by Mortgage Status in Grant County

| Property Value | Without Mortgage | With Mortgage |
| Less than $50,000 | 111 (11.6%) | 78 (7.3%) |
| $50,000 to $99,999 | 160 (16.8%) | 247 (23.0%) |
| $100,000 to $299,999 | 461 (48.3%) | 527 (49.0%) |
| $300,000 to $499,999 | 119 (12.5%) | 159 (14.8%) |
| $500,000 to $749,999 | 56 (5.9%) | 41 (3.8%) |
| $750,000 to $999,999 | 25 (2.6%) | 12 (1.1%) |
| $1,000,000 or more | 23 (2.4%) | 11 (1.0%) |
| Total | 955 (100.0%) | 1,075 (100.0%) |
Household Income by Mortgage Status in Grant County
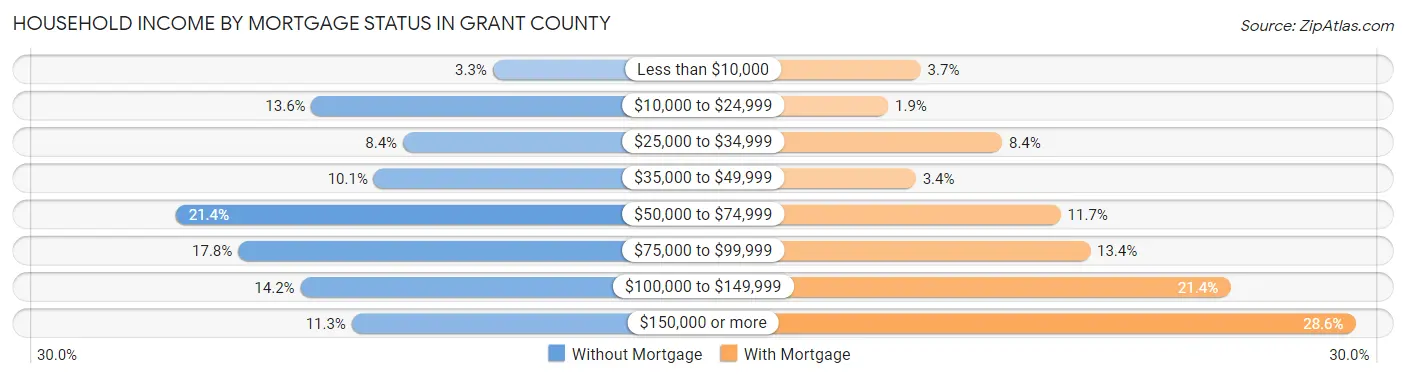
| Household Income | Without Mortgage | With Mortgage |
| Less than $10,000 | 31 (3.3%) | 40 (3.7%) |
| $10,000 to $24,999 | 130 (13.6%) | 20 (1.9%) |
| $25,000 to $34,999 | 80 (8.4%) | 90 (8.4%) |
| $35,000 to $49,999 | 96 (10.1%) | 37 (3.4%) |
| $50,000 to $74,999 | 204 (21.4%) | 126 (11.7%) |
| $75,000 to $99,999 | 170 (17.8%) | 144 (13.4%) |
| $100,000 to $149,999 | 136 (14.2%) | 230 (21.4%) |
| $150,000 or more | 108 (11.3%) | 307 (28.6%) |
| Total | 955 (100.0%) | 1,075 (100.0%) |
Property Value to Household Income Ratio in Grant County
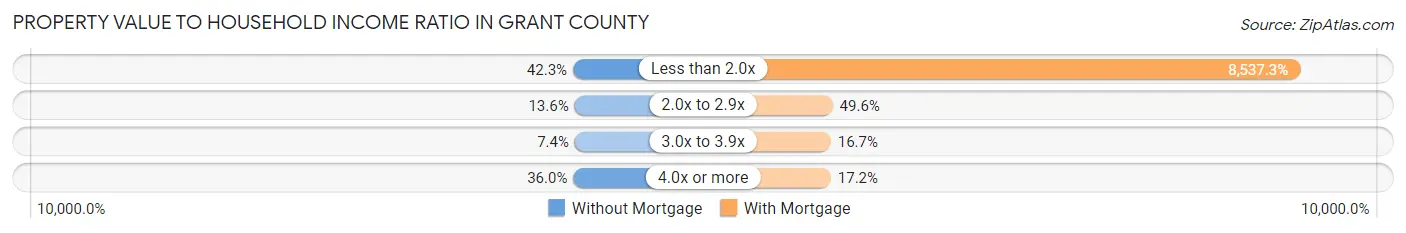
| Value-to-Income Ratio | Without Mortgage | With Mortgage |
| Less than 2.0x | 404 (42.3%) | 91,776 (8,537.3%) |
| 2.0x to 2.9x | 130 (13.6%) | 533 (49.6%) |
| 3.0x to 3.9x | 71 (7.4%) | 179 (16.7%) |
| 4.0x or more | 344 (36.0%) | 185 (17.2%) |
| Total | 955 (100.0%) | 1,075 (100.0%) |
Real Estate Taxes by Mortgage Status in Grant County

| Property Taxes | Without Mortgage | With Mortgage |
| Less than $800 | 166 (17.4%) | 2 (0.2%) |
| $800 to $1,499 | 235 (24.6%) | 169 (15.7%) |
| $800 to $1,499 | 540 (56.5%) | 391 (36.4%) |
| Total | 955 (100.0%) | 1,075 (100.0%) |
Health & Disability in Grant County
Health Insurance Coverage by Age in Grant County

| Age Bracket | With Coverage | Without Coverage |
| Under 6 Years | 430 (99.3%) | 3 (0.7%) |
| 6 to 18 Years | 964 (95.3%) | 48 (4.7%) |
| 19 to 25 Years | 286 (83.6%) | 56 (16.4%) |
| 26 to 34 Years | 544 (90.2%) | 59 (9.8%) |
| 35 to 44 Years | 657 (93.3%) | 47 (6.7%) |
| 45 to 54 Years | 616 (93.2%) | 45 (6.8%) |
| 55 to 64 Years | 857 (94.5%) | 50 (5.5%) |
| 65 to 74 Years | 758 (100.0%) | 0 (0.0%) |
| 75 Years and older | 626 (100.0%) | 0 (0.0%) |
| Total | 5,738 (94.9%) | 308 (5.1%) |
Health Insurance Coverage by Citizenship Status in Grant County
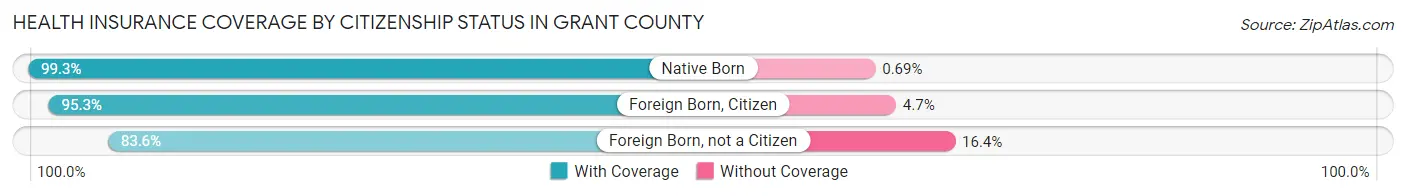
| Citizenship Status | With Coverage | Without Coverage |
| Native Born | 430 (99.3%) | 3 (0.7%) |
| Foreign Born, Citizen | 964 (95.3%) | 48 (4.7%) |
| Foreign Born, not a Citizen | 286 (83.6%) | 56 (16.4%) |
Health Insurance Coverage by Household Income in Grant County

| Household Income | With Coverage | Without Coverage |
| Under $25,000 | 717 (95.9%) | 31 (4.1%) |
| $25,000 to $49,999 | 869 (94.4%) | 52 (5.7%) |
| $50,000 to $74,999 | 1,028 (93.8%) | 68 (6.2%) |
| $75,000 to $99,999 | 999 (93.3%) | 72 (6.7%) |
| $100,000 and over | 2,070 (96.1%) | 85 (3.9%) |
Public vs Private Health Insurance Coverage by Age in Grant County

| Age Bracket | Public Insurance | Private Insurance |
| Under 6 | 227 (52.4%) | 233 (53.8%) |
| 6 to 18 Years | 508 (50.2%) | 523 (51.7%) |
| 19 to 25 Years | 84 (24.6%) | 214 (62.6%) |
| 25 to 34 Years | 223 (37.0%) | 382 (63.3%) |
| 35 to 44 Years | 229 (32.5%) | 455 (64.6%) |
| 45 to 54 Years | 182 (27.5%) | 451 (68.2%) |
| 55 to 64 Years | 228 (25.1%) | 712 (78.5%) |
| 65 to 74 Years | 727 (95.9%) | 543 (71.6%) |
| 75 Years and over | 612 (97.8%) | 460 (73.5%) |
| Total | 3,020 (49.9%) | 3,973 (65.7%) |
Disability Status by Sex by Age in Grant County
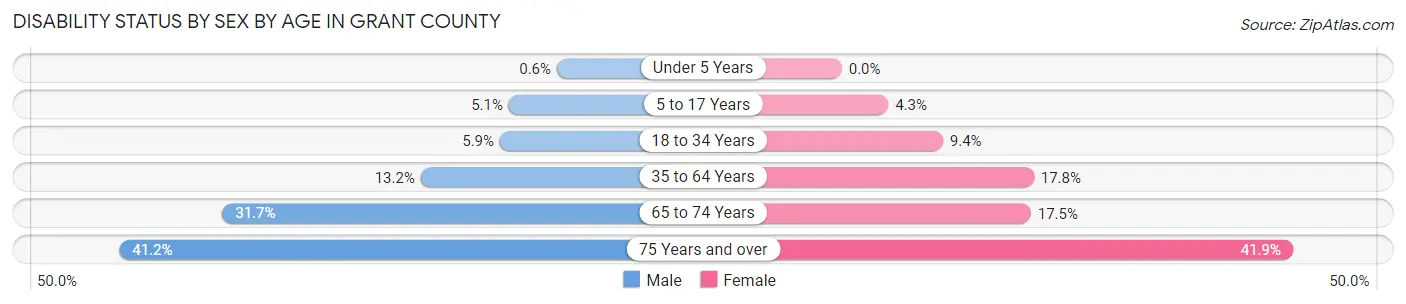
| Age Bracket | Male | Female |
| Under 5 Years | 1 (0.6%) | 0 (0.0%) |
| 5 to 17 Years | 28 (5.1%) | 22 (4.3%) |
| 18 to 34 Years | 31 (5.9%) | 44 (9.4%) |
| 35 to 64 Years | 156 (13.2%) | 195 (17.8%) |
| 65 to 74 Years | 119 (31.7%) | 67 (17.5%) |
| 75 Years and over | 129 (41.2%) | 131 (41.8%) |
Disability Class by Sex by Age in Grant County
Disability Class: Hearing Difficulty

| Age Bracket | Male | Female |
| Under 5 Years | 1 (0.6%) | 0 (0.0%) |
| 5 to 17 Years | 2 (0.4%) | 4 (0.8%) |
| 18 to 34 Years | 11 (2.1%) | 13 (2.8%) |
| 35 to 64 Years | 72 (6.1%) | 24 (2.2%) |
| 65 to 74 Years | 77 (20.5%) | 18 (4.7%) |
| 75 Years and over | 88 (28.1%) | 48 (15.3%) |
Disability Class: Vision Difficulty
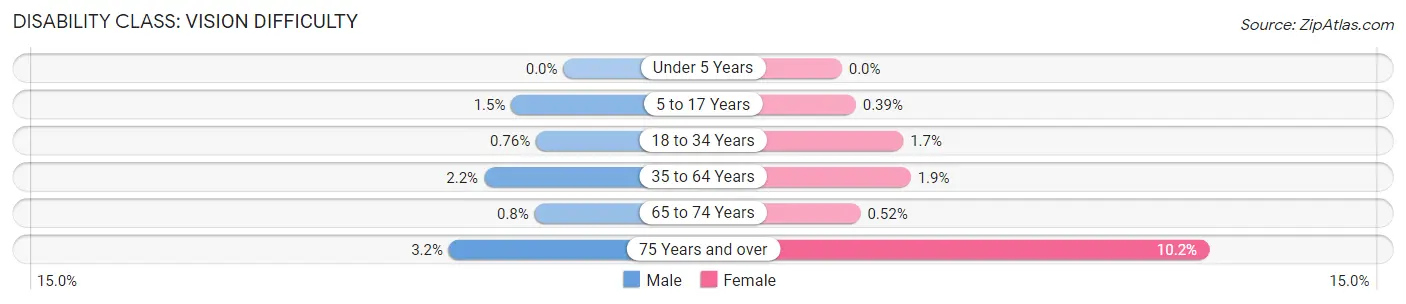
| Age Bracket | Male | Female |
| Under 5 Years | 0 (0.0%) | 0 (0.0%) |
| 5 to 17 Years | 8 (1.5%) | 2 (0.4%) |
| 18 to 34 Years | 4 (0.8%) | 8 (1.7%) |
| 35 to 64 Years | 26 (2.2%) | 21 (1.9%) |
| 65 to 74 Years | 3 (0.8%) | 2 (0.5%) |
| 75 Years and over | 10 (3.2%) | 32 (10.2%) |
Disability Class: Cognitive Difficulty
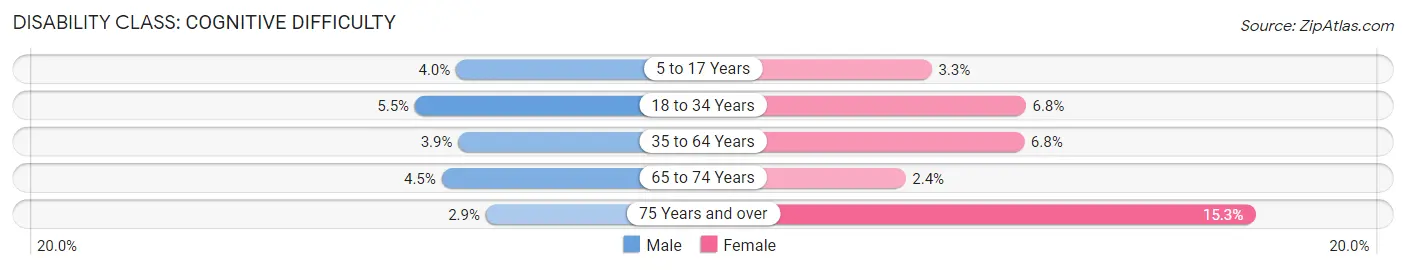
| Age Bracket | Male | Female |
| 5 to 17 Years | 22 (4.0%) | 17 (3.3%) |
| 18 to 34 Years | 29 (5.5%) | 32 (6.8%) |
| 35 to 64 Years | 46 (3.9%) | 74 (6.8%) |
| 65 to 74 Years | 17 (4.5%) | 9 (2.4%) |
| 75 Years and over | 9 (2.9%) | 48 (15.3%) |
Disability Class: Ambulatory Difficulty
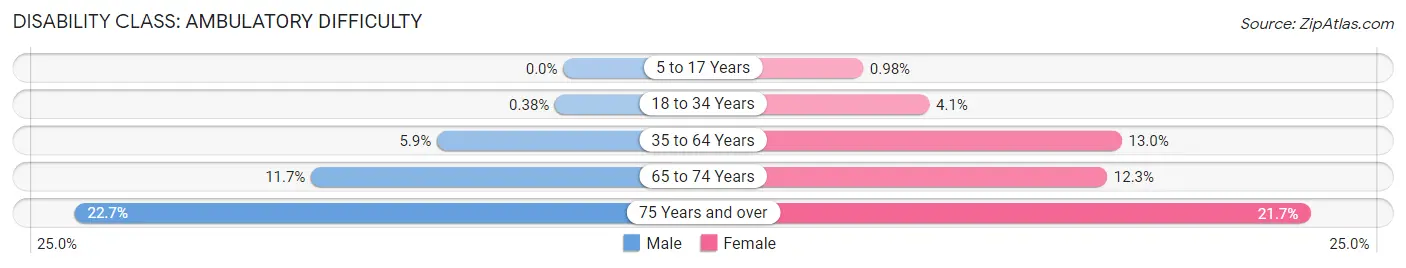
| Age Bracket | Male | Female |
| 5 to 17 Years | 0 (0.0%) | 5 (1.0%) |
| 18 to 34 Years | 2 (0.4%) | 19 (4.1%) |
| 35 to 64 Years | 69 (5.9%) | 142 (13.0%) |
| 65 to 74 Years | 44 (11.7%) | 47 (12.3%) |
| 75 Years and over | 71 (22.7%) | 68 (21.7%) |
Disability Class: Self-Care Difficulty

| Age Bracket | Male | Female |
| 5 to 17 Years | 9 (1.6%) | 0 (0.0%) |
| 18 to 34 Years | 2 (0.4%) | 11 (2.4%) |
| 35 to 64 Years | 14 (1.2%) | 50 (4.6%) |
| 65 to 74 Years | 18 (4.8%) | 14 (3.7%) |
| 75 Years and over | 13 (4.2%) | 39 (12.5%) |
Technology Access in Grant County
Computing Device Access in Grant County

| Device Type | # Households | % Households |
| Desktop or Laptop | 1,981 | 78.0% |
| Smartphone | 2,200 | 86.6% |
| Tablet | 1,430 | 56.3% |
| No Computing Device | 183 | 7.2% |
| Total | 2,540 | 100.0% |
Internet Access in Grant County

| Internet Type | # Households | % Households |
| Dial-Up Internet | 21 | 0.8% |
| Broadband Home | 1,859 | 73.2% |
| Cellular Data Only | 215 | 8.5% |
| Satellite Internet | 122 | 4.8% |
| No Internet | 363 | 14.3% |
| Total | 2,540 | 100.0% |
Grant County Summary
County History
Grant County is located in the southwestern corner of Minnesota, and is bordered by South Dakota to the west and Iowa to the south. The county was established in 1857 and was named after Ulysses S. Grant, the 18th President of the United States. The county was originally part of the Dakota Territory, and was later annexed to Minnesota in 1858.
The first settlers in the area were mostly of German and Scandinavian descent, and they were attracted to the area by the fertile soil and abundant wildlife. The first permanent settlement in the county was established in 1868, and the county seat was established in Elbow Lake in 1872.
The county experienced rapid growth in the late 19th and early 20th centuries, as the population increased from just over 1,000 in 1880 to over 10,000 by 1910. This growth was largely due to the development of the railroad, which allowed for the transportation of goods and people to and from the county.
The county also experienced a period of economic growth during this time, as the agricultural industry flourished and the lumber industry began to take off. The county also saw the development of several small towns, such as Herman, Donnelly, and Elbow Lake.
Geography
Grant County is located in the southwestern corner of Minnesota, and is bordered by South Dakota to the west and Iowa to the south. The county covers an area of 845 square miles, and is home to a variety of landscapes, including rolling hills, prairies, and wetlands.
The county is home to several rivers and streams, including the Redwood River, the Pomme de Terre River, and the Otter Tail River. The county is also home to several lakes, including Big Stone Lake, Lake Traverse, and Lake Elbow.
The county is located in the Central Plains region of Minnesota, and is part of the Red River Valley. The county is located in the Central Time Zone, and the county seat is Elbow Lake.
Economy
The economy of Grant County is largely based on agriculture, with the county being home to a variety of crops, including corn, soybeans, wheat, and hay. The county is also home to several livestock operations, including beef and dairy cattle, hogs, and sheep.
The county is also home to several manufacturing and processing plants, including a canning plant, a cheese plant, and a meat processing plant. The county is also home to several retail stores, restaurants, and other businesses.
Demographics
As of the 2010 census, the population of Grant County was 6,018. The population is largely of German and Scandinavian descent, with the largest ancestry groups being German (44.3%), Norwegian (20.2%), and Swedish (14.2%).
The median household income in the county is $45,845, and the median home value is $117,400. The unemployment rate in the county is 4.2%, and the poverty rate is 11.2%.
Conclusion
Grant County is a rural county located in the southwestern corner of Minnesota. The county was established in 1857 and was named after Ulysses S. Grant, the 18th President of the United States. The county is largely agricultural, with the economy being based on crops, livestock, and manufacturing. The population of the county is largely of German and Scandinavian descent, and the median household income is $45,845.
Common Questions
What is Per Capita Income in Grant County?
Per Capita income in Grant County is $36,750.
What is the Median Family Income in Grant County?
Median Family Income in Grant County is $82,007.
What is the Median Household income in Grant County?
Median Household Income in Grant County is $67,600.
What is Income or Wage Gap in Grant County?
Income or Wage Gap in Grant County is 35.1%.
Women in Grant County earn 64.9 cents for every dollar earned by a man.
What is Family Income Deficit in Grant County?
Family Income Deficit in Grant County is $11,293.
Families that are below poverty line in Grant County earn $11,293 less on average than the poverty threshold level.
What is Inequality or Gini Index in Grant County?
Inequality or Gini Index in Grant County is 0.45.
What is the Total Population of Grant County?
Total Population of Grant County is 6,091.
What is the Total Male Population of Grant County?
Total Male Population of Grant County is 3,133.
What is the Total Female Population of Grant County?
Total Female Population of Grant County is 2,958.
What is the Ratio of Males per 100 Females in Grant County?
There are 105.92 Males per 100 Females in Grant County.
What is the Ratio of Females per 100 Males in Grant County?
There are 94.41 Females per 100 Males in Grant County.
What is the Median Population Age in Grant County?
Median Population Age in Grant County is 44.3 Years.
What is the Average Family Size in Grant County
Average Family Size in Grant County is 2.9 People.
What is the Average Household Size in Grant County
Average Household Size in Grant County is 2.4 People.
How Large is the Labor Force in Grant County?
There are 3,022 People in the Labor Forcein in Grant County.
What is the Percentage of People in the Labor Force in Grant County?
62.2% of People are in the Labor Force in Grant County.
What is the Unemployment Rate in Grant County?
Unemployment Rate in Grant County is 3.7%.