Carlton County, MN Map & Demographics
Carlton County Map
Carlton County Overview
$35,642
PER CAPITA INCOME
$90,974
AVG FAMILY INCOME
$74,660
AVG HOUSEHOLD INCOME
29.4%
WAGE / INCOME GAP [ % ]
70.6¢/ $1
WAGE / INCOME GAP [ $ ]
$9,163
FAMILY INCOME DEFICIT
0.41
INEQUALITY / GINI INDEX
36,362
TOTAL POPULATION
19,212
MALE POPULATION
17,150
FEMALE POPULATION
112.02
MALES / 100 FEMALES
89.27
FEMALES / 100 MALES
41.6
MEDIAN AGE
3.0
AVG FAMILY SIZE
2.4
AVG HOUSEHOLD SIZE
17,593
LABOR FORCE [ PEOPLE ]
60.0%
PERCENT IN LABOR FORCE
4.7%
UNEMPLOYMENT RATE
Carlton County Area Codes
Income in Carlton County
Income Overview in Carlton County
Per Capita Income in Carlton County is $35,642, while median incomes of families and households are $90,974 and $74,660 respectively.
| Characteristic | Number | Measure |
| Per Capita Income | 36,362 | $35,642 |
| Median Family Income | 9,158 | $90,974 |
| Mean Family Income | 9,158 | $106,439 |
| Median Household Income | 13,795 | $74,660 |
| Mean Household Income | 13,795 | $91,973 |
| Income Deficit | 9,158 | $9,163 |
| Wage / Income Gap (%) | 36,362 | 29.38% |
| Wage / Income Gap ($) | 36,362 | 70.62¢ per $1 |
| Gini / Inequality Index | 36,362 | 0.41 |
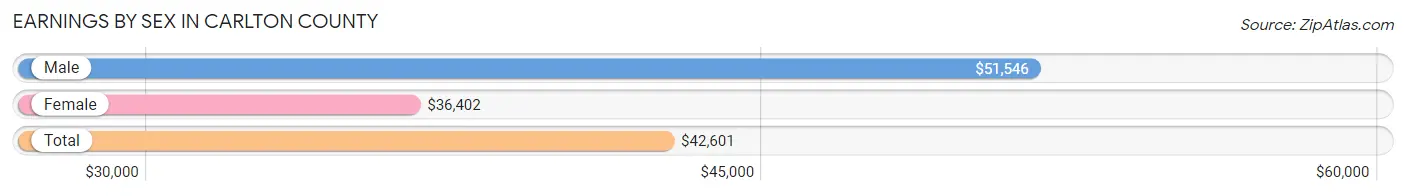
Earnings by Sex in Carlton County
Average Earnings in Carlton County are $42,601, $51,546 for men and $36,402 for women, a difference of 29.4%.
| Sex | Number | Average Earnings |
| Male | 10,035 (53.1%) | $51,546 |
| Female | 8,853 (46.9%) | $36,402 |
| Total | 18,888 (100.0%) | $42,601 |
Earnings by Sex by Income Bracket in Carlton County
The most common earnings brackets in Carlton County are $75,000 to $99,999 for men (1,675 | 16.7%) and $75,000 to $99,999 for women (737 | 8.3%).
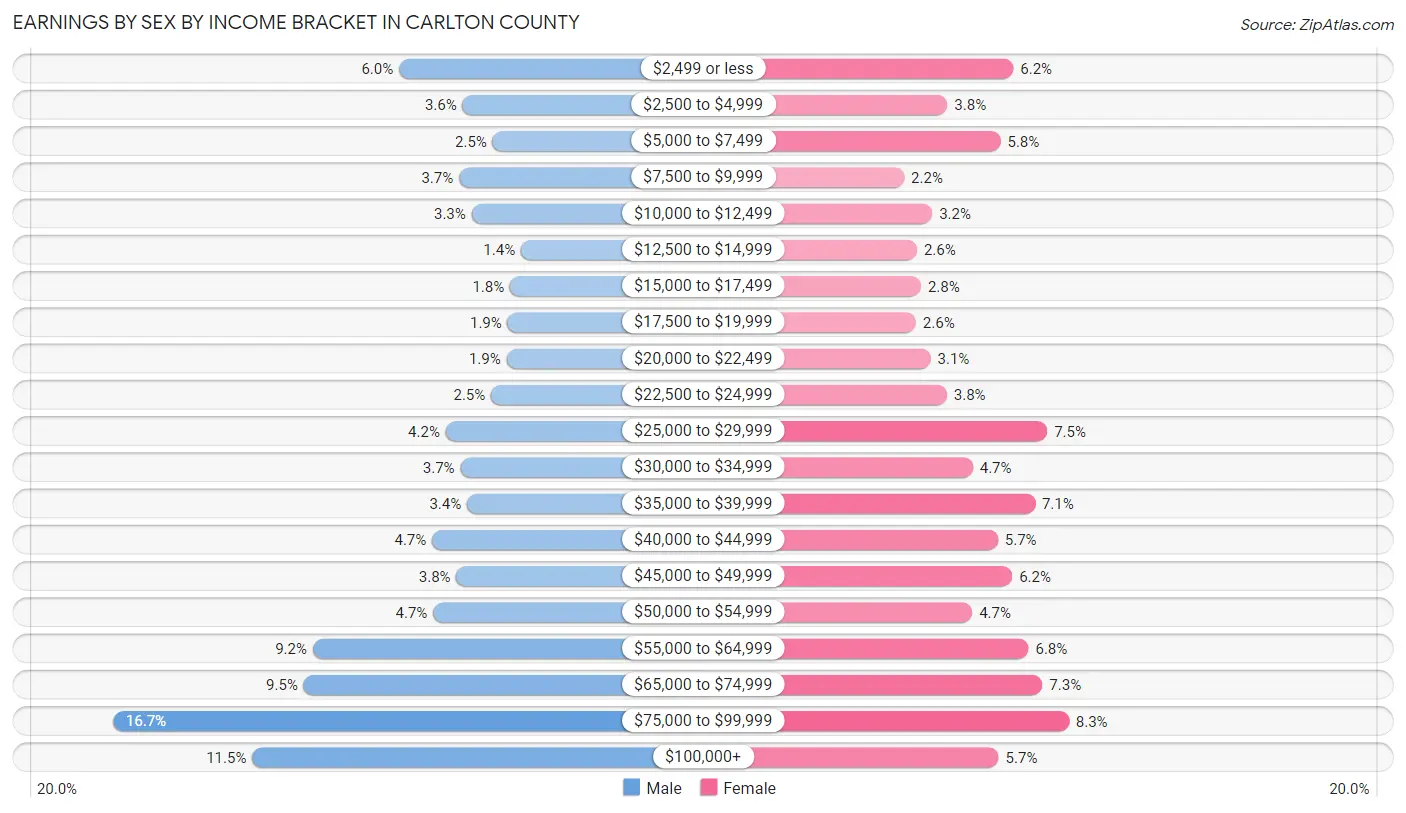
| Income | Male | Female |
| $2,499 or less | 599 (6.0%) | 552 (6.2%) |
| $2,500 to $4,999 | 360 (3.6%) | 334 (3.8%) |
| $5,000 to $7,499 | 247 (2.5%) | 510 (5.8%) |
| $7,500 to $9,999 | 373 (3.7%) | 190 (2.1%) |
| $10,000 to $12,499 | 326 (3.3%) | 283 (3.2%) |
| $12,500 to $14,999 | 140 (1.4%) | 233 (2.6%) |
| $15,000 to $17,499 | 182 (1.8%) | 246 (2.8%) |
| $17,500 to $19,999 | 191 (1.9%) | 229 (2.6%) |
| $20,000 to $22,499 | 195 (1.9%) | 278 (3.1%) |
| $22,500 to $24,999 | 253 (2.5%) | 332 (3.7%) |
| $25,000 to $29,999 | 423 (4.2%) | 665 (7.5%) |
| $30,000 to $34,999 | 368 (3.7%) | 418 (4.7%) |
| $35,000 to $39,999 | 343 (3.4%) | 624 (7.0%) |
| $40,000 to $44,999 | 475 (4.7%) | 501 (5.7%) |
| $45,000 to $49,999 | 383 (3.8%) | 549 (6.2%) |
| $50,000 to $54,999 | 471 (4.7%) | 416 (4.7%) |
| $55,000 to $64,999 | 923 (9.2%) | 603 (6.8%) |
| $65,000 to $74,999 | 957 (9.5%) | 649 (7.3%) |
| $75,000 to $99,999 | 1,675 (16.7%) | 737 (8.3%) |
| $100,000+ | 1,151 (11.5%) | 504 (5.7%) |
| Total | 10,035 (100.0%) | 8,853 (100.0%) |
Earnings by Sex by Educational Attainment in Carlton County
Average earnings in Carlton County are $58,194 for men and $40,972 for women, a difference of 29.6%. Men with an educational attainment of graduate degree enjoy the highest average annual earnings of $78,884, while those with less than high school education earn the least with $26,694. Women with an educational attainment of graduate degree earn the most with the average annual earnings of $74,388, while those with less than high school education have the smallest earnings of $19,886.
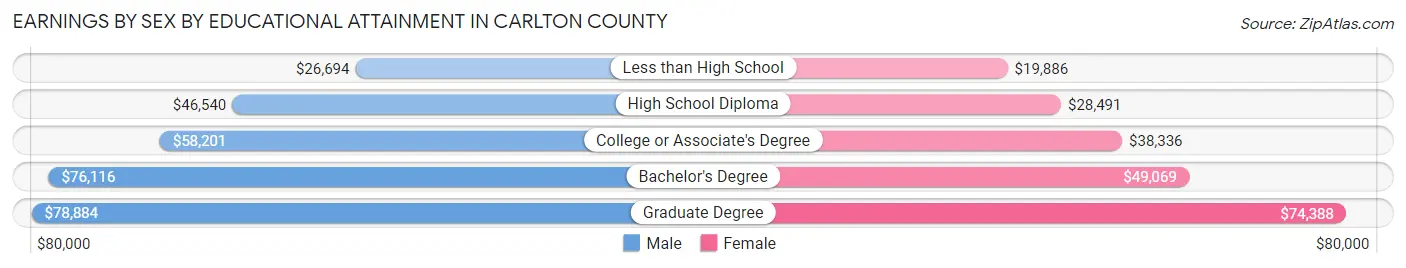
| Educational Attainment | Male Income | Female Income |
| Less than High School | $26,694 | $19,886 |
| High School Diploma | $46,540 | $28,491 |
| College or Associate's Degree | $58,201 | $38,336 |
| Bachelor's Degree | $76,116 | $49,069 |
| Graduate Degree | $78,884 | $74,388 |
| Total | $58,194 | $40,972 |
Family Income in Carlton County
Family Income Brackets in Carlton County
According to the Carlton County family income data, there are 2,344 families falling into the $100,000 to $149,999 income range, which is the most common income bracket and makes up 25.6% of all families. Conversely, the less than $10,000 income bracket is the least frequent group with only 174 families (1.9%) belonging to this category.
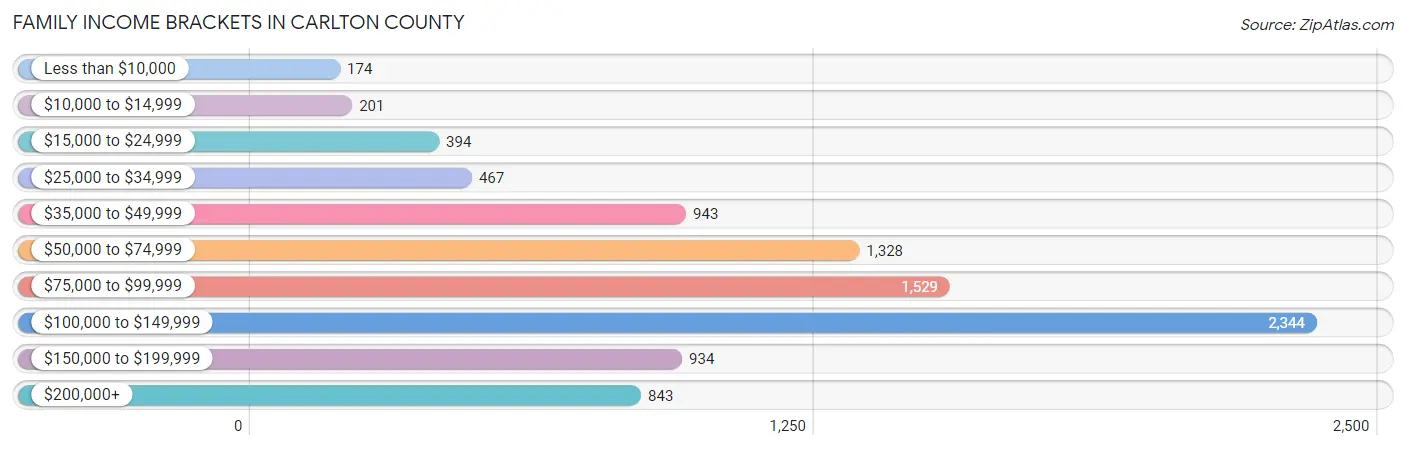
| Income Bracket | # Families | % Families |
| Less than $10,000 | 174 | 1.9% |
| $10,000 to $14,999 | 201 | 2.2% |
| $15,000 to $24,999 | 394 | 4.3% |
| $25,000 to $34,999 | 467 | 5.1% |
| $35,000 to $49,999 | 943 | 10.3% |
| $50,000 to $74,999 | 1,328 | 14.5% |
| $75,000 to $99,999 | 1,529 | 16.7% |
| $100,000 to $149,999 | 2,344 | 25.6% |
| $150,000 to $199,999 | 934 | 10.2% |
| $200,000+ | 843 | 9.2% |
Family Income by Famaliy Size in Carlton County
7+ person families (89 | 1.0%) account for the highest median family income in Carlton County with $131,875 per family, while 2-person families (4,299 | 46.9%) have the highest median income of $37,990 per family member.
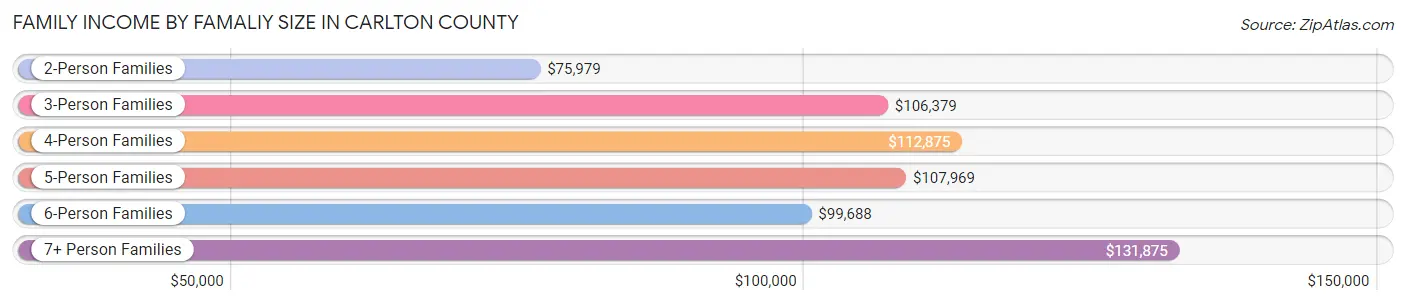
| Income Bracket | # Families | Median Income |
| 2-Person Families | 4,299 (46.9%) | $75,979 |
| 3-Person Families | 2,242 (24.5%) | $106,379 |
| 4-Person Families | 1,747 (19.1%) | $112,875 |
| 5-Person Families | 626 (6.8%) | $107,969 |
| 6-Person Families | 155 (1.7%) | $99,688 |
| 7+ Person Families | 89 (1.0%) | $131,875 |
| Total | 9,158 (100.0%) | $90,974 |
Family Income by Number of Earners in Carlton County
The median family income in Carlton County is $90,974, with families comprising 3+ earners (1,116) having the highest median family income of $132,685, while families with no earners (1,458) have the lowest median family income of $52,386, accounting for 12.2% and 15.9% of families, respectively.
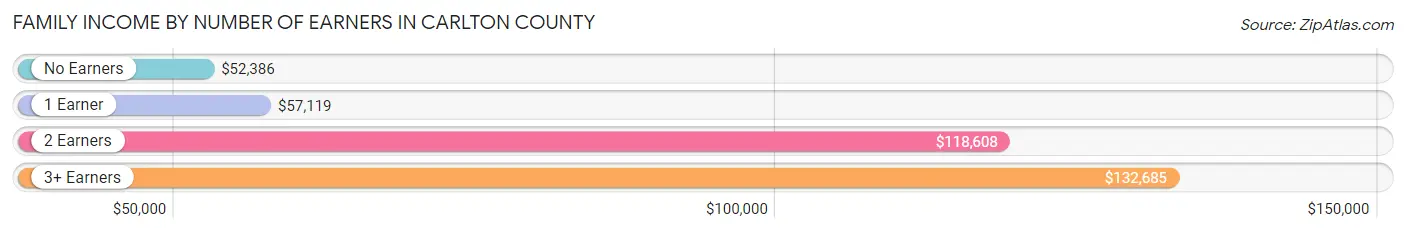
| Number of Earners | # Families | Median Income |
| No Earners | 1,458 (15.9%) | $52,386 |
| 1 Earner | 2,568 (28.0%) | $57,119 |
| 2 Earners | 4,016 (43.9%) | $118,608 |
| 3+ Earners | 1,116 (12.2%) | $132,685 |
| Total | 9,158 (100.0%) | $90,974 |
Household Income in Carlton County
Household Income Brackets in Carlton County
With 2,745 households falling in the category, the $100,000 to $149,999 income range is the most frequent in Carlton County, accounting for 19.9% of all households. In contrast, only 386 households (2.8%) fall into the less than $10,000 income bracket, making it the least populous group.
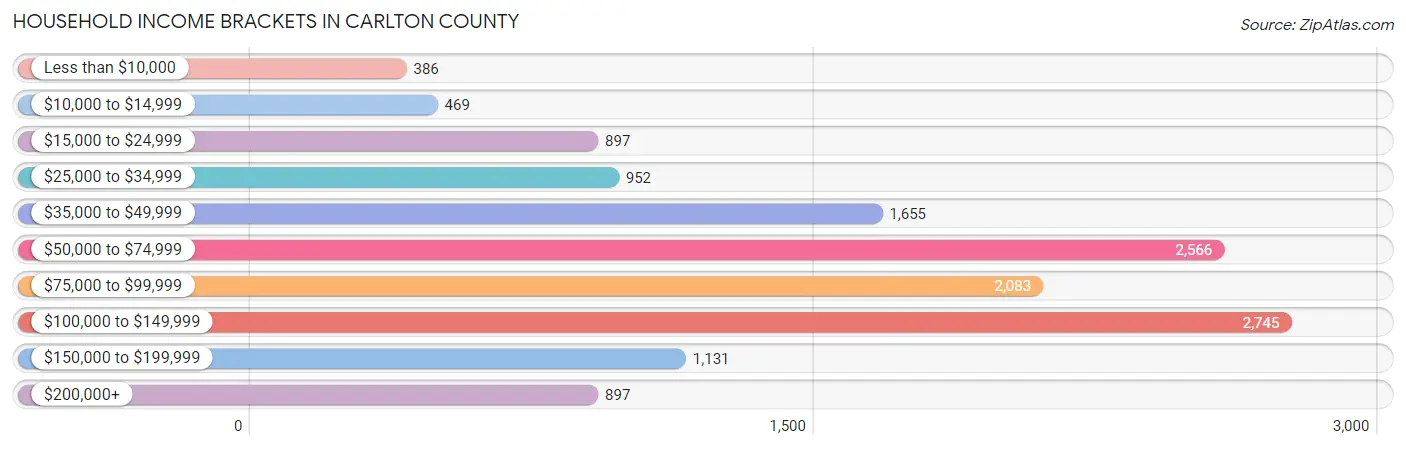
| Income Bracket | # Households | % Households |
| Less than $10,000 | 386 | 2.8% |
| $10,000 to $14,999 | 469 | 3.4% |
| $15,000 to $24,999 | 897 | 6.5% |
| $25,000 to $34,999 | 952 | 6.9% |
| $35,000 to $49,999 | 1,655 | 12.0% |
| $50,000 to $74,999 | 2,566 | 18.6% |
| $75,000 to $99,999 | 2,083 | 15.1% |
| $100,000 to $149,999 | 2,745 | 19.9% |
| $150,000 to $199,999 | 1,131 | 8.2% |
| $200,000+ | 897 | 6.5% |
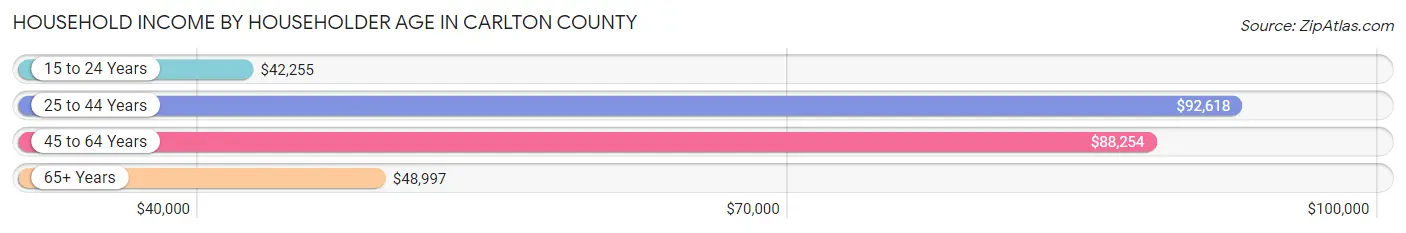
Household Income by Householder Age in Carlton County
The median household income in Carlton County is $74,660, with the highest median household income of $92,618 found in the 25 to 44 years age bracket for the primary householder. A total of 3,956 households (28.7%) fall into this category. Meanwhile, the 15 to 24 years age bracket for the primary householder has the lowest median household income of $42,255, with 538 households (3.9%) in this group.
| Income Bracket | # Households | Median Income |
| 15 to 24 Years | 538 (3.9%) | $42,255 |
| 25 to 44 Years | 3,956 (28.7%) | $92,618 |
| 45 to 64 Years | 5,397 (39.1%) | $88,254 |
| 65+ Years | 3,904 (28.3%) | $48,997 |
| Total | 13,795 (100.0%) | $74,660 |
Poverty in Carlton County
Income Below Poverty by Sex and Age in Carlton County
With 13.7% poverty level for males and 11.7% for females among the residents of Carlton County, 5 year old males and 12 to 14 year old females are the most vulnerable to poverty, with 71 males (27.6%) and 203 females (29.6%) in their respective age groups living below the poverty level.
| Age Bracket | Male | Female |
| Under 5 Years | 166 (18.0%) | 122 (13.5%) |
| 5 Years | 71 (27.6%) | 14 (6.4%) |
| 6 to 11 Years | 217 (15.7%) | 234 (18.0%) |
| 12 to 14 Years | 60 (7.6%) | 203 (29.6%) |
| 15 Years | 58 (22.8%) | 7 (2.8%) |
| 16 and 17 Years | 24 (4.7%) | 76 (16.2%) |
| 18 to 24 Years | 190 (13.7%) | 204 (18.0%) |
| 25 to 34 Years | 307 (14.5%) | 173 (9.4%) |
| 35 to 44 Years | 251 (10.9%) | 275 (13.0%) |
| 45 to 54 Years | 336 (14.2%) | 200 (9.3%) |
| 55 to 64 Years | 353 (13.3%) | 186 (7.6%) |
| 65 to 74 Years | 286 (15.6%) | 172 (9.3%) |
| 75 Years and over | 110 (10.8%) | 101 (7.2%) |
| Total | 2,429 (13.7%) | 1,967 (11.7%) |
Income Above Poverty by Sex and Age in Carlton County
According to the poverty statistics in Carlton County, males aged 16 and 17 years and females aged 15 years are the age groups that are most secure financially, with 95.3% of males and 97.2% of females in these age groups living above the poverty line.
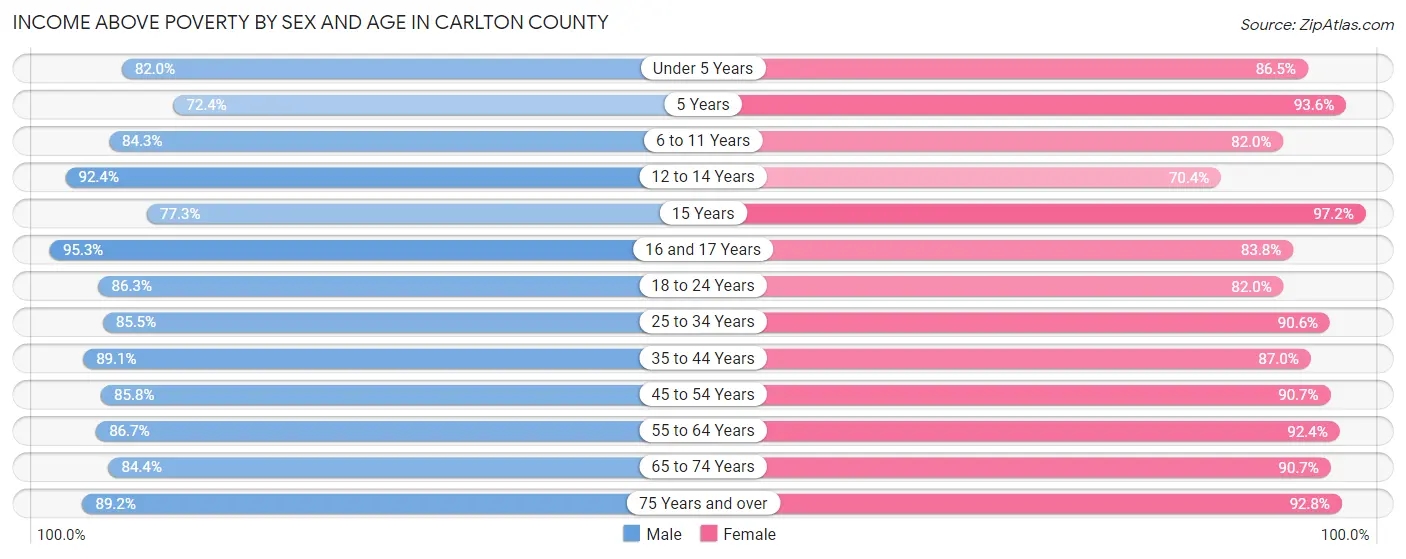
| Age Bracket | Male | Female |
| Under 5 Years | 754 (82.0%) | 780 (86.5%) |
| 5 Years | 186 (72.4%) | 204 (93.6%) |
| 6 to 11 Years | 1,166 (84.3%) | 1,063 (82.0%) |
| 12 to 14 Years | 729 (92.4%) | 483 (70.4%) |
| 15 Years | 197 (77.2%) | 243 (97.2%) |
| 16 and 17 Years | 486 (95.3%) | 392 (83.8%) |
| 18 to 24 Years | 1,193 (86.3%) | 929 (82.0%) |
| 25 to 34 Years | 1,806 (85.5%) | 1,666 (90.6%) |
| 35 to 44 Years | 2,056 (89.1%) | 1,844 (87.0%) |
| 45 to 54 Years | 2,028 (85.8%) | 1,941 (90.7%) |
| 55 to 64 Years | 2,301 (86.7%) | 2,257 (92.4%) |
| 65 to 74 Years | 1,548 (84.4%) | 1,681 (90.7%) |
| 75 Years and over | 912 (89.2%) | 1,298 (92.8%) |
| Total | 15,362 (86.4%) | 14,781 (88.3%) |
Income Below Poverty Among Married-Couple Families in Carlton County
The poverty statistics for married-couple families in Carlton County show that 1.6% or 109 of the total 6,745 families live below the poverty line. Families with 5 or more children have the highest poverty rate of 13.9%, comprising of 5 families. On the other hand, families with 1 or 2 children have the lowest poverty rate of 0.0%, which includes 1 families.
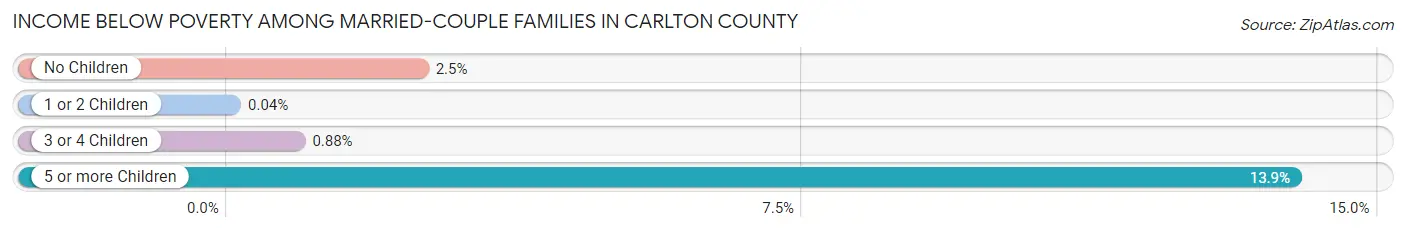
| Children | Above Poverty | Below Poverty |
| No Children | 3,884 (97.5%) | 99 (2.5%) |
| 1 or 2 Children | 2,273 (100.0%) | 1 (0.0%) |
| 3 or 4 Children | 448 (99.1%) | 4 (0.9%) |
| 5 or more Children | 31 (86.1%) | 5 (13.9%) |
| Total | 6,636 (98.4%) | 109 (1.6%) |
Income Below Poverty Among Single-Parent Households in Carlton County
According to the poverty data in Carlton County, 13.0% or 112 single-father households and 28.9% or 448 single-mother households are living below the poverty line. Among single-father households, those with 1 or 2 children have the highest poverty rate, with 99 households (20.9%) experiencing poverty. Likewise, among single-mother households, those with 5 or more children have the highest poverty rate, with 24 households (96.0%) falling below the poverty line.
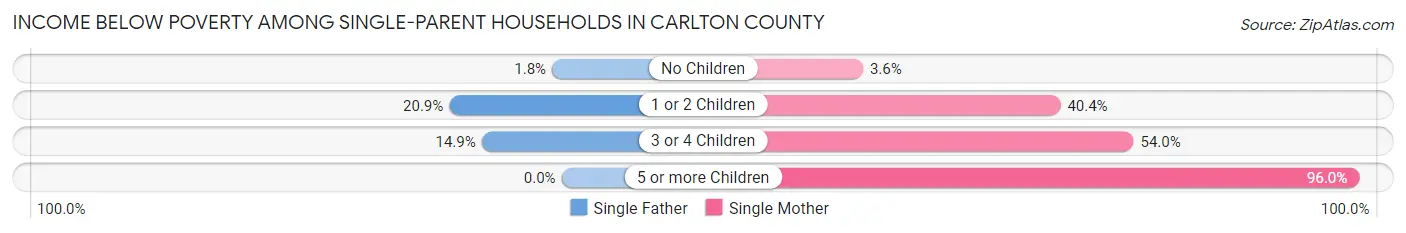
| Children | Single Father | Single Mother |
| No Children | 6 (1.8%) | 21 (3.6%) |
| 1 or 2 Children | 99 (20.9%) | 315 (40.4%) |
| 3 or 4 Children | 7 (14.9%) | 88 (54.0%) |
| 5 or more Children | 0 (0.0%) | 24 (96.0%) |
| Total | 112 (13.0%) | 448 (28.9%) |
Income Below Poverty Among Married-Couple vs Single-Parent Households in Carlton County
The poverty data for Carlton County shows that 109 of the married-couple family households (1.6%) and 560 of the single-parent households (23.2%) are living below the poverty level. Within the married-couple family households, those with 5 or more children have the highest poverty rate, with 5 households (13.9%) falling below the poverty line. Among the single-parent households, those with 5 or more children have the highest poverty rate, with 24 household (85.7%) living below poverty.
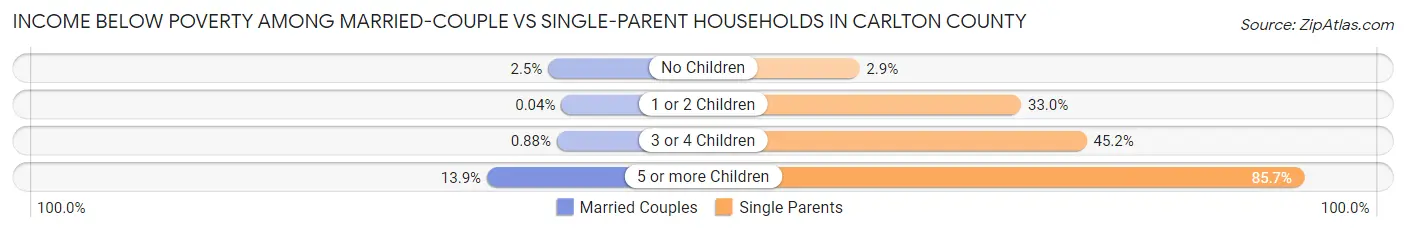
| Children | Married-Couple Families | Single-Parent Households |
| No Children | 99 (2.5%) | 27 (2.9%) |
| 1 or 2 Children | 1 (0.0%) | 414 (33.0%) |
| 3 or 4 Children | 4 (0.9%) | 95 (45.2%) |
| 5 or more Children | 5 (13.9%) | 24 (85.7%) |
| Total | 109 (1.6%) | 560 (23.2%) |
Race in Carlton County
The most populous races in Carlton County are White / Caucasian (32,107 | 88.3%), Two or more Races (1,842 | 5.1%), and Native / Alaskan (1,438 | 4.0%).
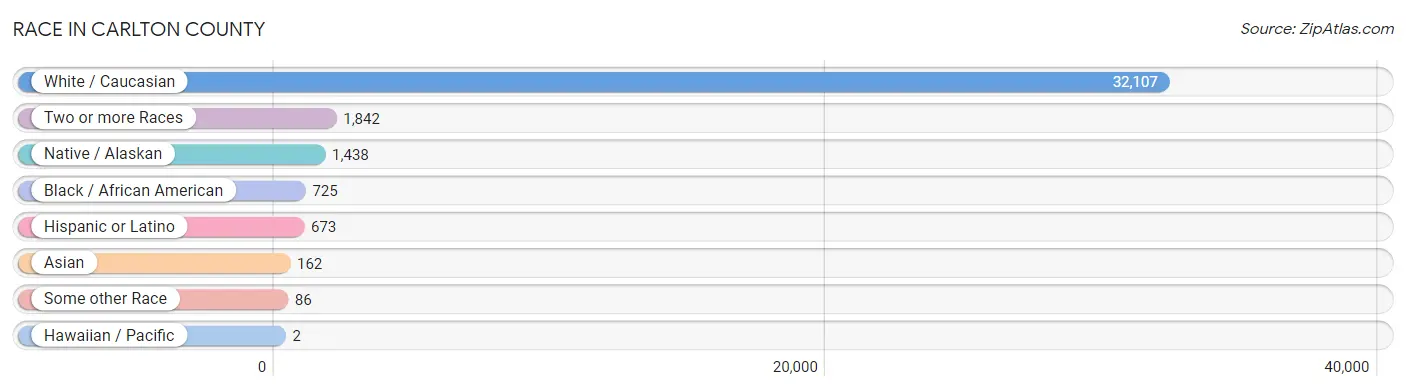
| Race | # Population | % Population |
| Asian | 162 | 0.4% |
| Black / African American | 725 | 2.0% |
| Hawaiian / Pacific | 2 | 0.0% |
| Hispanic or Latino | 673 | 1.8% |
| Native / Alaskan | 1,438 | 4.0% |
| White / Caucasian | 32,107 | 88.3% |
| Two or more Races | 1,842 | 5.1% |
| Some other Race | 86 | 0.2% |
| Total | 36,362 | 100.0% |
Ancestry in Carlton County
The most populous ancestries reported in Carlton County are German (8,273 | 22.8%), Finnish (4,620 | 12.7%), Norwegian (4,377 | 12.0%), Swedish (4,215 | 11.6%), and Irish (3,269 | 9.0%), together accounting for 68.1% of all Carlton County residents.
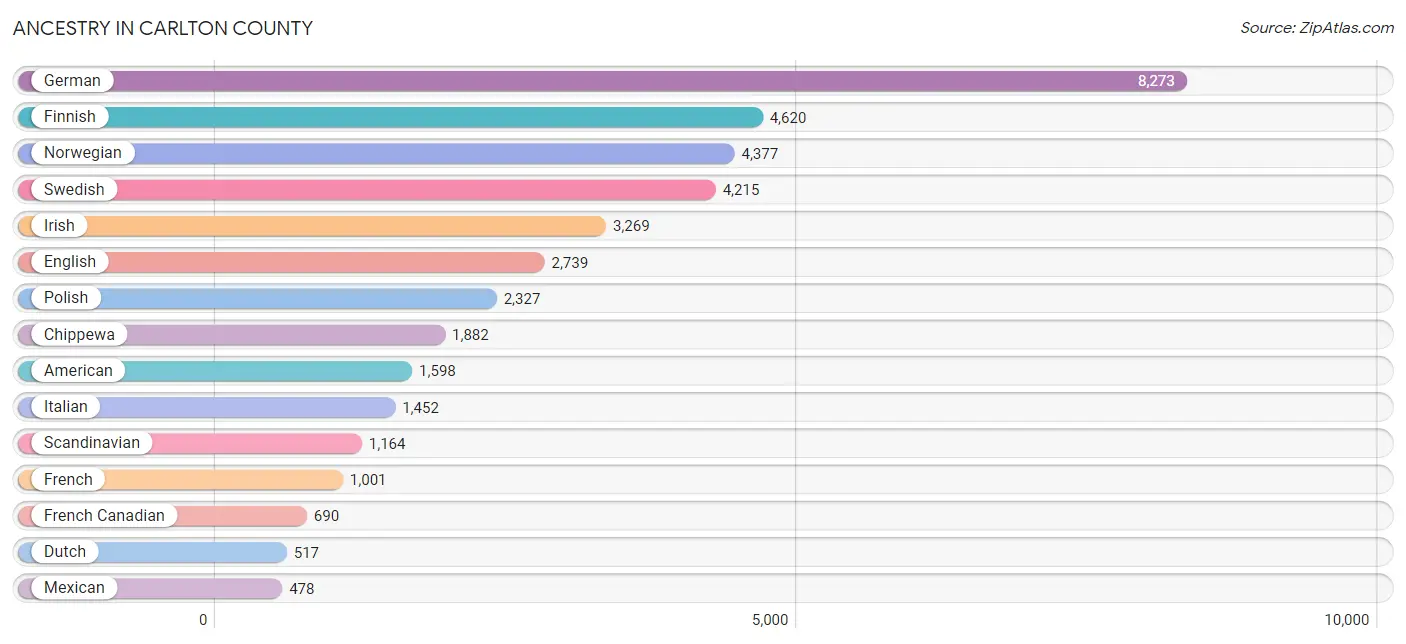
| Ancestry | # Population | % Population |
| African | 10 | 0.0% |
| American | 1,598 | 4.4% |
| Arab | 121 | 0.3% |
| Armenian | 12 | 0.0% |
| Austrian | 102 | 0.3% |
| Bangladeshi | 13 | 0.0% |
| Belgian | 47 | 0.1% |
| Bhutanese | 77 | 0.2% |
| Blackfeet | 13 | 0.0% |
| British | 184 | 0.5% |
| British West Indian | 70 | 0.2% |
| Bulgarian | 26 | 0.1% |
| Burmese | 12 | 0.0% |
| Canadian | 33 | 0.1% |
| Celtic | 1 | 0.0% |
| Central American | 48 | 0.1% |
| Central American Indian | 3 | 0.0% |
| Cherokee | 42 | 0.1% |
| Chippewa | 1,882 | 5.2% |
| Croatian | 68 | 0.2% |
| Cuban | 2 | 0.0% |
| Czech | 459 | 1.3% |
| Czechoslovakian | 1 | 0.0% |
| Danish | 464 | 1.3% |
| Dutch | 517 | 1.4% |
| Dutch West Indian | 2 | 0.0% |
| Eastern European | 91 | 0.3% |
| Ecuadorian | 11 | 0.0% |
| English | 2,739 | 7.5% |
| Ethiopian | 46 | 0.1% |
| European | 303 | 0.8% |
| Finnish | 4,620 | 12.7% |
| French | 1,001 | 2.8% |
| French American Indian | 28 | 0.1% |
| French Canadian | 690 | 1.9% |
| German | 8,273 | 22.8% |
| German Russian | 5 | 0.0% |
| Greek | 49 | 0.1% |
| Guamanian / Chamorro | 2 | 0.0% |
| Guatemalan | 9 | 0.0% |
| Hmong | 1 | 0.0% |
| Honduran | 9 | 0.0% |
| Hungarian | 44 | 0.1% |
| Icelander | 4 | 0.0% |
| Indian (Asian) | 57 | 0.2% |
| Iranian | 52 | 0.1% |
| Irish | 3,269 | 9.0% |
| Iroquois | 33 | 0.1% |
| Israeli | 15 | 0.0% |
| Italian | 1,452 | 4.0% |
| Japanese | 1 | 0.0% |
| Korean | 146 | 0.4% |
| Lebanese | 25 | 0.1% |
| Liberian | 14 | 0.0% |
| Lithuanian | 23 | 0.1% |
| Luxembourger | 8 | 0.0% |
| Malaysian | 15 | 0.0% |
| Menominee | 2 | 0.0% |
| Mexican | 478 | 1.3% |
| Mexican American Indian | 11 | 0.0% |
| Native Hawaiian | 2 | 0.0% |
| Navajo | 1 | 0.0% |
| Nigerian | 2 | 0.0% |
| Northern European | 38 | 0.1% |
| Norwegian | 4,377 | 12.0% |
| Ottawa | 8 | 0.0% |
| Pakistani | 3 | 0.0% |
| Panamanian | 15 | 0.0% |
| Pennsylvania German | 3 | 0.0% |
| Polish | 2,327 | 6.4% |
| Portuguese | 21 | 0.1% |
| Puerto Rican | 12 | 0.0% |
| Romanian | 22 | 0.1% |
| Russian | 125 | 0.3% |
| Salvadoran | 15 | 0.0% |
| Samoan | 9 | 0.0% |
| Scandinavian | 1,164 | 3.2% |
| Scotch-Irish | 104 | 0.3% |
| Scottish | 253 | 0.7% |
| Serbian | 53 | 0.2% |
| Sioux | 106 | 0.3% |
| Slavic | 59 | 0.2% |
| Slovak | 42 | 0.1% |
| Slovene | 89 | 0.2% |
| South American | 11 | 0.0% |
| Spaniard | 26 | 0.1% |
| Spanish | 2 | 0.0% |
| Spanish American | 5 | 0.0% |
| Sri Lankan | 11 | 0.0% |
| Subsaharan African | 78 | 0.2% |
| Swedish | 4,215 | 11.6% |
| Swiss | 190 | 0.5% |
| Syrian | 79 | 0.2% |
| Thai | 30 | 0.1% |
| Tlingit-Haida | 14 | 0.0% |
| Turkish | 32 | 0.1% |
| Ukrainian | 29 | 0.1% |
| Welsh | 83 | 0.2% |
| Yugoslavian | 50 | 0.1% |
| Yup'ik | 18 | 0.1% | View All 100 Rows |
Immigrants in Carlton County
The most numerous immigrant groups reported in Carlton County came from Asia (127 | 0.4%), Latin America (102 | 0.3%), Central America (93 | 0.3%), Africa (82 | 0.2%), and Canada (74 | 0.2%), together accounting for 1.3% of all Carlton County residents.

| Immigration Origin | # Population | % Population |
| Africa | 82 | 0.2% |
| Asia | 127 | 0.4% |
| Austria | 3 | 0.0% |
| Brazil | 4 | 0.0% |
| Canada | 74 | 0.2% |
| Caribbean | 1 | 0.0% |
| Central America | 93 | 0.3% |
| China | 24 | 0.1% |
| Denmark | 3 | 0.0% |
| Eastern Africa | 61 | 0.2% |
| Eastern Asia | 26 | 0.1% |
| Eastern Europe | 21 | 0.1% |
| Ecuador | 4 | 0.0% |
| El Salvador | 3 | 0.0% |
| Ethiopia | 51 | 0.1% |
| Europe | 68 | 0.2% |
| France | 4 | 0.0% |
| Germany | 12 | 0.0% |
| Guatemala | 9 | 0.0% |
| Honduras | 8 | 0.0% |
| Hong Kong | 22 | 0.1% |
| India | 30 | 0.1% |
| Iraq | 6 | 0.0% |
| Italy | 3 | 0.0% |
| Jamaica | 1 | 0.0% |
| Kenya | 1 | 0.0% |
| Korea | 2 | 0.0% |
| Laos | 28 | 0.1% |
| Latin America | 102 | 0.3% |
| Liberia | 9 | 0.0% |
| Mexico | 73 | 0.2% |
| Netherlands | 3 | 0.0% |
| Northern Africa | 6 | 0.0% |
| Northern Europe | 8 | 0.0% |
| Pakistan | 1 | 0.0% |
| Philippines | 15 | 0.0% |
| Poland | 15 | 0.0% |
| Russia | 6 | 0.0% |
| Sierra Leone | 2 | 0.0% |
| South America | 8 | 0.0% |
| South Central Asia | 31 | 0.1% |
| South Eastern Asia | 52 | 0.1% |
| Southern Europe | 17 | 0.1% |
| Spain | 14 | 0.0% |
| Sudan | 6 | 0.0% |
| Sweden | 4 | 0.0% |
| Taiwan | 2 | 0.0% |
| Thailand | 9 | 0.0% |
| Turkey | 1 | 0.0% |
| Western Africa | 11 | 0.0% |
| Western Asia | 18 | 0.1% |
| Western Europe | 22 | 0.1% | View All 52 Rows |
Sex and Age in Carlton County
Sex and Age in Carlton County
The most populous age groups in Carlton County are 60 to 64 Years (1,466 | 7.6%) for men and 60 to 64 Years (1,298 | 7.6%) for women.
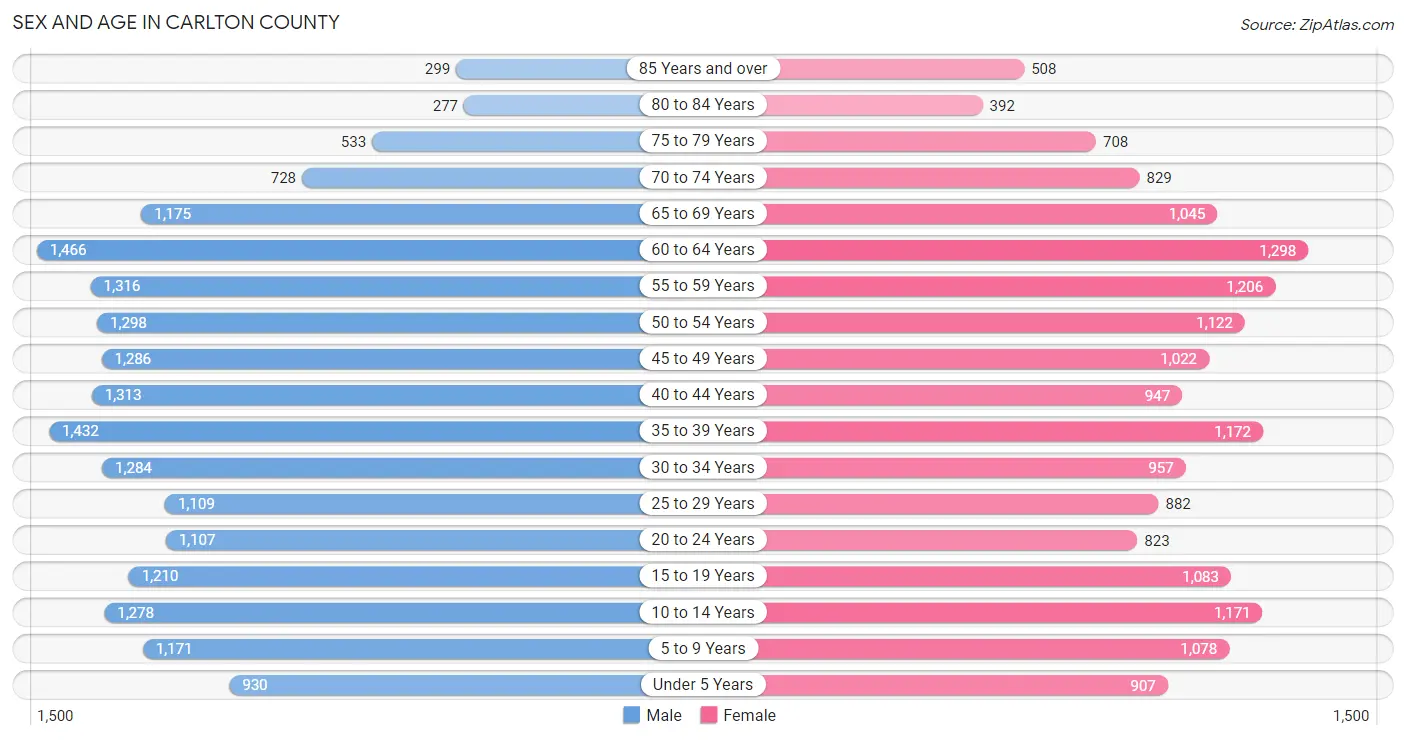
| Age Bracket | Male | Female |
| Under 5 Years | 930 (4.8%) | 907 (5.3%) |
| 5 to 9 Years | 1,171 (6.1%) | 1,078 (6.3%) |
| 10 to 14 Years | 1,278 (6.7%) | 1,171 (6.8%) |
| 15 to 19 Years | 1,210 (6.3%) | 1,083 (6.3%) |
| 20 to 24 Years | 1,107 (5.8%) | 823 (4.8%) |
| 25 to 29 Years | 1,109 (5.8%) | 882 (5.1%) |
| 30 to 34 Years | 1,284 (6.7%) | 957 (5.6%) |
| 35 to 39 Years | 1,432 (7.4%) | 1,172 (6.8%) |
| 40 to 44 Years | 1,313 (6.8%) | 947 (5.5%) |
| 45 to 49 Years | 1,286 (6.7%) | 1,022 (6.0%) |
| 50 to 54 Years | 1,298 (6.8%) | 1,122 (6.5%) |
| 55 to 59 Years | 1,316 (6.9%) | 1,206 (7.0%) |
| 60 to 64 Years | 1,466 (7.6%) | 1,298 (7.6%) |
| 65 to 69 Years | 1,175 (6.1%) | 1,045 (6.1%) |
| 70 to 74 Years | 728 (3.8%) | 829 (4.8%) |
| 75 to 79 Years | 533 (2.8%) | 708 (4.1%) |
| 80 to 84 Years | 277 (1.4%) | 392 (2.3%) |
| 85 Years and over | 299 (1.6%) | 508 (3.0%) |
| Total | 19,212 (100.0%) | 17,150 (100.0%) |
Families and Households in Carlton County
Median Family Size in Carlton County
The median family size in Carlton County is 2.95 persons per family, with married-couple families (6,745 | 73.7%) accounting for the largest median family size of 3.02 persons per family. On the other hand, single male/father families (861 | 9.4%) represent the smallest median family size with 2.64 persons per family.
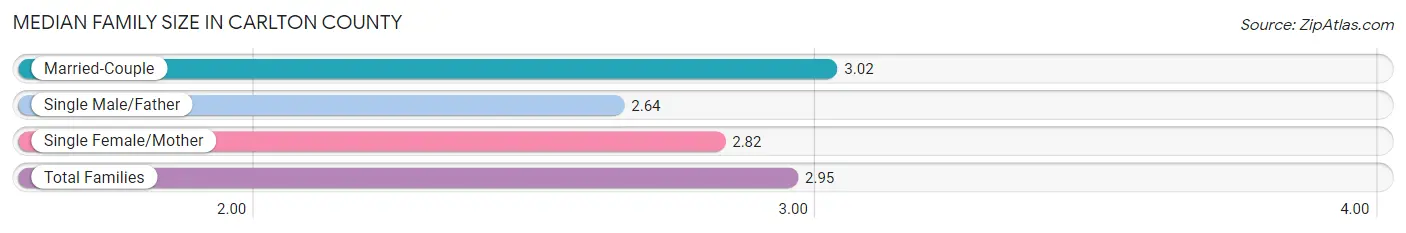
| Family Type | # Families | Family Size |
| Married-Couple | 6,745 (73.7%) | 3.02 |
| Single Male/Father | 861 (9.4%) | 2.64 |
| Single Female/Mother | 1,552 (17.0%) | 2.82 |
| Total Families | 9,158 (100.0%) | 2.95 |
Median Household Size in Carlton County
The median household size in Carlton County is 2.42 persons per household, with single female/mother households (1,552 | 11.3%) accounting for the largest median household size of 3.09 persons per household. non-family households (4,637 | 33.6%) represent the smallest median household size with 1.22 persons per household.
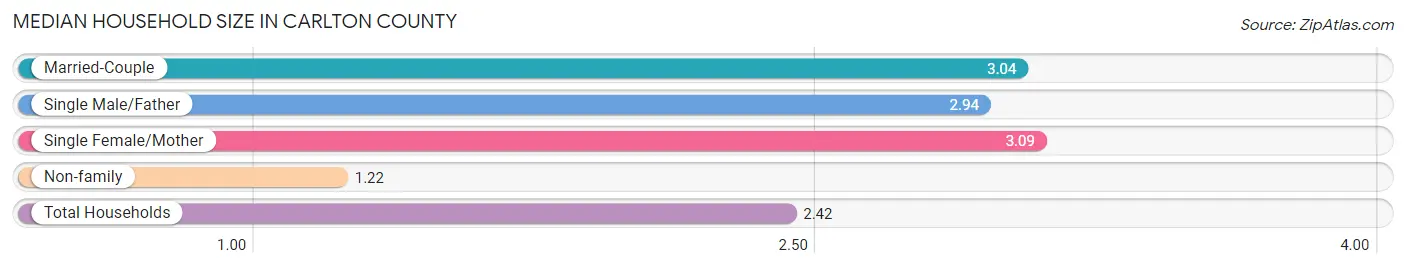
| Household Type | # Households | Household Size |
| Married-Couple | 6,745 (48.9%) | 3.04 |
| Single Male/Father | 861 (6.2%) | 2.94 |
| Single Female/Mother | 1,552 (11.3%) | 3.09 |
| Non-family | 4,637 (33.6%) | 1.22 |
| Total Households | 13,795 (100.0%) | 2.42 |
Household Size by Marriage Status in Carlton County
Out of a total of 13,795 households in Carlton County, 9,158 (66.4%) are family households, while 4,637 (33.6%) are nonfamily households. The most numerous type of family households are 2-person households, comprising 3,972, and the most common type of nonfamily households are 1-person households, comprising 3,712.
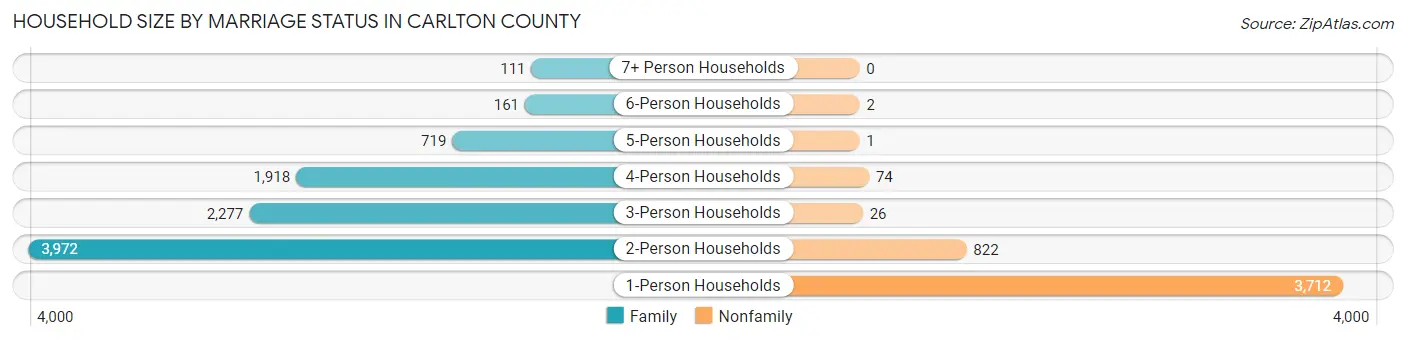
| Household Size | Family Households | Nonfamily Households |
| 1-Person Households | - | 3,712 (26.9%) |
| 2-Person Households | 3,972 (28.8%) | 822 (6.0%) |
| 3-Person Households | 2,277 (16.5%) | 26 (0.2%) |
| 4-Person Households | 1,918 (13.9%) | 74 (0.5%) |
| 5-Person Households | 719 (5.2%) | 1 (0.0%) |
| 6-Person Households | 161 (1.2%) | 2 (0.0%) |
| 7+ Person Households | 111 (0.8%) | 0 (0.0%) |
| Total | 9,158 (66.4%) | 4,637 (33.6%) |
Female Fertility in Carlton County
Fertility by Age in Carlton County
Average fertility rate in Carlton County is 40.0 births per 1,000 women. Women in the age bracket of 20 to 34 years have the highest fertility rate with 91.0 births per 1,000 women. Women in the age bracket of 20 to 34 years acount for 86.1% of all women with births.
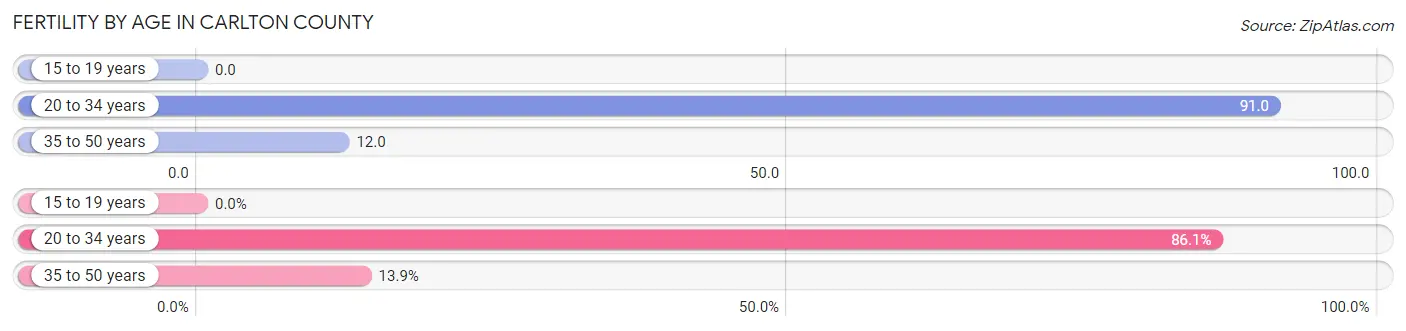
| Age Bracket | Women with Births | Births / 1,000 Women |
| 15 to 19 years | 0 (0.0%) | 0.0 |
| 20 to 34 years | 242 (86.1%) | 91.0 |
| 35 to 50 years | 39 (13.9%) | 12.0 |
| Total | 281 (100.0%) | 40.0 |
Fertility by Age by Marriage Status in Carlton County
61.2% of women with births (281) in Carlton County are married. The highest percentage of unmarried women with births falls into 20 to 34 years age bracket with 45.0% of them unmarried at the time of birth, while the lowest percentage of unmarried women with births belong to 35 to 50 years age bracket with 0.0% of them unmarried.
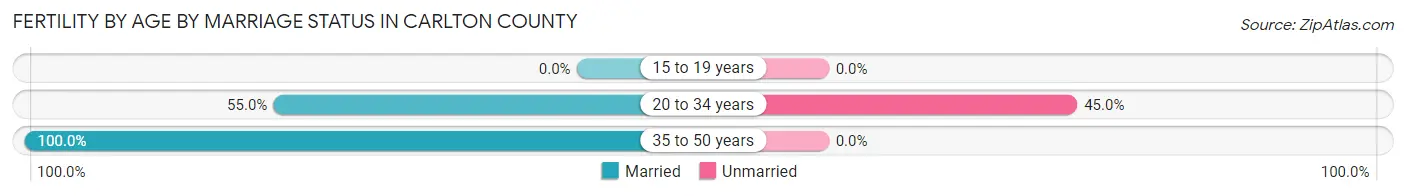
| Age Bracket | Married | Unmarried |
| 15 to 19 years | 0 (0.0%) | 0 (0.0%) |
| 20 to 34 years | 133 (55.0%) | 109 (45.0%) |
| 35 to 50 years | 39 (100.0%) | 0 (0.0%) |
| Total | 172 (61.2%) | 109 (38.8%) |
Fertility by Education in Carlton County
Average fertility rate in Carlton County is 40.0 births per 1,000 women. Women with the education attainment of bachelor's degree have the highest fertility rate of 51.0 births per 1,000 women, while women with the education attainment of less than high school have the lowest fertility at 4.0 births per 1,000 women. Women with the education attainment of college or associate's degree represent 44.5% of all women with births.
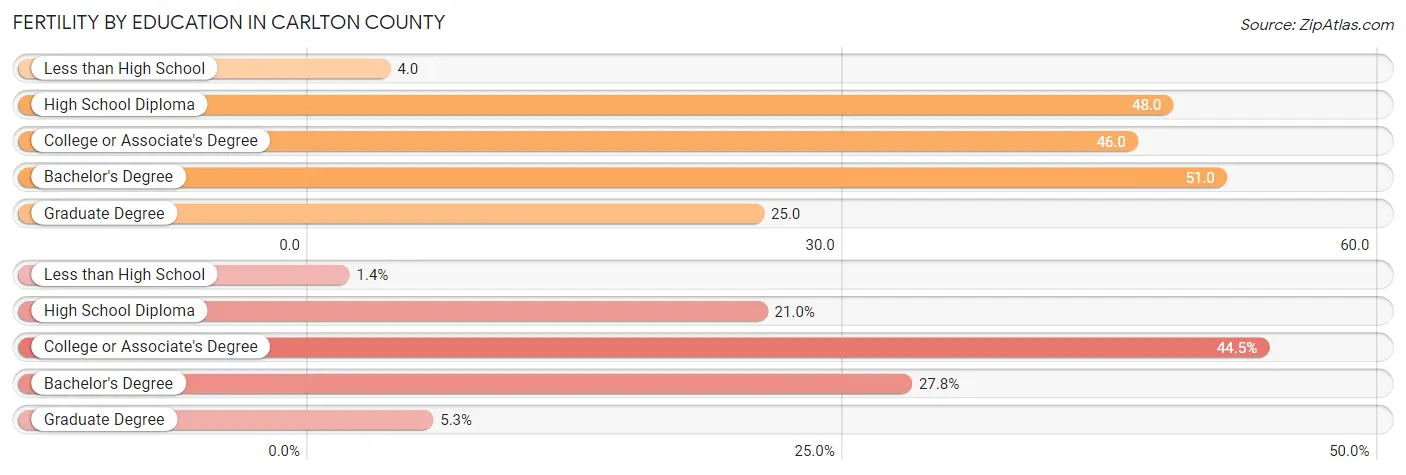
| Educational Attainment | Women with Births | Births / 1,000 Women |
| Less than High School | 4 (1.4%) | 4.0 |
| High School Diploma | 59 (21.0%) | 48.0 |
| College or Associate's Degree | 125 (44.5%) | 46.0 |
| Bachelor's Degree | 78 (27.8%) | 51.0 |
| Graduate Degree | 15 (5.3%) | 25.0 |
| Total | 281 (100.0%) | 40.0 |
Fertility by Education by Marriage Status in Carlton County
38.8% of women with births in Carlton County are unmarried. Women with the educational attainment of graduate degree are most likely to be married with 100.0% of them married at childbirth, while women with the educational attainment of high school diploma are least likely to be married with 50.8% of them unmarried at childbirth.
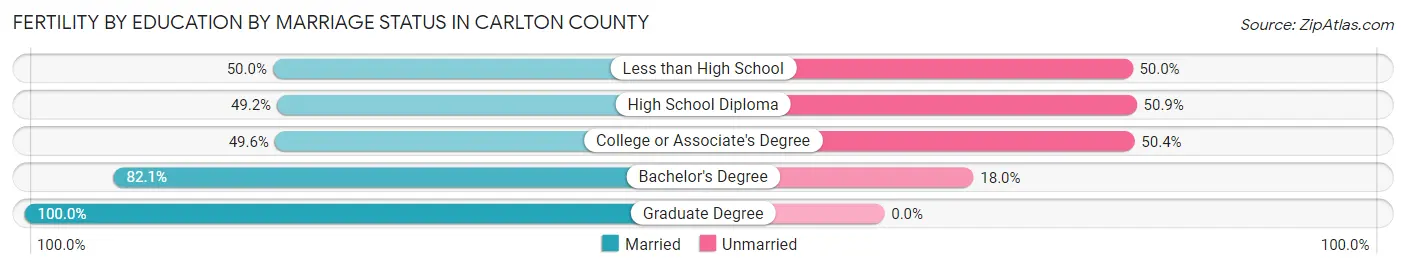
| Educational Attainment | Married | Unmarried |
| Less than High School | 2 (50.0%) | 2 (50.0%) |
| High School Diploma | 29 (49.1%) | 30 (50.8%) |
| College or Associate's Degree | 62 (49.6%) | 63 (50.4%) |
| Bachelor's Degree | 64 (82.1%) | 14 (17.9%) |
| Graduate Degree | 15 (100.0%) | 0 (0.0%) |
| Total | 172 (61.2%) | 109 (38.8%) |
Employment Characteristics in Carlton County
Employment by Class of Employer in Carlton County
Among the 16,454 employed individuals in Carlton County, private company employees (9,643 | 58.6%), not-for-profit organizations (1,964 | 11.9%), and local government employees (1,813 | 11.0%) make up the most common classes of employment.
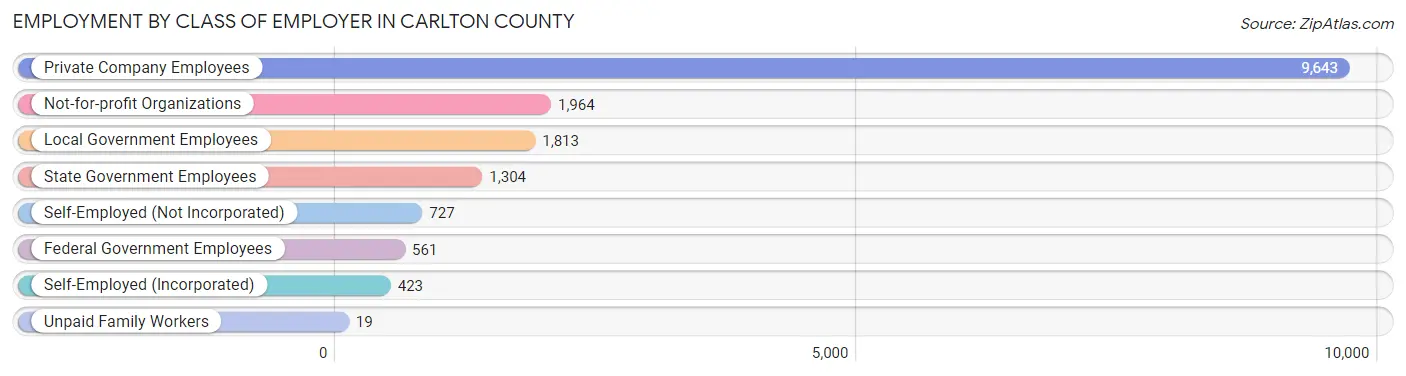
| Employer Class | # Employees | % Employees |
| Private Company Employees | 9,643 | 58.6% |
| Self-Employed (Incorporated) | 423 | 2.6% |
| Self-Employed (Not Incorporated) | 727 | 4.4% |
| Not-for-profit Organizations | 1,964 | 11.9% |
| Local Government Employees | 1,813 | 11.0% |
| State Government Employees | 1,304 | 7.9% |
| Federal Government Employees | 561 | 3.4% |
| Unpaid Family Workers | 19 | 0.1% |
| Total | 16,454 | 100.0% |
Employment Status by Age in Carlton County
According to the labor force statistics for Carlton County, out of the total population over 16 years of age (29,322), 60.0% or 17,593 individuals are in the labor force, with 4.7% or 827 of them unemployed. The age group with the highest labor force participation rate is 30 to 34 years, with 84.7% or 1,898 individuals in the labor force. Within the labor force, the 16 to 19 years age range has the highest percentage of unemployed individuals, with 9.6% or 89 of them being unemployed.
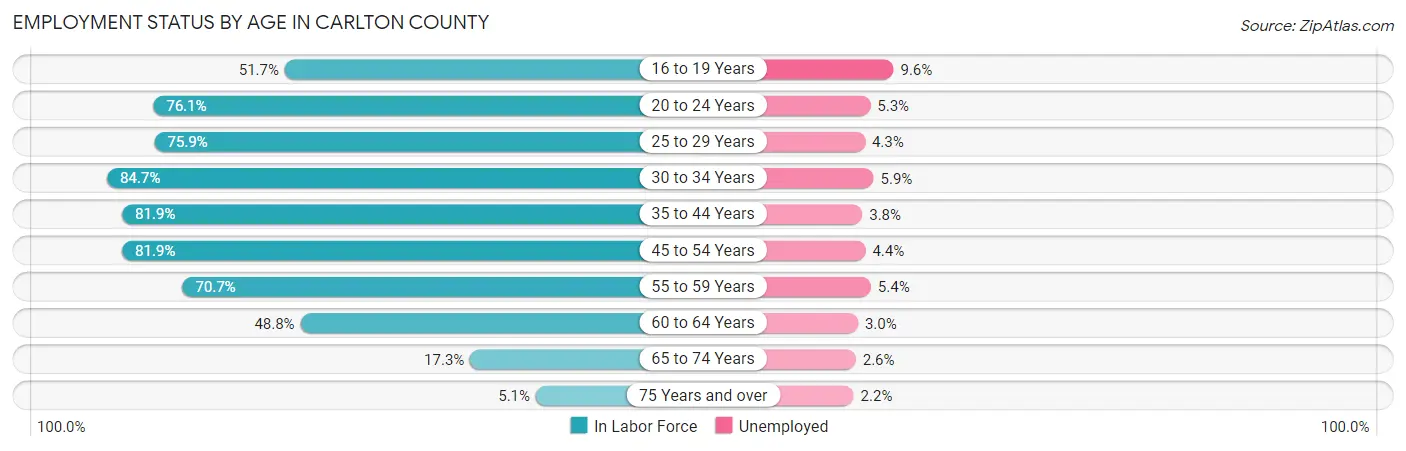
| Age Bracket | In Labor Force | Unemployed |
| 16 to 19 Years | 924 (51.7%) | 89 (9.6%) |
| 20 to 24 Years | 1,469 (76.1%) | 78 (5.3%) |
| 25 to 29 Years | 1,511 (75.9%) | 65 (4.3%) |
| 30 to 34 Years | 1,898 (84.7%) | 112 (5.9%) |
| 35 to 44 Years | 3,984 (81.9%) | 151 (3.8%) |
| 45 to 54 Years | 3,872 (81.9%) | 170 (4.4%) |
| 55 to 59 Years | 1,783 (70.7%) | 96 (5.4%) |
| 60 to 64 Years | 1,349 (48.8%) | 40 (3.0%) |
| 65 to 74 Years | 653 (17.3%) | 17 (2.6%) |
| 75 Years and over | 139 (5.1%) | 3 (2.2%) |
| Total | 17,593 (60.0%) | 827 (4.7%) |
Employment Status by Educational Attainment in Carlton County
According to labor force statistics for Carlton County, 75.3% of individuals (14,390) out of the total population between 25 and 64 years of age (19,110) are in the labor force, with 4.4% or 633 of them being unemployed. The group with the highest labor force participation rate are those with the educational attainment of bachelor's degree or higher, with 86.7% or 4,492 individuals in the labor force. Within the labor force, individuals with less than high school education have the highest percentage of unemployment, with 9.4% or 44 of them being unemployed.
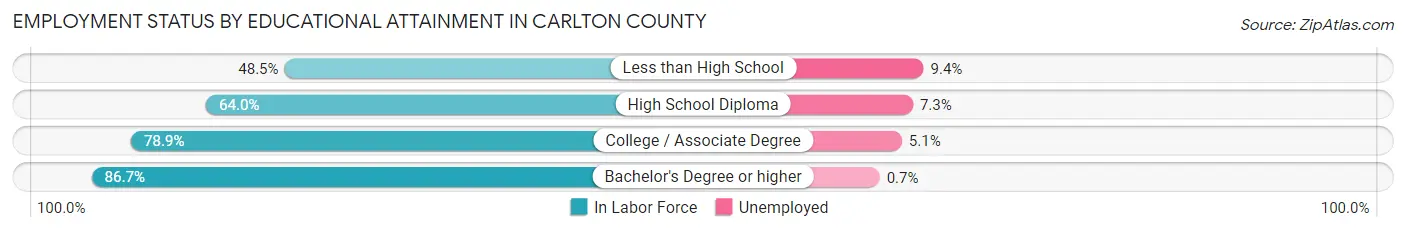
| Educational Attainment | In Labor Force | Unemployed |
| Less than High School | 468 (48.5%) | 91 (9.4%) |
| High School Diploma | 3,390 (64.0%) | 387 (7.3%) |
| College / Associate Degree | 6,049 (78.9%) | 391 (5.1%) |
| Bachelor's Degree or higher | 4,492 (86.7%) | 36 (0.7%) |
| Total | 14,390 (75.3%) | 841 (4.4%) |
Employment Occupations by Sex in Carlton County
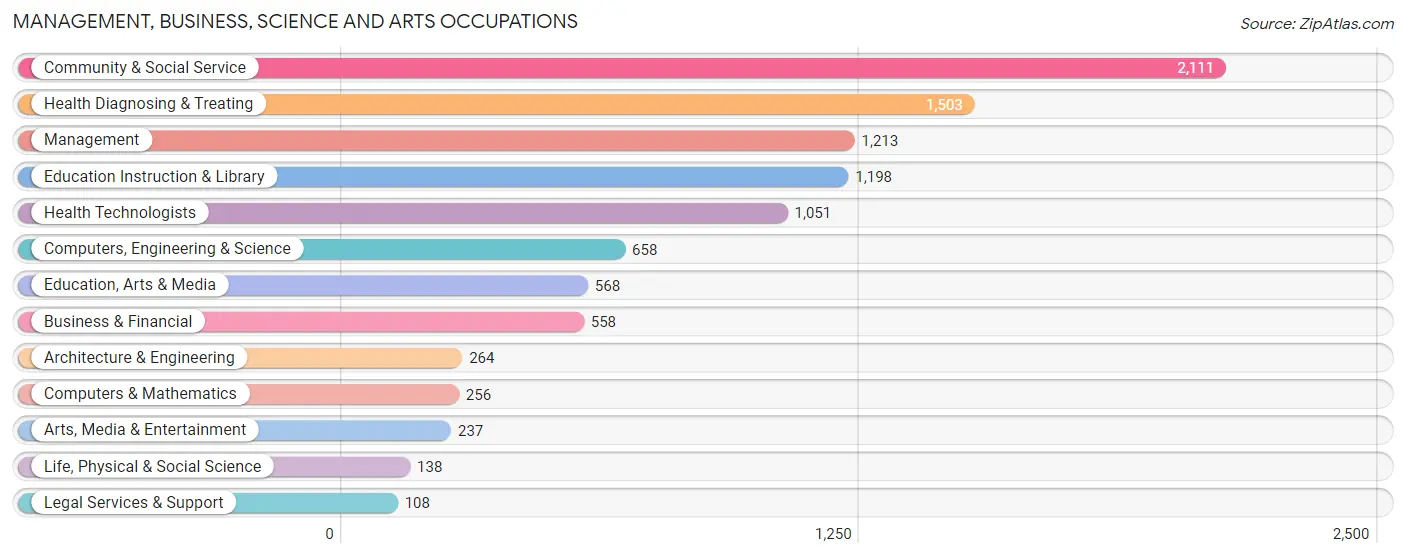
Management, Business, Science and Arts Occupations
The most common Management, Business, Science and Arts occupations in Carlton County are Community & Social Service (2,111 | 12.6%), Health Diagnosing & Treating (1,503 | 9.0%), Management (1,213 | 7.3%), Education Instruction & Library (1,198 | 7.2%), and Health Technologists (1,051 | 6.3%).
Management, Business, Science and Arts Occupations by Sex
Within the Management, Business, Science and Arts occupations in Carlton County, the most male-oriented occupations are Architecture & Engineering (81.8%), Computers, Engineering & Science (69.0%), and Computers & Mathematics (64.1%), while the most female-oriented occupations are Legal Services & Support (87.0%), Health Technologists (78.2%), and Health Diagnosing & Treating (78.0%).
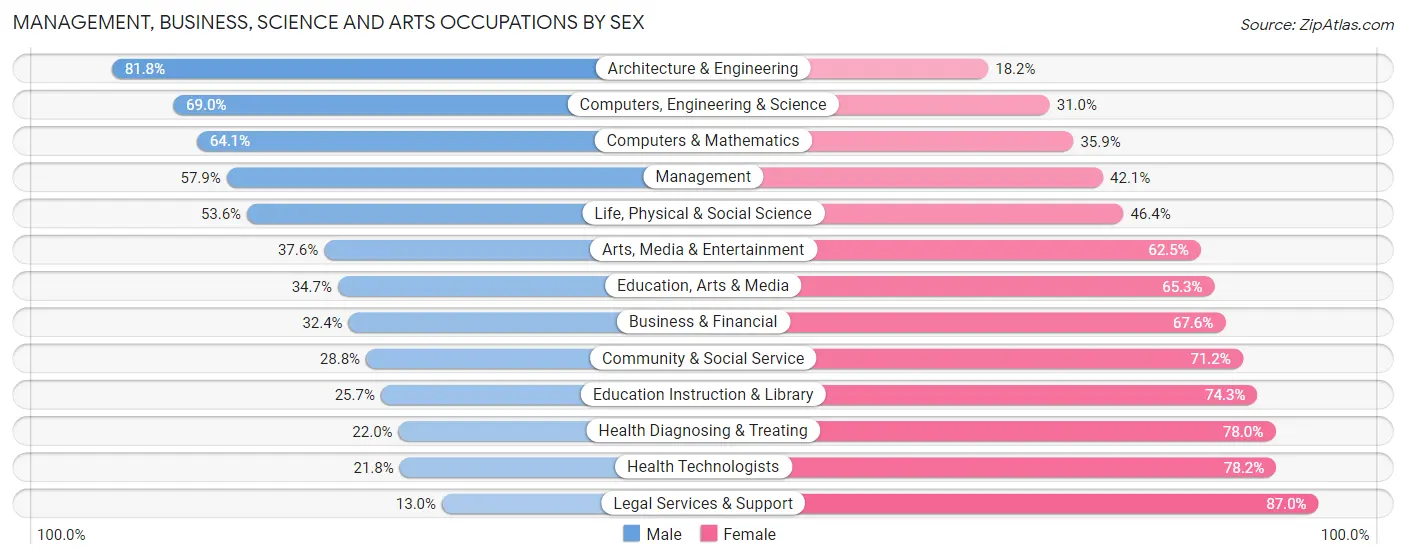
| Occupation | Male | Female |
| Management | 702 (57.9%) | 511 (42.1%) |
| Business & Financial | 181 (32.4%) | 377 (67.6%) |
| Computers, Engineering & Science | 454 (69.0%) | 204 (31.0%) |
| Computers & Mathematics | 164 (64.1%) | 92 (35.9%) |
| Architecture & Engineering | 216 (81.8%) | 48 (18.2%) |
| Life, Physical & Social Science | 74 (53.6%) | 64 (46.4%) |
| Community & Social Service | 608 (28.8%) | 1,503 (71.2%) |
| Education, Arts & Media | 197 (34.7%) | 371 (65.3%) |
| Legal Services & Support | 14 (13.0%) | 94 (87.0%) |
| Education Instruction & Library | 308 (25.7%) | 890 (74.3%) |
| Arts, Media & Entertainment | 89 (37.6%) | 148 (62.5%) |
| Health Diagnosing & Treating | 331 (22.0%) | 1,172 (78.0%) |
| Health Technologists | 229 (21.8%) | 822 (78.2%) |
| Total (Category) | 2,276 (37.7%) | 3,767 (62.3%) |
| Total (Overall) | 8,620 (51.6%) | 8,081 (48.4%) |
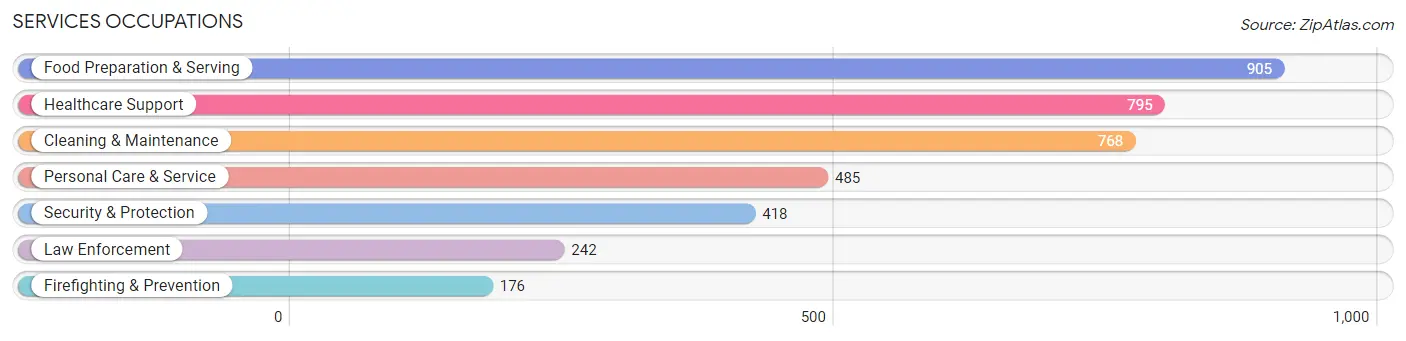
Services Occupations
The most common Services occupations in Carlton County are Food Preparation & Serving (905 | 5.4%), Healthcare Support (795 | 4.8%), Cleaning & Maintenance (768 | 4.6%), Personal Care & Service (485 | 2.9%), and Security & Protection (418 | 2.5%).
Services Occupations by Sex
Within the Services occupations in Carlton County, the most male-oriented occupations are Law Enforcement (85.5%), Security & Protection (81.6%), and Firefighting & Prevention (76.1%), while the most female-oriented occupations are Healthcare Support (88.7%), Personal Care & Service (82.3%), and Food Preparation & Serving (47.7%).
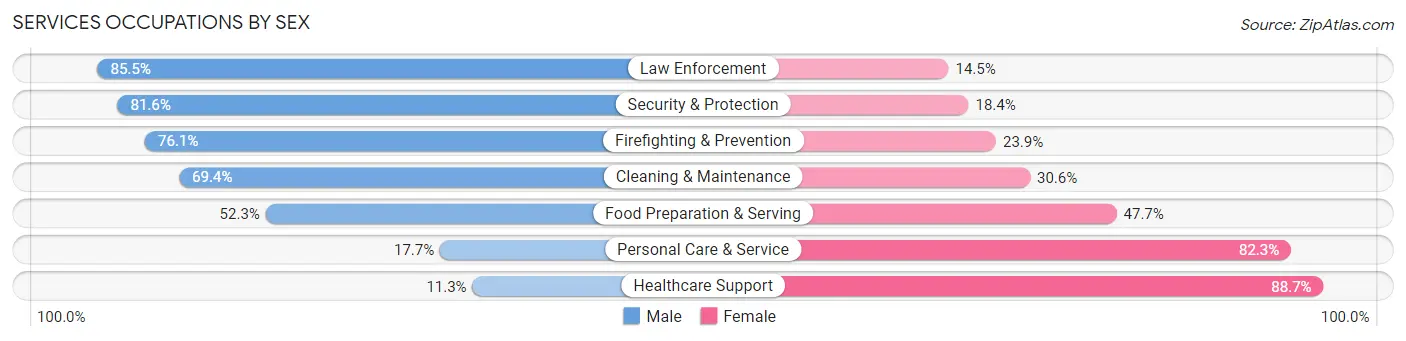
| Occupation | Male | Female |
| Healthcare Support | 90 (11.3%) | 705 (88.7%) |
| Security & Protection | 341 (81.6%) | 77 (18.4%) |
| Firefighting & Prevention | 134 (76.1%) | 42 (23.9%) |
| Law Enforcement | 207 (85.5%) | 35 (14.5%) |
| Food Preparation & Serving | 473 (52.3%) | 432 (47.7%) |
| Cleaning & Maintenance | 533 (69.4%) | 235 (30.6%) |
| Personal Care & Service | 86 (17.7%) | 399 (82.3%) |
| Total (Category) | 1,523 (45.2%) | 1,848 (54.8%) |
| Total (Overall) | 8,620 (51.6%) | 8,081 (48.4%) |
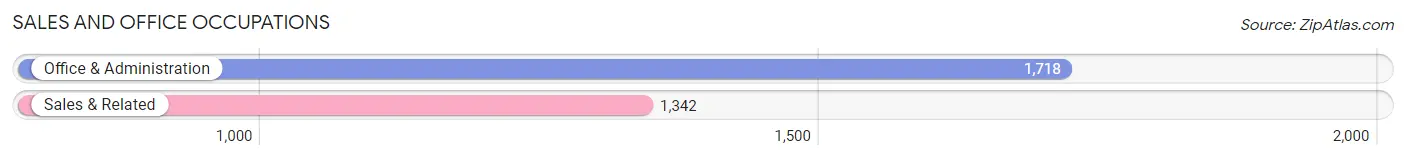
Sales and Office Occupations
The most common Sales and Office occupations in Carlton County are Office & Administration (1,718 | 10.3%), and Sales & Related (1,342 | 8.0%).
Sales and Office Occupations by Sex
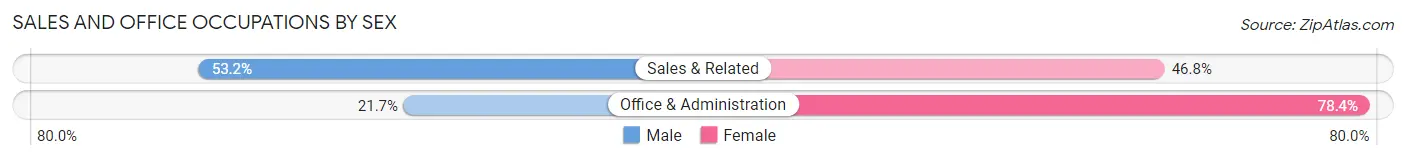
| Occupation | Male | Female |
| Sales & Related | 714 (53.2%) | 628 (46.8%) |
| Office & Administration | 372 (21.6%) | 1,346 (78.3%) |
| Total (Category) | 1,086 (35.5%) | 1,974 (64.5%) |
| Total (Overall) | 8,620 (51.6%) | 8,081 (48.4%) |
Natural Resources, Construction and Maintenance Occupations
The most common Natural Resources, Construction and Maintenance occupations in Carlton County are Construction & Extraction (920 | 5.5%), Installation, Maintenance & Repair (703 | 4.2%), and Farming, Fishing & Forestry (77 | 0.5%).
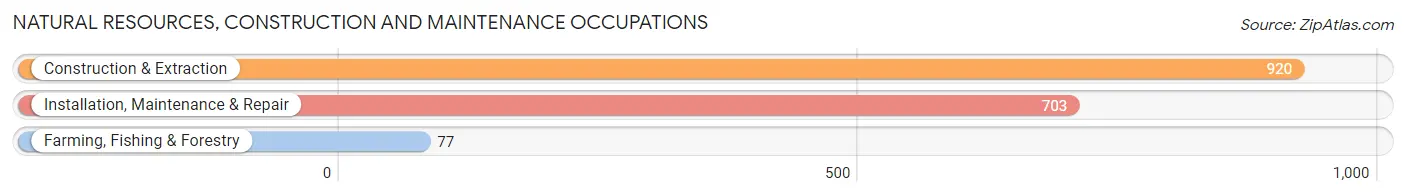
Natural Resources, Construction and Maintenance Occupations by Sex
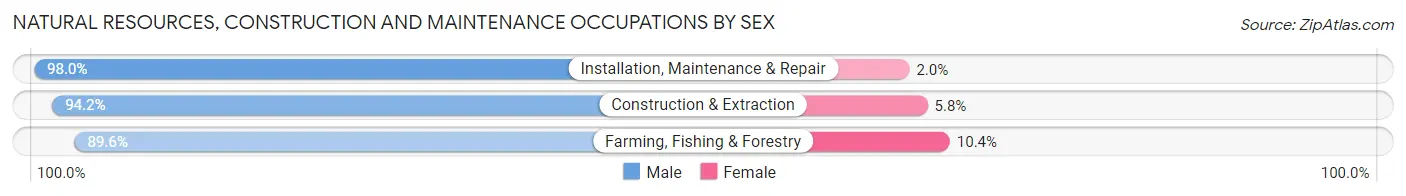
| Occupation | Male | Female |
| Farming, Fishing & Forestry | 69 (89.6%) | 8 (10.4%) |
| Construction & Extraction | 867 (94.2%) | 53 (5.8%) |
| Installation, Maintenance & Repair | 689 (98.0%) | 14 (2.0%) |
| Total (Category) | 1,625 (95.6%) | 75 (4.4%) |
| Total (Overall) | 8,620 (51.6%) | 8,081 (48.4%) |
Production, Transportation and Moving Occupations
The most common Production, Transportation and Moving occupations in Carlton County are Production (1,250 | 7.5%), Transportation (758 | 4.5%), and Material Moving (519 | 3.1%).
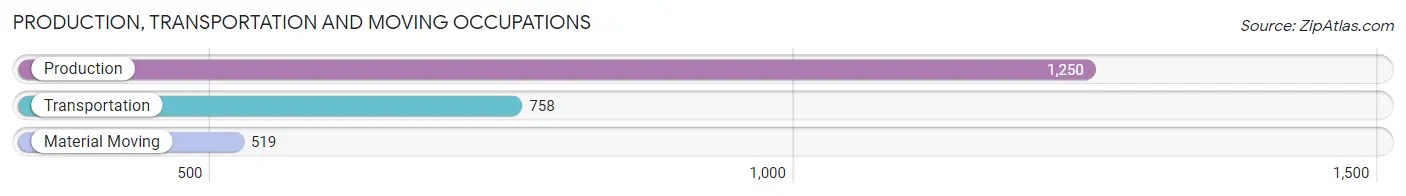
Production, Transportation and Moving Occupations by Sex
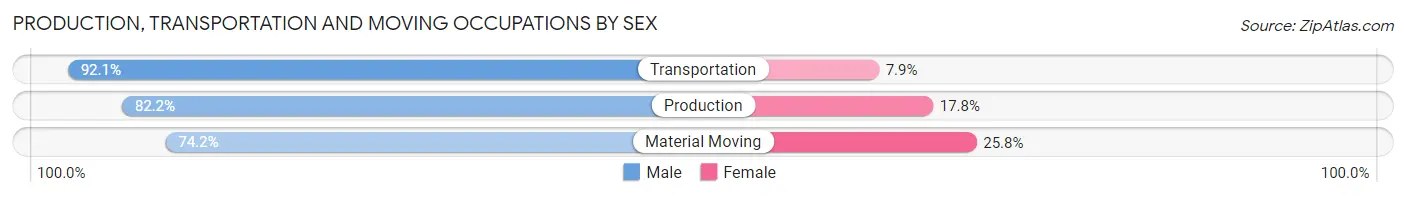
| Occupation | Male | Female |
| Production | 1,027 (82.2%) | 223 (17.8%) |
| Transportation | 698 (92.1%) | 60 (7.9%) |
| Material Moving | 385 (74.2%) | 134 (25.8%) |
| Total (Category) | 2,110 (83.5%) | 417 (16.5%) |
| Total (Overall) | 8,620 (51.6%) | 8,081 (48.4%) |
Employment Industries by Sex in Carlton County
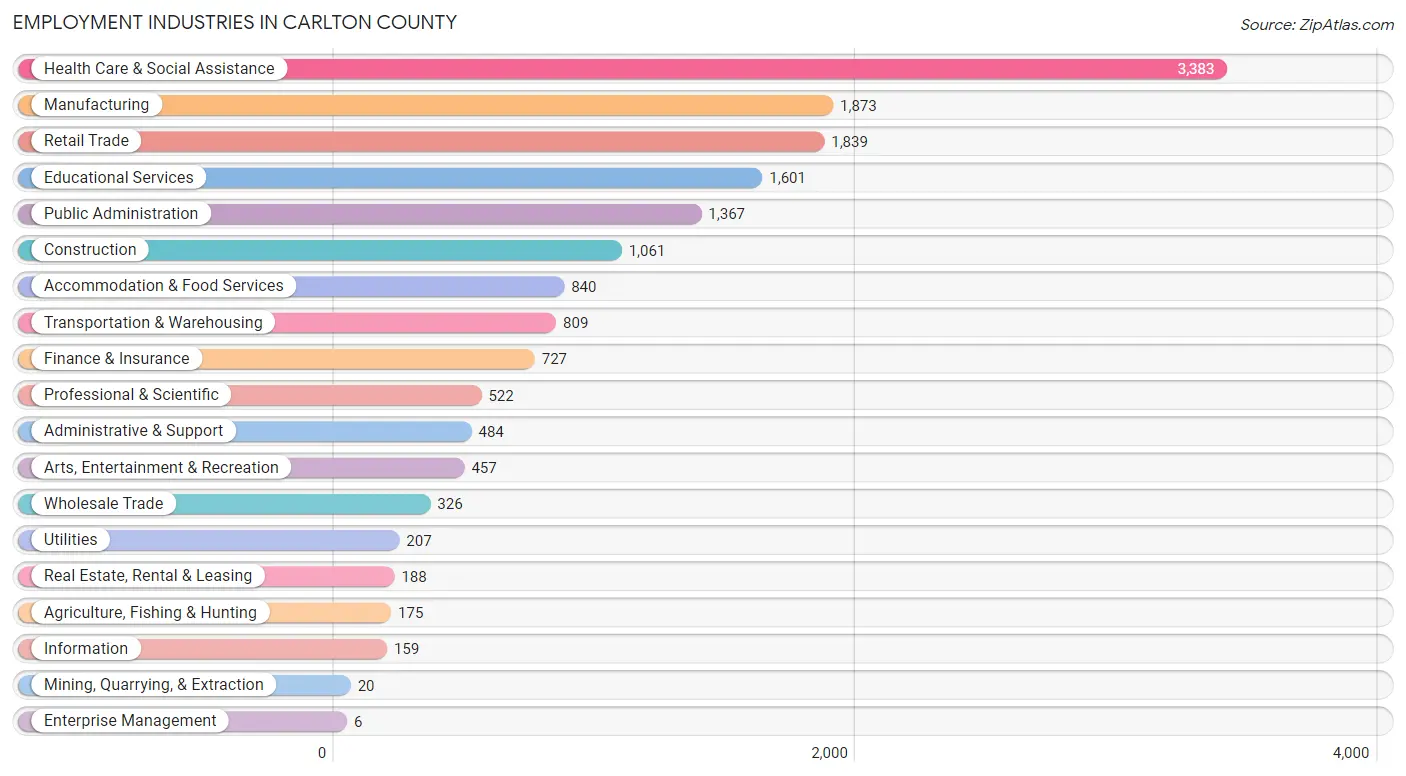
Employment Industries in Carlton County
The major employment industries in Carlton County include Health Care & Social Assistance (3,383 | 20.3%), Manufacturing (1,873 | 11.2%), Retail Trade (1,839 | 11.0%), Educational Services (1,601 | 9.6%), and Public Administration (1,367 | 8.2%).
Employment Industries by Sex in Carlton County
The Carlton County industries that see more men than women are Construction (90.0%), Utilities (89.9%), and Mining, Quarrying, & Extraction (85.0%), whereas the industries that tend to have a higher number of women are Health Care & Social Assistance (80.7%), Educational Services (69.0%), and Enterprise Management (66.7%).
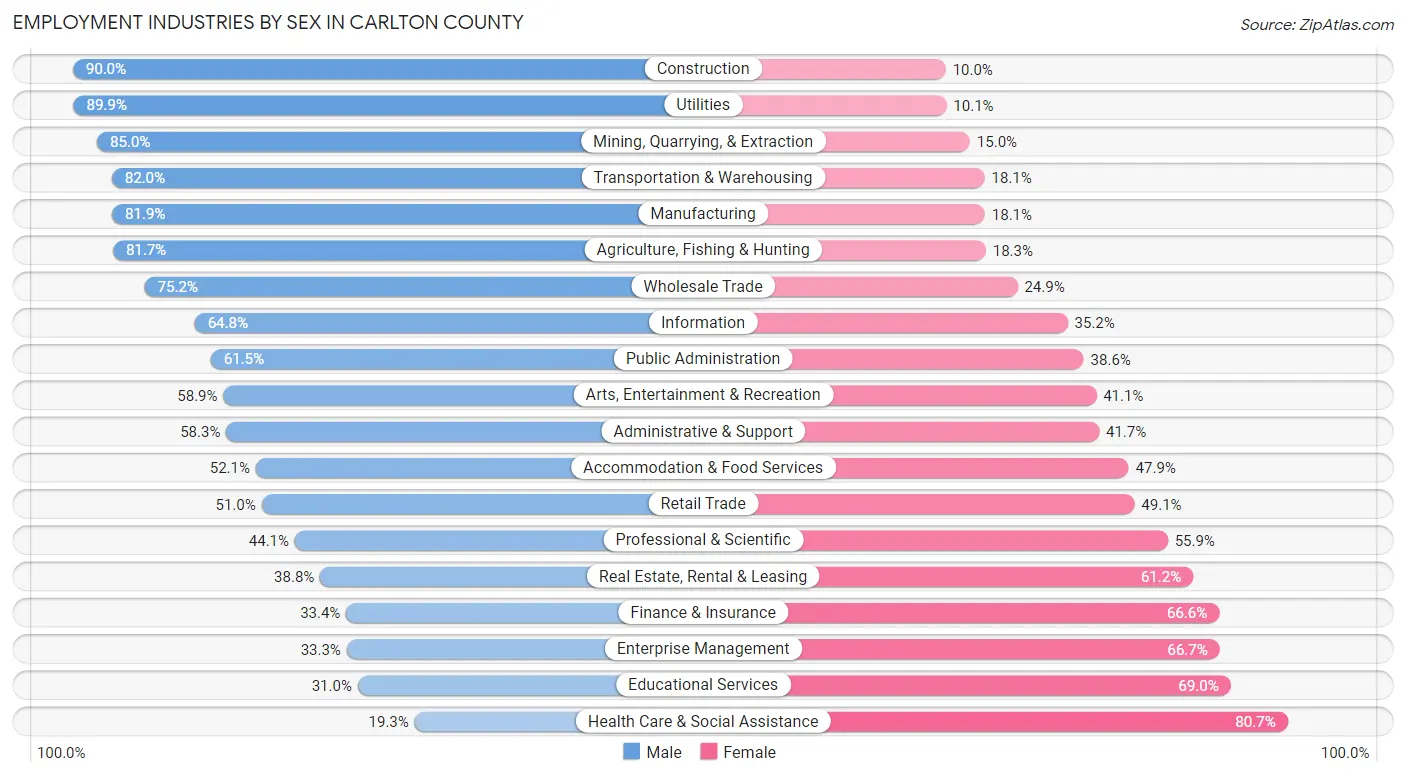
| Industry | Male | Female |
| Agriculture, Fishing & Hunting | 143 (81.7%) | 32 (18.3%) |
| Mining, Quarrying, & Extraction | 17 (85.0%) | 3 (15.0%) |
| Construction | 955 (90.0%) | 106 (10.0%) |
| Manufacturing | 1,534 (81.9%) | 339 (18.1%) |
| Wholesale Trade | 245 (75.1%) | 81 (24.8%) |
| Retail Trade | 937 (50.9%) | 902 (49.0%) |
| Transportation & Warehousing | 663 (82.0%) | 146 (18.0%) |
| Utilities | 186 (89.9%) | 21 (10.1%) |
| Information | 103 (64.8%) | 56 (35.2%) |
| Finance & Insurance | 243 (33.4%) | 484 (66.6%) |
| Real Estate, Rental & Leasing | 73 (38.8%) | 115 (61.2%) |
| Professional & Scientific | 230 (44.1%) | 292 (55.9%) |
| Enterprise Management | 2 (33.3%) | 4 (66.7%) |
| Administrative & Support | 282 (58.3%) | 202 (41.7%) |
| Educational Services | 497 (31.0%) | 1,104 (69.0%) |
| Health Care & Social Assistance | 652 (19.3%) | 2,731 (80.7%) |
| Arts, Entertainment & Recreation | 269 (58.9%) | 188 (41.1%) |
| Accommodation & Food Services | 438 (52.1%) | 402 (47.9%) |
| Public Administration | 840 (61.5%) | 527 (38.6%) |
| Total | 8,620 (51.6%) | 8,081 (48.4%) |
Education in Carlton County
School Enrollment in Carlton County
The most common levels of schooling among the 8,229 students in Carlton County are high school (2,097 | 25.5%), middle school (1,969 | 23.9%), and elementary school (1,636 | 19.9%).
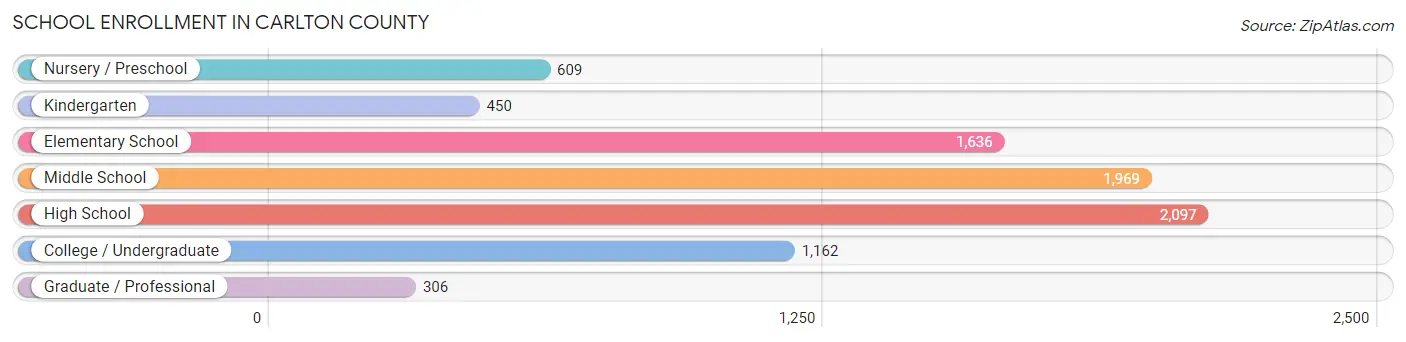
| School Level | # Students | % Students |
| Nursery / Preschool | 609 | 7.4% |
| Kindergarten | 450 | 5.5% |
| Elementary School | 1,636 | 19.9% |
| Middle School | 1,969 | 23.9% |
| High School | 2,097 | 25.5% |
| College / Undergraduate | 1,162 | 14.1% |
| Graduate / Professional | 306 | 3.7% |
| Total | 8,229 | 100.0% |
School Enrollment by Age by Funding Source in Carlton County
Out of a total of 8,229 students who are enrolled in schools in Carlton County, 856 (10.4%) attend a private institution, while the remaining 7,373 (89.6%) are enrolled in public schools. The age group of 35 years and over has the highest likelihood of being enrolled in private schools, with 259 (39.5% in the age bracket) enrolled. Conversely, the age group of 15 to 17 year olds has the lowest likelihood of being enrolled in a private school, with 1,411 (96.3% in the age bracket) attending a public institution.
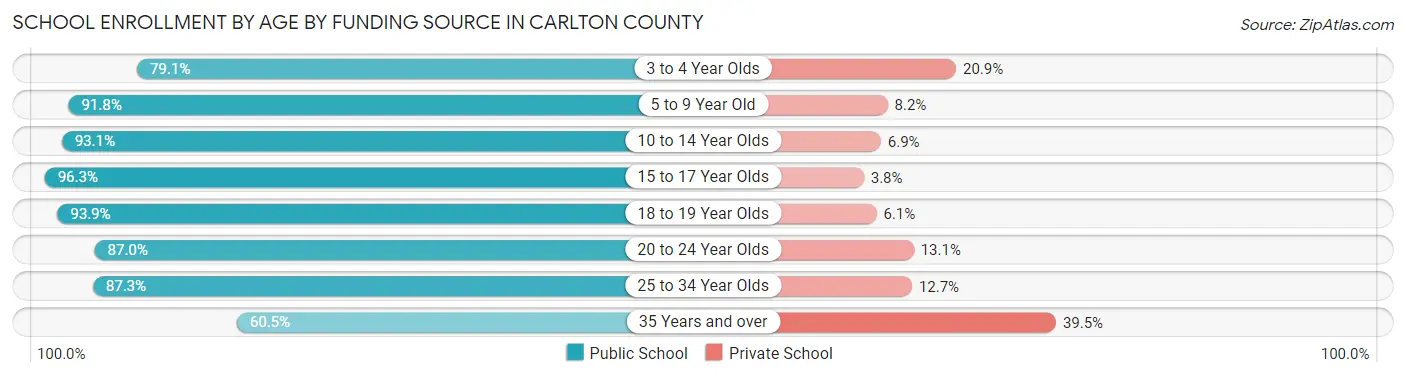
| Age Bracket | Public School | Private School |
| 3 to 4 Year Olds | 287 (79.1%) | 76 (20.9%) |
| 5 to 9 Year Old | 1,909 (91.8%) | 170 (8.2%) |
| 10 to 14 Year Olds | 2,247 (93.1%) | 167 (6.9%) |
| 15 to 17 Year Olds | 1,411 (96.3%) | 55 (3.7%) |
| 18 to 19 Year Olds | 507 (93.9%) | 33 (6.1%) |
| 20 to 24 Year Olds | 373 (87.0%) | 56 (13.1%) |
| 25 to 34 Year Olds | 247 (87.3%) | 36 (12.7%) |
| 35 Years and over | 396 (60.5%) | 259 (39.5%) |
| Total | 7,373 (89.6%) | 856 (10.4%) |
Educational Attainment by Field of Study in Carlton County
Education (1,493 | 20.8%), business (1,258 | 17.5%), science & technology (967 | 13.5%), arts & humanities (660 | 9.2%), and bio, nature & agricultural (507 | 7.0%) are the most common fields of study among 7,188 individuals in Carlton County who have obtained a bachelor's degree or higher.
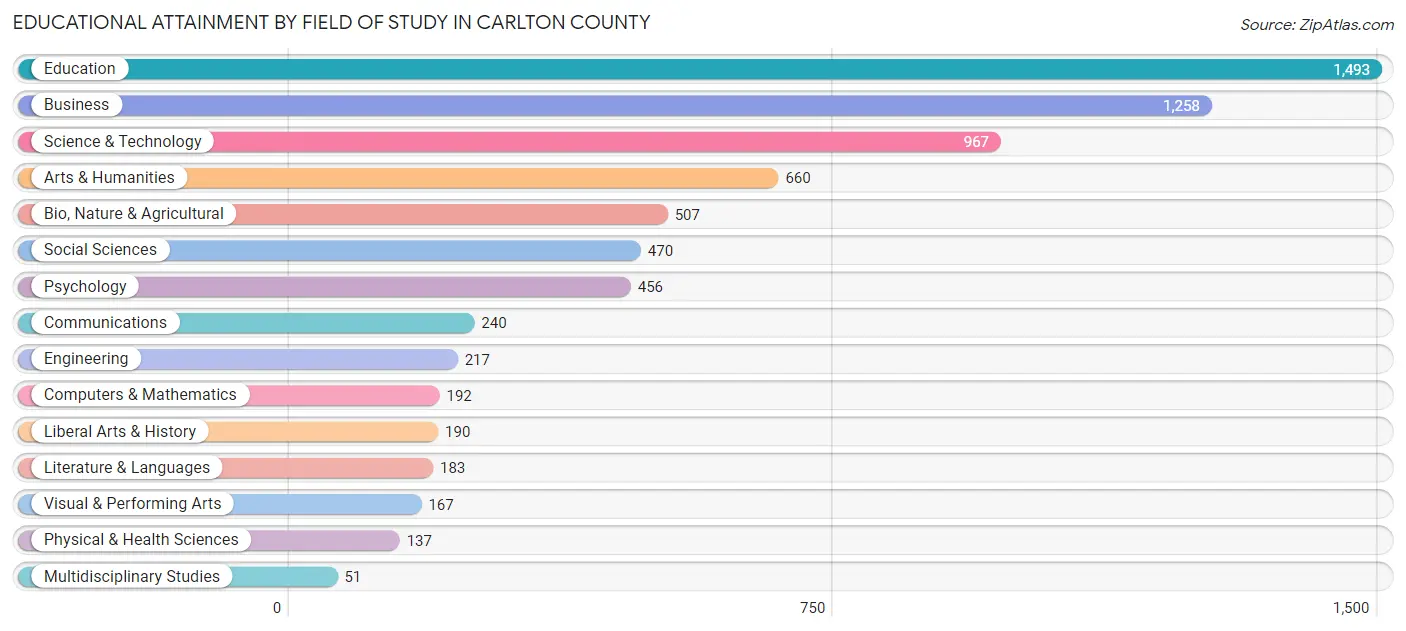
| Field of Study | # Graduates | % Graduates |
| Computers & Mathematics | 192 | 2.7% |
| Bio, Nature & Agricultural | 507 | 7.0% |
| Physical & Health Sciences | 137 | 1.9% |
| Psychology | 456 | 6.3% |
| Social Sciences | 470 | 6.5% |
| Engineering | 217 | 3.0% |
| Multidisciplinary Studies | 51 | 0.7% |
| Science & Technology | 967 | 13.5% |
| Business | 1,258 | 17.5% |
| Education | 1,493 | 20.8% |
| Literature & Languages | 183 | 2.5% |
| Liberal Arts & History | 190 | 2.6% |
| Visual & Performing Arts | 167 | 2.3% |
| Communications | 240 | 3.3% |
| Arts & Humanities | 660 | 9.2% |
| Total | 7,188 | 100.0% |
Transportation & Commute in Carlton County
Vehicle Availability by Sex in Carlton County
The most prevalent vehicle ownership categories in Carlton County are males with 2 vehicles (3,527, accounting for 43.0%) and females with 2 vehicles (3,274, making up 44.7%).
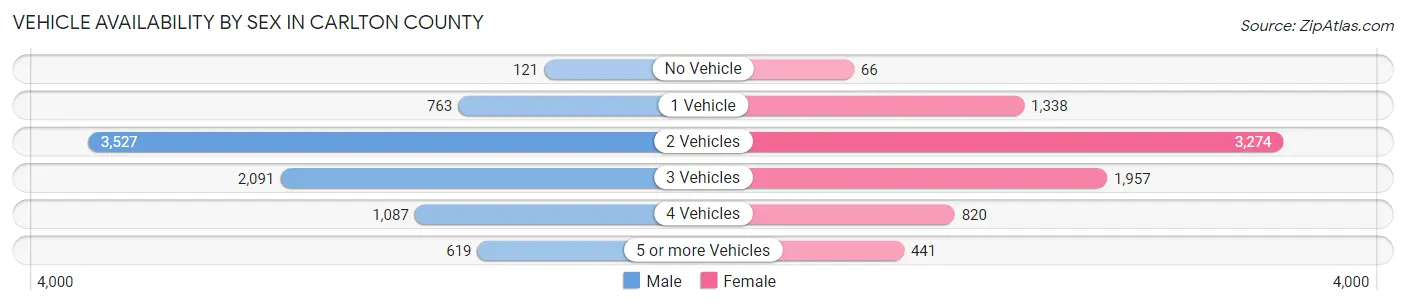
| Vehicles Available | Male | Female |
| No Vehicle | 121 (1.5%) | 66 (0.8%) |
| 1 Vehicle | 763 (9.3%) | 1,338 (17.0%) |
| 2 Vehicles | 3,527 (43.0%) | 3,274 (41.5%) |
| 3 Vehicles | 2,091 (25.5%) | 1,957 (24.8%) |
| 4 Vehicles | 1,087 (13.2%) | 820 (10.4%) |
| 5 or more Vehicles | 619 (7.5%) | 441 (5.6%) |
| Total | 8,208 (100.0%) | 7,896 (100.0%) |
Commute Time in Carlton County
The most frequently occuring commute durations in Carlton County are 5 to 9 minutes (2,734 commuters, 17.9%), 30 to 34 minutes (2,310 commuters, 15.1%), and 10 to 14 minutes (2,053 commuters, 13.4%).
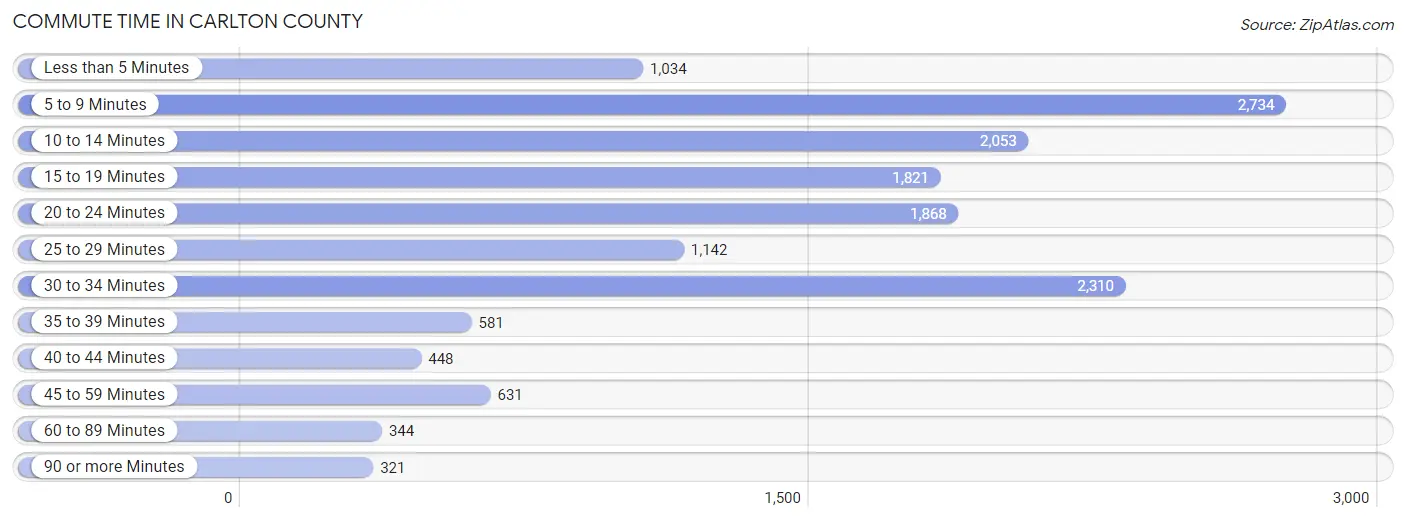
| Commute Time | # Commuters | % Commuters |
| Less than 5 Minutes | 1,034 | 6.8% |
| 5 to 9 Minutes | 2,734 | 17.9% |
| 10 to 14 Minutes | 2,053 | 13.4% |
| 15 to 19 Minutes | 1,821 | 11.9% |
| 20 to 24 Minutes | 1,868 | 12.2% |
| 25 to 29 Minutes | 1,142 | 7.5% |
| 30 to 34 Minutes | 2,310 | 15.1% |
| 35 to 39 Minutes | 581 | 3.8% |
| 40 to 44 Minutes | 448 | 2.9% |
| 45 to 59 Minutes | 631 | 4.1% |
| 60 to 89 Minutes | 344 | 2.2% |
| 90 or more Minutes | 321 | 2.1% |
Commute Time by Sex in Carlton County
The most common commute times in Carlton County are 5 to 9 minutes (1,435 commuters, 17.9%) for males and 5 to 9 minutes (1,299 commuters, 17.8%) for females.
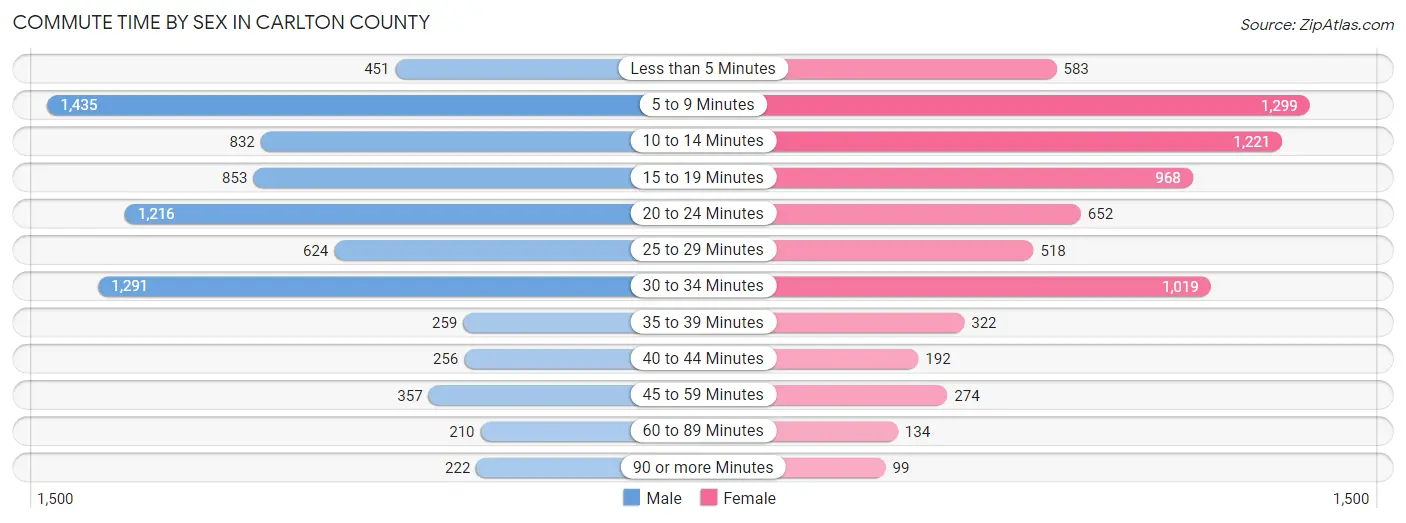
| Commute Time | Male | Female |
| Less than 5 Minutes | 451 (5.6%) | 583 (8.0%) |
| 5 to 9 Minutes | 1,435 (17.9%) | 1,299 (17.8%) |
| 10 to 14 Minutes | 832 (10.4%) | 1,221 (16.8%) |
| 15 to 19 Minutes | 853 (10.6%) | 968 (13.3%) |
| 20 to 24 Minutes | 1,216 (15.2%) | 652 (8.9%) |
| 25 to 29 Minutes | 624 (7.8%) | 518 (7.1%) |
| 30 to 34 Minutes | 1,291 (16.1%) | 1,019 (14.0%) |
| 35 to 39 Minutes | 259 (3.2%) | 322 (4.4%) |
| 40 to 44 Minutes | 256 (3.2%) | 192 (2.6%) |
| 45 to 59 Minutes | 357 (4.5%) | 274 (3.8%) |
| 60 to 89 Minutes | 210 (2.6%) | 134 (1.8%) |
| 90 or more Minutes | 222 (2.8%) | 99 (1.4%) |
Time of Departure to Work by Sex in Carlton County
The most frequent times of departure to work in Carlton County are 6:00 AM to 6:29 AM (1,172, 14.6%) for males and 7:00 AM to 7:29 AM (1,281, 17.6%) for females.
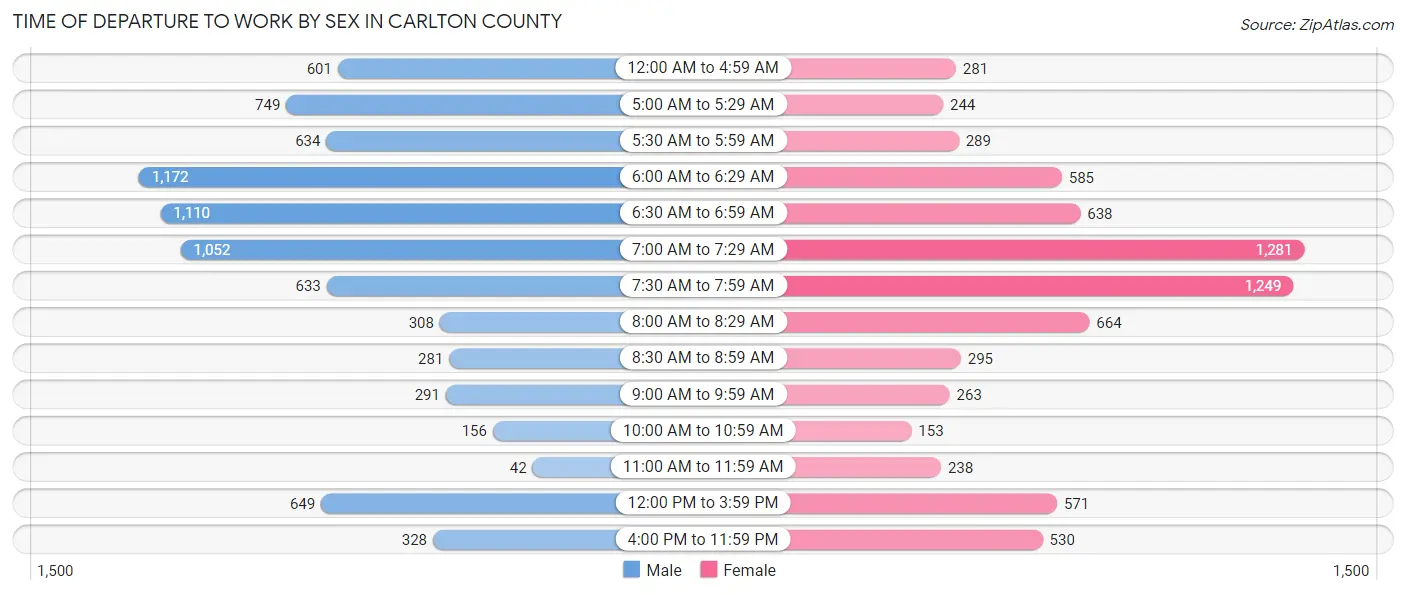
| Time of Departure | Male | Female |
| 12:00 AM to 4:59 AM | 601 (7.5%) | 281 (3.9%) |
| 5:00 AM to 5:29 AM | 749 (9.4%) | 244 (3.4%) |
| 5:30 AM to 5:59 AM | 634 (7.9%) | 289 (4.0%) |
| 6:00 AM to 6:29 AM | 1,172 (14.6%) | 585 (8.0%) |
| 6:30 AM to 6:59 AM | 1,110 (13.9%) | 638 (8.8%) |
| 7:00 AM to 7:29 AM | 1,052 (13.1%) | 1,281 (17.6%) |
| 7:30 AM to 7:59 AM | 633 (7.9%) | 1,249 (17.2%) |
| 8:00 AM to 8:29 AM | 308 (3.8%) | 664 (9.1%) |
| 8:30 AM to 8:59 AM | 281 (3.5%) | 295 (4.1%) |
| 9:00 AM to 9:59 AM | 291 (3.6%) | 263 (3.6%) |
| 10:00 AM to 10:59 AM | 156 (1.9%) | 153 (2.1%) |
| 11:00 AM to 11:59 AM | 42 (0.5%) | 238 (3.3%) |
| 12:00 PM to 3:59 PM | 649 (8.1%) | 571 (7.8%) |
| 4:00 PM to 11:59 PM | 328 (4.1%) | 530 (7.3%) |
| Total | 8,006 (100.0%) | 7,281 (100.0%) |
Housing Occupancy in Carlton County
Occupancy by Ownership in Carlton County
Of the total 13,795 dwellings in Carlton County, owner-occupied units account for 10,979 (79.6%), while renter-occupied units make up 2,816 (20.4%).
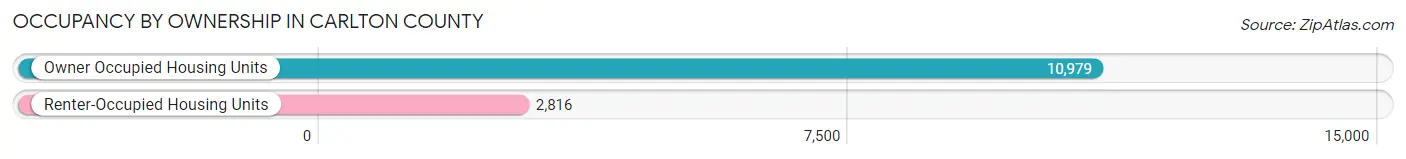
| Occupancy | # Housing Units | % Housing Units |
| Owner Occupied Housing Units | 10,979 | 79.6% |
| Renter-Occupied Housing Units | 2,816 | 20.4% |
| Total Occupied Housing Units | 13,795 | 100.0% |
Occupancy by Household Size in Carlton County
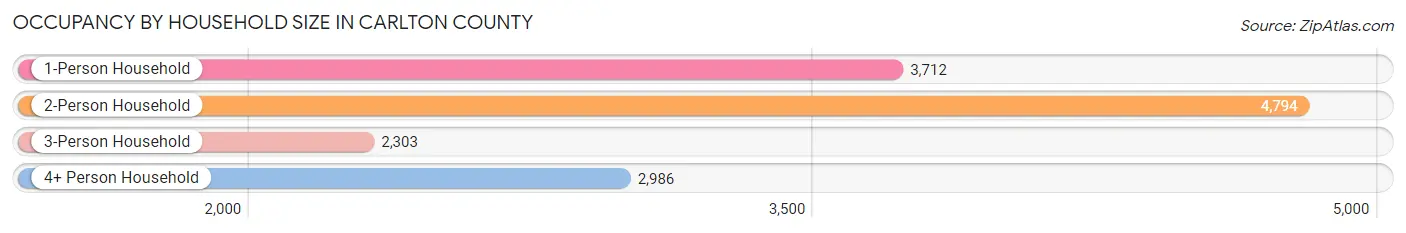
| Household Size | # Housing Units | % Housing Units |
| 1-Person Household | 3,712 | 26.9% |
| 2-Person Household | 4,794 | 34.7% |
| 3-Person Household | 2,303 | 16.7% |
| 4+ Person Household | 2,986 | 21.6% |
| Total Housing Units | 13,795 | 100.0% |
Occupancy by Ownership by Household Size in Carlton County
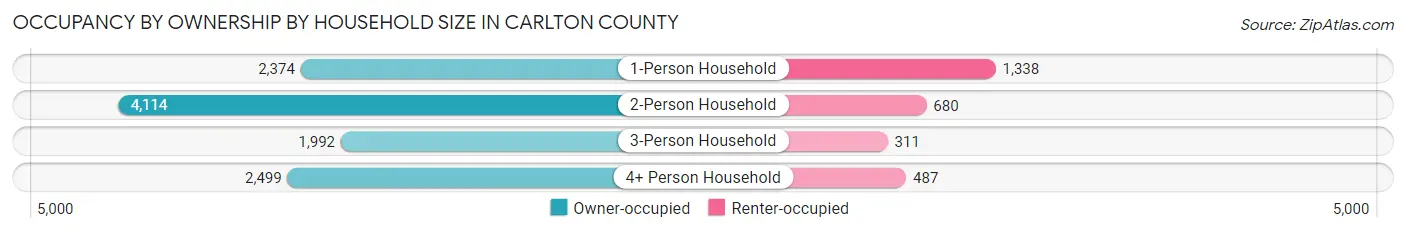
| Household Size | Owner-occupied | Renter-occupied |
| 1-Person Household | 2,374 (63.9%) | 1,338 (36.0%) |
| 2-Person Household | 4,114 (85.8%) | 680 (14.2%) |
| 3-Person Household | 1,992 (86.5%) | 311 (13.5%) |
| 4+ Person Household | 2,499 (83.7%) | 487 (16.3%) |
| Total Housing Units | 10,979 (79.6%) | 2,816 (20.4%) |
Occupancy by Educational Attainment in Carlton County
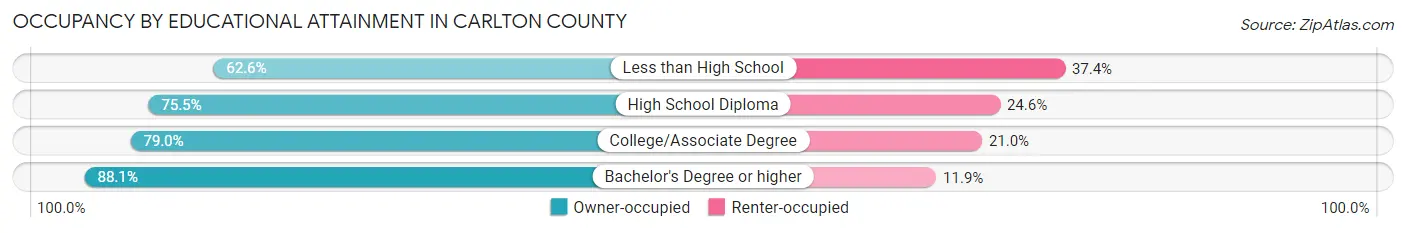
| Household Size | Owner-occupied | Renter-occupied |
| Less than High School | 458 (62.6%) | 274 (37.4%) |
| High School Diploma | 2,837 (75.4%) | 923 (24.5%) |
| College/Associate Degree | 4,462 (79.0%) | 1,184 (21.0%) |
| Bachelor's Degree or higher | 3,222 (88.1%) | 435 (11.9%) |
Occupancy by Age of Householder in Carlton County
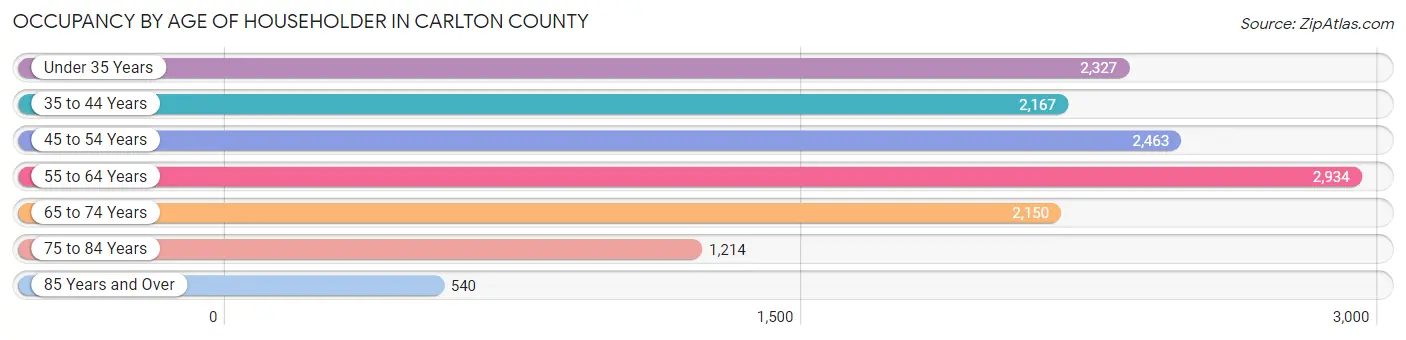
| Age Bracket | # Households | % Households |
| Under 35 Years | 2,327 | 16.9% |
| 35 to 44 Years | 2,167 | 15.7% |
| 45 to 54 Years | 2,463 | 17.8% |
| 55 to 64 Years | 2,934 | 21.3% |
| 65 to 74 Years | 2,150 | 15.6% |
| 75 to 84 Years | 1,214 | 8.8% |
| 85 Years and Over | 540 | 3.9% |
| Total | 13,795 | 100.0% |
Housing Finances in Carlton County
Median Income by Occupancy in Carlton County
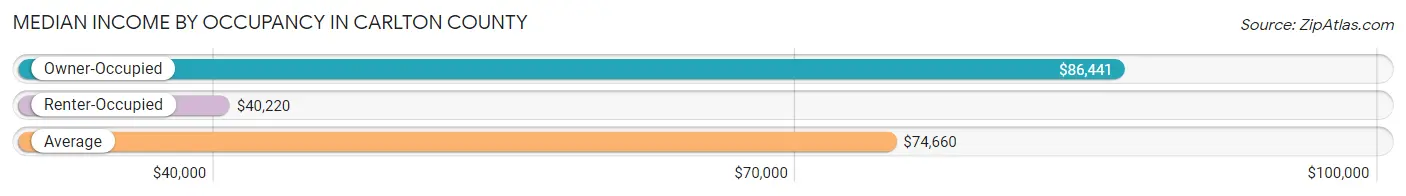
| Occupancy Type | # Households | Median Income |
| Owner-Occupied | 10,979 (79.6%) | $86,441 |
| Renter-Occupied | 2,816 (20.4%) | $40,220 |
| Average | 13,795 (100.0%) | $74,660 |
Occupancy by Householder Income Bracket in Carlton County
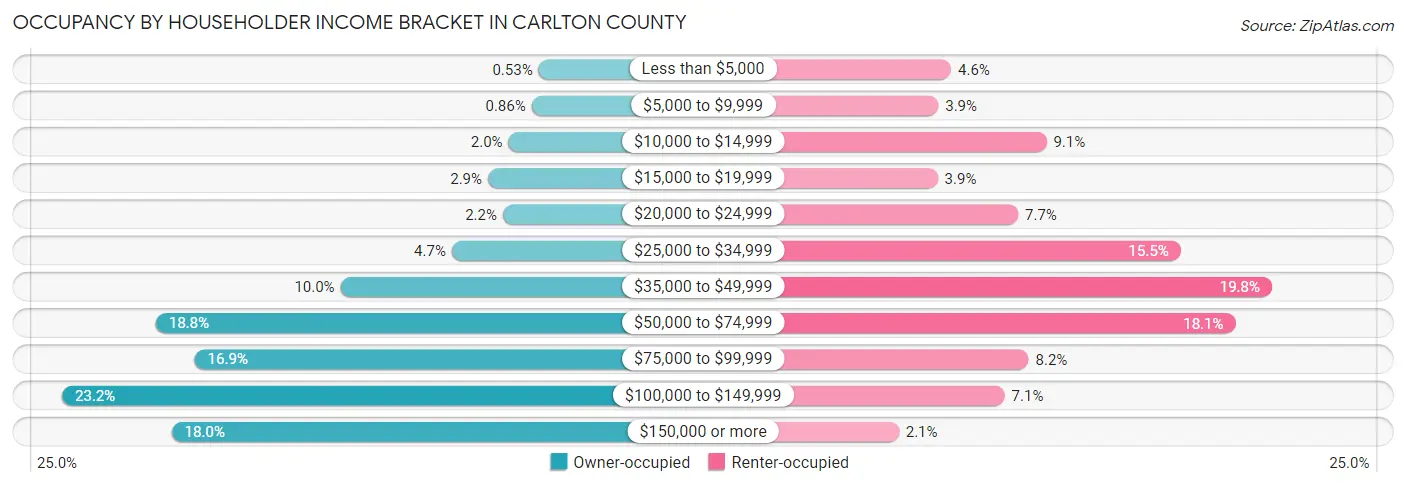
| Income Bracket | Owner-occupied | Renter-occupied |
| Less than $5,000 | 58 (0.5%) | 128 (4.5%) |
| $5,000 to $9,999 | 94 (0.9%) | 111 (3.9%) |
| $10,000 to $14,999 | 215 (2.0%) | 256 (9.1%) |
| $15,000 to $19,999 | 323 (2.9%) | 110 (3.9%) |
| $20,000 to $24,999 | 245 (2.2%) | 218 (7.7%) |
| $25,000 to $34,999 | 512 (4.7%) | 436 (15.5%) |
| $35,000 to $49,999 | 1,093 (10.0%) | 558 (19.8%) |
| $50,000 to $74,999 | 2,059 (18.8%) | 509 (18.1%) |
| $75,000 to $99,999 | 1,855 (16.9%) | 232 (8.2%) |
| $100,000 to $149,999 | 2,549 (23.2%) | 200 (7.1%) |
| $150,000 or more | 1,976 (18.0%) | 58 (2.1%) |
| Total | 10,979 (100.0%) | 2,816 (100.0%) |
Monthly Housing Cost Tiers in Carlton County
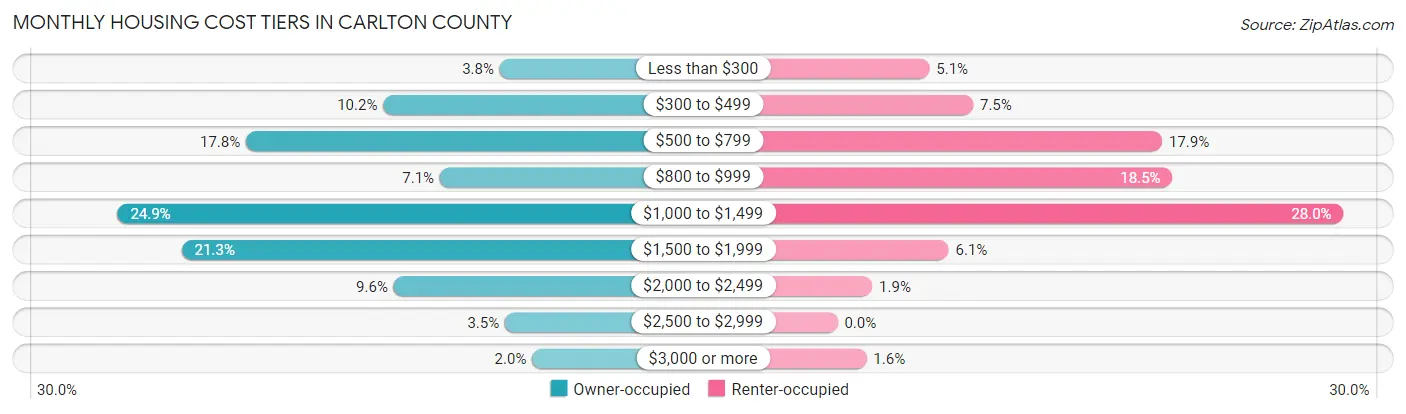
| Monthly Cost | Owner-occupied | Renter-occupied |
| Less than $300 | 412 (3.7%) | 143 (5.1%) |
| $300 to $499 | 1,119 (10.2%) | 211 (7.5%) |
| $500 to $799 | 1,951 (17.8%) | 505 (17.9%) |
| $800 to $999 | 775 (7.1%) | 521 (18.5%) |
| $1,000 to $1,499 | 2,730 (24.9%) | 787 (28.0%) |
| $1,500 to $1,999 | 2,342 (21.3%) | 173 (6.1%) |
| $2,000 to $2,499 | 1,055 (9.6%) | 54 (1.9%) |
| $2,500 to $2,999 | 380 (3.5%) | 0 (0.0%) |
| $3,000 or more | 215 (2.0%) | 45 (1.6%) |
| Total | 10,979 (100.0%) | 2,816 (100.0%) |
Physical Housing Characteristics in Carlton County
Housing Structures in Carlton County
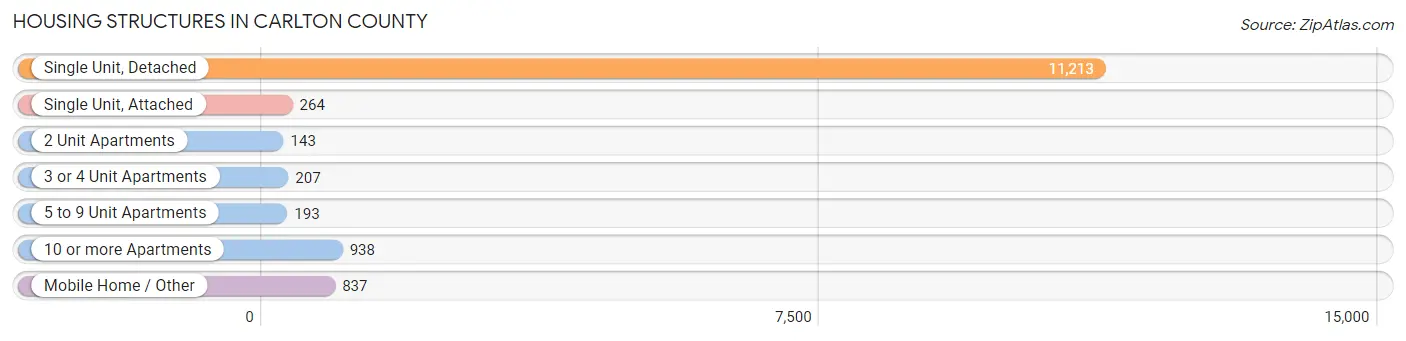
| Structure Type | # Housing Units | % Housing Units |
| Single Unit, Detached | 11,213 | 81.3% |
| Single Unit, Attached | 264 | 1.9% |
| 2 Unit Apartments | 143 | 1.0% |
| 3 or 4 Unit Apartments | 207 | 1.5% |
| 5 to 9 Unit Apartments | 193 | 1.4% |
| 10 or more Apartments | 938 | 6.8% |
| Mobile Home / Other | 837 | 6.1% |
| Total | 13,795 | 100.0% |
Housing Structures by Occupancy in Carlton County
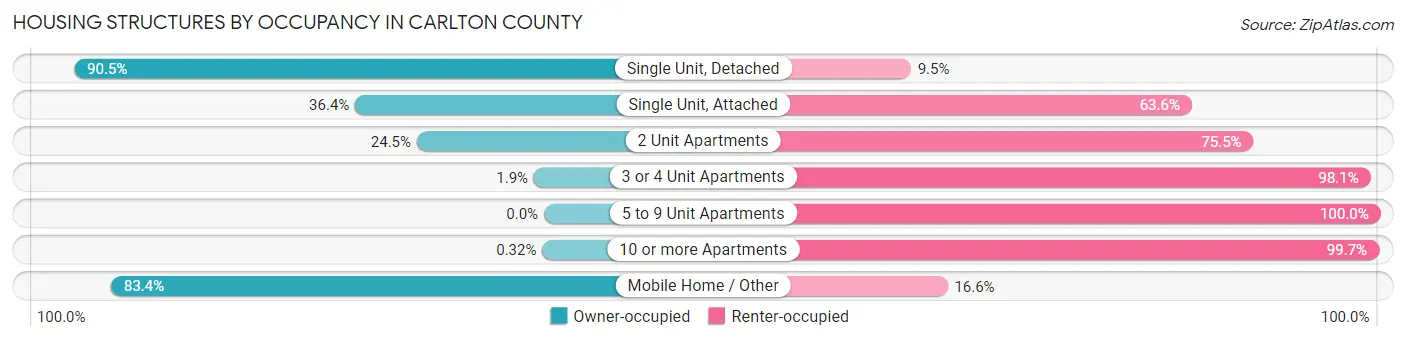
| Structure Type | Owner-occupied | Renter-occupied |
| Single Unit, Detached | 10,143 (90.5%) | 1,070 (9.5%) |
| Single Unit, Attached | 96 (36.4%) | 168 (63.6%) |
| 2 Unit Apartments | 35 (24.5%) | 108 (75.5%) |
| 3 or 4 Unit Apartments | 4 (1.9%) | 203 (98.1%) |
| 5 to 9 Unit Apartments | 0 (0.0%) | 193 (100.0%) |
| 10 or more Apartments | 3 (0.3%) | 935 (99.7%) |
| Mobile Home / Other | 698 (83.4%) | 139 (16.6%) |
| Total | 10,979 (79.6%) | 2,816 (20.4%) |
Housing Structures by Number of Rooms in Carlton County
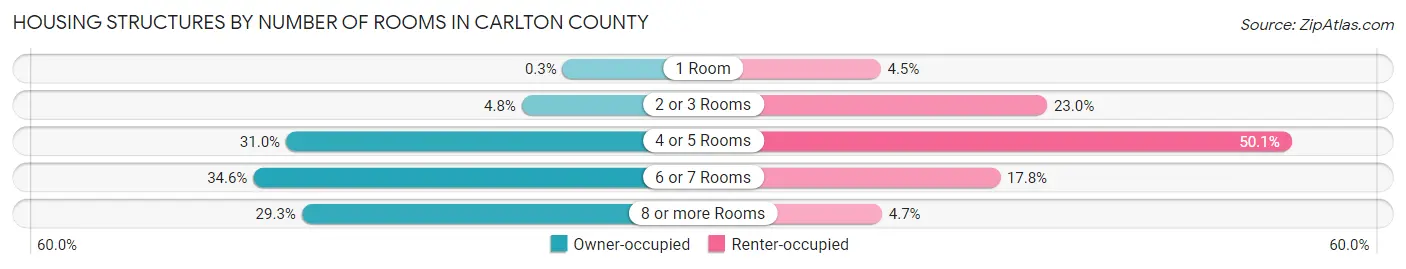
| Number of Rooms | Owner-occupied | Renter-occupied |
| 1 Room | 33 (0.3%) | 127 (4.5%) |
| 2 or 3 Rooms | 530 (4.8%) | 647 (23.0%) |
| 4 or 5 Rooms | 3,403 (31.0%) | 1,411 (50.1%) |
| 6 or 7 Rooms | 3,802 (34.6%) | 500 (17.8%) |
| 8 or more Rooms | 3,211 (29.2%) | 131 (4.6%) |
| Total | 10,979 (100.0%) | 2,816 (100.0%) |
Housing Structure by Heating Type in Carlton County
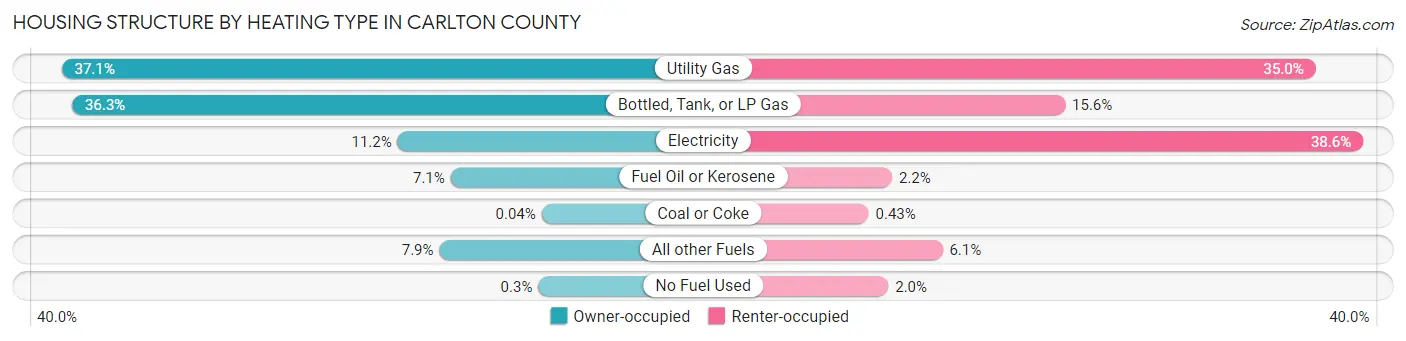
| Heating Type | Owner-occupied | Renter-occupied |
| Utility Gas | 4,078 (37.1%) | 985 (35.0%) |
| Bottled, Tank, or LP Gas | 3,990 (36.3%) | 440 (15.6%) |
| Electricity | 1,226 (11.2%) | 1,088 (38.6%) |
| Fuel Oil or Kerosene | 776 (7.1%) | 63 (2.2%) |
| Coal or Coke | 4 (0.0%) | 12 (0.4%) |
| All other Fuels | 872 (7.9%) | 173 (6.1%) |
| No Fuel Used | 33 (0.3%) | 55 (1.9%) |
| Total | 10,979 (100.0%) | 2,816 (100.0%) |
Household Vehicle Usage in Carlton County
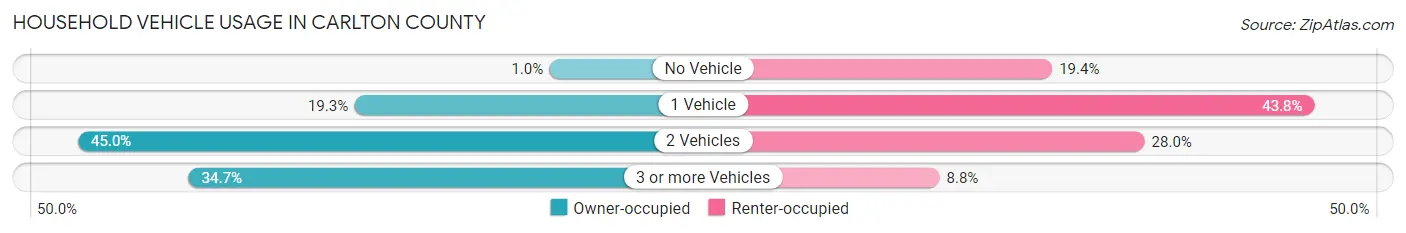
| Vehicles per Household | Owner-occupied | Renter-occupied |
| No Vehicle | 114 (1.0%) | 545 (19.4%) |
| 1 Vehicle | 2,114 (19.3%) | 1,234 (43.8%) |
| 2 Vehicles | 4,943 (45.0%) | 788 (28.0%) |
| 3 or more Vehicles | 3,808 (34.7%) | 249 (8.8%) |
| Total | 10,979 (100.0%) | 2,816 (100.0%) |
Real Estate & Mortgages in Carlton County
Real Estate and Mortgage Overview in Carlton County
| Characteristic | Without Mortgage | With Mortgage |
| Housing Units | 3,807 | 7,172 |
| Median Property Value | $198,200 | $227,000 |
| Median Household Income | $62,800 | $1,621 |
| Monthly Housing Costs | $557 | $210 |
| Real Estate Taxes | $2,402 | $134 |
Property Value by Mortgage Status in Carlton County
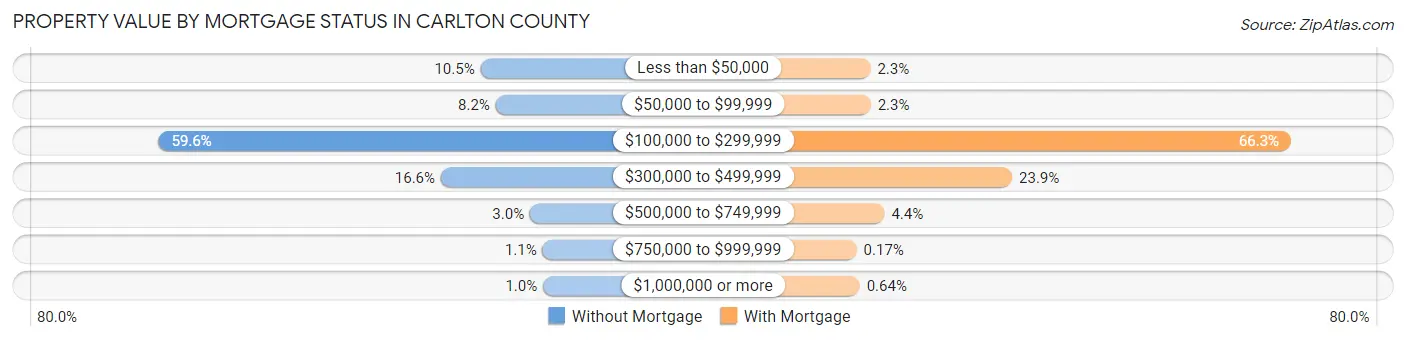
| Property Value | Without Mortgage | With Mortgage |
| Less than $50,000 | 401 (10.5%) | 163 (2.3%) |
| $50,000 to $99,999 | 313 (8.2%) | 166 (2.3%) |
| $100,000 to $299,999 | 2,269 (59.6%) | 4,758 (66.3%) |
| $300,000 to $499,999 | 631 (16.6%) | 1,711 (23.9%) |
| $500,000 to $749,999 | 114 (3.0%) | 316 (4.4%) |
| $750,000 to $999,999 | 41 (1.1%) | 12 (0.2%) |
| $1,000,000 or more | 38 (1.0%) | 46 (0.6%) |
| Total | 3,807 (100.0%) | 7,172 (100.0%) |
Household Income by Mortgage Status in Carlton County
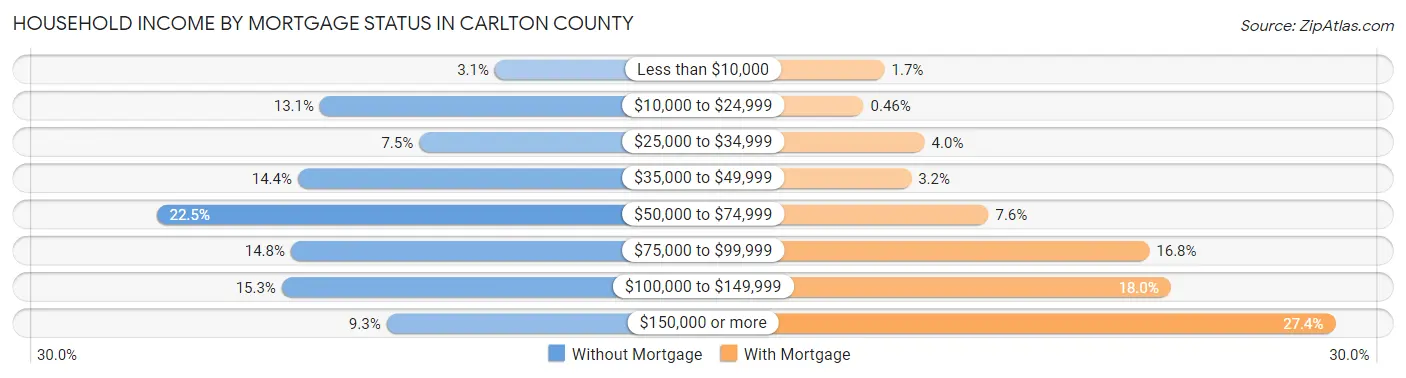
| Household Income | Without Mortgage | With Mortgage |
| Less than $10,000 | 119 (3.1%) | 119 (1.7%) |
| $10,000 to $24,999 | 500 (13.1%) | 33 (0.5%) |
| $25,000 to $34,999 | 284 (7.5%) | 283 (4.0%) |
| $35,000 to $49,999 | 548 (14.4%) | 228 (3.2%) |
| $50,000 to $74,999 | 855 (22.5%) | 545 (7.6%) |
| $75,000 to $99,999 | 563 (14.8%) | 1,204 (16.8%) |
| $100,000 to $149,999 | 583 (15.3%) | 1,292 (18.0%) |
| $150,000 or more | 355 (9.3%) | 1,966 (27.4%) |
| Total | 3,807 (100.0%) | 7,172 (100.0%) |
Property Value to Household Income Ratio in Carlton County
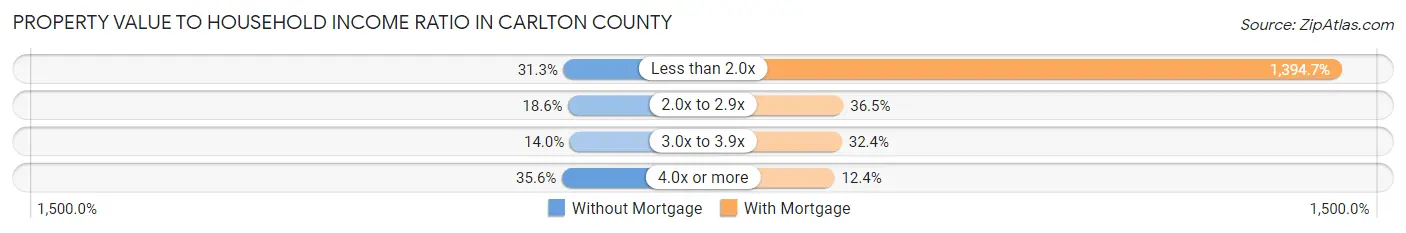
| Value-to-Income Ratio | Without Mortgage | With Mortgage |
| Less than 2.0x | 1,191 (31.3%) | 100,031 (1,394.7%) |
| 2.0x to 2.9x | 708 (18.6%) | 2,618 (36.5%) |
| 3.0x to 3.9x | 533 (14.0%) | 2,320 (32.4%) |
| 4.0x or more | 1,354 (35.6%) | 892 (12.4%) |
| Total | 3,807 (100.0%) | 7,172 (100.0%) |
Real Estate Taxes by Mortgage Status in Carlton County
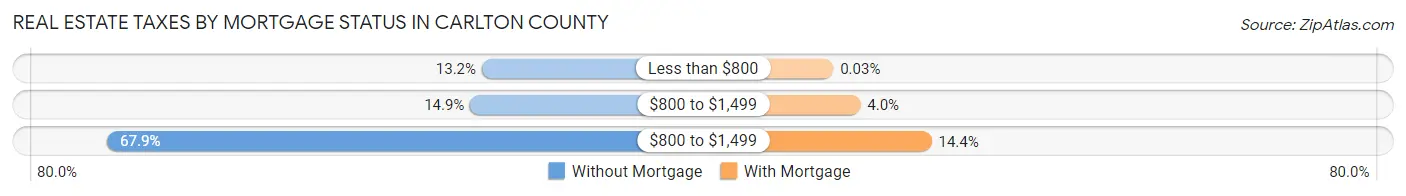
| Property Taxes | Without Mortgage | With Mortgage |
| Less than $800 | 502 (13.2%) | 2 (0.0%) |
| $800 to $1,499 | 567 (14.9%) | 286 (4.0%) |
| $800 to $1,499 | 2,586 (67.9%) | 1,032 (14.4%) |
| Total | 3,807 (100.0%) | 7,172 (100.0%) |
Health & Disability in Carlton County
Health Insurance Coverage by Age in Carlton County
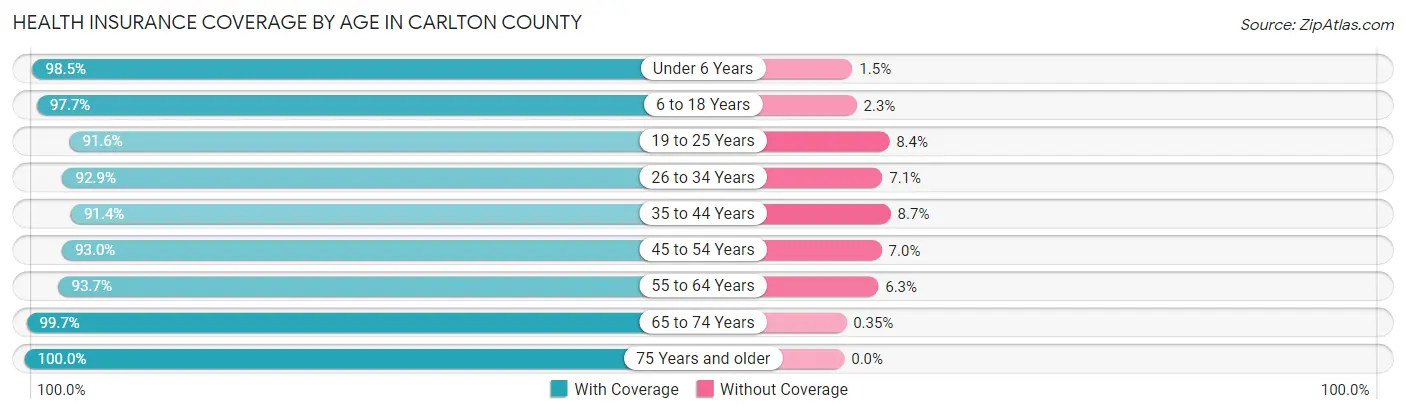
| Age Bracket | With Coverage | Without Coverage |
| Under 6 Years | 2,278 (98.5%) | 35 (1.5%) |
| 6 to 18 Years | 6,042 (97.7%) | 142 (2.3%) |
| 19 to 25 Years | 2,245 (91.6%) | 205 (8.4%) |
| 26 to 34 Years | 3,379 (92.9%) | 258 (7.1%) |
| 35 to 44 Years | 4,002 (91.3%) | 379 (8.6%) |
| 45 to 54 Years | 4,189 (93.0%) | 314 (7.0%) |
| 55 to 64 Years | 4,774 (93.7%) | 323 (6.3%) |
| 65 to 74 Years | 3,674 (99.7%) | 13 (0.4%) |
| 75 Years and older | 2,421 (100.0%) | 0 (0.0%) |
| Total | 33,004 (95.2%) | 1,669 (4.8%) |
Health Insurance Coverage by Citizenship Status in Carlton County
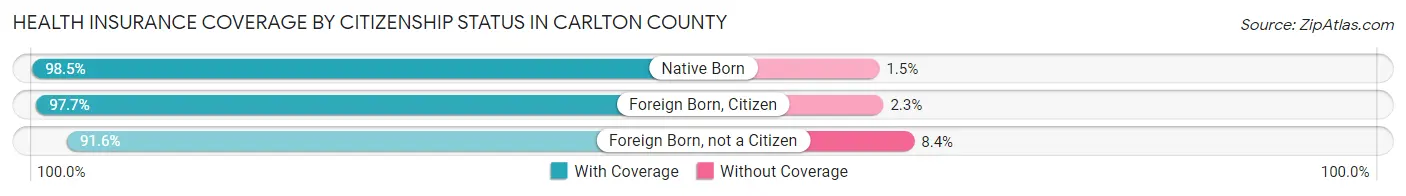
| Citizenship Status | With Coverage | Without Coverage |
| Native Born | 2,278 (98.5%) | 35 (1.5%) |
| Foreign Born, Citizen | 6,042 (97.7%) | 142 (2.3%) |
| Foreign Born, not a Citizen | 2,245 (91.6%) | 205 (8.4%) |
Health Insurance Coverage by Household Income in Carlton County
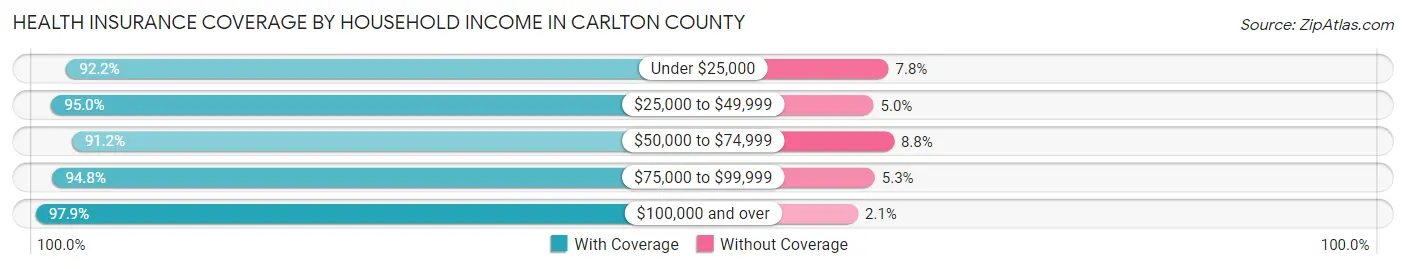
| Household Income | With Coverage | Without Coverage |
| Under $25,000 | 2,672 (92.2%) | 227 (7.8%) |
| $25,000 to $49,999 | 4,900 (95.0%) | 259 (5.0%) |
| $50,000 to $74,999 | 4,764 (91.2%) | 462 (8.8%) |
| $75,000 to $99,999 | 5,219 (94.8%) | 289 (5.2%) |
| $100,000 and over | 14,282 (97.9%) | 310 (2.1%) |
Public vs Private Health Insurance Coverage by Age in Carlton County
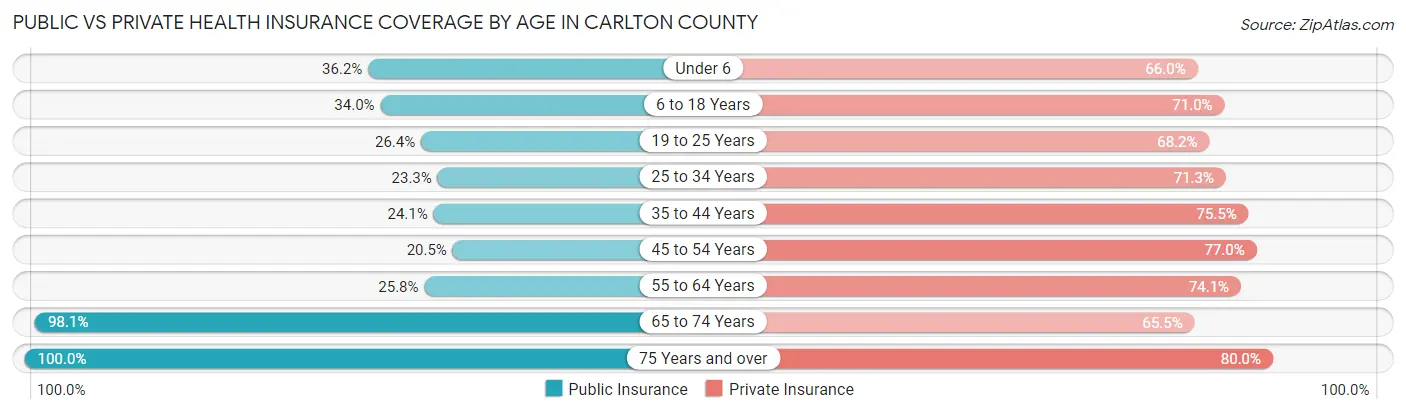
| Age Bracket | Public Insurance | Private Insurance |
| Under 6 | 838 (36.2%) | 1,527 (66.0%) |
| 6 to 18 Years | 2,100 (34.0%) | 4,391 (71.0%) |
| 19 to 25 Years | 647 (26.4%) | 1,671 (68.2%) |
| 25 to 34 Years | 849 (23.3%) | 2,592 (71.3%) |
| 35 to 44 Years | 1,056 (24.1%) | 3,308 (75.5%) |
| 45 to 54 Years | 925 (20.5%) | 3,466 (77.0%) |
| 55 to 64 Years | 1,315 (25.8%) | 3,776 (74.1%) |
| 65 to 74 Years | 3,616 (98.1%) | 2,414 (65.5%) |
| 75 Years and over | 2,421 (100.0%) | 1,937 (80.0%) |
| Total | 13,767 (39.7%) | 25,082 (72.3%) |
Disability Status by Sex by Age in Carlton County
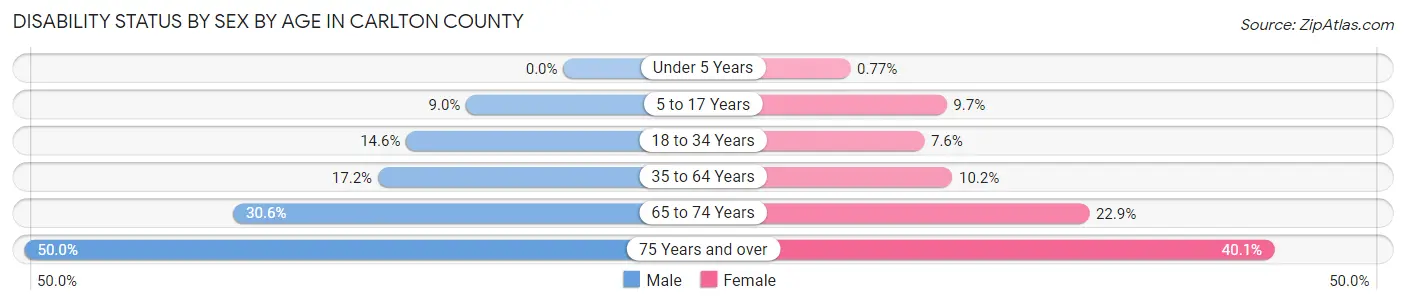
| Age Bracket | Male | Female |
| Under 5 Years | 0 (0.0%) | 7 (0.8%) |
| 5 to 17 Years | 290 (9.0%) | 288 (9.7%) |
| 18 to 34 Years | 516 (14.6%) | 231 (7.6%) |
| 35 to 64 Years | 1,255 (17.2%) | 684 (10.2%) |
| 65 to 74 Years | 562 (30.6%) | 425 (22.9%) |
| 75 Years and over | 511 (50.0%) | 561 (40.1%) |
Disability Class by Sex by Age in Carlton County
Disability Class: Hearing Difficulty
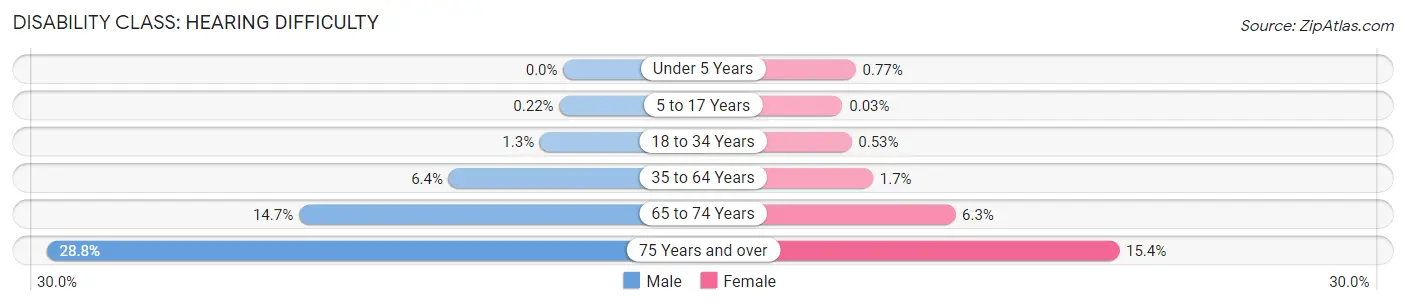
| Age Bracket | Male | Female |
| Under 5 Years | 0 (0.0%) | 7 (0.8%) |
| 5 to 17 Years | 7 (0.2%) | 1 (0.0%) |
| 18 to 34 Years | 46 (1.3%) | 16 (0.5%) |
| 35 to 64 Years | 465 (6.4%) | 116 (1.7%) |
| 65 to 74 Years | 270 (14.7%) | 117 (6.3%) |
| 75 Years and over | 294 (28.8%) | 216 (15.4%) |
Disability Class: Vision Difficulty
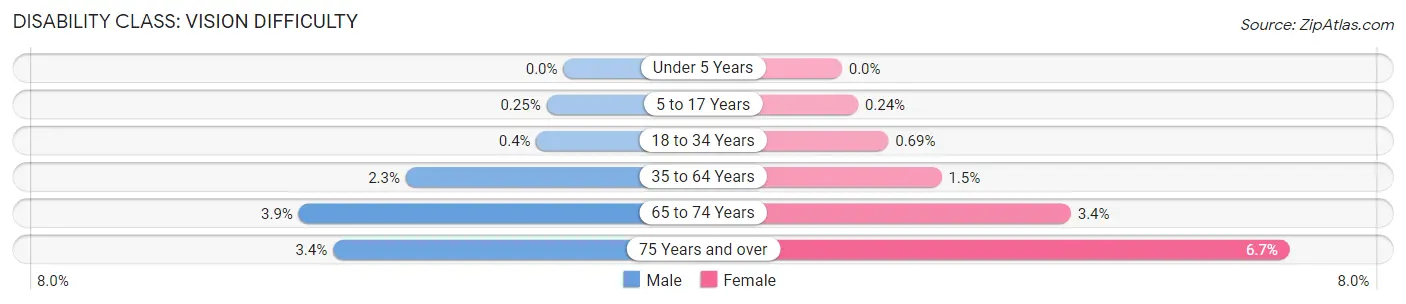
| Age Bracket | Male | Female |
| Under 5 Years | 0 (0.0%) | 0 (0.0%) |
| 5 to 17 Years | 8 (0.3%) | 7 (0.2%) |
| 18 to 34 Years | 14 (0.4%) | 21 (0.7%) |
| 35 to 64 Years | 171 (2.3%) | 99 (1.5%) |
| 65 to 74 Years | 72 (3.9%) | 63 (3.4%) |
| 75 Years and over | 35 (3.4%) | 93 (6.7%) |
Disability Class: Cognitive Difficulty
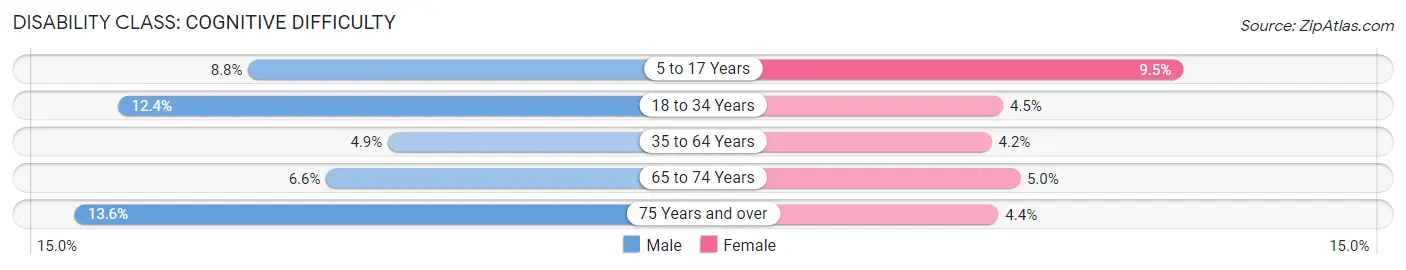
| Age Bracket | Male | Female |
| 5 to 17 Years | 282 (8.8%) | 282 (9.5%) |
| 18 to 34 Years | 438 (12.4%) | 136 (4.5%) |
| 35 to 64 Years | 356 (4.9%) | 279 (4.2%) |
| 65 to 74 Years | 121 (6.6%) | 92 (5.0%) |
| 75 Years and over | 139 (13.6%) | 61 (4.4%) |
Disability Class: Ambulatory Difficulty
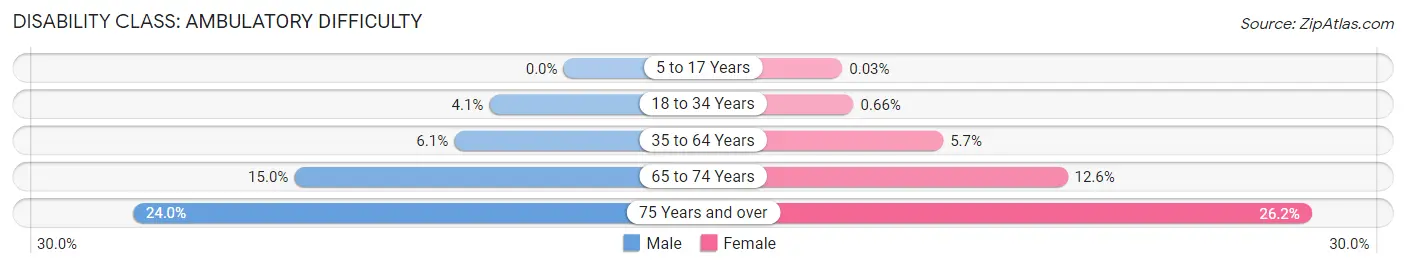
| Age Bracket | Male | Female |
| 5 to 17 Years | 0 (0.0%) | 1 (0.0%) |
| 18 to 34 Years | 146 (4.1%) | 20 (0.7%) |
| 35 to 64 Years | 444 (6.1%) | 378 (5.7%) |
| 65 to 74 Years | 275 (15.0%) | 233 (12.6%) |
| 75 Years and over | 245 (24.0%) | 366 (26.2%) |
Disability Class: Self-Care Difficulty
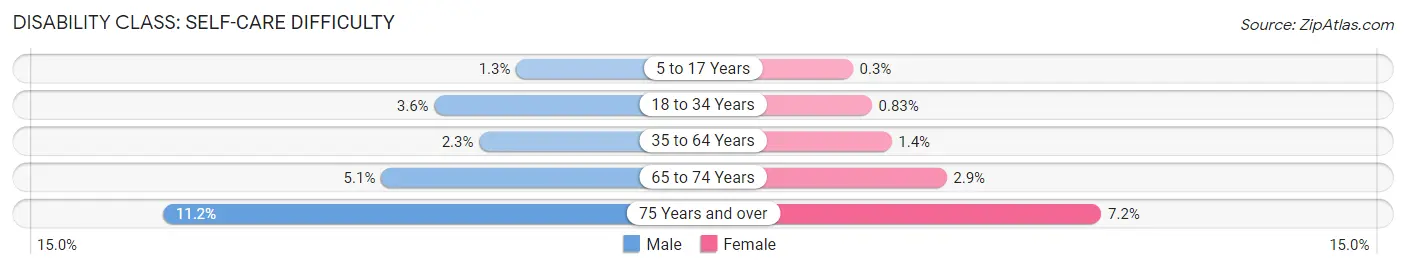
| Age Bracket | Male | Female |
| 5 to 17 Years | 42 (1.3%) | 9 (0.3%) |
| 18 to 34 Years | 127 (3.6%) | 25 (0.8%) |
| 35 to 64 Years | 171 (2.3%) | 92 (1.4%) |
| 65 to 74 Years | 93 (5.1%) | 54 (2.9%) |
| 75 Years and over | 114 (11.2%) | 101 (7.2%) |
Technology Access in Carlton County
Computing Device Access in Carlton County
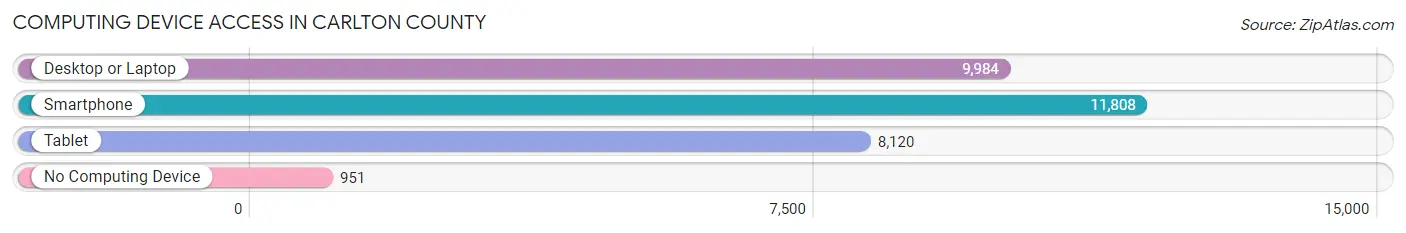
| Device Type | # Households | % Households |
| Desktop or Laptop | 9,984 | 72.4% |
| Smartphone | 11,808 | 85.6% |
| Tablet | 8,120 | 58.9% |
| No Computing Device | 951 | 6.9% |
| Total | 13,795 | 100.0% |
Internet Access in Carlton County
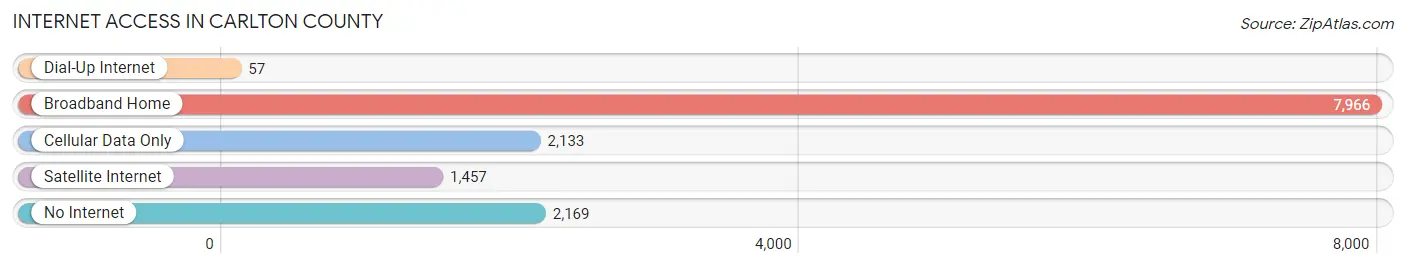
| Internet Type | # Households | % Households |
| Dial-Up Internet | 57 | 0.4% |
| Broadband Home | 7,966 | 57.8% |
| Cellular Data Only | 2,133 | 15.5% |
| Satellite Internet | 1,457 | 10.6% |
| No Internet | 2,169 | 15.7% |
| Total | 13,795 | 100.0% |
Carlton County Summary
Carlton County is located in the northeastern corner of Minnesota, and is part of the Arrowhead Region. It is bordered by St. Louis County to the north, Pine County to the east, and Douglas County to the south. The county seat is Carlton, and the largest city is Cloquet. The county was established in 1857 and named after Reuben B. Carlton, a Minnesota politician.
Geography
Carlton County covers an area of 1,072 square miles, making it the fourth largest county in Minnesota. The county is mostly forested, with the majority of the land being part of the Superior National Forest. The St. Louis River runs through the county, and there are several smaller rivers and streams. The highest point in the county is located in the Nemadji State Forest, at an elevation of 1,717 feet.
The climate of Carlton County is classified as humid continental, with cold winters and warm summers. The average annual temperature is 40°F, and the average annual precipitation is 28 inches.
Demographics
As of the 2010 census, there were 35,386 people, 14,717 households, and 9,845 families living in Carlton County. The population density was 33.2 people per square mile. The racial makeup of the county was 94.2% White, 0.7% African American, 2.2% Native American, 0.6% Asian, 0.1% Pacific Islander, 0.7% from other races, and 1.5% from two or more races. Hispanic or Latino of any race were 2.2% of the population.
The median income for a household in the county was $41,945, and the median income for a family was $50,945. The per capita income for the county was $20,945. About 11.2% of families and 14.7% of the population were below the poverty line, including 19.2% of those under age 18 and 8.2% of those age 65 or over.
Economy
The economy of Carlton County is largely based on forestry and tourism. The county is home to several paper mills, which are the largest employers in the area. Other major industries include manufacturing, healthcare, and retail.
The county is also home to several state parks, including Jay Cooke State Park, which is the most visited state park in Minnesota. The park is located along the St. Louis River and is popular for its hiking trails, camping, and fishing.
The county is also home to the Fond du Lac Indian Reservation, which is the largest Indian reservation in Minnesota. The reservation is home to the Fond du Lac Band of Lake Superior Chippewa, and is the second largest employer in the county.
Conclusion
Carlton County is a rural county located in the northeastern corner of Minnesota. It is mostly forested, with the majority of the land being part of the Superior National Forest. The county is home to several paper mills, state parks, and the Fond du Lac Indian Reservation. The population of the county is largely white, with a small percentage of Native Americans and other races. The economy of the county is largely based on forestry and tourism, with paper mills, manufacturing, healthcare, and retail being the major industries.
Common Questions
What is Per Capita Income in Carlton County?
Per Capita income in Carlton County is $35,642.
What is the Median Family Income in Carlton County?
Median Family Income in Carlton County is $90,974.
What is the Median Household income in Carlton County?
Median Household Income in Carlton County is $74,660.
What is Income or Wage Gap in Carlton County?
Income or Wage Gap in Carlton County is 29.4%.
Women in Carlton County earn 70.6 cents for every dollar earned by a man.
What is Family Income Deficit in Carlton County?
Family Income Deficit in Carlton County is $9,163.
Families that are below poverty line in Carlton County earn $9,163 less on average than the poverty threshold level.
What is Inequality or Gini Index in Carlton County?
Inequality or Gini Index in Carlton County is 0.41.
What is the Total Population of Carlton County?
Total Population of Carlton County is 36,362.
What is the Total Male Population of Carlton County?
Total Male Population of Carlton County is 19,212.
What is the Total Female Population of Carlton County?
Total Female Population of Carlton County is 17,150.
What is the Ratio of Males per 100 Females in Carlton County?
There are 112.02 Males per 100 Females in Carlton County.
What is the Ratio of Females per 100 Males in Carlton County?
There are 89.27 Females per 100 Males in Carlton County.
What is the Median Population Age in Carlton County?
Median Population Age in Carlton County is 41.6 Years.
What is the Average Family Size in Carlton County
Average Family Size in Carlton County is 3.0 People.
What is the Average Household Size in Carlton County
Average Household Size in Carlton County is 2.4 People.
How Large is the Labor Force in Carlton County?
There are 17,593 People in the Labor Forcein in Carlton County.
What is the Percentage of People in the Labor Force in Carlton County?
60.0% of People are in the Labor Force in Carlton County.
What is the Unemployment Rate in Carlton County?
Unemployment Rate in Carlton County is 4.7%.