Zip Codes with the Highest Percentage of Immigrants from South America in Lenexa, KS
RELATED REPORTS & OPTIONS
South America
Lenexa
Compare Zip Codes
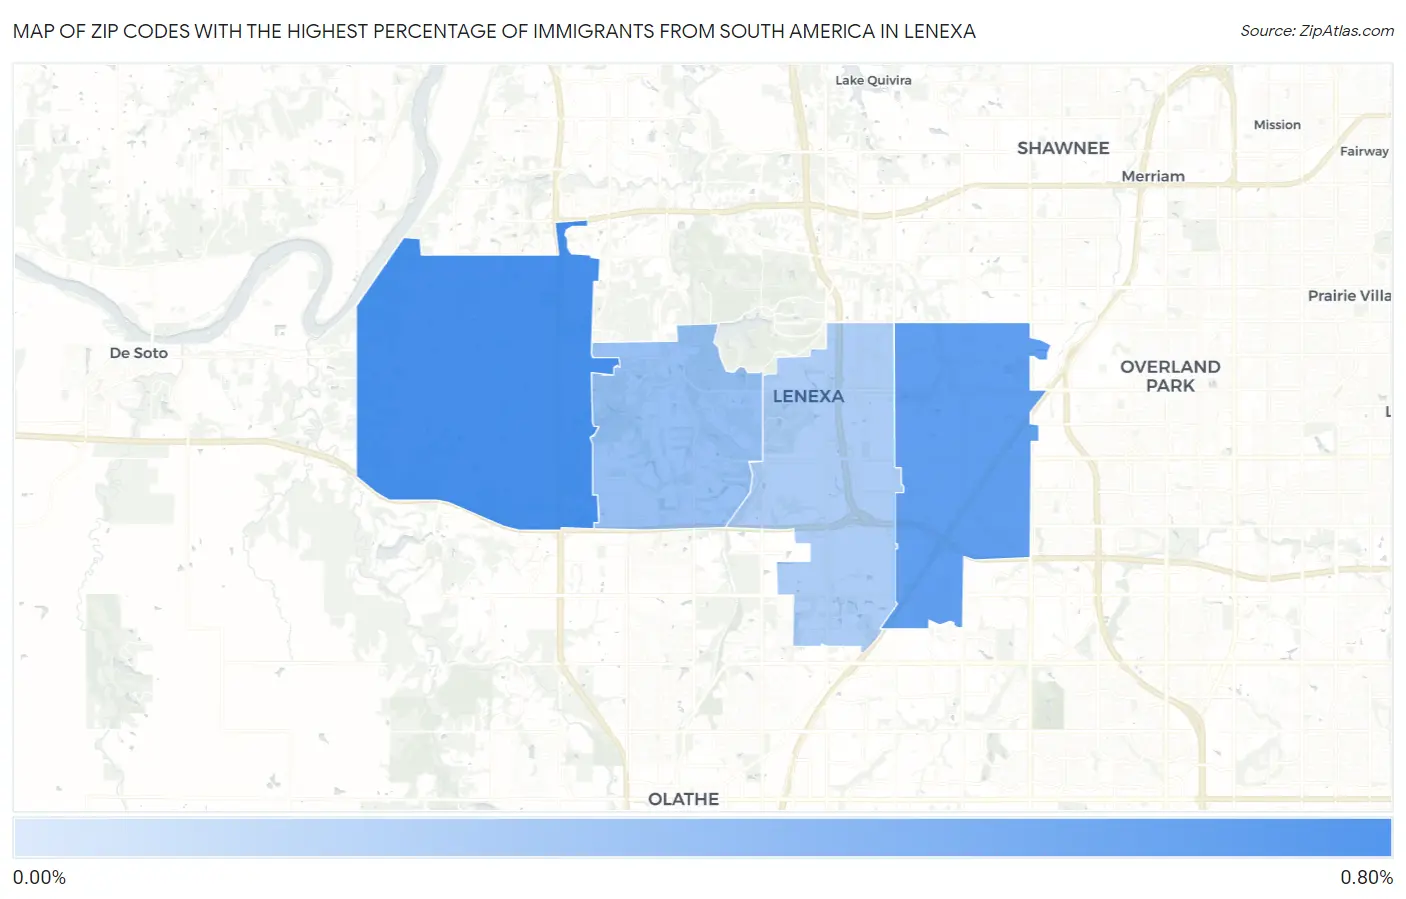
Map of Zip Codes with the Highest Percentage of Immigrants from South America in Lenexa
0.24%
0.73%
Zip Codes with the Highest Percentage of Immigrants from South America in Lenexa, KS
| Zip Code | South America | vs State | vs National | |
| 1. | 66227 | 0.73% | 0.25%(+0.476)#227 | 1.10%(-0.367)#13,071 |
| 2. | 66215 | 0.60% | 0.25%(+0.349)#228 | 1.10%(-0.494)#13,072 |
| 3. | 66220 | 0.33% | 0.25%(+0.077)#311 | 1.10%(-0.766)#17,725 |
| 4. | 66219 | 0.24% | 0.25%(-0.016)#312 | 1.10%(-0.860)#17,726 |
1
Common Questions
What are the Top 3 Zip Codes with the Highest Percentage of Immigrants from South America in Lenexa, KS?
Top 3 Zip Codes with the Highest Percentage of Immigrants from South America in Lenexa, KS are:
What zip code has the Highest Percentage of Immigrants from South America in Lenexa, KS?
66227 has the Highest Percentage of Immigrants from South America in Lenexa, KS with 0.73%.
What is the Percentage of Immigrants from South America in Lenexa, KS?
Percentage of Immigrants from South America in Lenexa is 0.53%.
What is the Percentage of Immigrants from South America in Kansas?
Percentage of Immigrants from South America in Kansas is 0.25%.
What is the Percentage of Immigrants from South America in the United States?
Percentage of Immigrants from South America in the United States is 1.10%.