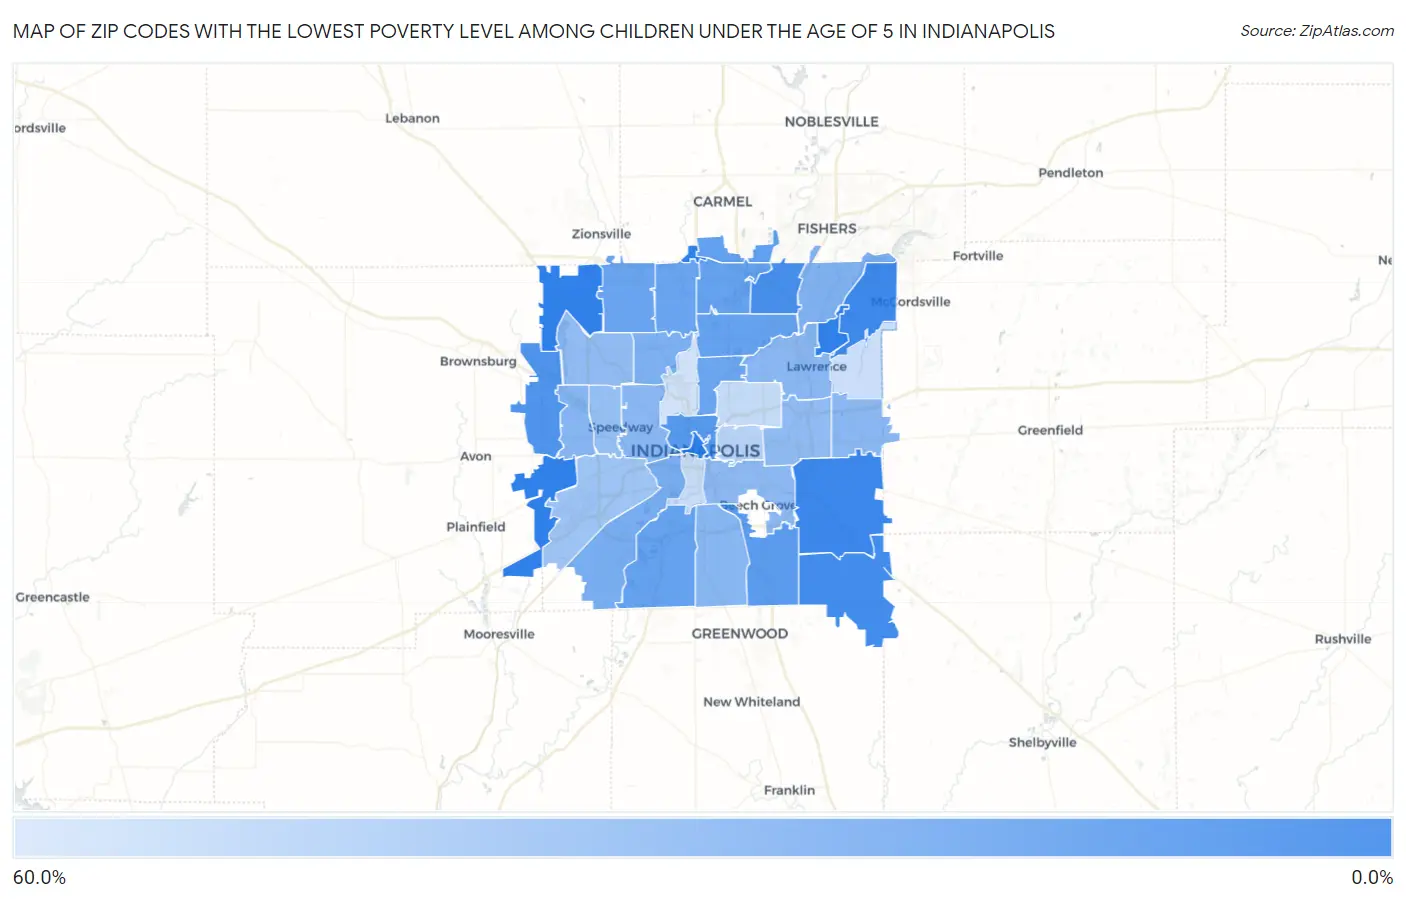
Zip Codes with the Lowest Poverty Level Among Children Under the Age of 5 in Indianapolis, IN
RELATED REPORTS & OPTIONS
Lowest Poverty | Child 0-5
Indianapolis
Compare Zip Codes
Map of Zip Codes with the Lowest Poverty Level Among Children Under the Age of 5 in Indianapolis
53.3%
2.1%
Zip Codes with the Lowest Poverty Level Among Children Under the Age of 5 in Indianapolis, IN
| Zip Code | Child Poverty | vs State | vs National | |
| 1. | 46239 | 2.1% | 18.4%(-16.3)#22 | 18.1%(-16.0)#908 |
| 2. | 46236 | 2.8% | 18.4%(-15.7)#35 | 18.1%(-15.3)#1,329 |
| 3. | 46259 | 4.2% | 18.4%(-14.2)#65 | 18.1%(-13.9)#2,343 |
| 4. | 46250 | 5.1% | 18.4%(-13.3)#78 | 18.1%(-13.0)#2,966 |
| 5. | 46234 | 8.4% | 18.4%(-10.1)#129 | 18.1%(-9.71)#5,157 |
| 6. | 46202 | 10.4% | 18.4%(-8.06)#164 | 18.1%(-7.70)#6,486 |
| 7. | 46237 | 11.3% | 18.4%(-7.08)#181 | 18.1%(-6.72)#7,057 |
| 8. | 46280 | 13.5% | 18.4%(-4.91)#208 | 18.1%(-4.55)#8,350 |
| 9. | 46217 | 14.0% | 18.4%(-4.47)#216 | 18.1%(-4.11)#8,618 |
| 10. | 46220 | 14.3% | 18.4%(-4.09)#227 | 18.1%(-3.73)#8,864 |
| 11. | 46240 | 14.4% | 18.4%(-4.06)#228 | 18.1%(-3.70)#8,874 |
| 12. | 46260 | 15.4% | 18.4%(-2.98)#241 | 18.1%(-2.62)#9,478 |
| 13. | 46268 | 16.0% | 18.4%(-2.46)#248 | 18.1%(-2.10)#9,734 |
| 14. | 46205 | 16.5% | 18.4%(-1.95)#258 | 18.1%(-1.58)#10,018 |
| 15. | 46221 | 20.1% | 18.4%(+1.65)#311 | 18.1%(+2.01)#11,683 |
| 16. | 46228 | 22.1% | 18.4%(+3.66)#337 | 18.1%(+4.02)#12,516 |
| 17. | 46256 | 23.5% | 18.4%(+5.04)#351 | 18.1%(+5.40)#13,081 |
| 18. | 46214 | 25.0% | 18.4%(+6.61)#369 | 18.1%(+6.97)#13,713 |
| 19. | 46227 | 25.1% | 18.4%(+6.71)#370 | 18.1%(+7.07)#13,732 |
| 20. | 46222 | 26.3% | 18.4%(+7.90)#385 | 18.1%(+8.26)#14,140 |
| 21. | 46226 | 26.3% | 18.4%(+7.91)#386 | 18.1%(+8.27)#14,141 |
| 22. | 46229 | 26.5% | 18.4%(+8.08)#388 | 18.1%(+8.45)#14,198 |
| 23. | 46203 | 27.2% | 18.4%(+8.78)#395 | 18.1%(+9.14)#14,425 |
| 24. | 46219 | 28.4% | 18.4%(+9.94)#402 | 18.1%(+10.3)#14,810 |
| 25. | 46254 | 28.9% | 18.4%(+10.5)#408 | 18.1%(+10.8)#14,987 |
| 26. | 46224 | 30.6% | 18.4%(+12.2)#419 | 18.1%(+12.6)#15,488 |
| 27. | 46241 | 33.4% | 18.4%(+15.0)#436 | 18.1%(+15.3)#16,251 |
| 28. | 46201 | 42.7% | 18.4%(+24.3)#475 | 18.1%(+24.7)#18,143 |
| 29. | 46218 | 47.4% | 18.4%(+29.0)#491 | 18.1%(+29.3)#18,794 |
| 30. | 46225 | 49.7% | 18.4%(+31.3)#498 | 18.1%(+31.6)#19,041 |
| 31. | 46235 | 50.7% | 18.4%(+32.3)#501 | 18.1%(+32.6)#19,215 |
| 32. | 46208 | 53.3% | 18.4%(+34.9)#508 | 18.1%(+35.3)#19,463 |
1
Common Questions
What are the Top 10 Zip Codes with the Lowest Poverty Level Among Children Under the Age of 5 in Indianapolis, IN?
Top 10 Zip Codes with the Lowest Poverty Level Among Children Under the Age of 5 in Indianapolis, IN are:
What zip code has the Lowest Poverty Level Among Children Under the Age of 5 in Indianapolis, IN?
46239 has the Lowest Poverty Level Among Children Under the Age of 5 in Indianapolis, IN with 2.1%.
What is the Poverty Level Among Children Under the Age of 5 in Indianapolis, IN?
Poverty Level Among Children Under the Age of 5 in Indianapolis is 25.0%.
What is the Poverty Level Among Children Under the Age of 5 in Indiana?
Poverty Level Among Children Under the Age of 5 in Indiana is 18.4%.
What is the Poverty Level Among Children Under the Age of 5 in the United States?
Poverty Level Among Children Under the Age of 5 in the United States is 18.1%.