Immigrants from Scotland vs Welsh Self-Care Disability
COMPARE
Immigrants from Scotland
Welsh
Self-Care Disability
Self-Care Disability Comparison
Immigrants from Scotland
Welsh
2.4%
SELF-CARE DISABILITY
95.7/ 100
METRIC RATING
101st/ 347
METRIC RANK
2.5%
SELF-CARE DISABILITY
50.0/ 100
METRIC RATING
174th/ 347
METRIC RANK
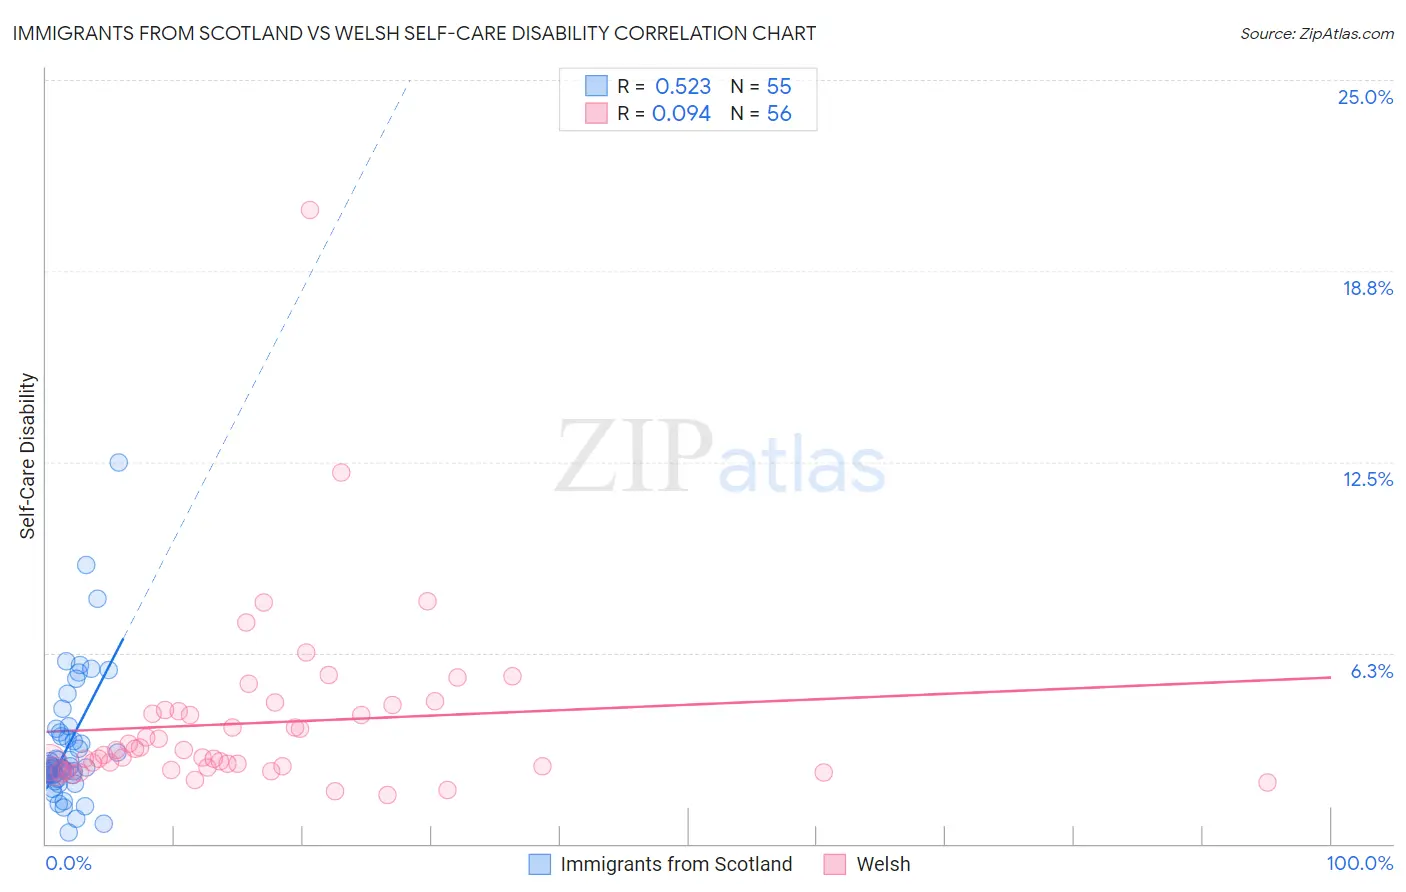
Immigrants from Scotland vs Welsh Self-Care Disability Correlation Chart
The statistical analysis conducted on geographies consisting of 196,308,216 people shows a substantial positive correlation between the proportion of Immigrants from Scotland and percentage of population with self-care disability in the United States with a correlation coefficient (R) of 0.523 and weighted average of 2.4%. Similarly, the statistical analysis conducted on geographies consisting of 527,151,887 people shows a slight positive correlation between the proportion of Welsh and percentage of population with self-care disability in the United States with a correlation coefficient (R) of 0.094 and weighted average of 2.5%, a difference of 3.8%.
Self-Care Disability Correlation Summary
| Measurement | Immigrants from Scotland | Welsh |
| Minimum | 0.37% | 1.6% |
| Maximum | 12.5% | 20.7% |
| Range | 12.1% | 19.1% |
| Mean | 3.2% | 4.0% |
| Median | 2.5% | 3.0% |
| Interquartile 25% (IQ1) | 2.2% | 2.5% |
| Interquartile 75% (IQ3) | 3.6% | 4.4% |
| Interquartile Range (IQR) | 1.4% | 1.8% |
| Standard Deviation (Sample) | 2.1% | 2.9% |
| Standard Deviation (Population) | 2.1% | 2.9% |
Similar Demographics by Self-Care Disability
Demographics Similar to Immigrants from Scotland by Self-Care Disability
In terms of self-care disability, the demographic groups most similar to Immigrants from Scotland are European (2.4%, a difference of 0.040%), Immigrants from Israel (2.4%, a difference of 0.15%), Croatian (2.4%, a difference of 0.18%), Alsatian (2.4%, a difference of 0.21%), and Immigrants from Poland (2.4%, a difference of 0.22%).
| Demographics | Rating | Rank | Self-Care Disability |
| Macedonians | 96.9 /100 | #94 | Exceptional 2.4% |
| Immigrants | Asia | 96.9 /100 | #95 | Exceptional 2.4% |
| Immigrants | Chile | 96.7 /100 | #96 | Exceptional 2.4% |
| Swiss | 96.6 /100 | #97 | Exceptional 2.4% |
| Immigrants | Poland | 96.4 /100 | #98 | Exceptional 2.4% |
| Immigrants | Israel | 96.1 /100 | #99 | Exceptional 2.4% |
| Europeans | 95.8 /100 | #100 | Exceptional 2.4% |
| Immigrants | Scotland | 95.7 /100 | #101 | Exceptional 2.4% |
| Croatians | 95.0 /100 | #102 | Exceptional 2.4% |
| Alsatians | 94.9 /100 | #103 | Exceptional 2.4% |
| Bhutanese | 94.5 /100 | #104 | Exceptional 2.4% |
| Carpatho Rusyns | 94.4 /100 | #105 | Exceptional 2.4% |
| Immigrants | Indonesia | 94.3 /100 | #106 | Exceptional 2.4% |
| British | 94.3 /100 | #107 | Exceptional 2.4% |
| Greeks | 94.1 /100 | #108 | Exceptional 2.4% |
Demographics Similar to Welsh by Self-Care Disability
In terms of self-care disability, the demographic groups most similar to Welsh are Immigrants from Bosnia and Herzegovina (2.5%, a difference of 0.020%), Immigrants from Afghanistan (2.5%, a difference of 0.11%), Immigrants from Burma/Myanmar (2.5%, a difference of 0.13%), Immigrants from Kazakhstan (2.5%, a difference of 0.16%), and Pennsylvania German (2.5%, a difference of 0.17%).
| Demographics | Rating | Rank | Self-Care Disability |
| Immigrants | Greece | 57.3 /100 | #167 | Average 2.5% |
| Ute | 57.1 /100 | #168 | Average 2.5% |
| Immigrants | Somalia | 55.9 /100 | #169 | Average 2.5% |
| Scottish | 54.3 /100 | #170 | Average 2.5% |
| Pennsylvania Germans | 53.5 /100 | #171 | Average 2.5% |
| Czechoslovakians | 53.5 /100 | #172 | Average 2.5% |
| Immigrants | Burma/Myanmar | 52.8 /100 | #173 | Average 2.5% |
| Welsh | 50.0 /100 | #174 | Average 2.5% |
| Immigrants | Bosnia and Herzegovina | 49.6 /100 | #175 | Average 2.5% |
| Immigrants | Afghanistan | 47.6 /100 | #176 | Average 2.5% |
| Immigrants | Kazakhstan | 46.7 /100 | #177 | Average 2.5% |
| English | 46.2 /100 | #178 | Average 2.5% |
| Hungarians | 45.5 /100 | #179 | Average 2.5% |
| Indonesians | 41.2 /100 | #180 | Average 2.5% |
| Ghanaians | 40.4 /100 | #181 | Average 2.5% |