Immigrants from Scotland vs Aleut Self-Care Disability
COMPARE
Immigrants from Scotland
Aleut
Self-Care Disability
Self-Care Disability Comparison
Immigrants from Scotland
Aleuts
2.4%
SELF-CARE DISABILITY
95.7/ 100
METRIC RATING
101st/ 347
METRIC RANK
2.8%
SELF-CARE DISABILITY
0.0/ 100
METRIC RATING
306th/ 347
METRIC RANK
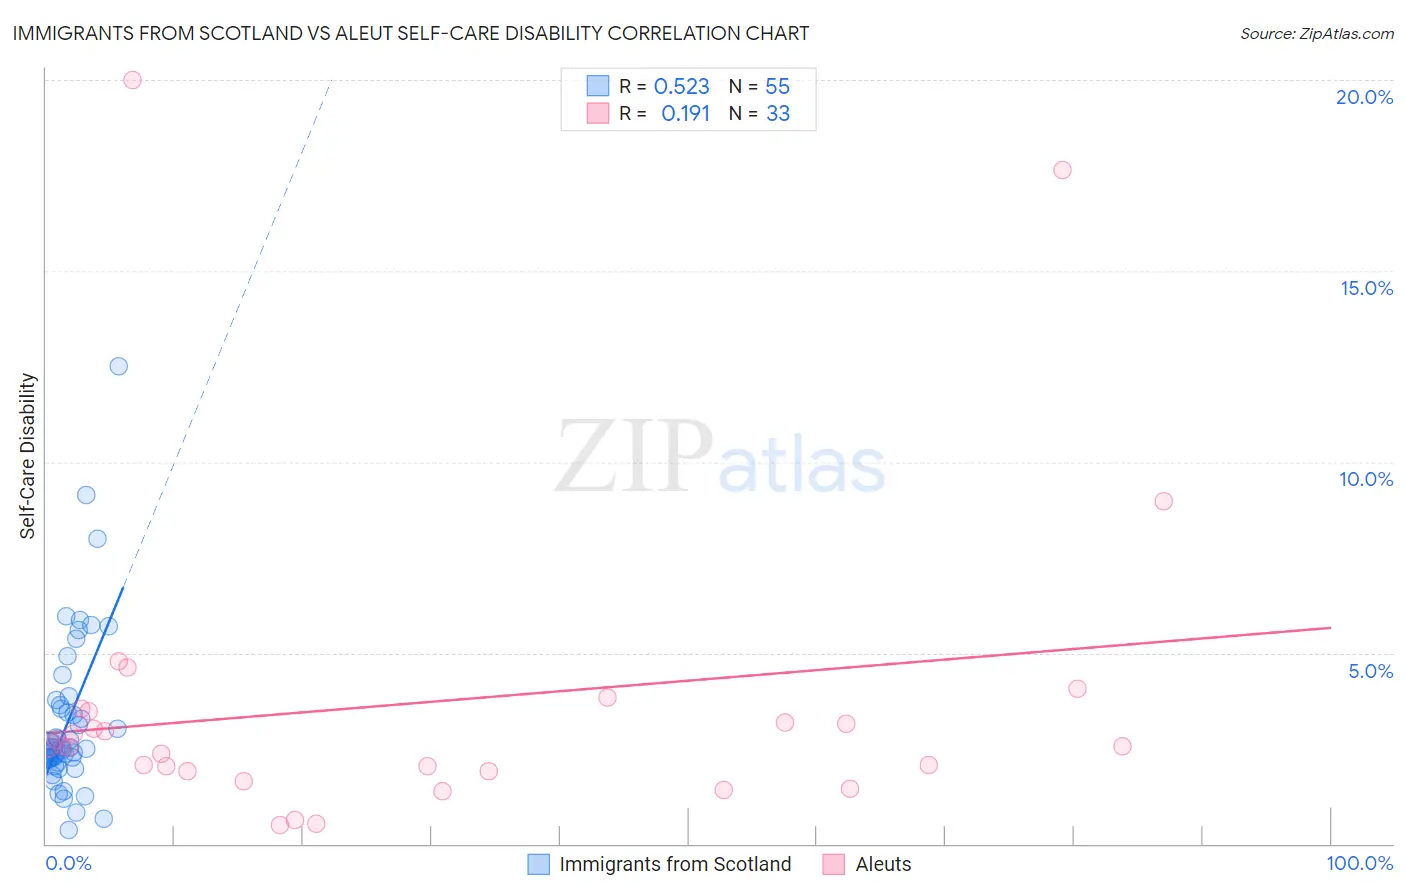
Immigrants from Scotland vs Aleut Self-Care Disability Correlation Chart
The statistical analysis conducted on geographies consisting of 196,308,216 people shows a substantial positive correlation between the proportion of Immigrants from Scotland and percentage of population with self-care disability in the United States with a correlation coefficient (R) of 0.523 and weighted average of 2.4%. Similarly, the statistical analysis conducted on geographies consisting of 61,744,406 people shows a poor positive correlation between the proportion of Aleuts and percentage of population with self-care disability in the United States with a correlation coefficient (R) of 0.191 and weighted average of 2.8%, a difference of 18.0%.
Self-Care Disability Correlation Summary
| Measurement | Immigrants from Scotland | Aleut |
| Minimum | 0.37% | 0.50% |
| Maximum | 12.5% | 20.0% |
| Range | 12.1% | 19.5% |
| Mean | 3.2% | 3.7% |
| Median | 2.5% | 2.6% |
| Interquartile 25% (IQ1) | 2.2% | 1.9% |
| Interquartile 75% (IQ3) | 3.6% | 3.5% |
| Interquartile Range (IQR) | 1.4% | 1.6% |
| Standard Deviation (Sample) | 2.1% | 4.2% |
| Standard Deviation (Population) | 2.1% | 4.1% |
Similar Demographics by Self-Care Disability
Demographics Similar to Immigrants from Scotland by Self-Care Disability
In terms of self-care disability, the demographic groups most similar to Immigrants from Scotland are European (2.4%, a difference of 0.040%), Immigrants from Israel (2.4%, a difference of 0.15%), Croatian (2.4%, a difference of 0.18%), Alsatian (2.4%, a difference of 0.21%), and Immigrants from Poland (2.4%, a difference of 0.22%).
| Demographics | Rating | Rank | Self-Care Disability |
| Macedonians | 96.9 /100 | #94 | Exceptional 2.4% |
| Immigrants | Asia | 96.9 /100 | #95 | Exceptional 2.4% |
| Immigrants | Chile | 96.7 /100 | #96 | Exceptional 2.4% |
| Swiss | 96.6 /100 | #97 | Exceptional 2.4% |
| Immigrants | Poland | 96.4 /100 | #98 | Exceptional 2.4% |
| Immigrants | Israel | 96.1 /100 | #99 | Exceptional 2.4% |
| Europeans | 95.8 /100 | #100 | Exceptional 2.4% |
| Immigrants | Scotland | 95.7 /100 | #101 | Exceptional 2.4% |
| Croatians | 95.0 /100 | #102 | Exceptional 2.4% |
| Alsatians | 94.9 /100 | #103 | Exceptional 2.4% |
| Bhutanese | 94.5 /100 | #104 | Exceptional 2.4% |
| Carpatho Rusyns | 94.4 /100 | #105 | Exceptional 2.4% |
| Immigrants | Indonesia | 94.3 /100 | #106 | Exceptional 2.4% |
| British | 94.3 /100 | #107 | Exceptional 2.4% |
| Greeks | 94.1 /100 | #108 | Exceptional 2.4% |
Demographics Similar to Aleuts by Self-Care Disability
In terms of self-care disability, the demographic groups most similar to Aleuts are Native/Alaskan (2.8%, a difference of 0.070%), Immigrants from Grenada (2.8%, a difference of 0.37%), Immigrants from West Indies (2.8%, a difference of 0.40%), Cree (2.8%, a difference of 0.45%), and Bangladeshi (2.8%, a difference of 0.52%).
| Demographics | Rating | Rank | Self-Care Disability |
| Immigrants | Guyana | 0.0 /100 | #299 | Tragic 2.8% |
| Immigrants | Fiji | 0.0 /100 | #300 | Tragic 2.8% |
| Pima | 0.0 /100 | #301 | Tragic 2.8% |
| Immigrants | St. Vincent and the Grenadines | 0.0 /100 | #302 | Tragic 2.8% |
| Immigrants | Belize | 0.0 /100 | #303 | Tragic 2.8% |
| Cree | 0.0 /100 | #304 | Tragic 2.8% |
| Immigrants | West Indies | 0.0 /100 | #305 | Tragic 2.8% |
| Aleuts | 0.0 /100 | #306 | Tragic 2.8% |
| Natives/Alaskans | 0.0 /100 | #307 | Tragic 2.8% |
| Immigrants | Grenada | 0.0 /100 | #308 | Tragic 2.8% |
| Bangladeshis | 0.0 /100 | #309 | Tragic 2.8% |
| British West Indians | 0.0 /100 | #310 | Tragic 2.8% |
| Puget Sound Salish | 0.0 /100 | #311 | Tragic 2.8% |
| Immigrants | Caribbean | 0.0 /100 | #312 | Tragic 2.8% |
| Spanish Americans | 0.0 /100 | #313 | Tragic 2.8% |