Immigrants from Scotland vs Lithuanian Self-Care Disability
COMPARE
Immigrants from Scotland
Lithuanian
Self-Care Disability
Self-Care Disability Comparison
Immigrants from Scotland
Lithuanians
2.4%
SELF-CARE DISABILITY
95.7/ 100
METRIC RATING
101st/ 347
METRIC RANK
2.4%
SELF-CARE DISABILITY
98.0/ 100
METRIC RATING
88th/ 347
METRIC RANK
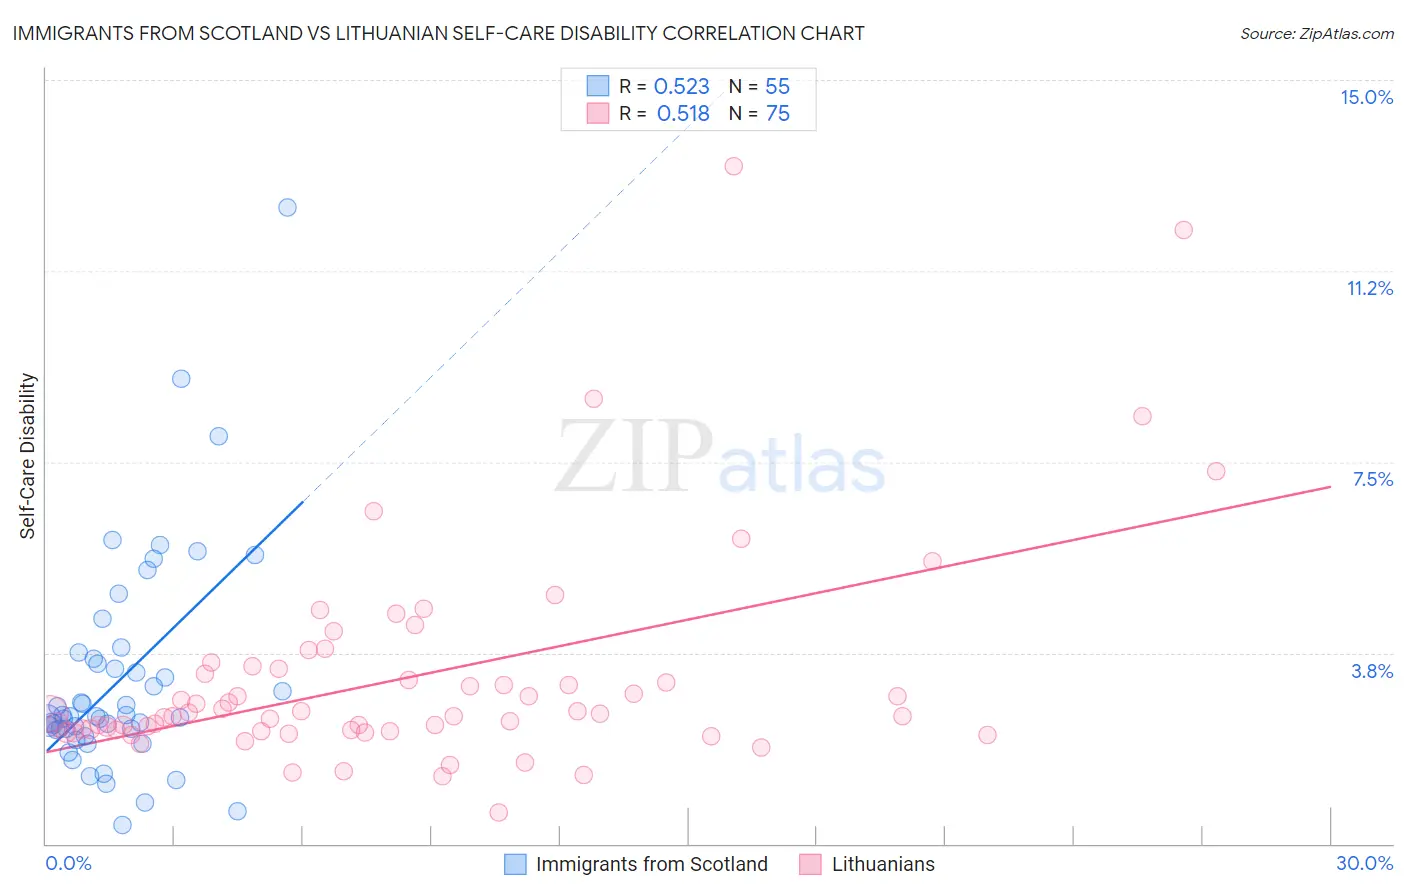
Immigrants from Scotland vs Lithuanian Self-Care Disability Correlation Chart
The statistical analysis conducted on geographies consisting of 196,308,216 people shows a substantial positive correlation between the proportion of Immigrants from Scotland and percentage of population with self-care disability in the United States with a correlation coefficient (R) of 0.523 and weighted average of 2.4%. Similarly, the statistical analysis conducted on geographies consisting of 421,348,071 people shows a substantial positive correlation between the proportion of Lithuanians and percentage of population with self-care disability in the United States with a correlation coefficient (R) of 0.518 and weighted average of 2.4%, a difference of 1.0%.
Self-Care Disability Correlation Summary
| Measurement | Immigrants from Scotland | Lithuanian |
| Minimum | 0.37% | 0.63% |
| Maximum | 12.5% | 13.3% |
| Range | 12.1% | 12.7% |
| Mean | 3.2% | 3.3% |
| Median | 2.5% | 2.6% |
| Interquartile 25% (IQ1) | 2.2% | 2.2% |
| Interquartile 75% (IQ3) | 3.6% | 3.4% |
| Interquartile Range (IQR) | 1.4% | 1.2% |
| Standard Deviation (Sample) | 2.1% | 2.2% |
| Standard Deviation (Population) | 2.1% | 2.1% |
Demographics Similar to Immigrants from Scotland and Lithuanians by Self-Care Disability
In terms of self-care disability, the demographic groups most similar to Immigrants from Scotland are European (2.4%, a difference of 0.040%), Immigrants from Israel (2.4%, a difference of 0.15%), Croatian (2.4%, a difference of 0.18%), Alsatian (2.4%, a difference of 0.21%), and Immigrants from Poland (2.4%, a difference of 0.22%). Similarly, the demographic groups most similar to Lithuanians are Sierra Leonean (2.4%, a difference of 0.0%), Immigrants from Congo (2.4%, a difference of 0.050%), Immigrants from Northern Africa (2.3%, a difference of 0.14%), Estonian (2.3%, a difference of 0.16%), and Immigrants from Czechoslovakia (2.4%, a difference of 0.19%).
| Demographics | Rating | Rank | Self-Care Disability |
| Immigrants | Spain | 98.7 /100 | #84 | Exceptional 2.3% |
| Estonians | 98.3 /100 | #85 | Exceptional 2.3% |
| Immigrants | Northern Africa | 98.2 /100 | #86 | Exceptional 2.3% |
| Sierra Leoneans | 98.0 /100 | #87 | Exceptional 2.4% |
| Lithuanians | 98.0 /100 | #88 | Exceptional 2.4% |
| Immigrants | Congo | 98.0 /100 | #89 | Exceptional 2.4% |
| Immigrants | Czechoslovakia | 97.7 /100 | #90 | Exceptional 2.4% |
| Immigrants | Jordan | 97.7 /100 | #91 | Exceptional 2.4% |
| Icelanders | 97.4 /100 | #92 | Exceptional 2.4% |
| Immigrants | Latvia | 97.0 /100 | #93 | Exceptional 2.4% |
| Macedonians | 96.9 /100 | #94 | Exceptional 2.4% |
| Immigrants | Asia | 96.9 /100 | #95 | Exceptional 2.4% |
| Immigrants | Chile | 96.7 /100 | #96 | Exceptional 2.4% |
| Swiss | 96.6 /100 | #97 | Exceptional 2.4% |
| Immigrants | Poland | 96.4 /100 | #98 | Exceptional 2.4% |
| Immigrants | Israel | 96.1 /100 | #99 | Exceptional 2.4% |
| Europeans | 95.8 /100 | #100 | Exceptional 2.4% |
| Immigrants | Scotland | 95.7 /100 | #101 | Exceptional 2.4% |
| Croatians | 95.0 /100 | #102 | Exceptional 2.4% |
| Alsatians | 94.9 /100 | #103 | Exceptional 2.4% |
| Bhutanese | 94.5 /100 | #104 | Exceptional 2.4% |