Immigrants from Scotland vs Immigrants from Ireland Self-Care Disability
COMPARE
Immigrants from Scotland
Immigrants from Ireland
Self-Care Disability
Self-Care Disability Comparison
Immigrants from Scotland
Immigrants from Ireland
2.4%
SELF-CARE DISABILITY
95.7/ 100
METRIC RATING
101st/ 347
METRIC RANK
2.3%
SELF-CARE DISABILITY
99.0/ 100
METRIC RATING
78th/ 347
METRIC RANK
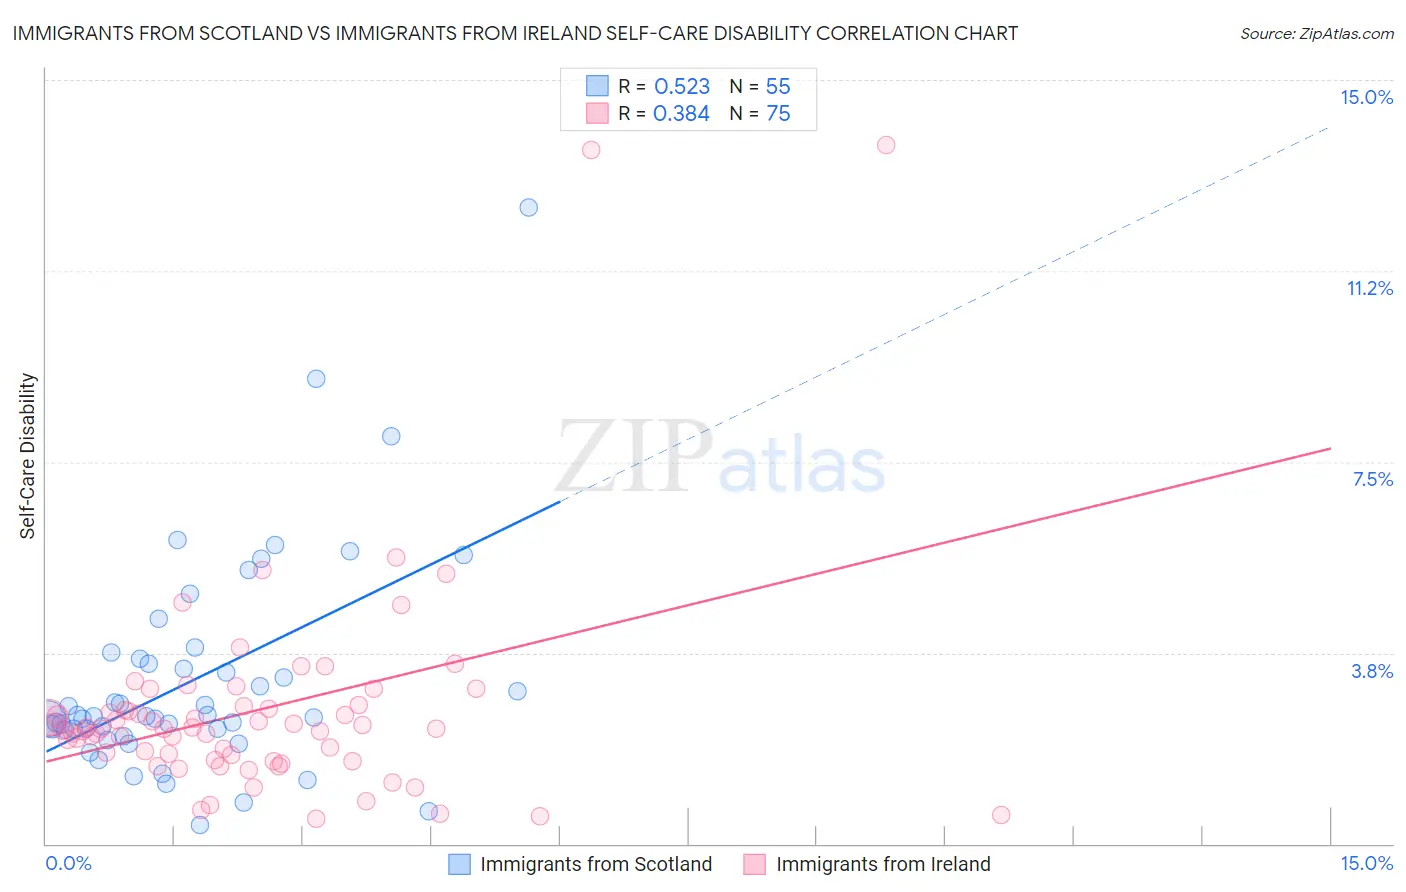
Immigrants from Scotland vs Immigrants from Ireland Self-Care Disability Correlation Chart
The statistical analysis conducted on geographies consisting of 196,308,216 people shows a substantial positive correlation between the proportion of Immigrants from Scotland and percentage of population with self-care disability in the United States with a correlation coefficient (R) of 0.523 and weighted average of 2.4%. Similarly, the statistical analysis conducted on geographies consisting of 240,643,513 people shows a mild positive correlation between the proportion of Immigrants from Ireland and percentage of population with self-care disability in the United States with a correlation coefficient (R) of 0.384 and weighted average of 2.3%, a difference of 1.9%.
Self-Care Disability Correlation Summary
| Measurement | Immigrants from Scotland | Immigrants from Ireland |
| Minimum | 0.37% | 0.50% |
| Maximum | 12.5% | 13.7% |
| Range | 12.1% | 13.2% |
| Mean | 3.2% | 2.6% |
| Median | 2.5% | 2.3% |
| Interquartile 25% (IQ1) | 2.2% | 1.7% |
| Interquartile 75% (IQ3) | 3.6% | 2.7% |
| Interquartile Range (IQR) | 1.4% | 1.0% |
| Standard Deviation (Sample) | 2.1% | 2.1% |
| Standard Deviation (Population) | 2.1% | 2.1% |
Similar Demographics by Self-Care Disability
Demographics Similar to Immigrants from Scotland by Self-Care Disability
In terms of self-care disability, the demographic groups most similar to Immigrants from Scotland are European (2.4%, a difference of 0.040%), Immigrants from Israel (2.4%, a difference of 0.15%), Croatian (2.4%, a difference of 0.18%), Alsatian (2.4%, a difference of 0.21%), and Immigrants from Poland (2.4%, a difference of 0.22%).
| Demographics | Rating | Rank | Self-Care Disability |
| Macedonians | 96.9 /100 | #94 | Exceptional 2.4% |
| Immigrants | Asia | 96.9 /100 | #95 | Exceptional 2.4% |
| Immigrants | Chile | 96.7 /100 | #96 | Exceptional 2.4% |
| Swiss | 96.6 /100 | #97 | Exceptional 2.4% |
| Immigrants | Poland | 96.4 /100 | #98 | Exceptional 2.4% |
| Immigrants | Israel | 96.1 /100 | #99 | Exceptional 2.4% |
| Europeans | 95.8 /100 | #100 | Exceptional 2.4% |
| Immigrants | Scotland | 95.7 /100 | #101 | Exceptional 2.4% |
| Croatians | 95.0 /100 | #102 | Exceptional 2.4% |
| Alsatians | 94.9 /100 | #103 | Exceptional 2.4% |
| Bhutanese | 94.5 /100 | #104 | Exceptional 2.4% |
| Carpatho Rusyns | 94.4 /100 | #105 | Exceptional 2.4% |
| Immigrants | Indonesia | 94.3 /100 | #106 | Exceptional 2.4% |
| British | 94.3 /100 | #107 | Exceptional 2.4% |
| Greeks | 94.1 /100 | #108 | Exceptional 2.4% |
Demographics Similar to Immigrants from Ireland by Self-Care Disability
In terms of self-care disability, the demographic groups most similar to Immigrants from Ireland are Immigrants from Middle Africa (2.3%, a difference of 0.0%), Immigrants from Kenya (2.3%, a difference of 0.010%), Immigrants from China (2.3%, a difference of 0.080%), Immigrants from Netherlands (2.3%, a difference of 0.090%), and Immigrants from Switzerland (2.3%, a difference of 0.13%).
| Demographics | Rating | Rank | Self-Care Disability |
| Asians | 99.2 /100 | #71 | Exceptional 2.3% |
| Eastern Europeans | 99.2 /100 | #72 | Exceptional 2.3% |
| Immigrants | Egypt | 99.1 /100 | #73 | Exceptional 2.3% |
| Immigrants | Switzerland | 99.1 /100 | #74 | Exceptional 2.3% |
| Immigrants | Netherlands | 99.1 /100 | #75 | Exceptional 2.3% |
| Immigrants | China | 99.1 /100 | #76 | Exceptional 2.3% |
| Immigrants | Middle Africa | 99.0 /100 | #77 | Exceptional 2.3% |
| Immigrants | Ireland | 99.0 /100 | #78 | Exceptional 2.3% |
| Immigrants | Kenya | 99.0 /100 | #79 | Exceptional 2.3% |
| Chileans | 98.8 /100 | #80 | Exceptional 2.3% |
| Ugandans | 98.8 /100 | #81 | Exceptional 2.3% |
| Immigrants | Denmark | 98.8 /100 | #82 | Exceptional 2.3% |
| Indians (Asian) | 98.7 /100 | #83 | Exceptional 2.3% |
| Immigrants | Spain | 98.7 /100 | #84 | Exceptional 2.3% |
| Estonians | 98.3 /100 | #85 | Exceptional 2.3% |