Dutch vs Immigrants from Colombia Self-Care Disability
COMPARE
Dutch
Immigrants from Colombia
Self-Care Disability
Self-Care Disability Comparison
Dutch
Immigrants from Colombia
2.4%
SELF-CARE DISABILITY
77.5/ 100
METRIC RATING
147th/ 347
METRIC RANK
2.4%
SELF-CARE DISABILITY
88.5/ 100
METRIC RATING
133rd/ 347
METRIC RANK
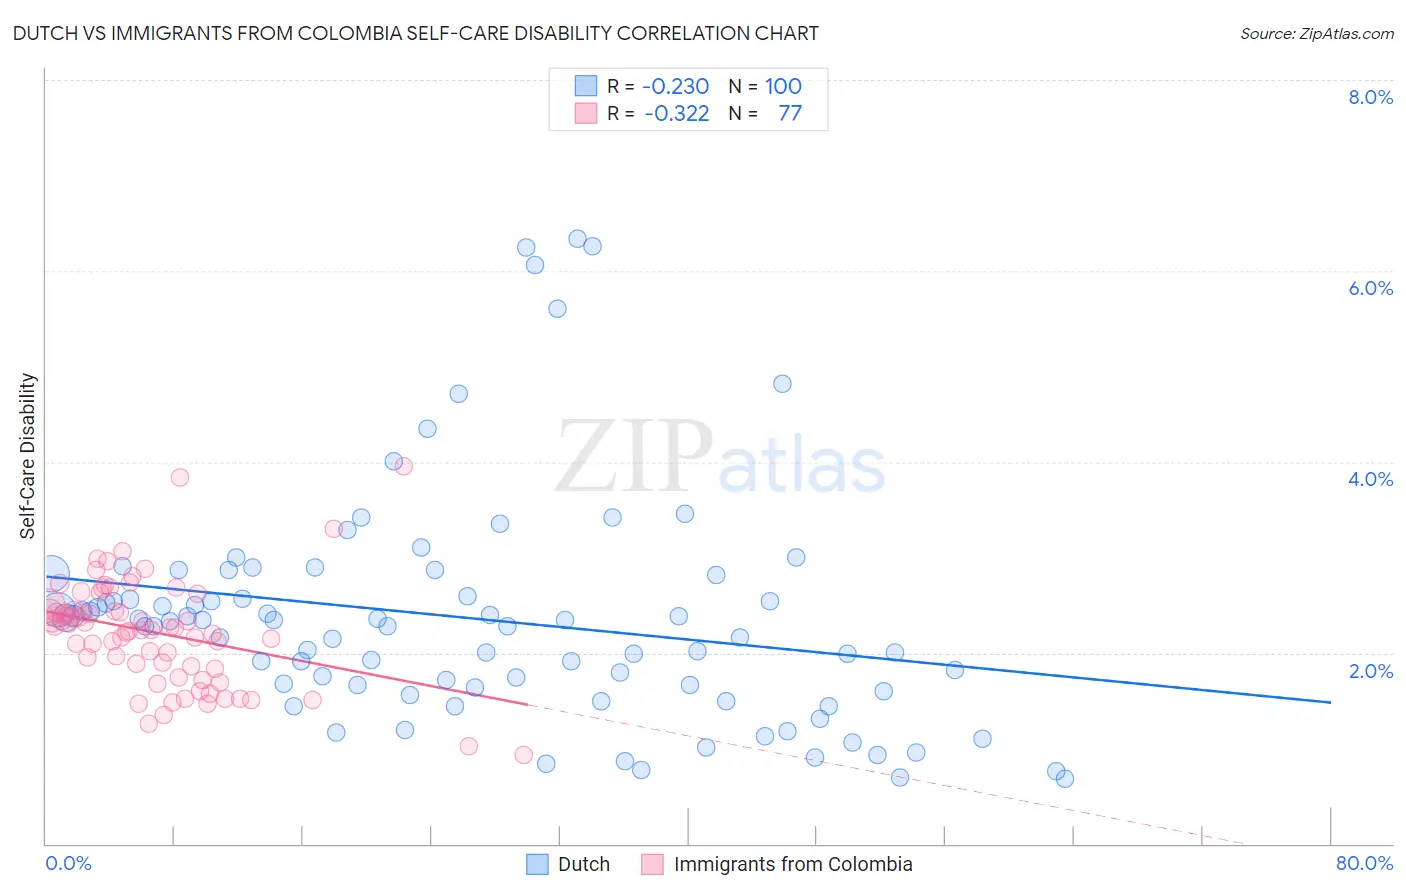
Dutch vs Immigrants from Colombia Self-Care Disability Correlation Chart
The statistical analysis conducted on geographies consisting of 552,476,439 people shows a weak negative correlation between the proportion of Dutch and percentage of population with self-care disability in the United States with a correlation coefficient (R) of -0.230 and weighted average of 2.4%. Similarly, the statistical analysis conducted on geographies consisting of 378,342,946 people shows a mild negative correlation between the proportion of Immigrants from Colombia and percentage of population with self-care disability in the United States with a correlation coefficient (R) of -0.322 and weighted average of 2.4%, a difference of 0.99%.
Self-Care Disability Correlation Summary
| Measurement | Dutch | Immigrants from Colombia |
| Minimum | 0.69% | 0.93% |
| Maximum | 6.3% | 4.0% |
| Range | 5.7% | 3.0% |
| Mean | 2.4% | 2.2% |
| Median | 2.3% | 2.3% |
| Interquartile 25% (IQ1) | 1.6% | 1.8% |
| Interquartile 75% (IQ3) | 2.7% | 2.5% |
| Interquartile Range (IQR) | 1.1% | 0.62% |
| Standard Deviation (Sample) | 1.2% | 0.56% |
| Standard Deviation (Population) | 1.2% | 0.56% |
Demographics Similar to Dutch and Immigrants from Colombia by Self-Care Disability
In terms of self-care disability, the demographic groups most similar to Dutch are Romanian (2.4%, a difference of 0.11%), Arab (2.4%, a difference of 0.12%), Immigrants from Costa Rica (2.4%, a difference of 0.16%), Israeli (2.4%, a difference of 0.18%), and German (2.4%, a difference of 0.19%). Similarly, the demographic groups most similar to Immigrants from Colombia are Immigrants from South America (2.4%, a difference of 0.030%), Polish (2.4%, a difference of 0.040%), Russian (2.4%, a difference of 0.040%), Immigrants from Austria (2.4%, a difference of 0.060%), and Laotian (2.4%, a difference of 0.090%).
| Demographics | Rating | Rank | Self-Care Disability |
| Immigrants | Austria | 89.0 /100 | #130 | Excellent 2.4% |
| Poles | 88.9 /100 | #131 | Excellent 2.4% |
| Immigrants | South America | 88.8 /100 | #132 | Excellent 2.4% |
| Immigrants | Colombia | 88.5 /100 | #133 | Excellent 2.4% |
| Russians | 88.2 /100 | #134 | Excellent 2.4% |
| Laotians | 87.8 /100 | #135 | Excellent 2.4% |
| South American Indians | 87.2 /100 | #136 | Excellent 2.4% |
| Austrians | 87.0 /100 | #137 | Excellent 2.4% |
| Immigrants | Croatia | 86.6 /100 | #138 | Excellent 2.4% |
| Sri Lankans | 86.6 /100 | #139 | Excellent 2.4% |
| Immigrants | Uruguay | 85.4 /100 | #140 | Excellent 2.4% |
| Alaska Natives | 84.5 /100 | #141 | Excellent 2.4% |
| Immigrants | Peru | 83.2 /100 | #142 | Excellent 2.4% |
| Afghans | 82.3 /100 | #143 | Excellent 2.4% |
| Costa Ricans | 80.8 /100 | #144 | Excellent 2.4% |
| Germans | 80.1 /100 | #145 | Excellent 2.4% |
| Israelis | 80.0 /100 | #146 | Good 2.4% |
| Dutch | 77.5 /100 | #147 | Good 2.4% |
| Romanians | 75.8 /100 | #148 | Good 2.4% |
| Arabs | 75.7 /100 | #149 | Good 2.4% |
| Immigrants | Costa Rica | 75.1 /100 | #150 | Good 2.4% |