Dutch vs Lumbee Self-Care Disability
COMPARE
Dutch
Lumbee
Self-Care Disability
Self-Care Disability Comparison
Dutch
Lumbee
2.4%
SELF-CARE DISABILITY
77.5/ 100
METRIC RATING
147th/ 347
METRIC RANK
3.0%
SELF-CARE DISABILITY
0.0/ 100
METRIC RATING
331st/ 347
METRIC RANK
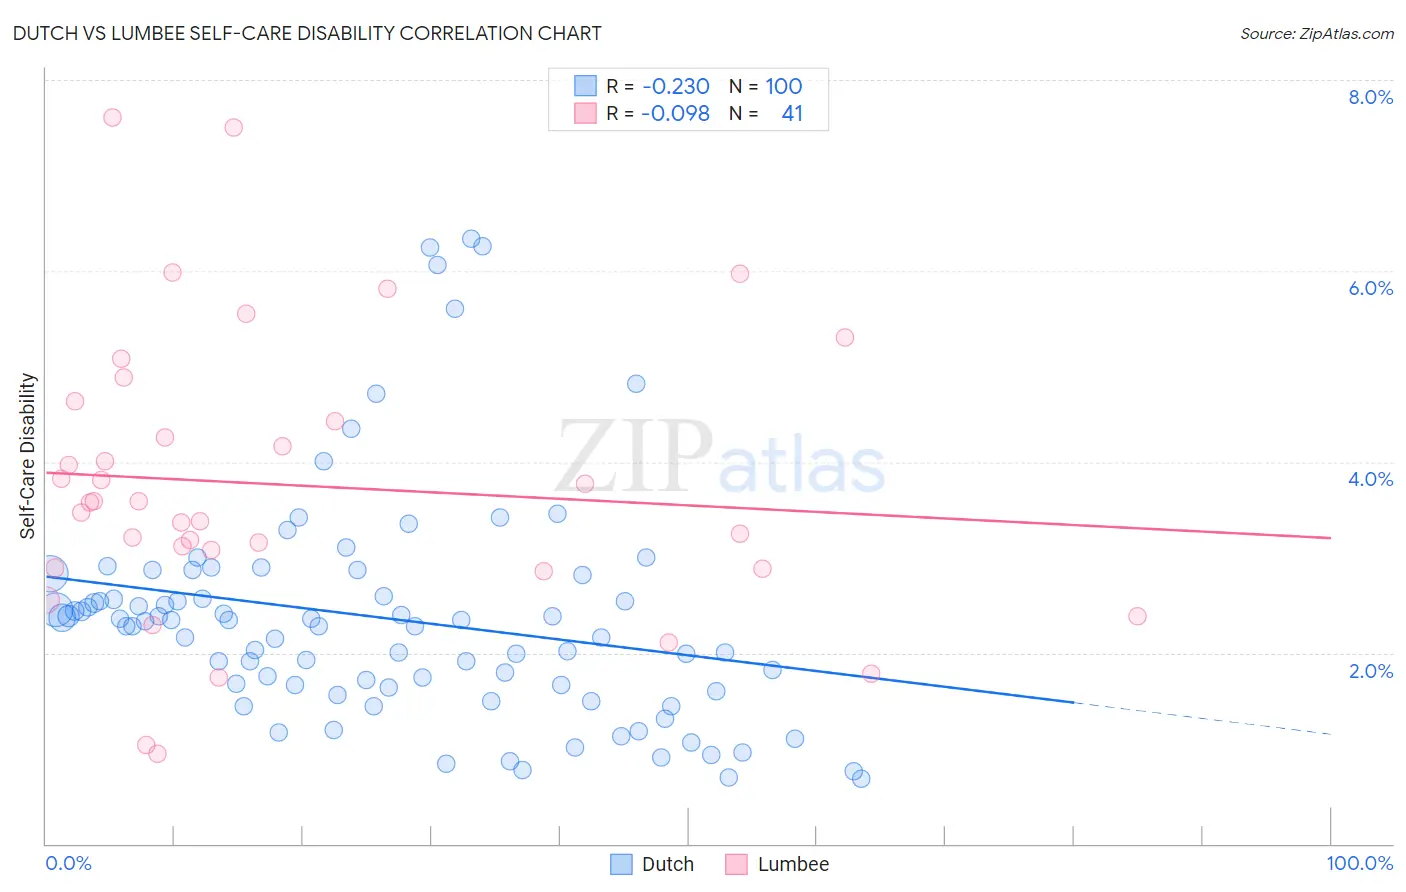
Dutch vs Lumbee Self-Care Disability Correlation Chart
The statistical analysis conducted on geographies consisting of 552,476,439 people shows a weak negative correlation between the proportion of Dutch and percentage of population with self-care disability in the United States with a correlation coefficient (R) of -0.230 and weighted average of 2.4%. Similarly, the statistical analysis conducted on geographies consisting of 92,217,287 people shows a slight negative correlation between the proportion of Lumbee and percentage of population with self-care disability in the United States with a correlation coefficient (R) of -0.098 and weighted average of 3.0%, a difference of 22.1%.
Self-Care Disability Correlation Summary
| Measurement | Dutch | Lumbee |
| Minimum | 0.69% | 0.94% |
| Maximum | 6.3% | 7.6% |
| Range | 5.7% | 6.7% |
| Mean | 2.4% | 3.8% |
| Median | 2.3% | 3.6% |
| Interquartile 25% (IQ1) | 1.6% | 2.9% |
| Interquartile 75% (IQ3) | 2.7% | 4.5% |
| Interquartile Range (IQR) | 1.1% | 1.6% |
| Standard Deviation (Sample) | 1.2% | 1.5% |
| Standard Deviation (Population) | 1.2% | 1.5% |
Similar Demographics by Self-Care Disability
Demographics Similar to Dutch by Self-Care Disability
In terms of self-care disability, the demographic groups most similar to Dutch are Romanian (2.4%, a difference of 0.11%), Arab (2.4%, a difference of 0.12%), Immigrants from Costa Rica (2.4%, a difference of 0.16%), Israeli (2.4%, a difference of 0.18%), and German (2.4%, a difference of 0.19%).
| Demographics | Rating | Rank | Self-Care Disability |
| Immigrants | Uruguay | 85.4 /100 | #140 | Excellent 2.4% |
| Alaska Natives | 84.5 /100 | #141 | Excellent 2.4% |
| Immigrants | Peru | 83.2 /100 | #142 | Excellent 2.4% |
| Afghans | 82.3 /100 | #143 | Excellent 2.4% |
| Costa Ricans | 80.8 /100 | #144 | Excellent 2.4% |
| Germans | 80.1 /100 | #145 | Excellent 2.4% |
| Israelis | 80.0 /100 | #146 | Good 2.4% |
| Dutch | 77.5 /100 | #147 | Good 2.4% |
| Romanians | 75.8 /100 | #148 | Good 2.4% |
| Arabs | 75.7 /100 | #149 | Good 2.4% |
| Immigrants | Costa Rica | 75.1 /100 | #150 | Good 2.4% |
| Basques | 74.0 /100 | #151 | Good 2.4% |
| Tlingit-Haida | 73.5 /100 | #152 | Good 2.4% |
| Immigrants | England | 73.5 /100 | #153 | Good 2.4% |
| Italians | 72.2 /100 | #154 | Good 2.4% |
Demographics Similar to Lumbee by Self-Care Disability
In terms of self-care disability, the demographic groups most similar to Lumbee are Nepalese (3.0%, a difference of 0.12%), Kiowa (3.0%, a difference of 0.36%), Dutch West Indian (3.0%, a difference of 0.59%), Houma (3.0%, a difference of 0.66%), and Immigrants from the Azores (3.0%, a difference of 0.71%).
| Demographics | Rating | Rank | Self-Care Disability |
| Cherokee | 0.0 /100 | #324 | Tragic 2.9% |
| Immigrants | Uzbekistan | 0.0 /100 | #325 | Tragic 2.9% |
| Paiute | 0.0 /100 | #326 | Tragic 2.9% |
| Blacks/African Americans | 0.0 /100 | #327 | Tragic 2.9% |
| Hopi | 0.0 /100 | #328 | Tragic 2.9% |
| Cajuns | 0.0 /100 | #329 | Tragic 2.9% |
| Nepalese | 0.0 /100 | #330 | Tragic 3.0% |
| Lumbee | 0.0 /100 | #331 | Tragic 3.0% |
| Kiowa | 0.0 /100 | #332 | Tragic 3.0% |
| Dutch West Indians | 0.0 /100 | #333 | Tragic 3.0% |
| Houma | 0.0 /100 | #334 | Tragic 3.0% |
| Immigrants | Azores | 0.0 /100 | #335 | Tragic 3.0% |
| Immigrants | Yemen | 0.0 /100 | #336 | Tragic 3.0% |
| Choctaw | 0.0 /100 | #337 | Tragic 3.0% |
| Cape Verdeans | 0.0 /100 | #338 | Tragic 3.0% |