Armenian vs Immigrants from Austria Self-Care Disability
COMPARE
Armenian
Immigrants from Austria
Self-Care Disability
Self-Care Disability Comparison
Armenians
Immigrants from Austria
3.4%
SELF-CARE DISABILITY
0.0/ 100
METRIC RATING
345th/ 347
METRIC RANK
2.4%
SELF-CARE DISABILITY
89.0/ 100
METRIC RATING
130th/ 347
METRIC RANK
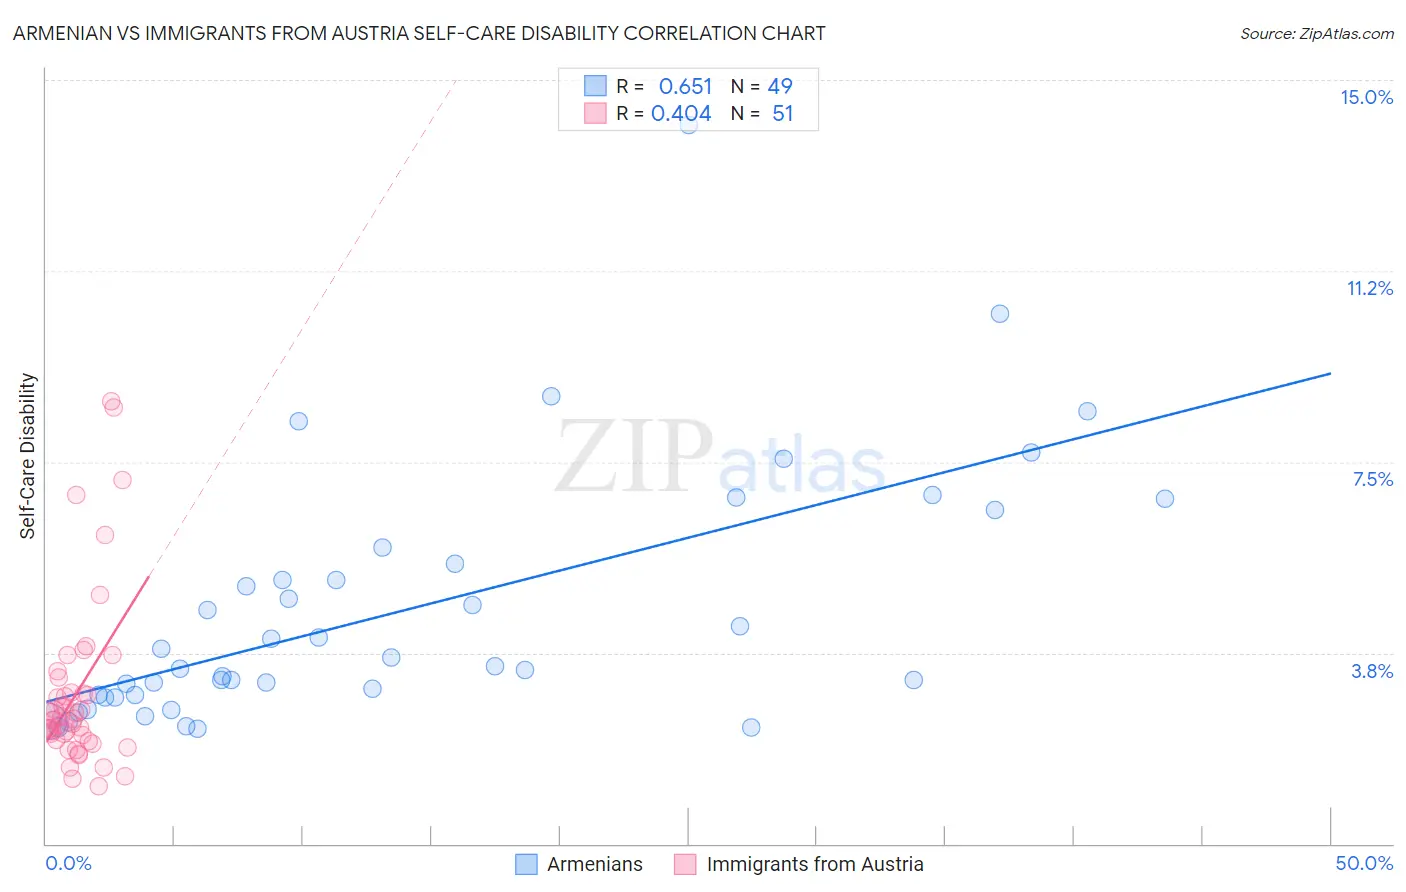
Armenian vs Immigrants from Austria Self-Care Disability Correlation Chart
The statistical analysis conducted on geographies consisting of 310,650,762 people shows a significant positive correlation between the proportion of Armenians and percentage of population with self-care disability in the United States with a correlation coefficient (R) of 0.651 and weighted average of 3.4%. Similarly, the statistical analysis conducted on geographies consisting of 167,909,652 people shows a moderate positive correlation between the proportion of Immigrants from Austria and percentage of population with self-care disability in the United States with a correlation coefficient (R) of 0.404 and weighted average of 2.4%, a difference of 41.6%.
Self-Care Disability Correlation Summary
| Measurement | Armenian | Immigrants from Austria |
| Minimum | 2.3% | 1.1% |
| Maximum | 14.1% | 8.7% |
| Range | 11.8% | 7.6% |
| Mean | 4.6% | 3.0% |
| Median | 3.5% | 2.4% |
| Interquartile 25% (IQ1) | 2.9% | 2.0% |
| Interquartile 75% (IQ3) | 5.7% | 3.0% |
| Interquartile Range (IQR) | 2.8% | 0.94% |
| Standard Deviation (Sample) | 2.5% | 1.7% |
| Standard Deviation (Population) | 2.4% | 1.7% |
Similar Demographics by Self-Care Disability
Demographics Similar to Armenians by Self-Care Disability
In terms of self-care disability, the demographic groups most similar to Armenians are Pueblo (3.3%, a difference of 4.5%), Puerto Rican (3.7%, a difference of 8.0%), Tohono O'odham (3.1%, a difference of 9.3%), Colville (3.1%, a difference of 9.4%), and Dominican (3.1%, a difference of 11.2%).
| Demographics | Rating | Rank | Self-Care Disability |
| Dutch West Indians | 0.0 /100 | #333 | Tragic 3.0% |
| Houma | 0.0 /100 | #334 | Tragic 3.0% |
| Immigrants | Azores | 0.0 /100 | #335 | Tragic 3.0% |
| Immigrants | Yemen | 0.0 /100 | #336 | Tragic 3.0% |
| Choctaw | 0.0 /100 | #337 | Tragic 3.0% |
| Cape Verdeans | 0.0 /100 | #338 | Tragic 3.0% |
| Immigrants | Dominican Republic | 0.0 /100 | #339 | Tragic 3.0% |
| Immigrants | Cabo Verde | 0.0 /100 | #340 | Tragic 3.1% |
| Dominicans | 0.0 /100 | #341 | Tragic 3.1% |
| Colville | 0.0 /100 | #342 | Tragic 3.1% |
| Tohono O'odham | 0.0 /100 | #343 | Tragic 3.1% |
| Pueblo | 0.0 /100 | #344 | Tragic 3.3% |
| Armenians | 0.0 /100 | #345 | Tragic 3.4% |
| Puerto Ricans | 0.0 /100 | #346 | Tragic 3.7% |
| Immigrants | Armenia | 0.0 /100 | #347 | Tragic 4.2% |
Demographics Similar to Immigrants from Austria by Self-Care Disability
In terms of self-care disability, the demographic groups most similar to Immigrants from Austria are Polish (2.4%, a difference of 0.020%), Immigrants from Romania (2.4%, a difference of 0.030%), Immigrants from South America (2.4%, a difference of 0.030%), Immigrants from Colombia (2.4%, a difference of 0.060%), and Colombian (2.4%, a difference of 0.080%).
| Demographics | Rating | Rank | Self-Care Disability |
| Immigrants | Nigeria | 90.3 /100 | #123 | Exceptional 2.4% |
| Immigrants | Morocco | 90.2 /100 | #124 | Exceptional 2.4% |
| Immigrants | North America | 90.2 /100 | #124 | Exceptional 2.4% |
| Hmong | 89.9 /100 | #126 | Excellent 2.4% |
| Colombians | 89.7 /100 | #127 | Excellent 2.4% |
| Immigrants | Hungary | 89.6 /100 | #128 | Excellent 2.4% |
| Immigrants | Romania | 89.3 /100 | #129 | Excellent 2.4% |
| Immigrants | Austria | 89.0 /100 | #130 | Excellent 2.4% |
| Poles | 88.9 /100 | #131 | Excellent 2.4% |
| Immigrants | South America | 88.8 /100 | #132 | Excellent 2.4% |
| Immigrants | Colombia | 88.5 /100 | #133 | Excellent 2.4% |
| Russians | 88.2 /100 | #134 | Excellent 2.4% |
| Laotians | 87.8 /100 | #135 | Excellent 2.4% |
| South American Indians | 87.2 /100 | #136 | Excellent 2.4% |
| Austrians | 87.0 /100 | #137 | Excellent 2.4% |