Armenian vs Immigrants from Trinidad and Tobago Self-Care Disability
COMPARE
Armenian
Immigrants from Trinidad and Tobago
Self-Care Disability
Self-Care Disability Comparison
Armenians
Immigrants from Trinidad and Tobago
3.4%
SELF-CARE DISABILITY
0.0/ 100
METRIC RATING
345th/ 347
METRIC RANK
2.7%
SELF-CARE DISABILITY
0.1/ 100
METRIC RATING
275th/ 347
METRIC RANK
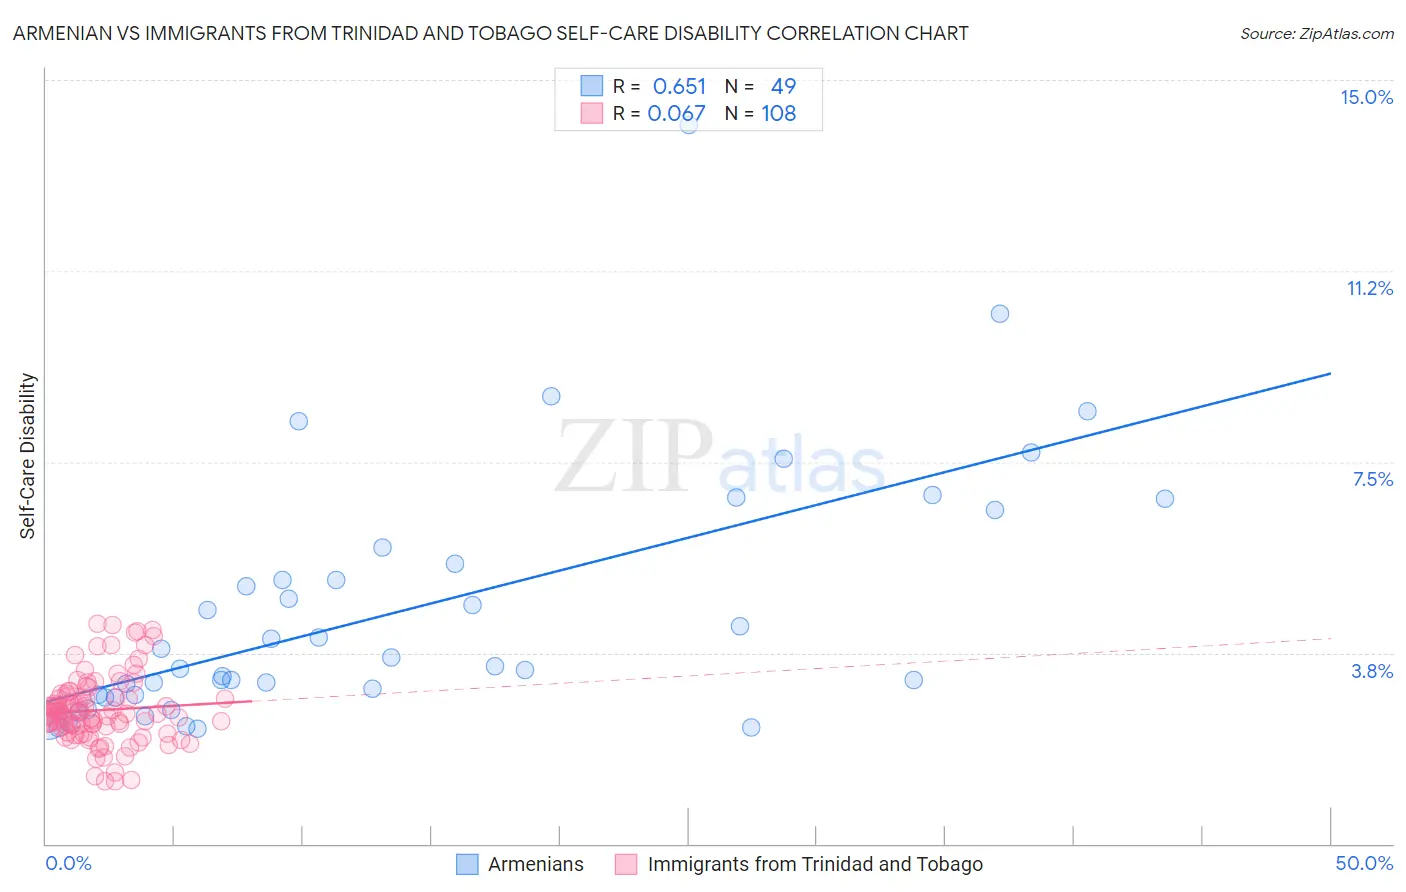
Armenian vs Immigrants from Trinidad and Tobago Self-Care Disability Correlation Chart
The statistical analysis conducted on geographies consisting of 310,650,762 people shows a significant positive correlation between the proportion of Armenians and percentage of population with self-care disability in the United States with a correlation coefficient (R) of 0.651 and weighted average of 3.4%. Similarly, the statistical analysis conducted on geographies consisting of 223,419,964 people shows a slight positive correlation between the proportion of Immigrants from Trinidad and Tobago and percentage of population with self-care disability in the United States with a correlation coefficient (R) of 0.067 and weighted average of 2.7%, a difference of 27.2%.
Self-Care Disability Correlation Summary
| Measurement | Armenian | Immigrants from Trinidad and Tobago |
| Minimum | 2.3% | 1.2% |
| Maximum | 14.1% | 4.3% |
| Range | 11.8% | 3.1% |
| Mean | 4.6% | 2.6% |
| Median | 3.5% | 2.6% |
| Interquartile 25% (IQ1) | 2.9% | 2.3% |
| Interquartile 75% (IQ3) | 5.7% | 2.9% |
| Interquartile Range (IQR) | 2.8% | 0.59% |
| Standard Deviation (Sample) | 2.5% | 0.66% |
| Standard Deviation (Population) | 2.4% | 0.66% |
Similar Demographics by Self-Care Disability
Demographics Similar to Armenians by Self-Care Disability
In terms of self-care disability, the demographic groups most similar to Armenians are Pueblo (3.3%, a difference of 4.5%), Puerto Rican (3.7%, a difference of 8.0%), Tohono O'odham (3.1%, a difference of 9.3%), Colville (3.1%, a difference of 9.4%), and Dominican (3.1%, a difference of 11.2%).
| Demographics | Rating | Rank | Self-Care Disability |
| Dutch West Indians | 0.0 /100 | #333 | Tragic 3.0% |
| Houma | 0.0 /100 | #334 | Tragic 3.0% |
| Immigrants | Azores | 0.0 /100 | #335 | Tragic 3.0% |
| Immigrants | Yemen | 0.0 /100 | #336 | Tragic 3.0% |
| Choctaw | 0.0 /100 | #337 | Tragic 3.0% |
| Cape Verdeans | 0.0 /100 | #338 | Tragic 3.0% |
| Immigrants | Dominican Republic | 0.0 /100 | #339 | Tragic 3.0% |
| Immigrants | Cabo Verde | 0.0 /100 | #340 | Tragic 3.1% |
| Dominicans | 0.0 /100 | #341 | Tragic 3.1% |
| Colville | 0.0 /100 | #342 | Tragic 3.1% |
| Tohono O'odham | 0.0 /100 | #343 | Tragic 3.1% |
| Pueblo | 0.0 /100 | #344 | Tragic 3.3% |
| Armenians | 0.0 /100 | #345 | Tragic 3.4% |
| Puerto Ricans | 0.0 /100 | #346 | Tragic 3.7% |
| Immigrants | Armenia | 0.0 /100 | #347 | Tragic 4.2% |
Demographics Similar to Immigrants from Trinidad and Tobago by Self-Care Disability
In terms of self-care disability, the demographic groups most similar to Immigrants from Trinidad and Tobago are Yakama (2.7%, a difference of 0.0%), Mexican (2.7%, a difference of 0.060%), Japanese (2.7%, a difference of 0.13%), Immigrants from Ukraine (2.7%, a difference of 0.19%), and Immigrants from Laos (2.7%, a difference of 0.20%).
| Demographics | Rating | Rank | Self-Care Disability |
| Immigrants | Mexico | 0.1 /100 | #268 | Tragic 2.7% |
| U.S. Virgin Islanders | 0.1 /100 | #269 | Tragic 2.7% |
| Immigrants | Micronesia | 0.1 /100 | #270 | Tragic 2.7% |
| Trinidadians and Tobagonians | 0.1 /100 | #271 | Tragic 2.7% |
| Immigrants | Laos | 0.1 /100 | #272 | Tragic 2.7% |
| Mexicans | 0.1 /100 | #273 | Tragic 2.7% |
| Yakama | 0.1 /100 | #274 | Tragic 2.7% |
| Immigrants | Trinidad and Tobago | 0.1 /100 | #275 | Tragic 2.7% |
| Japanese | 0.1 /100 | #276 | Tragic 2.7% |
| Immigrants | Ukraine | 0.1 /100 | #277 | Tragic 2.7% |
| Ottawa | 0.1 /100 | #278 | Tragic 2.7% |
| Iroquois | 0.1 /100 | #279 | Tragic 2.7% |
| Hispanics or Latinos | 0.1 /100 | #280 | Tragic 2.7% |
| Immigrants | Iraq | 0.0 /100 | #281 | Tragic 2.7% |
| Apache | 0.0 /100 | #282 | Tragic 2.7% |