Zip Codes with the Highest Percentage of Population with a Degree in Liberal Arts and History in Louisiana
RELATED REPORTS & OPTIONS
Liberal Arts and History
Louisiana
Compare Zip Codes
Map of Zip Codes with the Highest Percentage of Population with a Degree in Liberal Arts and History in Louisiana
0.0%
100.0%
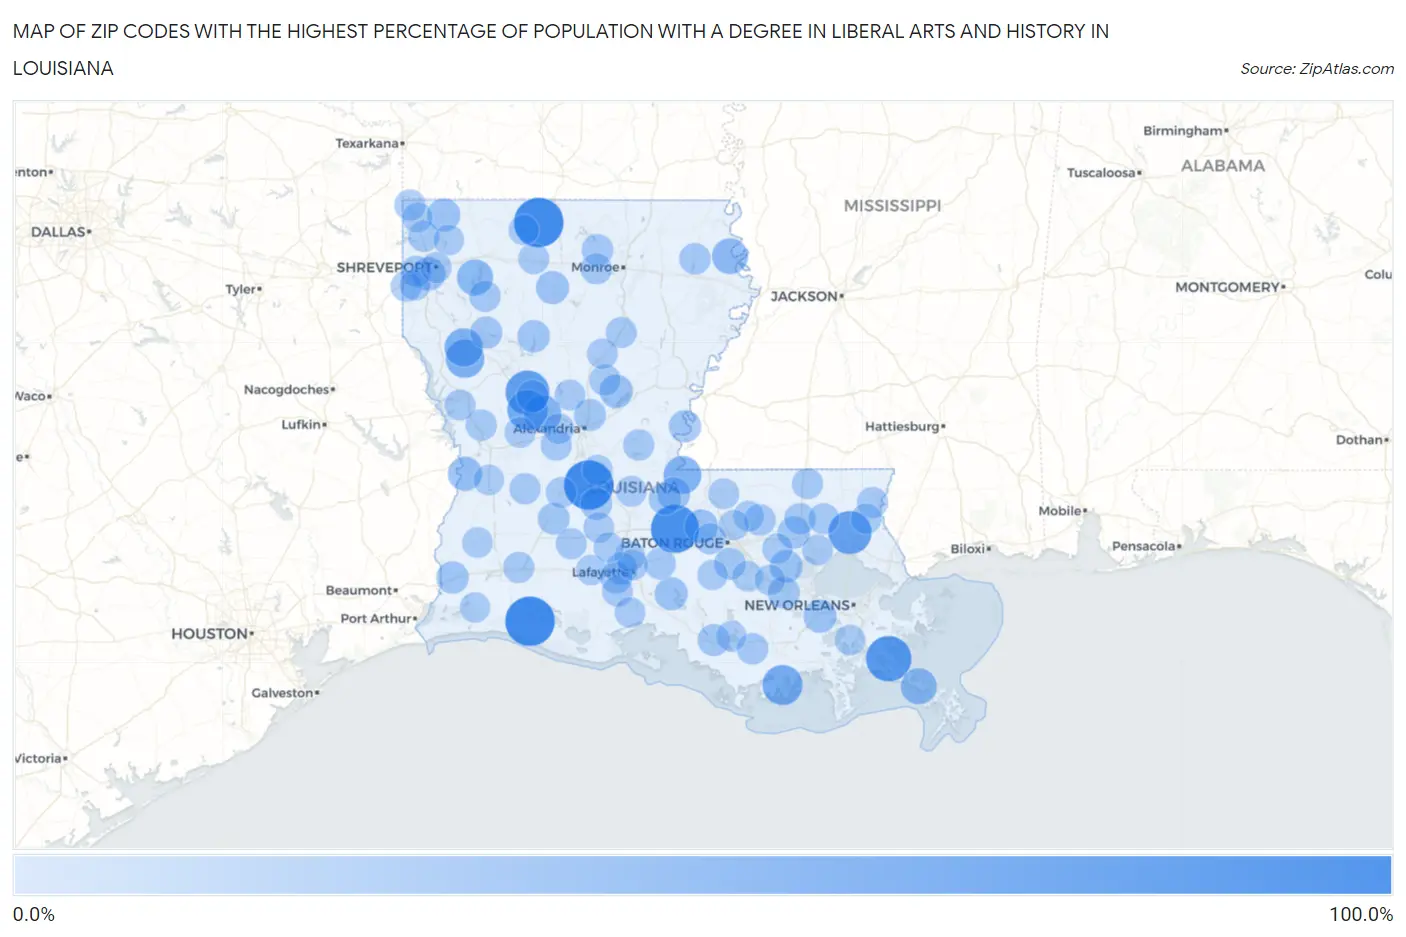
Zip Codes with the Highest Percentage of Population with a Degree in Liberal Arts and History in Louisiana
| Zip Code | % Graduates | vs State | vs National | |
| 1. | 70585 | 100.0% | 7.4% (+92.6)#1 | 4.9% (+95.1)#25 |
| 2. | 70632 | 100.0% | 7.4% (+92.6)#2 | 4.9% (+95.1)#27 |
| 3. | 71048 | 100.0% | 7.4% (+92.6)#3 | 4.9% (+95.1)#37 |
| 4. | 70756 | 92.6% | 7.4% (+85.1)#4 | 4.9% (+87.7)#52 |
| 5. | 70082 | 80.4% | 7.4% (+73.0)#5 | 4.9% (+75.6)#57 |
| 6. | 71452 | 73.1% | 7.4% (+65.6)#6 | 4.9% (+68.2)#72 |
| 7. | 70457 | 69.8% | 7.4% (+62.3)#7 | 4.9% (+64.9)#81 |
| 8. | 71434 | 56.2% | 7.4% (+48.8)#8 | 4.9% (+51.4)#116 |
| 9. | 70353 | 55.6% | 7.4% (+48.1)#9 | 4.9% (+50.7)#118 |
| 10. | 71065 | 48.3% | 7.4% (+40.8)#10 | 4.9% (+43.4)#180 |
| 11. | 71063 | 47.5% | 7.4% (+40.1)#11 | 4.9% (+42.6)#185 |
| 12. | 70712 | 44.4% | 7.4% (+36.9)#12 | 4.9% (+39.5)#205 |
| 13. | 71447 | 44.3% | 7.4% (+36.8)#13 | 4.9% (+39.4)#206 |
| 14. | 71023 | 37.0% | 7.4% (+29.5)#14 | 4.9% (+32.1)#279 |
| 15. | 70041 | 36.5% | 7.4% (+29.0)#15 | 4.9% (+31.6)#285 |
| 16. | 71276 | 35.9% | 7.4% (+28.4)#16 | 4.9% (+31.0)#302 |
| 17. | 70639 | 28.1% | 7.4% (+20.7)#17 | 4.9% (+23.3)#461 |
| 18. | 70752 | 25.0% | 7.4% (+17.6)#18 | 4.9% (+20.1)#572 |
| 19. | 71109 | 24.3% | 7.4% (+16.9)#19 | 4.9% (+19.4)#617 |
| 20. | 71342 | 24.3% | 7.4% (+16.8)#20 | 4.9% (+19.4)#618 |
| 21. | 70039 | 23.3% | 7.4% (+15.9)#21 | 4.9% (+18.5)#660 |
| 22. | 71064 | 23.2% | 7.4% (+15.8)#22 | 4.9% (+18.3)#667 |
| 23. | 71268 | 23.2% | 7.4% (+15.7)#23 | 4.9% (+18.3)#671 |
| 24. | 70552 | 22.8% | 7.4% (+15.4)#24 | 4.9% (+18.0)#689 |
| 25. | 70715 | 22.1% | 7.4% (+14.6)#25 | 4.9% (+17.2)#735 |
| 26. | 70449 | 21.6% | 7.4% (+14.1)#26 | 4.9% (+16.7)#763 |
| 27. | 70668 | 20.4% | 7.4% (+12.9)#27 | 4.9% (+15.5)#835 |
| 28. | 71031 | 20.2% | 7.4% (+12.7)#28 | 4.9% (+15.3)#845 |
| 29. | 70753 | 20.0% | 7.4% (+12.6)#29 | 4.9% (+15.1)#854 |
| 30. | 71416 | 19.5% | 7.4% (+12.1)#30 | 4.9% (+14.6)#899 |
| 31. | 71373 | 19.4% | 7.4% (+12.0)#31 | 4.9% (+14.5)#906 |
| 32. | 70711 | 19.3% | 7.4% (+11.9)#32 | 4.9% (+14.5)#915 |
| 33. | 71019 | 19.0% | 7.4% (+11.6)#33 | 4.9% (+14.2)#933 |
| 34. | 70392 | 18.2% | 7.4% (+10.8)#34 | 4.9% (+13.4)#1,002 |
| 35. | 70052 | 18.2% | 7.4% (+10.7)#35 | 4.9% (+13.3)#1,005 |
| 36. | 71405 | 17.9% | 7.4% (+10.5)#36 | 4.9% (+13.0)#1,045 |
| 37. | 70586 | 17.7% | 7.4% (+10.3)#37 | 4.9% (+12.9)#1,068 |
| 38. | 70583 | 17.7% | 7.4% (+10.2)#38 | 4.9% (+12.8)#1,070 |
| 39. | 70529 | 17.3% | 7.4% (+9.85)#39 | 4.9% (+12.4)#1,106 |
| 40. | 70655 | 17.0% | 7.4% (+9.57)#40 | 4.9% (+12.1)#1,127 |
| 41. | 70780 | 16.9% | 7.4% (+9.45)#41 | 4.9% (+12.0)#1,141 |
| 42. | 71234 | 16.4% | 7.4% (+8.95)#42 | 4.9% (+11.5)#1,202 |
| 43. | 70517 | 16.2% | 7.4% (+8.78)#43 | 4.9% (+11.4)#1,223 |
| 44. | 71237 | 16.1% | 7.4% (+8.68)#44 | 4.9% (+11.3)#1,237 |
| 45. | 70706 | 15.9% | 7.4% (+8.50)#45 | 4.9% (+11.1)#1,268 |
| 46. | 70356 | 15.9% | 7.4% (+8.42)#46 | 4.9% (+11.0)#1,274 |
| 47. | 71068 | 15.6% | 7.4% (+8.18)#47 | 4.9% (+10.8)#1,310 |
| 48. | 70443 | 15.1% | 7.4% (+7.70)#48 | 4.9% (+10.3)#1,395 |
| 49. | 71004 | 15.0% | 7.4% (+7.55)#49 | 4.9% (+10.1)#1,422 |
| 50. | 70656 | 14.9% | 7.4% (+7.47)#50 | 4.9% (+10.0)#1,440 |
| 51. | 71424 | 14.9% | 7.4% (+7.44)#51 | 4.9% (+10.0)#1,444 |
| 52. | 71439 | 14.9% | 7.4% (+7.43)#52 | 4.9% (+10.0)#1,445 |
| 53. | 70647 | 14.6% | 7.4% (+7.12)#53 | 4.9% (+9.70)#1,506 |
| 54. | 71119 | 14.5% | 7.4% (+7.08)#54 | 4.9% (+9.66)#1,520 |
| 55. | 71351 | 14.5% | 7.4% (+7.06)#55 | 4.9% (+9.63)#1,522 |
| 56. | 71371 | 14.4% | 7.4% (+6.92)#56 | 4.9% (+9.49)#1,543 |
| 57. | 71069 | 14.3% | 7.4% (+6.84)#57 | 4.9% (+9.41)#1,575 |
| 58. | 71225 | 14.0% | 7.4% (+6.59)#58 | 4.9% (+9.16)#1,630 |
| 59. | 70767 | 14.0% | 7.4% (+6.57)#59 | 4.9% (+9.15)#1,632 |
| 60. | 70515 | 14.0% | 7.4% (+6.57)#60 | 4.9% (+9.14)#1,634 |
| 61. | 70427 | 13.8% | 7.4% (+6.35)#61 | 4.9% (+8.92)#1,684 |
| 62. | 71007 | 13.8% | 7.4% (+6.35)#62 | 4.9% (+8.92)#1,686 |
| 63. | 70444 | 13.5% | 7.4% (+6.09)#63 | 4.9% (+8.67)#1,754 |
| 64. | 71449 | 13.5% | 7.4% (+6.04)#64 | 4.9% (+8.61)#1,771 |
| 65. | 70446 | 13.4% | 7.4% (+5.96)#65 | 4.9% (+8.54)#1,796 |
| 66. | 71435 | 13.3% | 7.4% (+5.86)#66 | 4.9% (+8.43)#1,829 |
| 67. | 71356 | 13.2% | 7.4% (+5.76)#67 | 4.9% (+8.34)#1,846 |
| 68. | 71001 | 13.1% | 7.4% (+5.66)#68 | 4.9% (+8.23)#1,877 |
| 69. | 71129 | 13.1% | 7.4% (+5.65)#69 | 4.9% (+8.22)#1,882 |
| 70. | 71463 | 13.1% | 7.4% (+5.61)#70 | 4.9% (+8.18)#1,892 |
| 71. | 71474 | 13.0% | 7.4% (+5.60)#71 | 4.9% (+8.17)#1,900 |
| 72. | 70555 | 12.9% | 7.4% (+5.43)#72 | 4.9% (+8.01)#1,945 |
| 73. | 70748 | 12.8% | 7.4% (+5.35)#73 | 4.9% (+7.92)#1,959 |
| 74. | 71423 | 12.5% | 7.4% (+5.05)#74 | 4.9% (+7.63)#2,031 |
| 75. | 70770 | 12.4% | 7.4% (+4.96)#75 | 4.9% (+7.54)#2,076 |
| 76. | 71480 | 12.3% | 7.4% (+4.83)#76 | 4.9% (+7.41)#2,110 |
| 77. | 70454 | 12.2% | 7.4% (+4.79)#77 | 4.9% (+7.37)#2,125 |
| 78. | 71409 | 12.2% | 7.4% (+4.78)#78 | 4.9% (+7.35)#2,126 |
| 79. | 70633 | 12.0% | 7.4% (+4.57)#79 | 4.9% (+7.14)#2,201 |
| 80. | 70524 | 11.9% | 7.4% (+4.46)#80 | 4.9% (+7.03)#2,239 |
| 81. | 71101 | 11.8% | 7.4% (+4.40)#81 | 4.9% (+6.97)#2,252 |
| 82. | 70507 | 11.7% | 7.4% (+4.22)#82 | 4.9% (+6.79)#2,312 |
| 83. | 71006 | 11.6% | 7.4% (+4.20)#83 | 4.9% (+6.77)#2,315 |
| 84. | 70533 | 11.5% | 7.4% (+4.05)#84 | 4.9% (+6.62)#2,362 |
| 85. | 70754 | 11.5% | 7.4% (+4.03)#85 | 4.9% (+6.61)#2,364 |
| 86. | 70734 | 11.5% | 7.4% (+4.00)#86 | 4.9% (+6.58)#2,371 |
| 87. | 70431 | 11.4% | 7.4% (+3.98)#87 | 4.9% (+6.56)#2,378 |
| 88. | 70067 | 11.4% | 7.4% (+3.96)#88 | 4.9% (+6.53)#2,394 |
| 89. | 70659 | 11.3% | 7.4% (+3.84)#89 | 4.9% (+6.42)#2,439 |
| 90. | 70645 | 11.2% | 7.4% (+3.76)#90 | 4.9% (+6.33)#2,473 |
| 91. | 70778 | 11.2% | 7.4% (+3.76)#91 | 4.9% (+6.33)#2,475 |
| 92. | 70380 | 11.2% | 7.4% (+3.72)#92 | 4.9% (+6.30)#2,486 |
| 93. | 70520 | 11.1% | 7.4% (+3.67)#93 | 4.9% (+6.24)#2,498 |
| 94. | 71040 | 11.0% | 7.4% (+3.58)#94 | 4.9% (+6.16)#2,546 |
| 95. | 70526 | 11.0% | 7.4% (+3.53)#95 | 4.9% (+6.10)#2,569 |
| 96. | 71325 | 10.8% | 7.4% (+3.40)#96 | 4.9% (+5.97)#2,624 |
| 97. | 70714 | 10.6% | 7.4% (+3.19)#97 | 4.9% (+5.77)#2,734 |
| 98. | 71043 | 10.6% | 7.4% (+3.19)#98 | 4.9% (+5.77)#2,738 |
| 99. | 70764 | 10.6% | 7.4% (+3.17)#99 | 4.9% (+5.74)#2,753 |
| 100. | 70525 | 10.5% | 7.4% (+3.08)#100 | 4.9% (+5.66)#2,797 |
Common Questions
What are the Top 10 Zip Codes with the Highest Percentage of Population with a Degree in Liberal Arts and History in Louisiana?
Top 10 Zip Codes with the Highest Percentage of Population with a Degree in Liberal Arts and History in Louisiana are:
What zip code has the Highest Percentage of Population with a Degree in Liberal Arts and History in Louisiana?
70585 has the Highest Percentage of Population with a Degree in Liberal Arts and History in Louisiana with 100.0%.
What is the Percentage of Population with a Degree in Liberal Arts and History in the State of Louisiana?
Percentage of Population with a Degree in Liberal Arts and History in Louisiana is 7.4%.
What is the Percentage of Population with a Degree in Liberal Arts and History in the United States?
Percentage of Population with a Degree in Liberal Arts and History in the United States is 4.9%.