Zip Codes with the Highest Percentage of Population with a Degree in Liberal Arts and History in Alaska
RELATED REPORTS & OPTIONS
Liberal Arts and History
Alaska
Compare Zip Codes
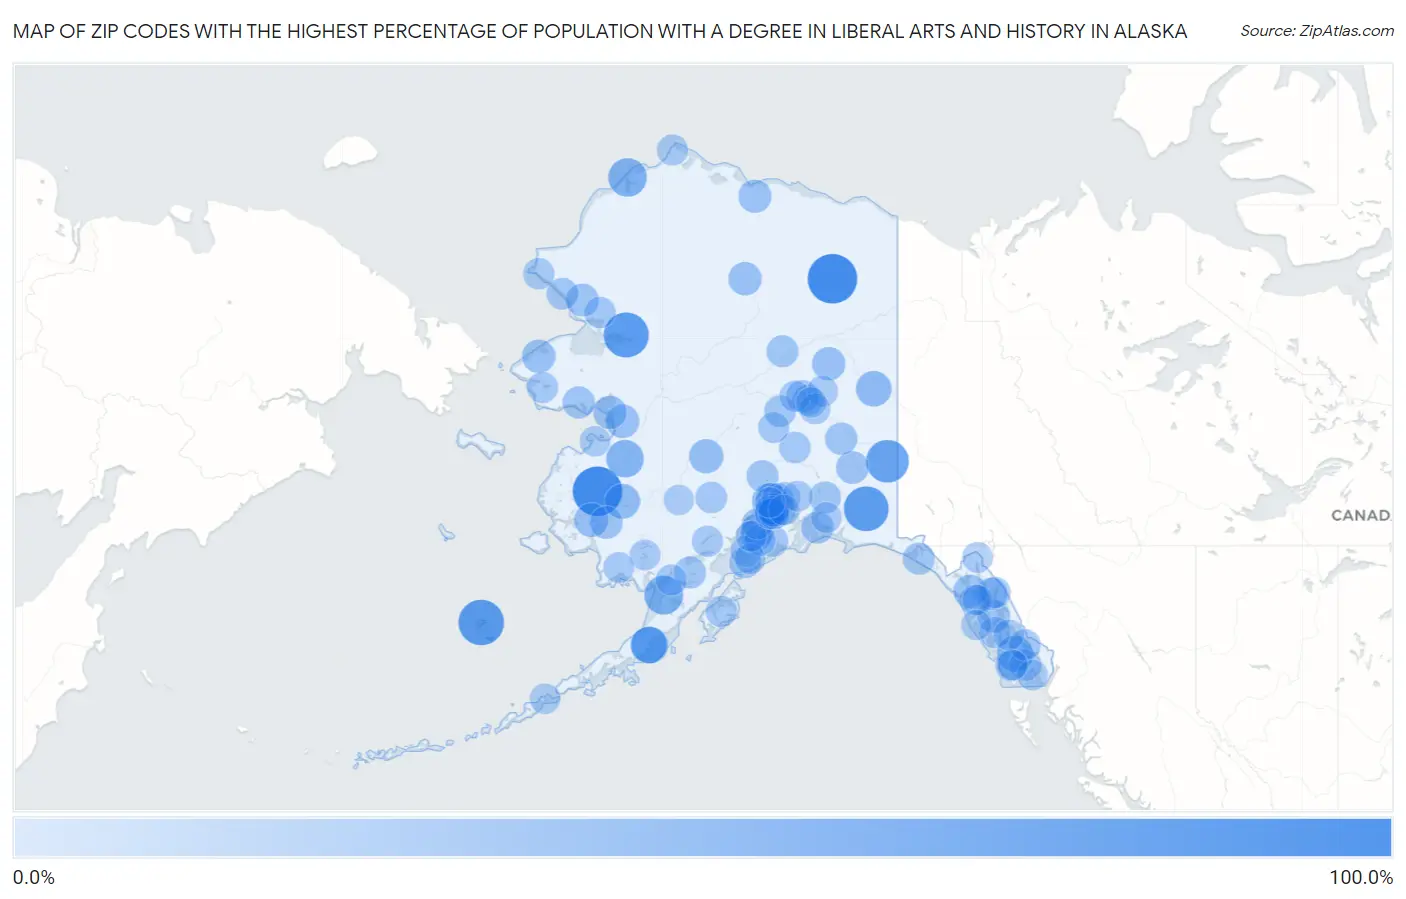
Map of Zip Codes with the Highest Percentage of Population with a Degree in Liberal Arts and History in Alaska
0.0%
100.0%
Zip Codes with the Highest Percentage of Population with a Degree in Liberal Arts and History in Alaska
| Zip Code | % Graduates | vs State | vs National | |
| 1. | 99585 | 100.0% | 5.6%(+94.4)#1 | 4.9%(+95.1)#29 |
| 2. | 99722 | 100.0% | 5.6%(+94.4)#2 | 4.9%(+95.1)#30 |
| 3. | 99660 | 79.2% | 5.6%(+73.5)#3 | 4.9%(+74.3)#60 |
| 4. | 99770 | 76.2% | 5.6%(+70.6)#4 | 4.9%(+71.3)#65 |
| 5. | 99566 | 75.0% | 5.6%(+69.4)#5 | 4.9%(+70.1)#68 |
| 6. | 99764 | 64.3% | 5.6%(+58.6)#6 | 4.9%(+59.4)#89 |
| 7. | 99579 | 44.4% | 5.6%(+38.8)#7 | 4.9%(+39.6)#204 |
| 8. | 99782 | 42.9% | 5.6%(+37.2)#8 | 4.9%(+38.0)#220 |
| 9. | 99590 | 37.5% | 5.6%(+31.9)#9 | 4.9%(+32.6)#271 |
| 10. | 99564 | 33.3% | 5.6%(+27.7)#10 | 4.9%(+28.5)#361 |
| 11. | 99565 | 33.3% | 5.6%(+27.7)#11 | 4.9%(+28.5)#362 |
| 12. | 99652 | 30.6% | 5.6%(+24.9)#12 | 4.9%(+25.7)#408 |
| 13. | 99918 | 30.4% | 5.6%(+24.8)#13 | 4.9%(+25.6)#409 |
| 14. | 99738 | 27.8% | 5.6%(+22.1)#14 | 4.9%(+22.9)#473 |
| 15. | 99607 | 25.0% | 5.6%(+19.4)#15 | 4.9%(+20.1)#583 |
| 16. | 99627 | 21.2% | 5.6%(+15.6)#16 | 4.9%(+16.3)#785 |
| 17. | 99609 | 20.0% | 5.6%(+14.4)#17 | 4.9%(+15.1)#859 |
| 18. | 99684 | 18.3% | 5.6%(+12.7)#18 | 4.9%(+13.5)#994 |
| 19. | 99772 | 17.2% | 5.6%(+11.6)#19 | 4.9%(+12.4)#1,110 |
| 20. | 99771 | 16.7% | 5.6%(+11.0)#20 | 4.9%(+11.8)#1,165 |
| 21. | 99721 | 16.7% | 5.6%(+11.0)#21 | 4.9%(+11.8)#1,169 |
| 22. | 99730 | 16.7% | 5.6%(+11.0)#22 | 4.9%(+11.8)#1,175 |
| 23. | 99826 | 16.1% | 5.6%(+10.5)#23 | 4.9%(+11.2)#1,243 |
| 24. | 99789 | 15.1% | 5.6%(+9.43)#24 | 4.9%(+10.2)#1,407 |
| 25. | 99621 | 14.3% | 5.6%(+8.65)#25 | 4.9%(+9.41)#1,571 |
| 26. | 99761 | 14.3% | 5.6%(+8.65)#26 | 4.9%(+9.41)#1,573 |
| 27. | 99820 | 14.3% | 5.6%(+8.65)#27 | 4.9%(+9.41)#1,578 |
| 28. | 99586 | 13.5% | 5.6%(+7.85)#28 | 4.9%(+8.61)#1,773 |
| 29. | 99672 | 12.8% | 5.6%(+7.16)#29 | 4.9%(+7.92)#1,960 |
| 30. | 99737 | 11.6% | 5.6%(+5.97)#30 | 4.9%(+6.74)#2,329 |
| 31. | 99925 | 11.6% | 5.6%(+5.96)#31 | 4.9%(+6.72)#2,332 |
| 32. | 99703 | 11.5% | 5.6%(+5.86)#32 | 4.9%(+6.63)#2,361 |
| 33. | 99784 | 11.1% | 5.6%(+5.47)#33 | 4.9%(+6.24)#2,522 |
| 34. | 99574 | 11.1% | 5.6%(+5.44)#34 | 4.9%(+6.21)#2,530 |
| 35. | 99689 | 10.2% | 5.6%(+4.57)#35 | 4.9%(+5.33)#2,997 |
| 36. | 99824 | 10.0% | 5.6%(+4.39)#36 | 4.9%(+5.15)#3,088 |
| 37. | 99613 | 9.9% | 5.6%(+4.25)#37 | 4.9%(+5.02)#3,173 |
| 38. | 99683 | 9.7% | 5.6%(+4.08)#38 | 4.9%(+4.85)#3,290 |
| 39. | 99573 | 9.6% | 5.6%(+4.01)#39 | 4.9%(+4.78)#3,336 |
| 40. | 99701 | 9.6% | 5.6%(+3.92)#40 | 4.9%(+4.69)#3,403 |
| 41. | 99750 | 9.1% | 5.6%(+3.45)#41 | 4.9%(+4.22)#3,764 |
| 42. | 99760 | 8.8% | 5.6%(+3.19)#42 | 4.9%(+3.95)#4,004 |
| 43. | 99830 | 8.5% | 5.6%(+2.84)#43 | 4.9%(+3.60)#4,360 |
| 44. | 99502 | 8.3% | 5.6%(+2.65)#44 | 4.9%(+3.42)#4,561 |
| 45. | 99518 | 8.1% | 5.6%(+2.47)#45 | 4.9%(+3.24)#4,765 |
| 46. | 99729 | 8.0% | 5.6%(+2.36)#46 | 4.9%(+3.13)#4,902 |
| 47. | 99669 | 8.0% | 5.6%(+2.34)#47 | 4.9%(+3.10)#4,924 |
| 48. | 99663 | 7.9% | 5.6%(+2.23)#48 | 4.9%(+2.99)#5,080 |
| 49. | 99694 | 7.8% | 5.6%(+2.15)#49 | 4.9%(+2.91)#5,196 |
| 50. | 99503 | 7.6% | 5.6%(+1.99)#50 | 4.9%(+2.76)#5,391 |
| 51. | 99664 | 7.6% | 5.6%(+1.92)#51 | 4.9%(+2.69)#5,496 |
| 52. | 99556 | 7.5% | 5.6%(+1.88)#52 | 4.9%(+2.64)#5,563 |
| 53. | 99501 | 7.4% | 5.6%(+1.77)#53 | 4.9%(+2.54)#5,721 |
| 54. | 99901 | 7.3% | 5.6%(+1.63)#54 | 4.9%(+2.40)#5,935 |
| 55. | 99929 | 7.2% | 5.6%(+1.57)#55 | 4.9%(+2.34)#6,034 |
| 56. | 99752 | 7.0% | 5.6%(+1.34)#56 | 4.9%(+2.10)#6,440 |
| 57. | 99508 | 6.9% | 5.6%(+1.27)#57 | 4.9%(+2.03)#6,546 |
| 58. | 99568 | 6.7% | 5.6%(+1.10)#58 | 4.9%(+1.87)#6,855 |
| 59. | 99507 | 6.5% | 5.6%(+0.889)#59 | 4.9%(+1.65)#7,287 |
| 60. | 99801 | 6.2% | 5.6%(+0.568)#60 | 4.9%(+1.33)#8,013 |
| 61. | 99611 | 6.1% | 5.6%(+0.506)#61 | 4.9%(+1.27)#8,156 |
| 62. | 99766 | 5.9% | 5.6%(+0.245)#62 | 4.9%(+1.01)#8,826 |
| 63. | 99577 | 5.8% | 5.6%(+0.186)#63 | 4.9%(+0.951)#8,982 |
| 64. | 99723 | 5.5% | 5.6%(-0.095)#64 | 4.9%(+0.671)#9,743 |
| 65. | 99505 | 5.5% | 5.6%(-0.138)#65 | 4.9%(+0.627)#9,871 |
| 66. | 99762 | 5.5% | 5.6%(-0.173)#66 | 4.9%(+0.592)#9,966 |
| 67. | 99506 | 5.4% | 5.6%(-0.235)#67 | 4.9%(+0.530)#10,126 |
| 68. | 99633 | 5.4% | 5.6%(-0.261)#68 | 4.9%(+0.504)#10,190 |
| 69. | 99653 | 5.3% | 5.6%(-0.374)#69 | 4.9%(+0.391)#10,563 |
| 70. | 99743 | 5.2% | 5.6%(-0.483)#70 | 4.9%(+0.282)#10,861 |
| 71. | 99615 | 5.1% | 5.6%(-0.509)#71 | 4.9%(+0.256)#10,933 |
| 72. | 99517 | 4.9% | 5.6%(-0.738)#72 | 4.9%(+0.027)#11,643 |
| 73. | 99705 | 4.8% | 5.6%(-0.880)#73 | 4.9%(-0.115)#12,136 |
| 74. | 99709 | 4.7% | 5.6%(-0.907)#74 | 4.9%(-0.142)#12,225 |
| 75. | 99603 | 4.6% | 5.6%(-0.994)#75 | 4.9%(-0.229)#12,506 |
| 76. | 99654 | 4.5% | 5.6%(-1.10)#76 | 4.9%(-0.337)#12,869 |
| 77. | 99645 | 4.4% | 5.6%(-1.29)#77 | 4.9%(-0.522)#13,446 |
| 78. | 99833 | 4.3% | 5.6%(-1.31)#78 | 4.9%(-0.544)#13,543 |
| 79. | 99712 | 4.3% | 5.6%(-1.37)#79 | 4.9%(-0.603)#13,741 |
| 80. | 99841 | 4.1% | 5.6%(-1.56)#80 | 4.9%(-0.791)#14,474 |
| 81. | 99714 | 4.0% | 5.6%(-1.61)#81 | 4.9%(-0.843)#14,665 |
| 82. | 99610 | 4.0% | 5.6%(-1.65)#82 | 4.9%(-0.882)#14,831 |
| 83. | 99516 | 3.8% | 5.6%(-1.79)#83 | 4.9%(-1.02)#15,334 |
| 84. | 99576 | 3.7% | 5.6%(-1.91)#84 | 4.9%(-1.15)#15,795 |
| 85. | 99515 | 3.7% | 5.6%(-1.92)#85 | 4.9%(-1.15)#15,824 |
| 86. | 99926 | 3.7% | 5.6%(-1.93)#86 | 4.9%(-1.17)#15,880 |
| 87. | 99504 | 3.6% | 5.6%(-2.02)#87 | 4.9%(-1.25)#16,174 |
| 88. | 99678 | 3.6% | 5.6%(-2.07)#88 | 4.9%(-1.30)#16,336 |
| 89. | 99840 | 3.4% | 5.6%(-2.25)#89 | 4.9%(-1.48)#16,999 |
| 90. | 99567 | 3.3% | 5.6%(-2.32)#90 | 4.9%(-1.56)#17,269 |
| 91. | 99686 | 3.2% | 5.6%(-2.46)#91 | 4.9%(-1.69)#17,735 |
| 92. | 99674 | 3.1% | 5.6%(-2.55)#92 | 4.9%(-1.79)#18,052 |
| 93. | 99623 | 2.9% | 5.6%(-2.71)#93 | 4.9%(-1.94)#18,600 |
| 94. | 99553 | 2.5% | 5.6%(-3.14)#94 | 4.9%(-2.37)#19,975 |
| 95. | 99671 | 2.5% | 5.6%(-3.14)#95 | 4.9%(-2.37)#19,980 |
| 96. | 99921 | 2.5% | 5.6%(-3.14)#96 | 4.9%(-2.38)#20,004 |
| 97. | 99702 | 2.3% | 5.6%(-3.36)#97 | 4.9%(-2.60)#20,608 |
| 98. | 99557 | 2.1% | 5.6%(-3.51)#98 | 4.9%(-2.74)#21,019 |
| 99. | 99829 | 2.0% | 5.6%(-3.60)#99 | 4.9%(-2.83)#21,274 |
| 100. | 99835 | 1.9% | 5.6%(-3.70)#100 | 4.9%(-2.93)#21,527 |
Common Questions
What are the Top 10 Zip Codes with the Highest Percentage of Population with a Degree in Liberal Arts and History in Alaska?
Top 10 Zip Codes with the Highest Percentage of Population with a Degree in Liberal Arts and History in Alaska are:
What zip code has the Highest Percentage of Population with a Degree in Liberal Arts and History in Alaska?
99585 has the Highest Percentage of Population with a Degree in Liberal Arts and History in Alaska with 100.0%.
What is the Percentage of Population with a Degree in Liberal Arts and History in the State of Alaska?
Percentage of Population with a Degree in Liberal Arts and History in Alaska is 5.6%.
What is the Percentage of Population with a Degree in Liberal Arts and History in the United States?
Percentage of Population with a Degree in Liberal Arts and History in the United States is 4.9%.