Zip Codes with the Highest Percentage of Population with a Degree in Liberal Arts and History in Oregon
RELATED REPORTS & OPTIONS
Liberal Arts and History
Oregon
Compare Zip Codes
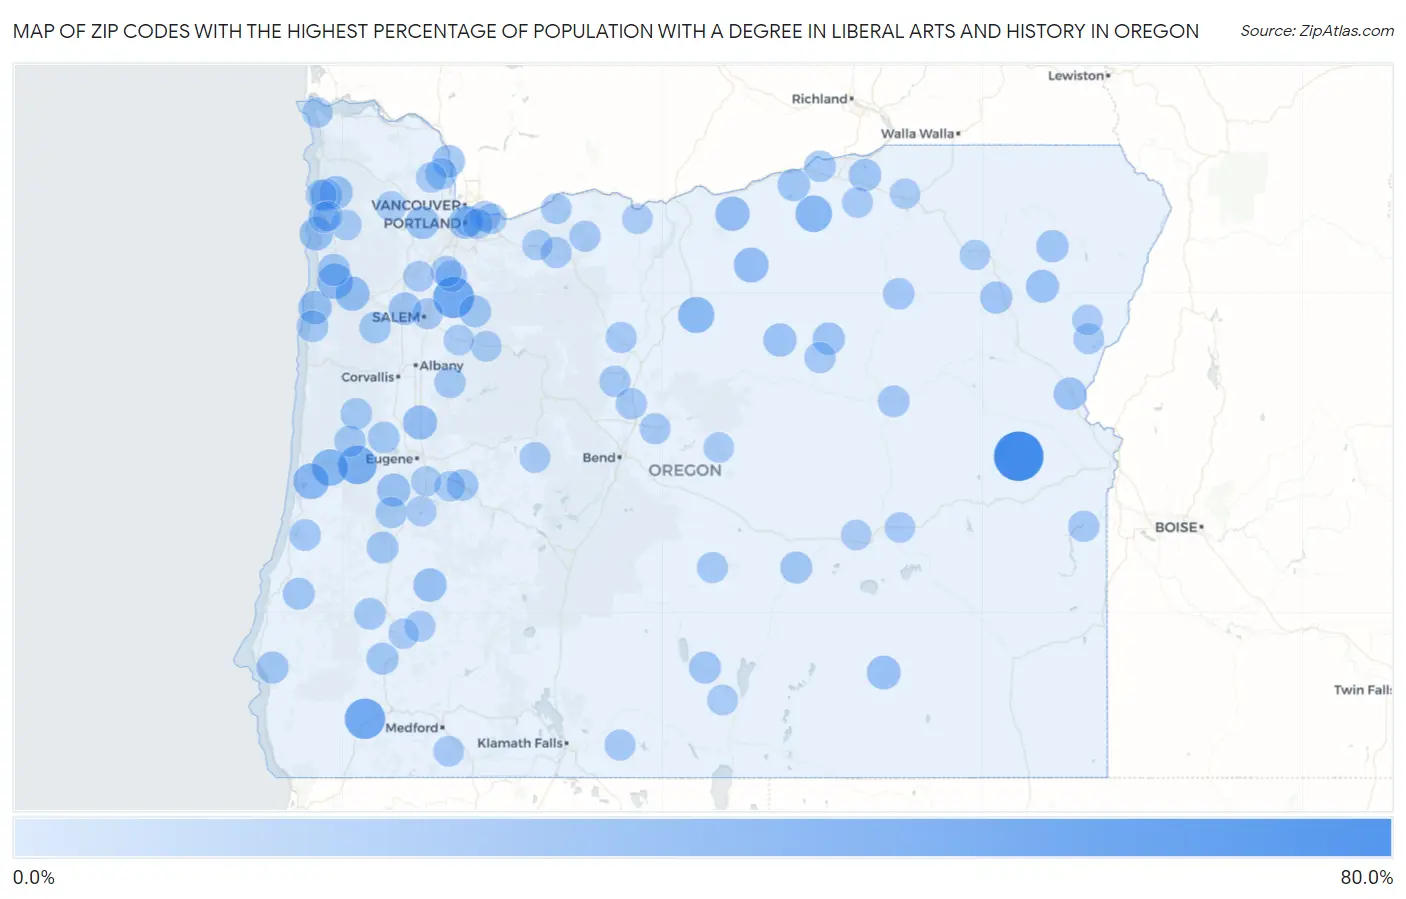
Map of Zip Codes with the Highest Percentage of Population with a Degree in Liberal Arts and History in Oregon
0.0%
80.0%
Zip Codes with the Highest Percentage of Population with a Degree in Liberal Arts and History in Oregon
| Zip Code | % Graduates | vs State | vs National | |
| 1. | 97920 | 75.0% | 6.1%(+68.9)#1 | 4.9%(+70.1)#69 |
| 2. | 97373 | 44.8% | 6.1%(+38.7)#2 | 4.9%(+39.9)#201 |
| 3. | 97543 | 43.3% | 6.1%(+37.2)#3 | 4.9%(+38.4)#215 |
| 4. | 97490 | 36.4% | 6.1%(+30.3)#4 | 4.9%(+31.5)#287 |
| 5. | 97839 | 29.6% | 6.1%(+23.6)#5 | 4.9%(+24.8)#426 |
| 6. | 97453 | 29.3% | 6.1%(+23.3)#6 | 4.9%(+24.5)#434 |
| 7. | 97001 | 28.1% | 6.1%(+22.0)#7 | 4.9%(+23.2)#463 |
| 8. | 97493 | 27.0% | 6.1%(+20.9)#8 | 4.9%(+22.1)#500 |
| 9. | 97122 | 26.5% | 6.1%(+20.4)#9 | 4.9%(+21.6)#517 |
| 10. | 97823 | 23.5% | 6.1%(+17.4)#10 | 4.9%(+18.6)#656 |
| 11. | 97812 | 22.3% | 6.1%(+16.2)#11 | 4.9%(+17.4)#716 |
| 12. | 97446 | 21.4% | 6.1%(+15.4)#12 | 4.9%(+16.6)#768 |
| 13. | 97347 | 21.3% | 6.1%(+15.3)#13 | 4.9%(+16.5)#778 |
| 14. | 97736 | 20.0% | 6.1%(+13.9)#14 | 4.9%(+15.1)#869 |
| 15. | 97134 | 19.4% | 6.1%(+13.3)#15 | 4.9%(+14.5)#908 |
| 16. | 97364 | 18.9% | 6.1%(+12.8)#16 | 4.9%(+14.0)#946 |
| 17. | 97443 | 18.8% | 6.1%(+12.7)#17 | 4.9%(+13.9)#951 |
| 18. | 97874 | 18.6% | 6.1%(+12.5)#18 | 4.9%(+13.7)#970 |
| 19. | 97451 | 18.2% | 6.1%(+12.1)#19 | 4.9%(+13.3)#1,007 |
| 20. | 97131 | 18.0% | 6.1%(+12.0)#20 | 4.9%(+13.2)#1,032 |
| 21. | 97113 | 18.0% | 6.1%(+12.0)#21 | 4.9%(+13.2)#1,033 |
| 22. | 97883 | 17.8% | 6.1%(+11.7)#22 | 4.9%(+12.9)#1,064 |
| 23. | 97907 | 16.4% | 6.1%(+10.3)#23 | 4.9%(+11.5)#1,199 |
| 24. | 97204 | 16.2% | 6.1%(+10.1)#24 | 4.9%(+11.3)#1,231 |
| 25. | 97371 | 16.1% | 6.1%(+10.1)#25 | 4.9%(+11.3)#1,238 |
| 26. | 97018 | 16.0% | 6.1%(+9.97)#26 | 4.9%(+11.2)#1,254 |
| 27. | 97875 | 15.8% | 6.1%(+9.74)#27 | 4.9%(+10.9)#1,281 |
| 28. | 97818 | 15.6% | 6.1%(+9.49)#28 | 4.9%(+10.7)#1,320 |
| 29. | 97864 | 15.4% | 6.1%(+9.31)#29 | 4.9%(+10.5)#1,354 |
| 30. | 97857 | 15.3% | 6.1%(+9.24)#30 | 4.9%(+10.5)#1,367 |
| 31. | 97112 | 15.3% | 6.1%(+9.18)#31 | 4.9%(+10.4)#1,377 |
| 32. | 97867 | 15.1% | 6.1%(+9.05)#32 | 4.9%(+10.3)#1,400 |
| 33. | 97147 | 15.0% | 6.1%(+8.89)#33 | 4.9%(+10.1)#1,429 |
| 34. | 97636 | 14.7% | 6.1%(+8.59)#34 | 4.9%(+9.79)#1,482 |
| 35. | 97465 | 14.6% | 6.1%(+8.50)#35 | 4.9%(+9.71)#1,505 |
| 36. | 97375 | 14.4% | 6.1%(+8.28)#36 | 4.9%(+9.49)#1,545 |
| 37. | 97442 | 14.3% | 6.1%(+8.25)#37 | 4.9%(+9.46)#1,550 |
| 38. | 97758 | 14.3% | 6.1%(+8.21)#38 | 4.9%(+9.41)#1,589 |
| 39. | 97423 | 13.8% | 6.1%(+7.68)#39 | 4.9%(+8.89)#1,697 |
| 40. | 97462 | 13.5% | 6.1%(+7.43)#40 | 4.9%(+8.64)#1,767 |
| 41. | 97449 | 13.2% | 6.1%(+7.11)#41 | 4.9%(+8.31)#1,853 |
| 42. | 97388 | 13.2% | 6.1%(+7.10)#42 | 4.9%(+8.31)#1,854 |
| 43. | 97496 | 13.1% | 6.1%(+7.03)#43 | 4.9%(+8.24)#1,874 |
| 44. | 97053 | 13.0% | 6.1%(+6.97)#44 | 4.9%(+8.17)#1,895 |
| 45. | 97845 | 13.0% | 6.1%(+6.92)#45 | 4.9%(+8.12)#1,910 |
| 46. | 97419 | 12.8% | 6.1%(+6.68)#46 | 4.9%(+7.88)#1,971 |
| 47. | 97844 | 12.6% | 6.1%(+6.55)#47 | 4.9%(+7.76)#2,005 |
| 48. | 97452 | 12.5% | 6.1%(+6.42)#48 | 4.9%(+7.63)#2,037 |
| 49. | 97880 | 12.5% | 6.1%(+6.42)#49 | 4.9%(+7.63)#2,049 |
| 50. | 97344 | 12.4% | 6.1%(+6.28)#50 | 4.9%(+7.49)#2,093 |
| 51. | 97324 | 12.3% | 6.1%(+6.24)#51 | 4.9%(+7.45)#2,103 |
| 52. | 97032 | 12.3% | 6.1%(+6.23)#52 | 4.9%(+7.44)#2,105 |
| 53. | 97430 | 12.2% | 6.1%(+6.08)#53 | 4.9%(+7.29)#2,151 |
| 54. | 97848 | 12.0% | 6.1%(+5.92)#54 | 4.9%(+7.13)#2,211 |
| 55. | 97734 | 12.0% | 6.1%(+5.90)#55 | 4.9%(+7.10)#2,214 |
| 56. | 97760 | 12.0% | 6.1%(+5.89)#56 | 4.9%(+7.10)#2,217 |
| 57. | 97913 | 11.5% | 6.1%(+5.43)#57 | 4.9%(+6.63)#2,357 |
| 58. | 97435 | 11.4% | 6.1%(+5.32)#58 | 4.9%(+6.53)#2,397 |
| 59. | 97355 | 11.3% | 6.1%(+5.21)#59 | 4.9%(+6.42)#2,443 |
| 60. | 97761 | 11.3% | 6.1%(+5.19)#60 | 4.9%(+6.40)#2,447 |
| 61. | 97641 | 10.9% | 6.1%(+4.87)#61 | 4.9%(+6.08)#2,585 |
| 62. | 97753 | 10.9% | 6.1%(+4.86)#62 | 4.9%(+6.07)#2,590 |
| 63. | 97623 | 10.9% | 6.1%(+4.84)#63 | 4.9%(+6.05)#2,600 |
| 64. | 97041 | 10.8% | 6.1%(+4.69)#64 | 4.9%(+5.89)#2,657 |
| 65. | 97429 | 10.7% | 6.1%(+4.64)#65 | 4.9%(+5.84)#2,686 |
| 66. | 97049 | 10.7% | 6.1%(+4.62)#66 | 4.9%(+5.82)#2,700 |
| 67. | 97301 | 10.6% | 6.1%(+4.52)#67 | 4.9%(+5.73)#2,765 |
| 68. | 97130 | 10.5% | 6.1%(+4.44)#68 | 4.9%(+5.64)#2,811 |
| 69. | 97413 | 10.4% | 6.1%(+4.33)#69 | 4.9%(+5.54)#2,860 |
| 70. | 97020 | 10.3% | 6.1%(+4.27)#70 | 4.9%(+5.47)#2,892 |
| 71. | 97630 | 10.2% | 6.1%(+4.14)#71 | 4.9%(+5.35)#2,987 |
| 72. | 97118 | 10.2% | 6.1%(+4.11)#72 | 4.9%(+5.31)#3,005 |
| 73. | 97360 | 10.1% | 6.1%(+4.02)#73 | 4.9%(+5.23)#3,059 |
| 74. | 97114 | 10.0% | 6.1%(+3.94)#74 | 4.9%(+5.14)#3,096 |
| 75. | 97141 | 9.9% | 6.1%(+3.86)#75 | 4.9%(+5.07)#3,143 |
| 76. | 97826 | 9.9% | 6.1%(+3.82)#76 | 4.9%(+5.03)#3,165 |
| 77. | 97011 | 9.9% | 6.1%(+3.82)#77 | 4.9%(+5.03)#3,166 |
| 78. | 97014 | 9.8% | 6.1%(+3.75)#78 | 4.9%(+4.95)#3,222 |
| 79. | 97230 | 9.7% | 6.1%(+3.66)#79 | 4.9%(+4.87)#3,278 |
| 80. | 97720 | 9.6% | 6.1%(+3.56)#80 | 4.9%(+4.77)#3,338 |
| 81. | 97540 | 9.6% | 6.1%(+3.56)#81 | 4.9%(+4.76)#3,345 |
| 82. | 97870 | 9.6% | 6.1%(+3.55)#82 | 4.9%(+4.76)#3,350 |
| 83. | 97024 | 9.4% | 6.1%(+3.37)#83 | 4.9%(+4.58)#3,497 |
| 84. | 97383 | 9.4% | 6.1%(+3.35)#84 | 4.9%(+4.55)#3,510 |
| 85. | 97431 | 9.4% | 6.1%(+3.31)#85 | 4.9%(+4.52)#3,530 |
| 86. | 97232 | 9.4% | 6.1%(+3.27)#86 | 4.9%(+4.48)#3,557 |
| 87. | 97058 | 9.3% | 6.1%(+3.26)#87 | 4.9%(+4.46)#3,574 |
| 88. | 97738 | 9.2% | 6.1%(+3.09)#88 | 4.9%(+4.30)#3,699 |
| 89. | 97056 | 9.1% | 6.1%(+3.07)#89 | 4.9%(+4.28)#3,715 |
| 90. | 97424 | 9.1% | 6.1%(+3.02)#90 | 4.9%(+4.23)#3,749 |
| 91. | 97417 | 9.0% | 6.1%(+2.96)#91 | 4.9%(+4.17)#3,815 |
| 92. | 97834 | 9.0% | 6.1%(+2.94)#92 | 4.9%(+4.15)#3,829 |
| 93. | 97117 | 9.0% | 6.1%(+2.92)#93 | 4.9%(+4.13)#3,858 |
| 94. | 97754 | 9.0% | 6.1%(+2.91)#94 | 4.9%(+4.12)#3,864 |
| 95. | 97801 | 8.8% | 6.1%(+2.73)#95 | 4.9%(+3.94)#4,020 |
| 96. | 97426 | 8.8% | 6.1%(+2.71)#96 | 4.9%(+3.92)#4,041 |
| 97. | 97850 | 8.8% | 6.1%(+2.71)#97 | 4.9%(+3.92)#4,043 |
| 98. | 97216 | 8.8% | 6.1%(+2.70)#98 | 4.9%(+3.90)#4,058 |
| 99. | 97107 | 8.8% | 6.1%(+2.69)#99 | 4.9%(+3.90)#4,060 |
| 100. | 97121 | 8.7% | 6.1%(+2.66)#100 | 4.9%(+3.87)#4,091 |
Common Questions
What are the Top 10 Zip Codes with the Highest Percentage of Population with a Degree in Liberal Arts and History in Oregon?
Top 10 Zip Codes with the Highest Percentage of Population with a Degree in Liberal Arts and History in Oregon are:
What zip code has the Highest Percentage of Population with a Degree in Liberal Arts and History in Oregon?
97920 has the Highest Percentage of Population with a Degree in Liberal Arts and History in Oregon with 75.0%.
What is the Percentage of Population with a Degree in Liberal Arts and History in the State of Oregon?
Percentage of Population with a Degree in Liberal Arts and History in Oregon is 6.1%.
What is the Percentage of Population with a Degree in Liberal Arts and History in the United States?
Percentage of Population with a Degree in Liberal Arts and History in the United States is 4.9%.