Zip Codes with the Highest Percentage of Population with a Degree in Liberal Arts and History in Delaware
RELATED REPORTS & OPTIONS
Liberal Arts and History
Delaware
Compare Zip Codes
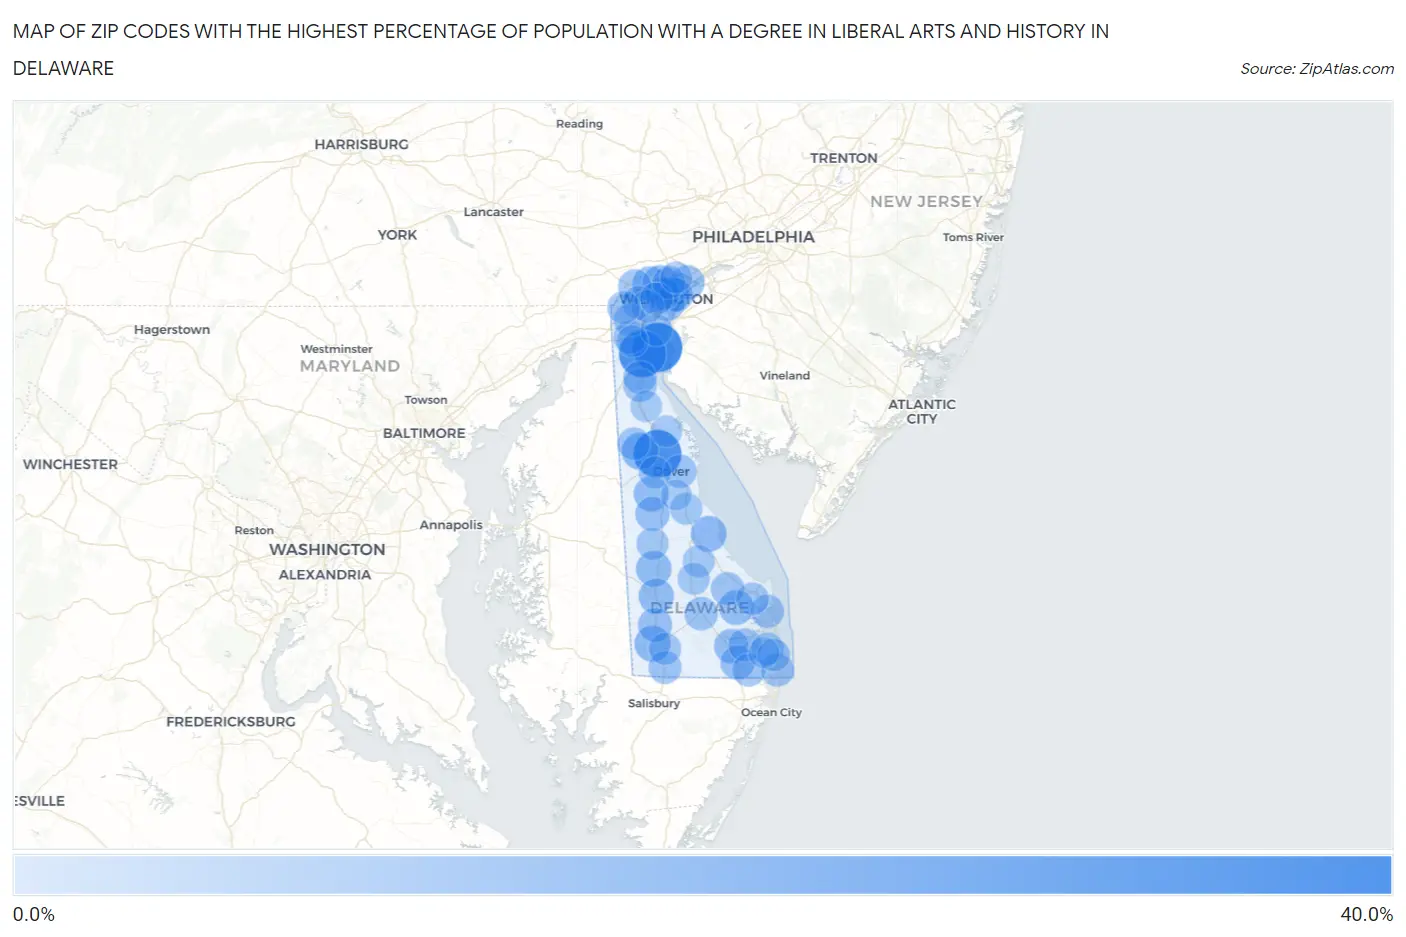
Map of Zip Codes with the Highest Percentage of Population with a Degree in Liberal Arts and History in Delaware
0.0%
40.0%
Zip Codes with the Highest Percentage of Population with a Degree in Liberal Arts and History in Delaware
| Zip Code | % Graduates | vs State | vs National | |
| 1. | 19706 | 36.7% | 5.5%(+31.3)#1 | 4.9%(+31.8)#282 |
| 2. | 19936 | 33.3% | 5.5%(+27.9)#2 | 4.9%(+28.5)#349 |
| 3. | 19733 | 32.3% | 5.5%(+26.9)#3 | 4.9%(+27.4)#374 |
| 4. | 19955 | 12.2% | 5.5%(+6.74)#4 | 4.9%(+7.32)#2,140 |
| 5. | 19931 | 10.6% | 5.5%(+5.13)#5 | 4.9%(+5.70)#2,777 |
| 6. | 19963 | 10.3% | 5.5%(+4.88)#6 | 4.9%(+5.46)#2,903 |
| 7. | 19802 | 10.2% | 5.5%(+4.79)#7 | 4.9%(+5.37)#2,975 |
| 8. | 19950 | 9.9% | 5.5%(+4.45)#8 | 4.9%(+5.03)#3,167 |
| 9. | 19933 | 9.6% | 5.5%(+4.15)#9 | 4.9%(+4.73)#3,376 |
| 10. | 19934 | 9.0% | 5.5%(+3.56)#10 | 4.9%(+4.14)#3,845 |
| 11. | 19807 | 8.6% | 5.5%(+3.14)#11 | 4.9%(+3.72)#4,245 |
| 12. | 19732 | 8.5% | 5.5%(+3.07)#12 | 4.9%(+3.65)#4,313 |
| 13. | 19951 | 8.4% | 5.5%(+2.98)#13 | 4.9%(+3.56)#4,400 |
| 14. | 19966 | 7.9% | 5.5%(+2.40)#14 | 4.9%(+2.98)#5,086 |
| 15. | 19801 | 7.7% | 5.5%(+2.28)#15 | 4.9%(+2.86)#5,252 |
| 16. | 19943 | 7.7% | 5.5%(+2.22)#16 | 4.9%(+2.80)#5,346 |
| 17. | 19703 | 7.6% | 5.5%(+2.16)#17 | 4.9%(+2.74)#5,422 |
| 18. | 19945 | 7.4% | 5.5%(+1.92)#18 | 4.9%(+2.50)#5,773 |
| 19. | 19973 | 7.3% | 5.5%(+1.86)#19 | 4.9%(+2.43)#5,881 |
| 20. | 19809 | 6.6% | 5.5%(+1.12)#20 | 4.9%(+1.70)#7,199 |
| 21. | 19806 | 6.5% | 5.5%(+1.02)#21 | 4.9%(+1.60)#7,397 |
| 22. | 19707 | 6.5% | 5.5%(+1.02)#22 | 4.9%(+1.60)#7,399 |
| 23. | 19730 | 6.2% | 5.5%(+0.760)#23 | 4.9%(+1.34)#7,997 |
| 24. | 19947 | 6.0% | 5.5%(+0.561)#24 | 4.9%(+1.14)#8,487 |
| 25. | 19901 | 5.9% | 5.5%(+0.479)#25 | 4.9%(+1.06)#8,699 |
| 26. | 19709 | 5.7% | 5.5%(+0.227)#26 | 4.9%(+0.807)#9,357 |
| 27. | 19971 | 5.7% | 5.5%(+0.223)#27 | 4.9%(+0.802)#9,367 |
| 28. | 19939 | 5.6% | 5.5%(+0.193)#28 | 4.9%(+0.772)#9,448 |
| 29. | 19968 | 5.4% | 5.5%(-0.006)#29 | 4.9%(+0.573)#10,019 |
| 30. | 19702 | 5.4% | 5.5%(-0.083)#30 | 4.9%(+0.496)#10,216 |
| 31. | 19975 | 5.3% | 5.5%(-0.109)#31 | 4.9%(+0.471)#10,298 |
| 32. | 19944 | 5.3% | 5.5%(-0.126)#32 | 4.9%(+0.453)#10,362 |
| 33. | 19803 | 5.1% | 5.5%(-0.344)#33 | 4.9%(+0.235)#11,020 |
| 34. | 19808 | 5.1% | 5.5%(-0.355)#34 | 4.9%(+0.224)#11,045 |
| 35. | 19713 | 5.1% | 5.5%(-0.367)#35 | 4.9%(+0.212)#11,090 |
| 36. | 19940 | 5.0% | 5.5%(-0.461)#36 | 4.9%(+0.119)#11,384 |
| 37. | 19804 | 4.9% | 5.5%(-0.556)#37 | 4.9%(+0.023)#11,652 |
| 38. | 19805 | 4.9% | 5.5%(-0.574)#38 | 4.9%(+0.005)#11,721 |
| 39. | 19711 | 4.9% | 5.5%(-0.590)#39 | 4.9%(-0.011)#11,784 |
| 40. | 19938 | 4.4% | 5.5%(-1.06)#40 | 4.9%(-0.480)#13,315 |
| 41. | 19958 | 4.4% | 5.5%(-1.10)#41 | 4.9%(-0.518)#13,438 |
| 42. | 19970 | 4.3% | 5.5%(-1.18)#42 | 4.9%(-0.596)#13,720 |
| 43. | 19904 | 4.2% | 5.5%(-1.23)#43 | 4.9%(-0.650)#13,922 |
| 44. | 19930 | 4.2% | 5.5%(-1.29)#44 | 4.9%(-0.714)#14,181 |
| 45. | 19720 | 4.0% | 5.5%(-1.49)#45 | 4.9%(-0.914)#14,948 |
| 46. | 19952 | 3.8% | 5.5%(-1.67)#46 | 4.9%(-1.09)#15,608 |
| 47. | 19956 | 3.8% | 5.5%(-1.68)#47 | 4.9%(-1.10)#15,641 |
| 48. | 19946 | 3.6% | 5.5%(-1.87)#48 | 4.9%(-1.30)#16,314 |
| 49. | 19960 | 3.5% | 5.5%(-1.99)#49 | 4.9%(-1.41)#16,747 |
| 50. | 19941 | 3.4% | 5.5%(-2.00)#50 | 4.9%(-1.42)#16,795 |
| 51. | 19701 | 3.2% | 5.5%(-2.21)#51 | 4.9%(-1.64)#17,535 |
| 52. | 19810 | 2.8% | 5.5%(-2.64)#52 | 4.9%(-2.06)#18,978 |
| 53. | 19977 | 2.7% | 5.5%(-2.80)#53 | 4.9%(-2.22)#19,484 |
| 54. | 19734 | 2.4% | 5.5%(-3.01)#54 | 4.9%(-2.43)#20,153 |
| 55. | 19967 | 1.4% | 5.5%(-4.09)#55 | 4.9%(-3.51)#22,750 |
| 56. | 19962 | 1.0% | 5.5%(-4.41)#56 | 4.9%(-3.83)#23,314 |
1
Common Questions
What are the Top 10 Zip Codes with the Highest Percentage of Population with a Degree in Liberal Arts and History in Delaware?
Top 10 Zip Codes with the Highest Percentage of Population with a Degree in Liberal Arts and History in Delaware are:
What zip code has the Highest Percentage of Population with a Degree in Liberal Arts and History in Delaware?
19706 has the Highest Percentage of Population with a Degree in Liberal Arts and History in Delaware with 36.7%.
What is the Percentage of Population with a Degree in Liberal Arts and History in the State of Delaware?
Percentage of Population with a Degree in Liberal Arts and History in Delaware is 5.5%.
What is the Percentage of Population with a Degree in Liberal Arts and History in the United States?
Percentage of Population with a Degree in Liberal Arts and History in the United States is 4.9%.