Zip Codes with the Highest Percentage of Population with a Degree in Liberal Arts and History in Oklahoma
RELATED REPORTS & OPTIONS
Liberal Arts and History
Oklahoma
Compare Zip Codes
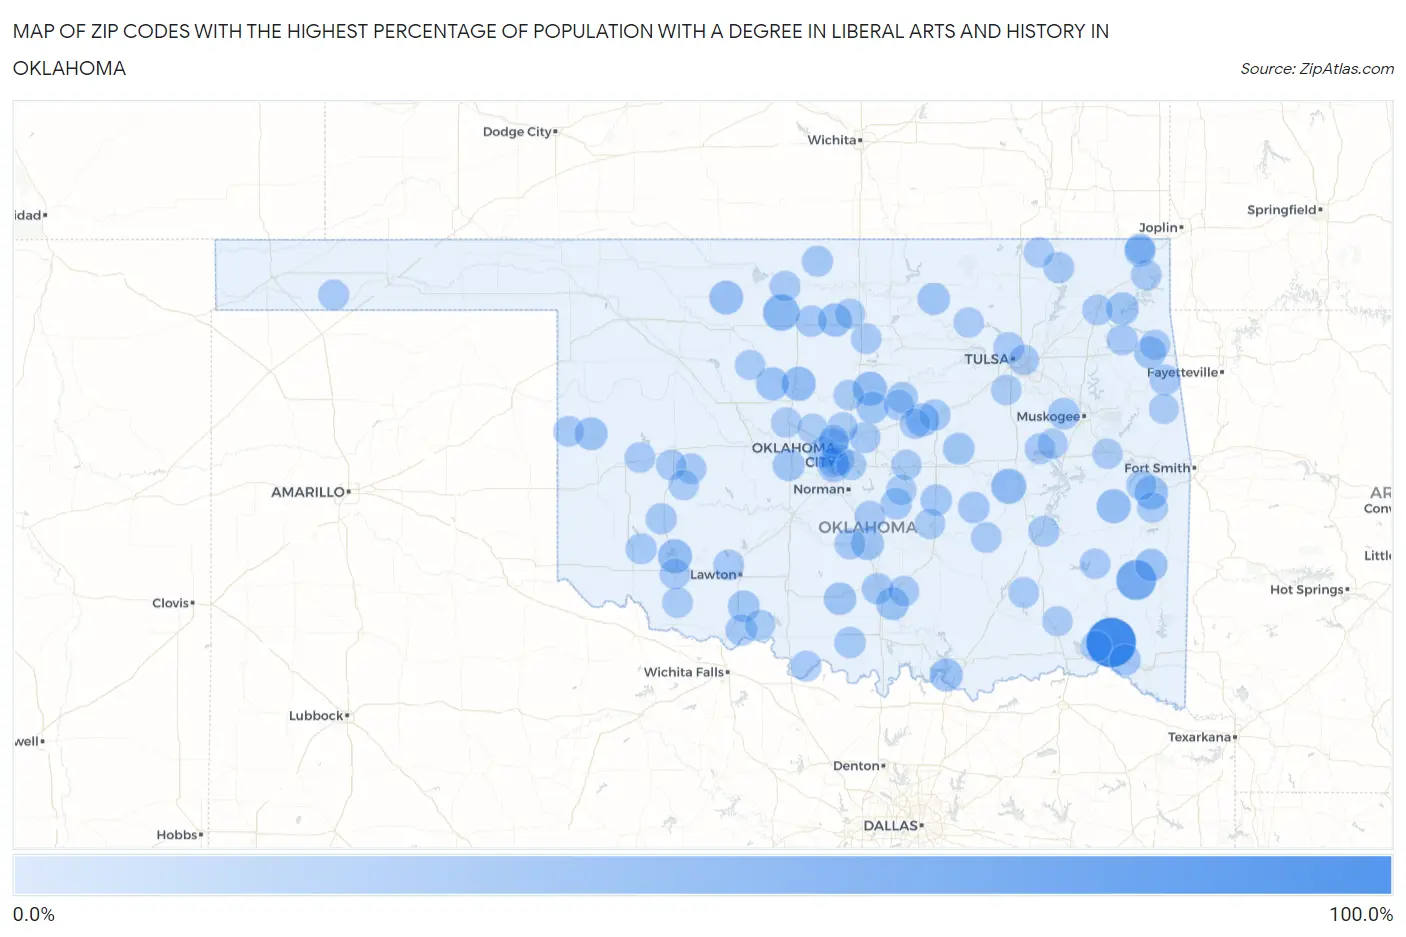
Map of Zip Codes with the Highest Percentage of Population with a Degree in Liberal Arts and History in Oklahoma
0.0%
100.0%
Zip Codes with the Highest Percentage of Population with a Degree in Liberal Arts and History in Oklahoma
| Zip Code | % Graduates | vs State | vs National | |
| 1. | 74755 | 100.0% | 4.9%(+95.1)#1 | 4.9%(+95.1)#39 |
| 2. | 74549 | 52.9% | 4.9%(+48.1)#2 | 4.9%(+48.1)#130 |
| 3. | 73727 | 36.4% | 4.9%(+31.5)#3 | 4.9%(+31.5)#290 |
| 4. | 74839 | 29.4% | 4.9%(+24.5)#4 | 4.9%(+24.5)#429 |
| 5. | 73050 | 25.0% | 4.9%(+20.1)#5 | 4.9%(+20.1)#567 |
| 6. | 73734 | 25.0% | 4.9%(+20.1)#6 | 4.9%(+20.1)#575 |
| 7. | 73559 | 25.0% | 4.9%(+20.1)#7 | 4.9%(+20.1)#577 |
| 8. | 74943 | 25.0% | 4.9%(+20.1)#8 | 4.9%(+20.1)#594 |
| 9. | 73726 | 23.8% | 4.9%(+18.9)#9 | 4.9%(+18.9)#638 |
| 10. | 74930 | 22.5% | 4.9%(+17.6)#10 | 4.9%(+17.6)#707 |
| 11. | 73738 | 21.6% | 4.9%(+16.7)#11 | 4.9%(+16.7)#760 |
| 12. | 74026 | 21.1% | 4.9%(+16.2)#12 | 4.9%(+16.2)#794 |
| 13. | 74731 | 20.7% | 4.9%(+15.8)#13 | 4.9%(+15.8)#819 |
| 14. | 73756 | 20.0% | 4.9%(+15.1)#14 | 4.9%(+15.1)#861 |
| 15. | 73074 | 18.9% | 4.9%(+14.0)#15 | 4.9%(+14.0)#943 |
| 16. | 73628 | 18.6% | 4.9%(+13.8)#16 | 4.9%(+13.8)#967 |
| 17. | 73032 | 18.2% | 4.9%(+13.3)#17 | 4.9%(+13.3)#1,013 |
| 18. | 74349 | 17.9% | 4.9%(+13.0)#18 | 4.9%(+13.0)#1,043 |
| 19. | 73481 | 17.5% | 4.9%(+12.6)#19 | 4.9%(+12.6)#1,086 |
| 20. | 74949 | 17.4% | 4.9%(+12.5)#20 | 4.9%(+12.5)#1,092 |
| 21. | 74637 | 17.2% | 4.9%(+12.4)#21 | 4.9%(+12.4)#1,108 |
| 22. | 73090 | 15.7% | 4.9%(+10.9)#22 | 4.9%(+10.9)#1,299 |
| 23. | 73159 | 15.3% | 4.9%(+10.5)#23 | 4.9%(+10.5)#1,365 |
| 24. | 73058 | 15.0% | 4.9%(+10.1)#24 | 4.9%(+10.1)#1,425 |
| 25. | 74347 | 14.9% | 4.9%(+10.1)#25 | 4.9%(+10.1)#1,436 |
| 26. | 74829 | 14.0% | 4.9%(+9.13)#26 | 4.9%(+9.13)#1,637 |
| 27. | 73572 | 13.8% | 4.9%(+8.96)#27 | 4.9%(+8.96)#1,676 |
| 28. | 74848 | 13.5% | 4.9%(+8.65)#28 | 4.9%(+8.65)#1,761 |
| 29. | 74463 | 13.4% | 4.9%(+8.56)#29 | 4.9%(+8.56)#1,789 |
| 30. | 74750 | 13.3% | 4.9%(+8.46)#30 | 4.9%(+8.46)#1,821 |
| 31. | 73030 | 12.9% | 4.9%(+8.02)#31 | 4.9%(+8.02)#1,941 |
| 32. | 73562 | 12.5% | 4.9%(+7.63)#32 | 4.9%(+7.63)#2,046 |
| 33. | 74830 | 12.5% | 4.9%(+7.63)#33 | 4.9%(+7.63)#2,054 |
| 34. | 73701 | 12.1% | 4.9%(+7.19)#34 | 4.9%(+7.19)#2,192 |
| 35. | 74852 | 12.0% | 4.9%(+7.09)#35 | 4.9%(+7.09)#2,218 |
| 36. | 73463 | 11.6% | 4.9%(+6.75)#36 | 4.9%(+6.75)#2,325 |
| 37. | 73057 | 11.4% | 4.9%(+6.54)#37 | 4.9%(+6.54)#2,392 |
| 38. | 73651 | 11.4% | 4.9%(+6.49)#38 | 4.9%(+6.49)#2,415 |
| 39. | 74079 | 11.2% | 4.9%(+6.31)#39 | 4.9%(+6.32)#2,482 |
| 40. | 73526 | 11.1% | 4.9%(+6.28)#40 | 4.9%(+6.28)#2,492 |
| 41. | 74358 | 11.1% | 4.9%(+6.24)#41 | 4.9%(+6.24)#2,520 |
| 42. | 73049 | 10.9% | 4.9%(+6.05)#42 | 4.9%(+6.06)#2,596 |
| 43. | 74875 | 10.9% | 4.9%(+6.02)#43 | 4.9%(+6.02)#2,607 |
| 44. | 74027 | 10.7% | 4.9%(+5.84)#44 | 4.9%(+5.84)#2,685 |
| 45. | 73109 | 10.7% | 4.9%(+5.80)#45 | 4.9%(+5.80)#2,716 |
| 46. | 73759 | 10.6% | 4.9%(+5.71)#46 | 4.9%(+5.71)#2,774 |
| 47. | 73127 | 10.4% | 4.9%(+5.56)#47 | 4.9%(+5.57)#2,841 |
| 48. | 74554 | 10.3% | 4.9%(+5.38)#48 | 4.9%(+5.38)#2,961 |
| 49. | 74735 | 10.2% | 4.9%(+5.32)#49 | 4.9%(+5.32)#2,999 |
| 50. | 73949 | 9.8% | 4.9%(+4.91)#50 | 4.9%(+4.91)#3,244 |
| 51. | 74965 | 9.7% | 4.9%(+4.87)#51 | 4.9%(+4.88)#3,273 |
| 52. | 73503 | 9.7% | 4.9%(+4.87)#52 | 4.9%(+4.87)#3,277 |
| 53. | 73569 | 9.7% | 4.9%(+4.80)#53 | 4.9%(+4.81)#3,323 |
| 54. | 74126 | 9.6% | 4.9%(+4.71)#54 | 4.9%(+4.71)#3,389 |
| 55. | 74832 | 9.5% | 4.9%(+4.65)#55 | 4.9%(+4.65)#3,430 |
| 56. | 74956 | 9.5% | 4.9%(+4.62)#56 | 4.9%(+4.63)#3,456 |
| 57. | 73086 | 9.4% | 4.9%(+4.49)#57 | 4.9%(+4.49)#3,549 |
| 58. | 73051 | 9.3% | 4.9%(+4.45)#58 | 4.9%(+4.45)#3,583 |
| 59. | 73660 | 9.3% | 4.9%(+4.39)#59 | 4.9%(+4.39)#3,640 |
| 60. | 73761 | 9.3% | 4.9%(+4.39)#60 | 4.9%(+4.39)#3,641 |
| 61. | 73626 | 9.2% | 4.9%(+4.36)#61 | 4.9%(+4.36)#3,659 |
| 62. | 73566 | 9.2% | 4.9%(+4.30)#62 | 4.9%(+4.30)#3,698 |
| 63. | 74332 | 9.1% | 4.9%(+4.22)#63 | 4.9%(+4.22)#3,753 |
| 64. | 74574 | 8.8% | 4.9%(+3.97)#64 | 4.9%(+3.97)#3,991 |
| 65. | 74569 | 8.8% | 4.9%(+3.95)#65 | 4.9%(+3.95)#4,005 |
| 66. | 74531 | 8.7% | 4.9%(+3.86)#66 | 4.9%(+3.86)#4,099 |
| 67. | 74438 | 8.7% | 4.9%(+3.82)#67 | 4.9%(+3.82)#4,133 |
| 68. | 73542 | 8.6% | 4.9%(+3.76)#68 | 4.9%(+3.76)#4,190 |
| 69. | 73119 | 8.6% | 4.9%(+3.73)#69 | 4.9%(+3.73)#4,232 |
| 70. | 73024 | 8.6% | 4.9%(+3.70)#70 | 4.9%(+3.70)#4,268 |
| 71. | 74343 | 8.6% | 4.9%(+3.68)#71 | 4.9%(+3.68)#4,288 |
| 72. | 74365 | 8.5% | 4.9%(+3.66)#72 | 4.9%(+3.66)#4,309 |
| 73. | 74112 | 8.4% | 4.9%(+3.54)#73 | 4.9%(+3.54)#4,431 |
| 74. | 74338 | 8.4% | 4.9%(+3.50)#74 | 4.9%(+3.50)#4,471 |
| 75. | 73077 | 8.4% | 4.9%(+3.48)#75 | 4.9%(+3.48)#4,490 |
| 76. | 73622 | 8.3% | 4.9%(+3.46)#76 | 4.9%(+3.46)#4,524 |
| 77. | 73003 | 8.3% | 4.9%(+3.42)#77 | 4.9%(+3.42)#4,557 |
| 78. | 74834 | 8.2% | 4.9%(+3.32)#78 | 4.9%(+3.32)#4,674 |
| 79. | 73044 | 7.9% | 4.9%(+3.04)#79 | 4.9%(+3.04)#5,008 |
| 80. | 74849 | 7.9% | 4.9%(+3.03)#80 | 4.9%(+3.03)#5,029 |
| 81. | 74873 | 7.9% | 4.9%(+3.01)#81 | 4.9%(+3.01)#5,052 |
| 82. | 73762 | 7.8% | 4.9%(+2.95)#82 | 4.9%(+2.95)#5,134 |
| 83. | 73116 | 7.7% | 4.9%(+2.86)#83 | 4.9%(+2.86)#5,253 |
| 84. | 74804 | 7.6% | 4.9%(+2.75)#84 | 4.9%(+2.75)#5,399 |
| 85. | 74041 | 7.6% | 4.9%(+2.73)#85 | 4.9%(+2.73)#5,435 |
| 86. | 73568 | 7.6% | 4.9%(+2.72)#86 | 4.9%(+2.72)#5,451 |
| 87. | 74035 | 7.6% | 4.9%(+2.71)#87 | 4.9%(+2.71)#5,469 |
| 88. | 73078 | 7.5% | 4.9%(+2.66)#88 | 4.9%(+2.66)#5,533 |
| 89. | 73135 | 7.5% | 4.9%(+2.63)#89 | 4.9%(+2.63)#5,575 |
| 90. | 74630 | 7.4% | 4.9%(+2.53)#90 | 4.9%(+2.54)#5,729 |
| 91. | 74960 | 7.4% | 4.9%(+2.49)#91 | 4.9%(+2.49)#5,778 |
| 92. | 74428 | 7.3% | 4.9%(+2.47)#92 | 4.9%(+2.47)#5,816 |
| 93. | 74470 | 7.3% | 4.9%(+2.44)#93 | 4.9%(+2.44)#5,856 |
| 94. | 74083 | 7.3% | 4.9%(+2.40)#94 | 4.9%(+2.40)#5,922 |
| 95. | 73120 | 7.3% | 4.9%(+2.39)#95 | 4.9%(+2.39)#5,951 |
| 96. | 73632 | 7.2% | 4.9%(+2.29)#96 | 4.9%(+2.29)#6,113 |
| 97. | 74523 | 7.1% | 4.9%(+2.27)#97 | 4.9%(+2.27)#6,144 |
| 98. | 74941 | 7.1% | 4.9%(+2.27)#98 | 4.9%(+2.27)#6,150 |
| 99. | 73763 | 7.1% | 4.9%(+2.23)#99 | 4.9%(+2.23)#6,233 |
| 100. | 74339 | 7.1% | 4.9%(+2.22)#100 | 4.9%(+2.22)#6,249 |
Common Questions
What are the Top 10 Zip Codes with the Highest Percentage of Population with a Degree in Liberal Arts and History in Oklahoma?
Top 10 Zip Codes with the Highest Percentage of Population with a Degree in Liberal Arts and History in Oklahoma are:
What zip code has the Highest Percentage of Population with a Degree in Liberal Arts and History in Oklahoma?
74755 has the Highest Percentage of Population with a Degree in Liberal Arts and History in Oklahoma with 100.0%.
What is the Percentage of Population with a Degree in Liberal Arts and History in the State of Oklahoma?
Percentage of Population with a Degree in Liberal Arts and History in Oklahoma is 4.9%.
What is the Percentage of Population with a Degree in Liberal Arts and History in the United States?
Percentage of Population with a Degree in Liberal Arts and History in the United States is 4.9%.