Zip Codes with the Highest Percentage of Population with a Degree in Liberal Arts and History in Nebraska
RELATED REPORTS & OPTIONS
Liberal Arts and History
Nebraska
Compare Zip Codes
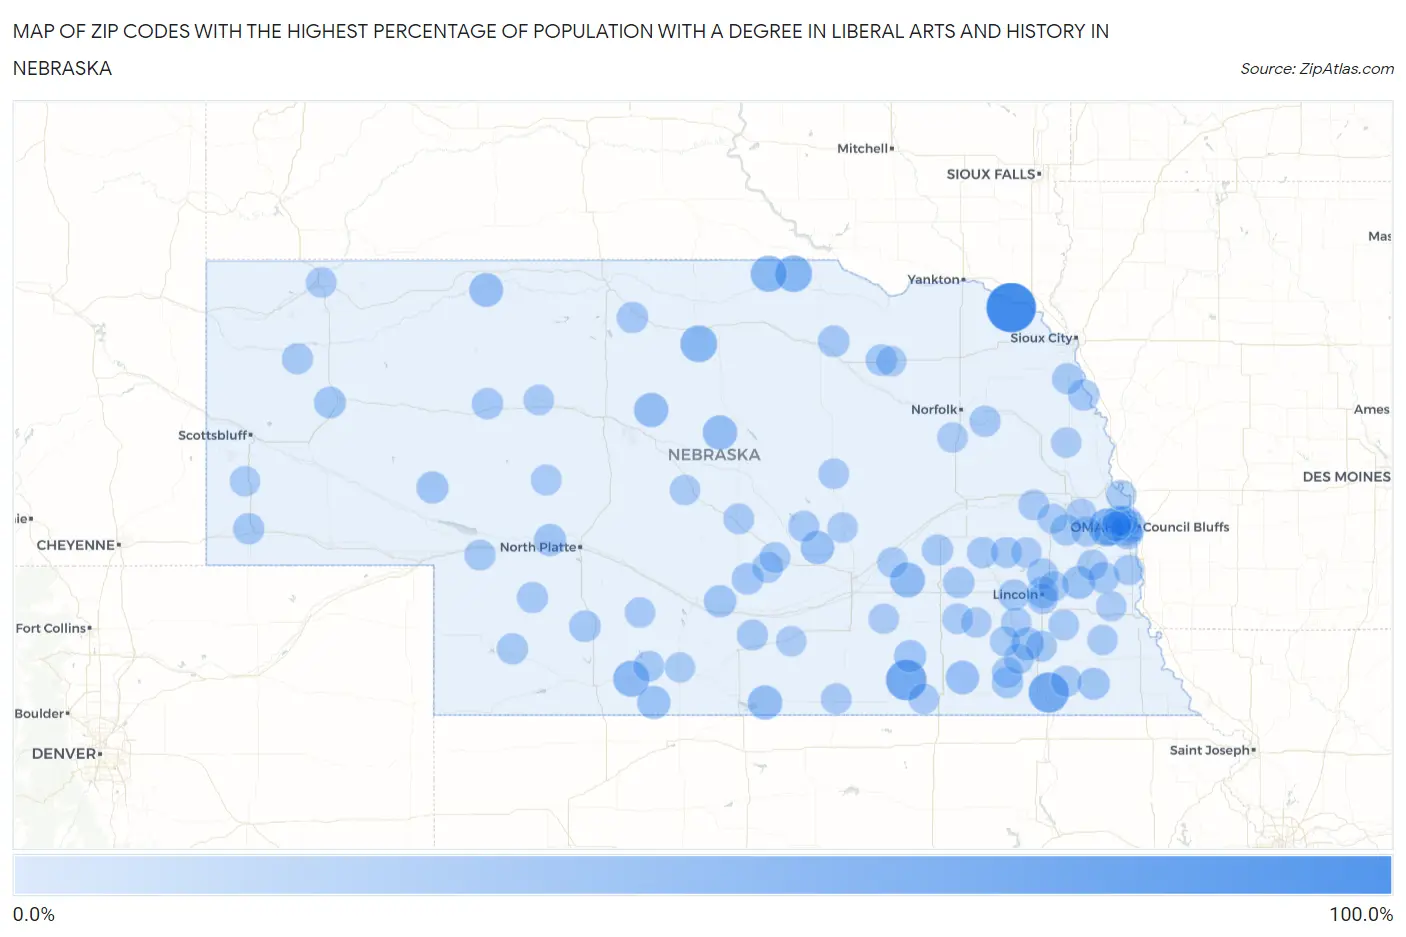
Map of Zip Codes with the Highest Percentage of Population with a Degree in Liberal Arts and History in Nebraska
0.0%
100.0%
Zip Codes with the Highest Percentage of Population with a Degree in Liberal Arts and History in Nebraska
| Zip Code | % Graduates | vs State | vs National | |
| 1. | 68751 | 100.0% | 4.0%(+96.0)#1 | 4.9%(+95.1)#44 |
| 2. | 68964 | 55.3% | 4.0%(+51.3)#2 | 4.9%(+50.4)#120 |
| 3. | 68318 | 53.5% | 4.0%(+49.5)#3 | 4.9%(+48.6)#126 |
| 4. | 68010 | 42.3% | 4.0%(+38.3)#4 | 4.9%(+37.4)#231 |
| 5. | 69217 | 36.6% | 4.0%(+32.6)#5 | 4.9%(+31.7)#283 |
| 6. | 68722 | 35.6% | 4.0%(+31.6)#6 | 4.9%(+30.7)#307 |
| 7. | 68755 | 33.3% | 4.0%(+29.4)#7 | 4.9%(+28.5)#344 |
| 8. | 69020 | 32.8% | 4.0%(+28.9)#8 | 4.9%(+28.0)#365 |
| 9. | 68843 | 27.4% | 4.0%(+23.4)#9 | 4.9%(+22.5)#486 |
| 10. | 68879 | 25.0% | 4.0%(+21.0)#10 | 4.9%(+20.1)#578 |
| 11. | 68960 | 25.0% | 4.0%(+21.0)#11 | 4.9%(+20.1)#586 |
| 12. | 69157 | 25.0% | 4.0%(+21.0)#12 | 4.9%(+20.1)#593 |
| 13. | 69218 | 22.6% | 4.0%(+18.6)#13 | 4.9%(+17.7)#703 |
| 14. | 68820 | 20.3% | 4.0%(+16.3)#14 | 4.9%(+15.4)#838 |
| 15. | 68303 | 20.0% | 4.0%(+16.0)#15 | 4.9%(+15.1)#865 |
| 16. | 69046 | 19.2% | 4.0%(+15.3)#16 | 4.9%(+14.4)#919 |
| 17. | 68304 | 18.5% | 4.0%(+14.5)#17 | 4.9%(+13.6)#975 |
| 18. | 68328 | 17.3% | 4.0%(+13.3)#18 | 4.9%(+12.4)#1,103 |
| 19. | 68863 | 15.4% | 4.0%(+11.5)#19 | 4.9%(+10.6)#1,336 |
| 20. | 68452 | 15.4% | 4.0%(+11.4)#20 | 4.9%(+10.5)#1,360 |
| 21. | 69143 | 14.7% | 4.0%(+10.7)#21 | 4.9%(+9.79)#1,484 |
| 22. | 69147 | 14.3% | 4.0%(+10.3)#22 | 4.9%(+9.41)#1,576 |
| 23. | 68441 | 13.5% | 4.0%(+9.54)#23 | 4.9%(+8.64)#1,766 |
| 24. | 69301 | 12.3% | 4.0%(+8.33)#24 | 4.9%(+7.43)#2,106 |
| 25. | 69038 | 12.0% | 4.0%(+8.03)#25 | 4.9%(+7.13)#2,208 |
| 26. | 68763 | 11.9% | 4.0%(+7.93)#26 | 4.9%(+7.03)#2,240 |
| 27. | 68812 | 11.7% | 4.0%(+7.73)#27 | 4.9%(+6.83)#2,298 |
| 28. | 68039 | 11.4% | 4.0%(+7.46)#28 | 4.9%(+6.56)#2,382 |
| 29. | 68508 | 11.3% | 4.0%(+7.30)#29 | 4.9%(+6.40)#2,446 |
| 30. | 68377 | 11.1% | 4.0%(+7.14)#30 | 4.9%(+6.24)#2,518 |
| 31. | 69221 | 11.1% | 4.0%(+7.14)#31 | 4.9%(+6.24)#2,524 |
| 32. | 68773 | 10.7% | 4.0%(+6.74)#32 | 4.9%(+5.84)#2,693 |
| 33. | 68460 | 10.7% | 4.0%(+6.69)#33 | 4.9%(+5.79)#2,721 |
| 34. | 68102 | 10.6% | 4.0%(+6.66)#34 | 4.9%(+5.77)#2,740 |
| 35. | 69145 | 10.6% | 4.0%(+6.64)#35 | 4.9%(+5.74)#2,750 |
| 36. | 69366 | 10.6% | 4.0%(+6.63)#36 | 4.9%(+5.73)#2,763 |
| 37. | 68423 | 10.1% | 4.0%(+6.08)#37 | 4.9%(+5.18)#3,077 |
| 38. | 68666 | 9.9% | 4.0%(+5.92)#38 | 4.9%(+5.02)#3,171 |
| 39. | 69169 | 9.8% | 4.0%(+5.86)#39 | 4.9%(+4.96)#3,215 |
| 40. | 68779 | 9.8% | 4.0%(+5.80)#40 | 4.9%(+4.90)#3,254 |
| 41. | 69045 | 9.7% | 4.0%(+5.74)#41 | 4.9%(+4.84)#3,301 |
| 42. | 68111 | 9.6% | 4.0%(+5.58)#42 | 4.9%(+4.68)#3,405 |
| 43. | 68669 | 9.5% | 4.0%(+5.55)#43 | 4.9%(+4.65)#3,434 |
| 44. | 68458 | 9.5% | 4.0%(+5.55)#44 | 4.9%(+4.65)#3,445 |
| 45. | 68331 | 9.5% | 4.0%(+5.50)#45 | 4.9%(+4.60)#3,478 |
| 46. | 68403 | 9.4% | 4.0%(+5.40)#46 | 4.9%(+4.50)#3,543 |
| 47. | 68071 | 9.4% | 4.0%(+5.38)#47 | 4.9%(+4.48)#3,553 |
| 48. | 69348 | 9.1% | 4.0%(+5.12)#48 | 4.9%(+4.22)#3,756 |
| 49. | 68105 | 9.0% | 4.0%(+5.03)#49 | 4.9%(+4.14)#3,847 |
| 50. | 68940 | 9.0% | 4.0%(+5.03)#50 | 4.9%(+4.13)#3,859 |
| 51. | 68424 | 9.0% | 4.0%(+5.02)#51 | 4.9%(+4.12)#3,869 |
| 52. | 68817 | 8.7% | 4.0%(+4.72)#52 | 4.9%(+3.82)#4,132 |
| 53. | 68107 | 8.6% | 4.0%(+4.66)#53 | 4.9%(+3.76)#4,196 |
| 54. | 68635 | 8.6% | 4.0%(+4.65)#54 | 4.9%(+3.75)#4,209 |
| 55. | 68041 | 8.6% | 4.0%(+4.62)#55 | 4.9%(+3.72)#4,250 |
| 56. | 69022 | 8.6% | 4.0%(+4.61)#56 | 4.9%(+3.71)#4,257 |
| 57. | 69153 | 8.6% | 4.0%(+4.58)#57 | 4.9%(+3.68)#4,290 |
| 58. | 68336 | 8.5% | 4.0%(+4.50)#58 | 4.9%(+3.60)#4,359 |
| 59. | 68866 | 8.5% | 4.0%(+4.48)#59 | 4.9%(+3.59)#4,378 |
| 60. | 69167 | 8.3% | 4.0%(+4.36)#60 | 4.9%(+3.46)#4,523 |
| 61. | 68844 | 8.2% | 4.0%(+4.19)#61 | 4.9%(+3.29)#4,707 |
| 62. | 68351 | 8.0% | 4.0%(+4.00)#62 | 4.9%(+3.10)#4,927 |
| 63. | 68814 | 7.8% | 4.0%(+3.85)#63 | 4.9%(+2.95)#5,138 |
| 64. | 68970 | 7.7% | 4.0%(+3.76)#64 | 4.9%(+2.87)#5,248 |
| 65. | 68648 | 7.7% | 4.0%(+3.72)#65 | 4.9%(+2.82)#5,327 |
| 66. | 68419 | 7.7% | 4.0%(+3.72)#66 | 4.9%(+2.82)#5,328 |
| 67. | 68144 | 7.5% | 4.0%(+3.51)#67 | 4.9%(+2.61)#5,606 |
| 68. | 68340 | 7.5% | 4.0%(+3.50)#68 | 4.9%(+2.60)#5,632 |
| 69. | 68854 | 7.5% | 4.0%(+3.50)#69 | 4.9%(+2.60)#5,633 |
| 70. | 68058 | 7.3% | 4.0%(+3.33)#70 | 4.9%(+2.43)#5,886 |
| 71. | 69152 | 7.2% | 4.0%(+3.21)#71 | 4.9%(+2.31)#6,074 |
| 72. | 69337 | 7.0% | 4.0%(+3.00)#72 | 4.9%(+2.10)#6,435 |
| 73. | 68842 | 6.9% | 4.0%(+2.97)#73 | 4.9%(+2.07)#6,486 |
| 74. | 68104 | 6.7% | 4.0%(+2.76)#74 | 4.9%(+1.86)#6,864 |
| 75. | 68048 | 6.6% | 4.0%(+2.63)#75 | 4.9%(+1.73)#7,133 |
| 76. | 69029 | 6.5% | 4.0%(+2.57)#76 | 4.9%(+1.67)#7,264 |
| 77. | 68502 | 6.5% | 4.0%(+2.56)#77 | 4.9%(+1.66)#7,273 |
| 78. | 68134 | 6.5% | 4.0%(+2.53)#78 | 4.9%(+1.63)#7,337 |
| 79. | 68748 | 6.5% | 4.0%(+2.50)#79 | 4.9%(+1.61)#7,389 |
| 80. | 68065 | 6.4% | 4.0%(+2.46)#80 | 4.9%(+1.56)#7,507 |
| 81. | 68959 | 6.3% | 4.0%(+2.33)#81 | 4.9%(+1.43)#7,787 |
| 82. | 68341 | 6.2% | 4.0%(+2.20)#82 | 4.9%(+1.30)#8,088 |
| 83. | 68359 | 6.1% | 4.0%(+2.15)#83 | 4.9%(+1.25)#8,205 |
| 84. | 68064 | 6.1% | 4.0%(+2.13)#84 | 4.9%(+1.23)#8,248 |
| 85. | 68114 | 6.0% | 4.0%(+2.02)#85 | 4.9%(+1.12)#8,543 |
| 86. | 68944 | 6.0% | 4.0%(+2.01)#86 | 4.9%(+1.12)#8,553 |
| 87. | 68329 | 5.9% | 4.0%(+1.97)#87 | 4.9%(+1.07)#8,672 |
| 88. | 68333 | 5.9% | 4.0%(+1.93)#88 | 4.9%(+1.03)#8,768 |
| 89. | 68856 | 5.9% | 4.0%(+1.91)#89 | 4.9%(+1.01)#8,822 |
| 90. | 69345 | 5.9% | 4.0%(+1.91)#90 | 4.9%(+1.01)#8,829 |
| 91. | 68720 | 5.9% | 4.0%(+1.91)#91 | 4.9%(+1.01)#8,837 |
| 92. | 68018 | 5.8% | 4.0%(+1.82)#92 | 4.9%(+0.925)#9,050 |
| 93. | 68507 | 5.8% | 4.0%(+1.79)#93 | 4.9%(+0.889)#9,134 |
| 94. | 68465 | 5.7% | 4.0%(+1.75)#94 | 4.9%(+0.849)#9,242 |
| 95. | 68023 | 5.7% | 4.0%(+1.69)#95 | 4.9%(+0.792)#9,393 |
| 96. | 68045 | 5.6% | 4.0%(+1.64)#96 | 4.9%(+0.746)#9,523 |
| 97. | 68922 | 5.6% | 4.0%(+1.62)#97 | 4.9%(+0.718)#9,597 |
| 98. | 68873 | 5.6% | 4.0%(+1.60)#98 | 4.9%(+0.702)#9,636 |
| 99. | 68069 | 5.6% | 4.0%(+1.60)#99 | 4.9%(+0.697)#9,647 |
| 100. | 68417 | 5.6% | 4.0%(+1.58)#100 | 4.9%(+0.683)#9,699 |
Common Questions
What are the Top 10 Zip Codes with the Highest Percentage of Population with a Degree in Liberal Arts and History in Nebraska?
Top 10 Zip Codes with the Highest Percentage of Population with a Degree in Liberal Arts and History in Nebraska are:
What zip code has the Highest Percentage of Population with a Degree in Liberal Arts and History in Nebraska?
68751 has the Highest Percentage of Population with a Degree in Liberal Arts and History in Nebraska with 100.0%.
What is the Percentage of Population with a Degree in Liberal Arts and History in the State of Nebraska?
Percentage of Population with a Degree in Liberal Arts and History in Nebraska is 4.0%.
What is the Percentage of Population with a Degree in Liberal Arts and History in the United States?
Percentage of Population with a Degree in Liberal Arts and History in the United States is 4.9%.