Zip Codes with the Highest Percentage of Population with a Degree in Liberal Arts and History in Idaho
RELATED REPORTS & OPTIONS
Liberal Arts and History
Idaho
Compare Zip Codes
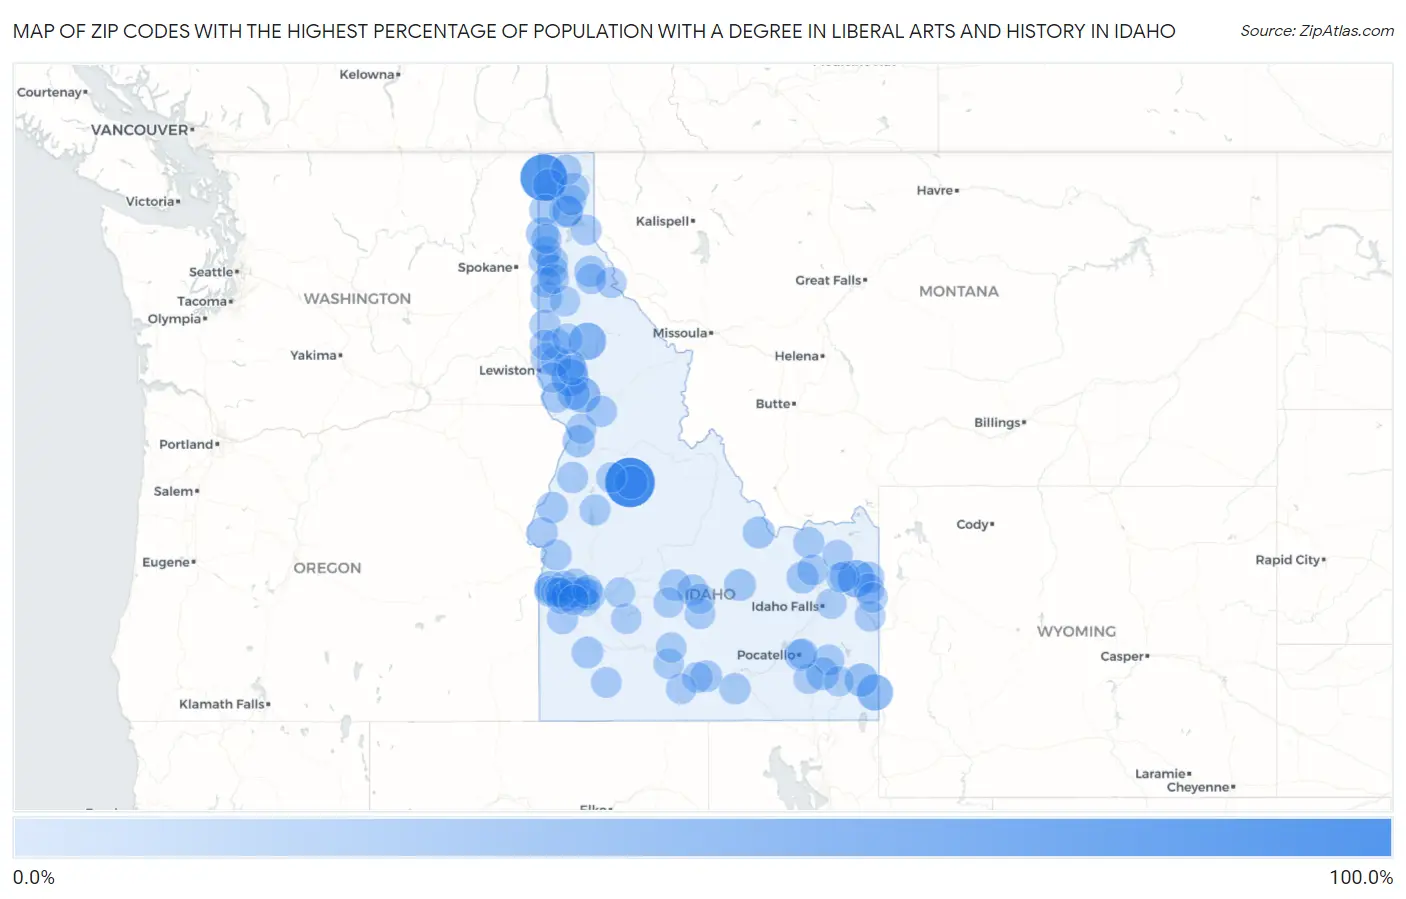
Map of Zip Codes with the Highest Percentage of Population with a Degree in Liberal Arts and History in Idaho
0.0%
100.0%
Zip Codes with the Highest Percentage of Population with a Degree in Liberal Arts and History in Idaho
| Zip Code | % Graduates | vs State | vs National | |
| 1. | 83677 | 100.0% | 4.2%(+95.8)#1 | 4.9%(+95.1)#19 |
| 2. | 83848 | 85.5% | 4.2%(+81.3)#2 | 4.9%(+80.6)#54 |
| 3. | 83827 | 37.5% | 4.2%(+33.3)#3 | 4.9%(+32.6)#272 |
| 4. | 83436 | 37.4% | 4.2%(+33.2)#4 | 4.9%(+32.5)#273 |
| 5. | 83548 | 35.7% | 4.2%(+31.5)#5 | 4.9%(+30.8)#306 |
| 6. | 83238 | 32.0% | 4.2%(+27.8)#6 | 4.9%(+27.1)#380 |
| 7. | 83533 | 30.0% | 4.2%(+25.8)#7 | 4.9%(+25.1)#418 |
| 8. | 83239 | 19.1% | 4.2%(+14.9)#8 | 4.9%(+14.3)#926 |
| 9. | 83656 | 18.6% | 4.2%(+14.4)#9 | 4.9%(+13.7)#969 |
| 10. | 83611 | 17.7% | 4.2%(+13.5)#10 | 4.9%(+12.8)#1,069 |
| 11. | 83852 | 16.9% | 4.2%(+12.7)#11 | 4.9%(+12.0)#1,139 |
| 12. | 83804 | 16.6% | 4.2%(+12.4)#12 | 4.9%(+11.8)#1,181 |
| 13. | 83246 | 15.4% | 4.2%(+11.2)#13 | 4.9%(+10.5)#1,342 |
| 14. | 83526 | 14.3% | 4.2%(+10.1)#14 | 4.9%(+9.41)#1,581 |
| 15. | 83542 | 13.3% | 4.2%(+9.13)#15 | 4.9%(+8.46)#1,822 |
| 16. | 83821 | 13.0% | 4.2%(+8.81)#16 | 4.9%(+8.14)#1,906 |
| 17. | 83450 | 12.1% | 4.2%(+7.92)#17 | 4.9%(+7.25)#2,165 |
| 18. | 83255 | 11.7% | 4.2%(+7.49)#18 | 4.9%(+6.82)#2,301 |
| 19. | 83464 | 11.7% | 4.2%(+7.46)#19 | 4.9%(+6.79)#2,311 |
| 20. | 83624 | 10.7% | 4.2%(+6.51)#20 | 4.9%(+5.84)#2,681 |
| 21. | 83335 | 10.7% | 4.2%(+6.47)#21 | 4.9%(+5.80)#2,714 |
| 22. | 83209 | 9.5% | 4.2%(+5.30)#22 | 4.9%(+4.63)#3,457 |
| 23. | 83839 | 9.2% | 4.2%(+5.03)#23 | 4.9%(+4.36)#3,658 |
| 24. | 83610 | 9.0% | 4.2%(+4.83)#24 | 4.9%(+4.16)#3,824 |
| 25. | 83530 | 8.9% | 4.2%(+4.73)#25 | 4.9%(+4.05)#3,918 |
| 26. | 83452 | 8.9% | 4.2%(+4.72)#26 | 4.9%(+4.05)#3,922 |
| 27. | 83626 | 8.8% | 4.2%(+4.64)#27 | 4.9%(+3.97)#3,990 |
| 28. | 83654 | 8.6% | 4.2%(+4.44)#28 | 4.9%(+3.77)#4,176 |
| 29. | 83340 | 8.5% | 4.2%(+4.32)#29 | 4.9%(+3.65)#4,317 |
| 30. | 83847 | 8.5% | 4.2%(+4.29)#30 | 4.9%(+3.62)#4,339 |
| 31. | 83856 | 8.2% | 4.2%(+4.01)#31 | 4.9%(+3.34)#4,646 |
| 32. | 83541 | 8.1% | 4.2%(+3.91)#32 | 4.9%(+3.24)#4,769 |
| 33. | 83311 | 8.1% | 4.2%(+3.91)#33 | 4.9%(+3.24)#4,771 |
| 34. | 83851 | 8.1% | 4.2%(+3.86)#34 | 4.9%(+3.19)#4,819 |
| 35. | 83353 | 7.9% | 4.2%(+3.74)#35 | 4.9%(+3.07)#4,966 |
| 36. | 83815 | 7.7% | 4.2%(+3.54)#36 | 4.9%(+2.87)#5,241 |
| 37. | 83423 | 7.7% | 4.2%(+3.49)#37 | 4.9%(+2.82)#5,321 |
| 38. | 83217 | 7.3% | 4.2%(+3.10)#38 | 4.9%(+2.43)#5,885 |
| 39. | 83425 | 7.3% | 4.2%(+3.07)#39 | 4.9%(+2.40)#5,924 |
| 40. | 83661 | 7.2% | 4.2%(+3.01)#40 | 4.9%(+2.34)#6,018 |
| 41. | 83615 | 7.2% | 4.2%(+2.98)#41 | 4.9%(+2.31)#6,081 |
| 42. | 83832 | 7.1% | 4.2%(+2.88)#42 | 4.9%(+2.21)#6,260 |
| 43. | 83641 | 6.9% | 4.2%(+2.68)#43 | 4.9%(+2.01)#6,593 |
| 44. | 83855 | 6.9% | 4.2%(+2.66)#44 | 4.9%(+1.99)#6,616 |
| 45. | 83846 | 6.8% | 4.2%(+2.65)#45 | 4.9%(+1.98)#6,635 |
| 46. | 83422 | 6.5% | 4.2%(+2.33)#46 | 4.9%(+1.66)#7,269 |
| 47. | 83840 | 6.3% | 4.2%(+2.10)#47 | 4.9%(+1.43)#7,778 |
| 48. | 83805 | 6.3% | 4.2%(+2.06)#48 | 4.9%(+1.39)#7,872 |
| 49. | 83325 | 6.1% | 4.2%(+1.94)#49 | 4.9%(+1.27)#8,160 |
| 50. | 83672 | 6.1% | 4.2%(+1.93)#50 | 4.9%(+1.26)#8,178 |
| 51. | 83854 | 6.1% | 4.2%(+1.91)#51 | 4.9%(+1.24)#8,233 |
| 52. | 83644 | 6.1% | 4.2%(+1.88)#52 | 4.9%(+1.21)#8,315 |
| 53. | 83811 | 6.0% | 4.2%(+1.82)#53 | 4.9%(+1.15)#8,475 |
| 54. | 83428 | 5.9% | 4.2%(+1.72)#54 | 4.9%(+1.04)#8,741 |
| 55. | 83313 | 5.9% | 4.2%(+1.67)#55 | 4.9%(+1.00)#8,860 |
| 56. | 83451 | 5.7% | 4.2%(+1.54)#56 | 4.9%(+0.866)#9,195 |
| 57. | 83455 | 5.7% | 4.2%(+1.49)#57 | 4.9%(+0.820)#9,321 |
| 58. | 83704 | 5.7% | 4.2%(+1.49)#58 | 4.9%(+0.820)#9,324 |
| 59. | 83814 | 5.7% | 4.2%(+1.45)#59 | 4.9%(+0.780)#9,427 |
| 60. | 83607 | 5.6% | 4.2%(+1.43)#60 | 4.9%(+0.762)#9,470 |
| 61. | 83712 | 5.6% | 4.2%(+1.41)#61 | 4.9%(+0.739)#9,543 |
| 62. | 83604 | 5.6% | 4.2%(+1.35)#62 | 4.9%(+0.683)#9,695 |
| 63. | 83555 | 5.6% | 4.2%(+1.35)#63 | 4.9%(+0.683)#9,698 |
| 64. | 83871 | 5.5% | 4.2%(+1.25)#64 | 4.9%(+0.580)#9,995 |
| 65. | 83837 | 5.4% | 4.2%(+1.24)#65 | 4.9%(+0.570)#10,026 |
| 66. | 83301 | 5.4% | 4.2%(+1.18)#66 | 4.9%(+0.507)#10,182 |
| 67. | 83651 | 5.4% | 4.2%(+1.16)#67 | 4.9%(+0.488)#10,246 |
| 68. | 83687 | 5.3% | 4.2%(+1.11)#68 | 4.9%(+0.436)#10,414 |
| 69. | 83535 | 5.3% | 4.2%(+1.10)#69 | 4.9%(+0.431)#10,435 |
| 70. | 83843 | 5.3% | 4.2%(+1.10)#70 | 4.9%(+0.425)#10,453 |
| 71. | 83540 | 5.2% | 4.2%(+0.956)#71 | 4.9%(+0.285)#10,852 |
| 72. | 83823 | 5.1% | 4.2%(+0.934)#72 | 4.9%(+0.264)#10,912 |
| 73. | 83876 | 5.1% | 4.2%(+0.888)#73 | 4.9%(+0.218)#11,070 |
| 74. | 83355 | 5.1% | 4.2%(+0.858)#74 | 4.9%(+0.187)#11,168 |
| 75. | 83864 | 5.0% | 4.2%(+0.804)#75 | 4.9%(+0.134)#11,314 |
| 76. | 83647 | 4.9% | 4.2%(+0.658)#76 | 4.9%(-0.012)#11,786 |
| 77. | 83861 | 4.8% | 4.2%(+0.623)#77 | 4.9%(-0.047)#11,905 |
| 78. | 83703 | 4.8% | 4.2%(+0.604)#78 | 4.9%(-0.066)#11,951 |
| 79. | 83330 | 4.7% | 4.2%(+0.542)#79 | 4.9%(-0.129)#12,177 |
| 80. | 83858 | 4.7% | 4.2%(+0.517)#80 | 4.9%(-0.153)#12,262 |
| 81. | 83214 | 4.7% | 4.2%(+0.504)#81 | 4.9%(-0.166)#12,306 |
| 82. | 83327 | 4.6% | 4.2%(+0.385)#82 | 4.9%(-0.285)#12,678 |
| 83. | 83445 | 4.6% | 4.2%(+0.377)#83 | 4.9%(-0.293)#12,703 |
| 84. | 83833 | 4.6% | 4.2%(+0.358)#84 | 4.9%(-0.312)#12,764 |
| 85. | 83716 | 4.5% | 4.2%(+0.347)#85 | 4.9%(-0.323)#12,799 |
| 86. | 83401 | 4.5% | 4.2%(+0.339)#86 | 4.9%(-0.331)#12,852 |
| 87. | 83705 | 4.5% | 4.2%(+0.298)#87 | 4.9%(-0.372)#12,974 |
| 88. | 83545 | 4.4% | 4.2%(+0.242)#88 | 4.9%(-0.428)#13,143 |
| 89. | 83241 | 4.4% | 4.2%(+0.210)#89 | 4.9%(-0.460)#13,252 |
| 90. | 83646 | 4.3% | 4.2%(+0.141)#90 | 4.9%(-0.529)#13,497 |
| 91. | 83201 | 4.3% | 4.2%(+0.132)#91 | 4.9%(-0.538)#13,521 |
| 92. | 83448 | 4.3% | 4.2%(+0.096)#92 | 4.9%(-0.575)#13,640 |
| 93. | 83333 | 4.3% | 4.2%(+0.074)#93 | 4.9%(-0.597)#13,722 |
| 94. | 83616 | 4.2% | 4.2%(+0.039)#94 | 4.9%(-0.631)#13,853 |
| 95. | 83869 | 4.2% | 4.2%(+0.010)#95 | 4.9%(-0.660)#13,964 |
| 96. | 83605 | 4.2% | 4.2%(-0.015)#96 | 4.9%(-0.685)#14,063 |
| 97. | 83554 | 4.2% | 4.2%(-0.035)#97 | 4.9%(-0.705)#14,163 |
| 98. | 83702 | 4.1% | 4.2%(-0.101)#98 | 4.9%(-0.771)#14,405 |
| 99. | 83642 | 4.0% | 4.2%(-0.155)#99 | 4.9%(-0.826)#14,600 |
| 100. | 83638 | 4.0% | 4.2%(-0.195)#100 | 4.9%(-0.865)#14,752 |
Common Questions
What are the Top 10 Zip Codes with the Highest Percentage of Population with a Degree in Liberal Arts and History in Idaho?
Top 10 Zip Codes with the Highest Percentage of Population with a Degree in Liberal Arts and History in Idaho are:
What zip code has the Highest Percentage of Population with a Degree in Liberal Arts and History in Idaho?
83677 has the Highest Percentage of Population with a Degree in Liberal Arts and History in Idaho with 100.0%.
What is the Percentage of Population with a Degree in Liberal Arts and History in the State of Idaho?
Percentage of Population with a Degree in Liberal Arts and History in Idaho is 4.2%.
What is the Percentage of Population with a Degree in Liberal Arts and History in the United States?
Percentage of Population with a Degree in Liberal Arts and History in the United States is 4.9%.