Zip Codes with the Highest Percentage of Population with a Degree in Liberal Arts and History in New Hampshire
RELATED REPORTS & OPTIONS
Liberal Arts and History
New Hampshire
Compare Zip Codes
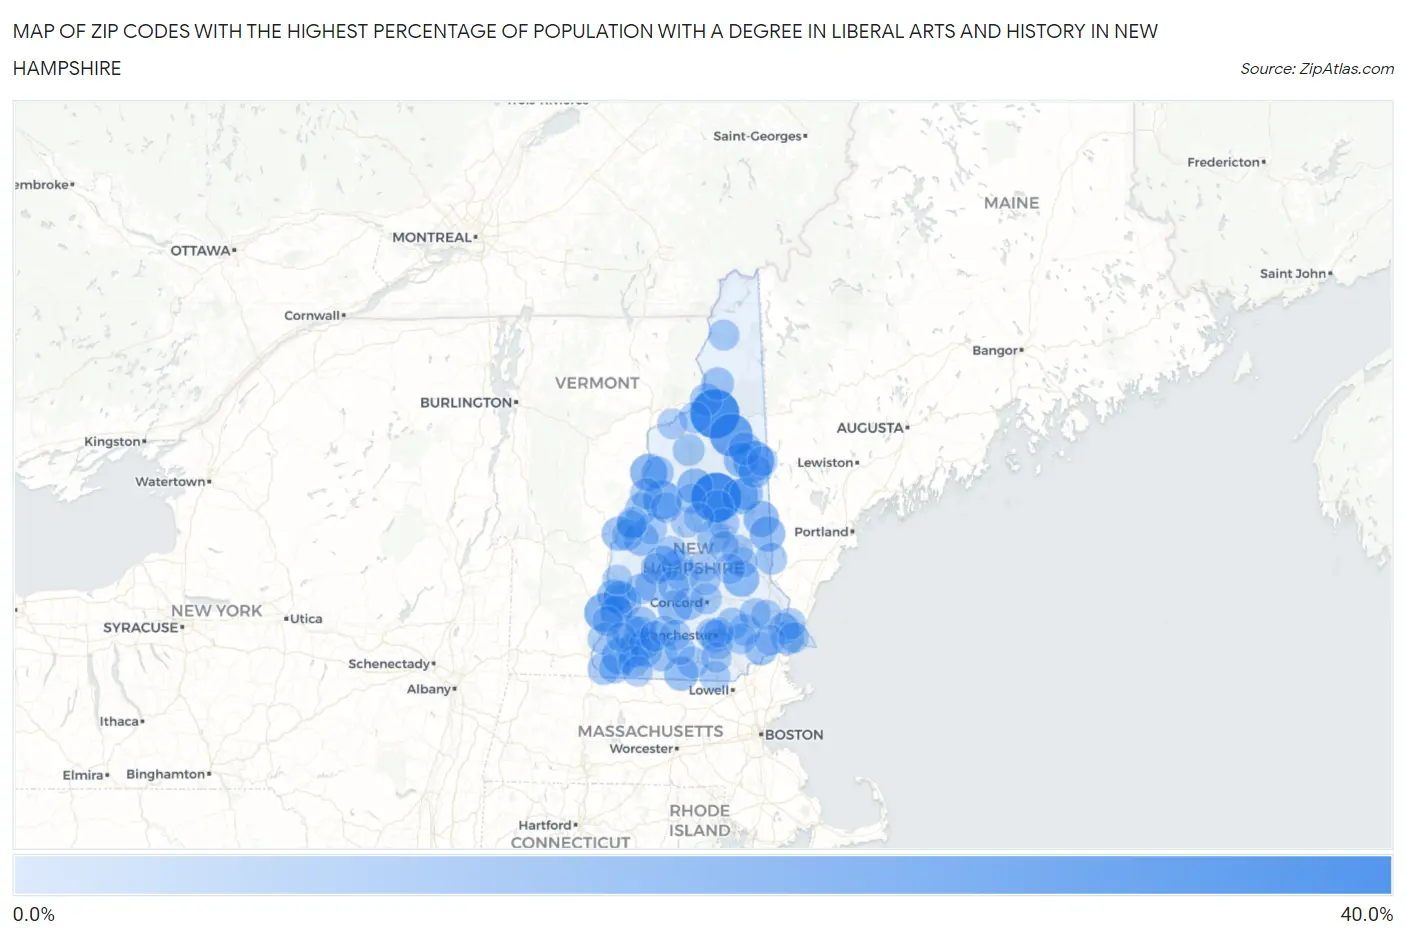
Map of Zip Codes with the Highest Percentage of Population with a Degree in Liberal Arts and History in New Hampshire
0.0%
40.0%
Zip Codes with the Highest Percentage of Population with a Degree in Liberal Arts and History in New Hampshire
| Zip Code | % Graduates | vs State | vs National | |
| 1. | 03259 | 32.4% | 4.9%(+27.5)#1 | 4.9%(+27.5)#371 |
| 2. | 03583 | 31.7% | 4.9%(+26.8)#2 | 4.9%(+26.8)#386 |
| 3. | 03593 | 23.0% | 4.9%(+18.1)#3 | 4.9%(+18.1)#679 |
| 4. | 03845 | 20.0% | 4.9%(+15.2)#4 | 4.9%(+15.2)#849 |
| 5. | 03282 | 17.2% | 4.9%(+12.4)#5 | 4.9%(+12.4)#1,114 |
| 6. | 03609 | 17.2% | 4.9%(+12.3)#6 | 4.9%(+12.3)#1,117 |
| 7. | 03765 | 15.1% | 4.9%(+10.3)#7 | 4.9%(+10.3)#1,398 |
| 8. | 03446 | 13.8% | 4.9%(+8.93)#8 | 4.9%(+8.93)#1,682 |
| 9. | 03225 | 13.4% | 4.9%(+8.52)#9 | 4.9%(+8.52)#1,804 |
| 10. | 03817 | 13.0% | 4.9%(+8.18)#10 | 4.9%(+8.17)#1,898 |
| 11. | 03285 | 12.8% | 4.9%(+7.91)#11 | 4.9%(+7.91)#1,963 |
| 12. | 03287 | 12.7% | 4.9%(+7.87)#12 | 4.9%(+7.86)#1,974 |
| 13. | 03882 | 12.7% | 4.9%(+7.81)#13 | 4.9%(+7.81)#1,993 |
| 14. | 03830 | 12.5% | 4.9%(+7.58)#14 | 4.9%(+7.58)#2,066 |
| 15. | 03838 | 11.8% | 4.9%(+6.93)#15 | 4.9%(+6.93)#2,265 |
| 16. | 03445 | 11.7% | 4.9%(+6.86)#16 | 4.9%(+6.86)#2,288 |
| 17. | 03455 | 11.4% | 4.9%(+6.52)#17 | 4.9%(+6.51)#2,406 |
| 18. | 03242 | 11.2% | 4.9%(+6.31)#18 | 4.9%(+6.31)#2,484 |
| 19. | 03607 | 11.1% | 4.9%(+6.24)#19 | 4.9%(+6.24)#2,517 |
| 20. | 03748 | 11.1% | 4.9%(+6.21)#20 | 4.9%(+6.20)#2,531 |
| 21. | 03048 | 10.8% | 4.9%(+5.95)#21 | 4.9%(+5.95)#2,634 |
| 22. | 03784 | 10.8% | 4.9%(+5.89)#22 | 4.9%(+5.88)#2,663 |
| 23. | 03603 | 10.1% | 4.9%(+5.19)#23 | 4.9%(+5.19)#3,074 |
| 24. | 03601 | 9.9% | 4.9%(+5.01)#24 | 4.9%(+5.00)#3,180 |
| 25. | 03875 | 9.8% | 4.9%(+4.94)#25 | 4.9%(+4.93)#3,236 |
| 26. | 03253 | 9.7% | 4.9%(+4.82)#26 | 4.9%(+4.82)#3,313 |
| 27. | 03860 | 9.3% | 4.9%(+4.39)#27 | 4.9%(+4.39)#3,633 |
| 28. | 03846 | 9.2% | 4.9%(+4.37)#28 | 4.9%(+4.37)#3,651 |
| 29. | 03862 | 9.2% | 4.9%(+4.34)#29 | 4.9%(+4.33)#3,681 |
| 30. | 03848 | 9.0% | 4.9%(+4.11)#30 | 4.9%(+4.10)#3,885 |
| 31. | 03584 | 8.9% | 4.9%(+4.02)#31 | 4.9%(+4.02)#3,947 |
| 32. | 03582 | 8.9% | 4.9%(+4.02)#32 | 4.9%(+4.02)#3,948 |
| 33. | 03458 | 8.6% | 4.9%(+3.77)#33 | 4.9%(+3.77)#4,186 |
| 34. | 03602 | 8.6% | 4.9%(+3.72)#34 | 4.9%(+3.72)#4,252 |
| 35. | 03227 | 8.5% | 4.9%(+3.67)#35 | 4.9%(+3.67)#4,294 |
| 36. | 03268 | 8.5% | 4.9%(+3.65)#36 | 4.9%(+3.64)#4,320 |
| 37. | 03101 | 8.4% | 4.9%(+3.56)#37 | 4.9%(+3.56)#4,408 |
| 38. | 03780 | 8.4% | 4.9%(+3.54)#38 | 4.9%(+3.53)#4,444 |
| 39. | 03229 | 8.3% | 4.9%(+3.40)#39 | 4.9%(+3.40)#4,580 |
| 40. | 03441 | 8.2% | 4.9%(+3.33)#40 | 4.9%(+3.32)#4,671 |
| 41. | 03768 | 8.0% | 4.9%(+3.13)#41 | 4.9%(+3.12)#4,905 |
| 42. | 03255 | 7.9% | 4.9%(+3.02)#42 | 4.9%(+3.02)#5,049 |
| 43. | 03055 | 7.8% | 4.9%(+2.96)#43 | 4.9%(+2.96)#5,123 |
| 44. | 03777 | 7.8% | 4.9%(+2.90)#44 | 4.9%(+2.89)#5,220 |
| 45. | 03077 | 7.7% | 4.9%(+2.86)#45 | 4.9%(+2.86)#5,257 |
| 46. | 03457 | 7.7% | 4.9%(+2.80)#46 | 4.9%(+2.80)#5,350 |
| 47. | 03467 | 7.7% | 4.9%(+2.79)#47 | 4.9%(+2.78)#5,370 |
| 48. | 03034 | 7.6% | 4.9%(+2.76)#48 | 4.9%(+2.75)#5,404 |
| 49. | 03444 | 7.6% | 4.9%(+2.75)#49 | 4.9%(+2.75)#5,413 |
| 50. | 03580 | 7.6% | 4.9%(+2.72)#50 | 4.9%(+2.72)#5,456 |
| 51. | 03852 | 7.6% | 4.9%(+2.70)#51 | 4.9%(+2.69)#5,495 |
| 52. | 03216 | 7.6% | 4.9%(+2.69)#52 | 4.9%(+2.68)#5,508 |
| 53. | 03450 | 7.4% | 4.9%(+2.49)#53 | 4.9%(+2.48)#5,795 |
| 54. | 03257 | 7.3% | 4.9%(+2.44)#54 | 4.9%(+2.44)#5,876 |
| 55. | 03470 | 7.3% | 4.9%(+2.42)#55 | 4.9%(+2.41)#5,898 |
| 56. | 03464 | 7.3% | 4.9%(+2.41)#56 | 4.9%(+2.41)#5,903 |
| 57. | 03465 | 7.1% | 4.9%(+2.28)#57 | 4.9%(+2.27)#6,154 |
| 58. | 03741 | 7.1% | 4.9%(+2.19)#58 | 4.9%(+2.18)#6,296 |
| 59. | 03598 | 7.0% | 4.9%(+2.16)#59 | 4.9%(+2.16)#6,337 |
| 60. | 03278 | 7.0% | 4.9%(+2.09)#60 | 4.9%(+2.09)#6,458 |
| 61. | 03301 | 6.9% | 4.9%(+2.01)#61 | 4.9%(+2.00)#6,595 |
| 62. | 03840 | 6.8% | 4.9%(+1.98)#62 | 4.9%(+1.97)#6,648 |
| 63. | 03801 | 6.8% | 4.9%(+1.96)#63 | 4.9%(+1.96)#6,679 |
| 64. | 03766 | 6.8% | 4.9%(+1.95)#64 | 4.9%(+1.94)#6,718 |
| 65. | 03755 | 6.8% | 4.9%(+1.90)#65 | 4.9%(+1.89)#6,798 |
| 66. | 03254 | 6.7% | 4.9%(+1.86)#66 | 4.9%(+1.85)#6,886 |
| 67. | 03290 | 6.7% | 4.9%(+1.83)#67 | 4.9%(+1.82)#6,951 |
| 68. | 03276 | 6.7% | 4.9%(+1.80)#68 | 4.9%(+1.79)#7,006 |
| 69. | 03036 | 6.7% | 4.9%(+1.80)#69 | 4.9%(+1.79)#7,007 |
| 70. | 03103 | 6.6% | 4.9%(+1.76)#70 | 4.9%(+1.75)#7,103 |
| 71. | 03102 | 6.6% | 4.9%(+1.73)#71 | 4.9%(+1.73)#7,148 |
| 72. | 03442 | 6.5% | 4.9%(+1.65)#72 | 4.9%(+1.64)#7,311 |
| 73. | 03449 | 6.5% | 4.9%(+1.63)#73 | 4.9%(+1.62)#7,351 |
| 74. | 03576 | 6.4% | 4.9%(+1.54)#74 | 4.9%(+1.53)#7,557 |
| 75. | 03810 | 6.3% | 4.9%(+1.45)#75 | 4.9%(+1.45)#7,748 |
| 76. | 03230 | 6.2% | 4.9%(+1.38)#76 | 4.9%(+1.38)#7,895 |
| 77. | 03043 | 6.2% | 4.9%(+1.37)#77 | 4.9%(+1.37)#7,939 |
| 78. | 03809 | 6.2% | 4.9%(+1.33)#78 | 4.9%(+1.32)#8,033 |
| 79. | 03264 | 6.1% | 4.9%(+1.26)#79 | 4.9%(+1.26)#8,174 |
| 80. | 03266 | 6.1% | 4.9%(+1.23)#80 | 4.9%(+1.23)#8,269 |
| 81. | 03561 | 6.1% | 4.9%(+1.19)#81 | 4.9%(+1.19)#8,370 |
| 82. | 03249 | 6.0% | 4.9%(+1.14)#82 | 4.9%(+1.14)#8,489 |
| 83. | 03861 | 6.0% | 4.9%(+1.14)#83 | 4.9%(+1.13)#8,503 |
| 84. | 03752 | 6.0% | 4.9%(+1.12)#84 | 4.9%(+1.12)#8,555 |
| 85. | 03833 | 6.0% | 4.9%(+1.12)#85 | 4.9%(+1.11)#8,567 |
| 86. | 03060 | 6.0% | 4.9%(+1.11)#86 | 4.9%(+1.11)#8,582 |
| 87. | 03837 | 6.0% | 4.9%(+1.09)#87 | 4.9%(+1.09)#8,631 |
| 88. | 03224 | 6.0% | 4.9%(+1.08)#88 | 4.9%(+1.08)#8,642 |
| 89. | 03447 | 5.9% | 4.9%(+1.02)#89 | 4.9%(+1.02)#8,792 |
| 90. | 03608 | 5.9% | 4.9%(+0.983)#90 | 4.9%(+0.979)#8,914 |
| 91. | 03052 | 5.7% | 4.9%(+0.834)#91 | 4.9%(+0.830)#9,302 |
| 92. | 03871 | 5.7% | 4.9%(+0.793)#92 | 4.9%(+0.788)#9,409 |
| 93. | 03223 | 5.6% | 4.9%(+0.755)#93 | 4.9%(+0.751)#9,509 |
| 94. | 03743 | 5.6% | 4.9%(+0.703)#94 | 4.9%(+0.699)#9,644 |
| 95. | 03813 | 5.5% | 4.9%(+0.665)#95 | 4.9%(+0.661)#9,781 |
| 96. | 03245 | 5.5% | 4.9%(+0.616)#96 | 4.9%(+0.612)#9,908 |
| 97. | 03431 | 5.4% | 4.9%(+0.582)#97 | 4.9%(+0.578)#10,000 |
| 98. | 03082 | 5.3% | 4.9%(+0.476)#98 | 4.9%(+0.471)#10,295 |
| 99. | 03104 | 5.3% | 4.9%(+0.474)#99 | 4.9%(+0.469)#10,306 |
| 100. | 03750 | 5.3% | 4.9%(+0.470)#100 | 4.9%(+0.466)#10,315 |
Common Questions
What are the Top 10 Zip Codes with the Highest Percentage of Population with a Degree in Liberal Arts and History in New Hampshire?
Top 10 Zip Codes with the Highest Percentage of Population with a Degree in Liberal Arts and History in New Hampshire are:
What zip code has the Highest Percentage of Population with a Degree in Liberal Arts and History in New Hampshire?
03259 has the Highest Percentage of Population with a Degree in Liberal Arts and History in New Hampshire with 32.4%.
What is the Percentage of Population with a Degree in Liberal Arts and History in the State of New Hampshire?
Percentage of Population with a Degree in Liberal Arts and History in New Hampshire is 4.9%.
What is the Percentage of Population with a Degree in Liberal Arts and History in the United States?
Percentage of Population with a Degree in Liberal Arts and History in the United States is 4.9%.