Zip Codes with the Highest Percentage of Population with a Degree in Liberal Arts and History in Puerto Rico
RELATED REPORTS & OPTIONS
Liberal Arts and History
Puerto Rico
Compare Zip Codes
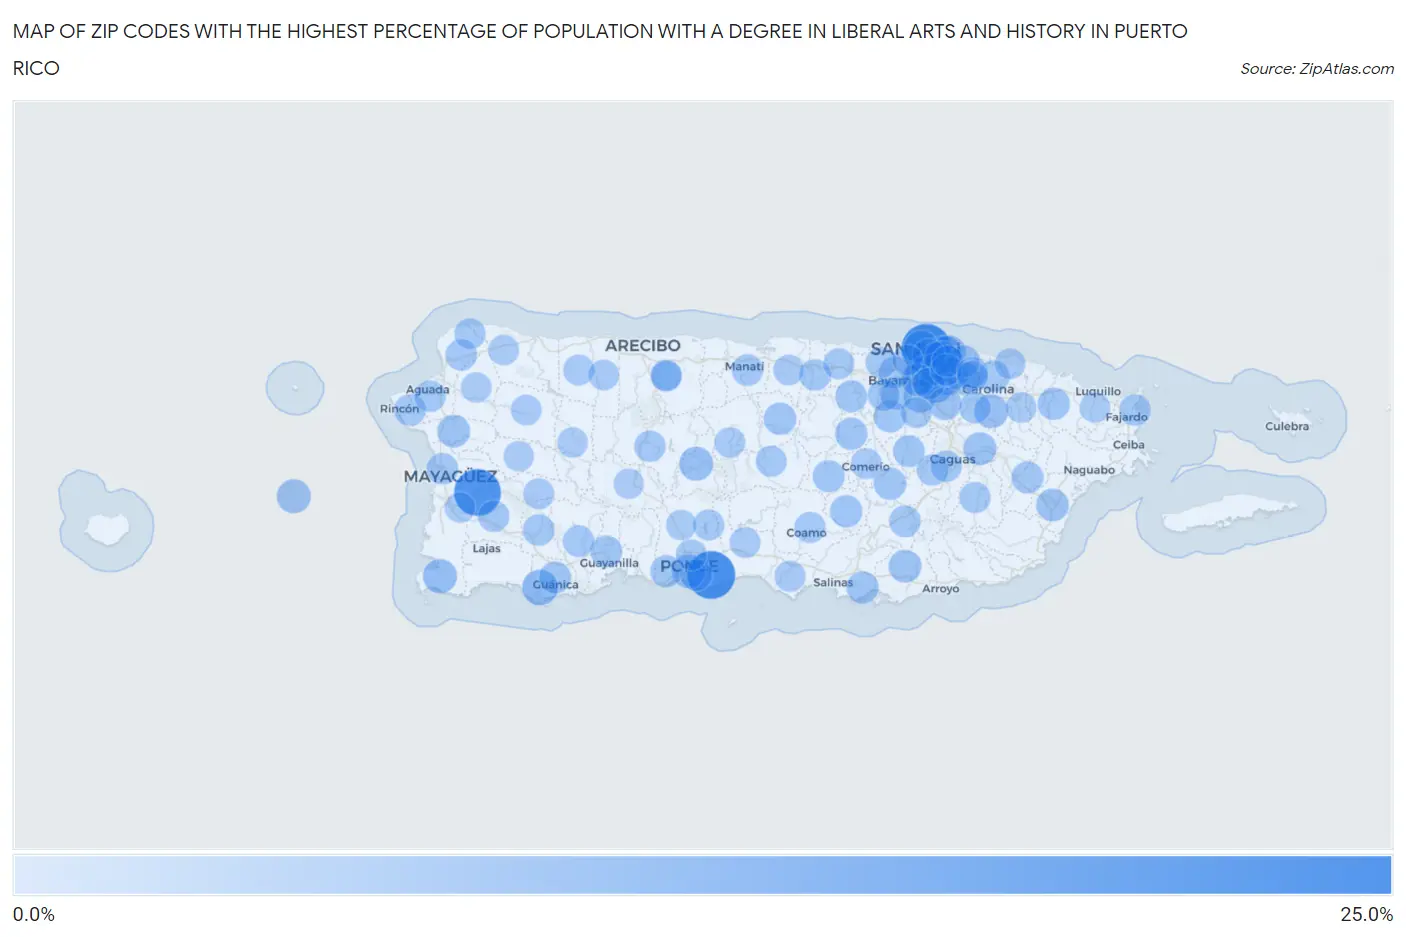
Map of Zip Codes with the Highest Percentage of Population with a Degree in Liberal Arts and History in Puerto Rico
0.0%
25.0%
Zip Codes with the Highest Percentage of Population with a Degree in Liberal Arts and History in Puerto Rico
| Zip Code | % Graduates | vs State | vs National | |
| 1. | 00906 | 22.2% | 2.3%(+19.9)#1 | 4.9%(+17.4)#726 |
| 2. | 00715 | 20.4% | 2.3%(+18.0)#2 | 4.9%(+15.5)#832 |
| 3. | 00636 | 19.2% | 2.3%(+16.9)#3 | 4.9%(+14.3)#922 |
| 4. | 00911 | 7.0% | 2.3%(+4.64)#4 | 4.9%(+2.09)#6,451 |
| 5. | 00968 | 6.9% | 2.3%(+4.59)#5 | 4.9%(+2.04)#6,532 |
| 6. | 00647 | 6.5% | 2.3%(+4.19)#6 | 4.9%(+1.65)#7,309 |
| 7. | 00927 | 6.0% | 2.3%(+3.67)#7 | 4.9%(+1.12)#8,536 |
| 8. | 00901 | 5.1% | 2.3%(+2.80)#8 | 4.9%(+0.254)#10,953 |
| 9. | 00913 | 5.1% | 2.3%(+2.74)#9 | 4.9%(+0.189)#11,163 |
| 10. | 00622 | 4.9% | 2.3%(+2.55)#10 | 4.9%(+0.002)#11,733 |
| 11. | 00664 | 4.8% | 2.3%(+2.51)#11 | 4.9%(-0.034)#11,864 |
| 12. | 00680 | 4.7% | 2.3%(+2.42)#12 | 4.9%(-0.131)#12,189 |
| 13. | 00909 | 4.7% | 2.3%(+2.40)#13 | 4.9%(-0.151)#12,255 |
| 14. | 00987 | 4.7% | 2.3%(+2.33)#14 | 4.9%(-0.221)#12,476 |
| 15. | 00717 | 4.4% | 2.3%(+2.10)#15 | 4.9%(-0.443)#13,192 |
| 16. | 00925 | 4.3% | 2.3%(+1.93)#16 | 4.9%(-0.614)#13,783 |
| 17. | 00920 | 4.1% | 2.3%(+1.77)#17 | 4.9%(-0.776)#14,423 |
| 18. | 00918 | 4.0% | 2.3%(+1.69)#18 | 4.9%(-0.856)#14,716 |
| 19. | 00912 | 3.9% | 2.3%(+1.59)#19 | 4.9%(-0.953)#15,110 |
| 20. | 00778 | 3.6% | 2.3%(+1.27)#20 | 4.9%(-1.28)#16,267 |
| 21. | 00923 | 3.5% | 2.3%(+1.20)#21 | 4.9%(-1.35)#16,504 |
| 22. | 00784 | 3.5% | 2.3%(+1.14)#22 | 4.9%(-1.41)#16,746 |
| 23. | 00969 | 3.4% | 2.3%(+1.11)#23 | 4.9%(-1.44)#16,859 |
| 24. | 00907 | 3.4% | 2.3%(+1.11)#24 | 4.9%(-1.44)#16,861 |
| 25. | 00610 | 3.4% | 2.3%(+1.05)#25 | 4.9%(-1.49)#17,045 |
| 26. | 00791 | 3.4% | 2.3%(+1.04)#26 | 4.9%(-1.50)#17,086 |
| 27. | 00924 | 3.3% | 2.3%(+1.01)#27 | 4.9%(-1.54)#17,212 |
| 28. | 00926 | 3.3% | 2.3%(+1.00)#28 | 4.9%(-1.54)#17,215 |
| 29. | 00956 | 3.1% | 2.3%(+0.779)#29 | 4.9%(-1.77)#17,992 |
| 30. | 00959 | 3.1% | 2.3%(+0.765)#30 | 4.9%(-1.78)#18,038 |
| 31. | 00966 | 3.0% | 2.3%(+0.677)#31 | 4.9%(-1.87)#18,351 |
| 32. | 00739 | 3.0% | 2.3%(+0.674)#32 | 4.9%(-1.87)#18,366 |
| 33. | 00687 | 3.0% | 2.3%(+0.668)#33 | 4.9%(-1.88)#18,384 |
| 34. | 00719 | 2.9% | 2.3%(+0.574)#34 | 4.9%(-1.97)#18,700 |
| 35. | 00704 | 2.9% | 2.3%(+0.544)#35 | 4.9%(-2.00)#18,781 |
| 36. | 00745 | 2.9% | 2.3%(+0.531)#36 | 4.9%(-2.02)#18,836 |
| 37. | 00705 | 2.8% | 2.3%(+0.478)#37 | 4.9%(-2.07)#19,007 |
| 38. | 00961 | 2.8% | 2.3%(+0.467)#38 | 4.9%(-2.08)#19,043 |
| 39. | 00979 | 2.7% | 2.3%(+0.381)#39 | 4.9%(-2.17)#19,289 |
| 40. | 00921 | 2.6% | 2.3%(+0.283)#40 | 4.9%(-2.26)#19,630 |
| 41. | 00728 | 2.6% | 2.3%(+0.262)#41 | 4.9%(-2.28)#19,687 |
| 42. | 00771 | 2.6% | 2.3%(+0.230)#42 | 4.9%(-2.32)#19,803 |
| 43. | 00957 | 2.5% | 2.3%(+0.146)#43 | 4.9%(-2.40)#20,083 |
| 44. | 00794 | 2.4% | 2.3%(+0.113)#44 | 4.9%(-2.43)#20,182 |
| 45. | 00917 | 2.4% | 2.3%(+0.102)#45 | 4.9%(-2.45)#20,200 |
| 46. | 00653 | 2.4% | 2.3%(+0.079)#46 | 4.9%(-2.47)#20,266 |
| 47. | 00953 | 2.4% | 2.3%(+0.049)#47 | 4.9%(-2.50)#20,345 |
| 48. | 00656 | 2.3% | 2.3%(+0.013)#48 | 4.9%(-2.53)#20,446 |
| 49. | 00703 | 2.3% | 2.3%(-0.031)#49 | 4.9%(-2.58)#20,561 |
| 50. | 00716 | 2.3% | 2.3%(-0.066)#50 | 4.9%(-2.61)#20,663 |
| 51. | 00736 | 2.2% | 2.3%(-0.081)#51 | 4.9%(-2.63)#20,715 |
| 52. | 00677 | 2.2% | 2.3%(-0.088)#52 | 4.9%(-2.64)#20,729 |
| 53. | 00915 | 2.2% | 2.3%(-0.126)#53 | 4.9%(-2.67)#20,838 |
| 54. | 00682 | 2.1% | 2.3%(-0.221)#54 | 4.9%(-2.77)#21,085 |
| 55. | 00698 | 2.1% | 2.3%(-0.226)#55 | 4.9%(-2.77)#21,097 |
| 56. | 00637 | 2.1% | 2.3%(-0.239)#56 | 4.9%(-2.79)#21,130 |
| 57. | 00602 | 2.1% | 2.3%(-0.245)#57 | 4.9%(-2.79)#21,158 |
| 58. | 00976 | 2.1% | 2.3%(-0.260)#58 | 4.9%(-2.81)#21,197 |
| 59. | 00985 | 2.0% | 2.3%(-0.278)#59 | 4.9%(-2.83)#21,254 |
| 60. | 00692 | 2.0% | 2.3%(-0.283)#60 | 4.9%(-2.83)#21,260 |
| 61. | 00674 | 2.0% | 2.3%(-0.295)#61 | 4.9%(-2.84)#21,303 |
| 62. | 00738 | 2.0% | 2.3%(-0.297)#62 | 4.9%(-2.84)#21,311 |
| 63. | 00603 | 2.0% | 2.3%(-0.314)#63 | 4.9%(-2.86)#21,345 |
| 64. | 00641 | 1.9% | 2.3%(-0.396)#64 | 4.9%(-2.94)#21,553 |
| 65. | 00683 | 1.9% | 2.3%(-0.445)#65 | 4.9%(-2.99)#21,662 |
| 66. | 00983 | 1.9% | 2.3%(-0.446)#66 | 4.9%(-2.99)#21,665 |
| 67. | 00727 | 1.8% | 2.3%(-0.509)#67 | 4.9%(-3.06)#21,822 |
| 68. | 00725 | 1.7% | 2.3%(-0.600)#68 | 4.9%(-3.15)#22,024 |
| 69. | 00754 | 1.7% | 2.3%(-0.667)#69 | 4.9%(-3.21)#22,167 |
| 70. | 00730 | 1.6% | 2.3%(-0.745)#70 | 4.9%(-3.29)#22,348 |
| 71. | 00769 | 1.6% | 2.3%(-0.757)#71 | 4.9%(-3.30)#22,373 |
| 72. | 00780 | 1.6% | 2.3%(-0.774)#72 | 4.9%(-3.32)#22,403 |
| 73. | 00949 | 1.5% | 2.3%(-0.804)#73 | 4.9%(-3.35)#22,463 |
| 74. | 00646 | 1.5% | 2.3%(-0.819)#74 | 4.9%(-3.37)#22,488 |
| 75. | 00971 | 1.5% | 2.3%(-0.827)#75 | 4.9%(-3.37)#22,507 |
| 76. | 00616 | 1.5% | 2.3%(-0.839)#76 | 4.9%(-3.39)#22,529 |
| 77. | 00690 | 1.5% | 2.3%(-0.842)#77 | 4.9%(-3.39)#22,534 |
| 78. | 00720 | 1.5% | 2.3%(-0.873)#78 | 4.9%(-3.42)#22,588 |
| 79. | 00757 | 1.4% | 2.3%(-0.917)#79 | 4.9%(-3.46)#22,678 |
| 80. | 00606 | 1.4% | 2.3%(-0.930)#80 | 4.9%(-3.48)#22,701 |
| 81. | 00982 | 1.3% | 2.3%(-1.03)#81 | 4.9%(-3.58)#22,878 |
| 82. | 00782 | 1.2% | 2.3%(-1.13)#82 | 4.9%(-3.68)#23,051 |
| 83. | 00627 | 1.2% | 2.3%(-1.15)#83 | 4.9%(-3.70)#23,088 |
| 84. | 00612 | 1.2% | 2.3%(-1.16)#84 | 4.9%(-3.71)#23,103 |
| 85. | 00795 | 1.2% | 2.3%(-1.17)#85 | 4.9%(-3.72)#23,115 |
| 86. | 00659 | 1.1% | 2.3%(-1.23)#86 | 4.9%(-3.78)#23,233 |
| 87. | 00772 | 1.0% | 2.3%(-1.28)#87 | 4.9%(-3.82)#23,303 |
| 88. | 00962 | 1.0% | 2.3%(-1.29)#88 | 4.9%(-3.84)#23,327 |
| 89. | 00685 | 1.0% | 2.3%(-1.30)#89 | 4.9%(-3.85)#23,349 |
| 90. | 00693 | 1.0% | 2.3%(-1.32)#90 | 4.9%(-3.86)#23,376 |
| 91. | 00676 | 0.98% | 2.3%(-1.34)#91 | 4.9%(-3.89)#23,422 |
| 92. | 00729 | 0.97% | 2.3%(-1.35)#92 | 4.9%(-3.90)#23,430 |
| 93. | 00638 | 0.97% | 2.3%(-1.36)#93 | 4.9%(-3.90)#23,440 |
| 94. | 00660 | 0.93% | 2.3%(-1.39)#94 | 4.9%(-3.94)#23,503 |
| 95. | 00669 | 0.90% | 2.3%(-1.42)#95 | 4.9%(-3.97)#23,544 |
| 96. | 00662 | 0.85% | 2.3%(-1.48)#96 | 4.9%(-4.02)#23,631 |
| 97. | 00773 | 0.82% | 2.3%(-1.51)#97 | 4.9%(-4.05)#23,664 |
| 98. | 00670 | 0.82% | 2.3%(-1.51)#98 | 4.9%(-4.06)#23,675 |
| 99. | 00601 | 0.80% | 2.3%(-1.52)#99 | 4.9%(-4.07)#23,686 |
| 100. | 00731 | 0.77% | 2.3%(-1.56)#100 | 4.9%(-4.11)#23,737 |
1
2Common Questions
What are the Top 10 Zip Codes with the Highest Percentage of Population with a Degree in Liberal Arts and History in Puerto Rico?
Top 10 Zip Codes with the Highest Percentage of Population with a Degree in Liberal Arts and History in Puerto Rico are:
What zip code has the Highest Percentage of Population with a Degree in Liberal Arts and History in Puerto Rico?
00906 has the Highest Percentage of Population with a Degree in Liberal Arts and History in Puerto Rico with 22.2%.
What is the Percentage of Population with a Degree in Liberal Arts and History in the State of Puerto Rico?
Percentage of Population with a Degree in Liberal Arts and History in Puerto Rico is 2.3%.
What is the Percentage of Population with a Degree in Liberal Arts and History in the United States?
Percentage of Population with a Degree in Liberal Arts and History in the United States is 4.9%.